1. Introduction
Rainfall as part of precipitation is a key component of the hydrological cycle, having abrupt spatial and temporal variations. An accurate knowledge of the amount of regional rainfall is essential for the welfare of society. Rainfall, especially during rainstorms, also has a direct impact on human life in terms of damage. Significant losses are caused by heavy rain events and flash floods. To improve weather and climate predictions, accurate and spatially complete rainfall records are necessary. Rain gauge data are available over land only, mainly in densely populated areas, and they cannot capture the strong spatial variations of rainfall since they provide only point measurements.
With the advent of geostationary weather satellites in the 1960s and 70s, various techniques have been developed to estimate rainfall from visible and infrared (IR) radiation upwelling from the Earth into space. The geostationary weather satellite instrumentation ensures the rapid temporal update cycle necessary to capture the growth and decay of precipitating clouds. Operational applications, however, require quantitative rainfall determination from a variety of precipitating systems, which differ both dynamically and microphysically. This fact prompts for non-unique solutions based on the physics of precipitation formation processes [
1]. The operational geostationary satellites, and more specifically the Meteosat second generation (MSG) satellites, are highly suitable for weather monitoring over Europe and Africa because of their viewing position. Additionally, the high temporal and spatial resolution of the MSG in the visible (VIS) and infrared (IR) wavelength regions allows for the capture of the growth and the microstructure of precipitating clouds.
The use of satellite rainfall estimates is advantageous because they are able to provide information for locations where ground-based observations do not exist. However, in general, the satellite estimates contain bias, since they are produced by algorithms that transform the sensor’s response into rainfall values. Especially during the last two decades, numerous techniques have been proposed for rain estimation using geostationary satellite data, but they differ significantly in the channels used, the implemented statistical approaches, and the study domain for which they operate, thus leading to results with different accuracy [
2,
3,
4,
5,
6].
These proceedings provide the preliminary results of the first attempt to quantitatively evaluate an existing satellite-based rain estimation algorithm using a network of ground-based meteorological stations in an area with complex terrain and high rainfall amounts of a convective nature. In
Section 2, a brief description of the study domain, the data used, and the methodologies is provided.
Section 3 includes the discussion of the obtained results, while conclusions are drawn in the last section.
2. Data and Methods
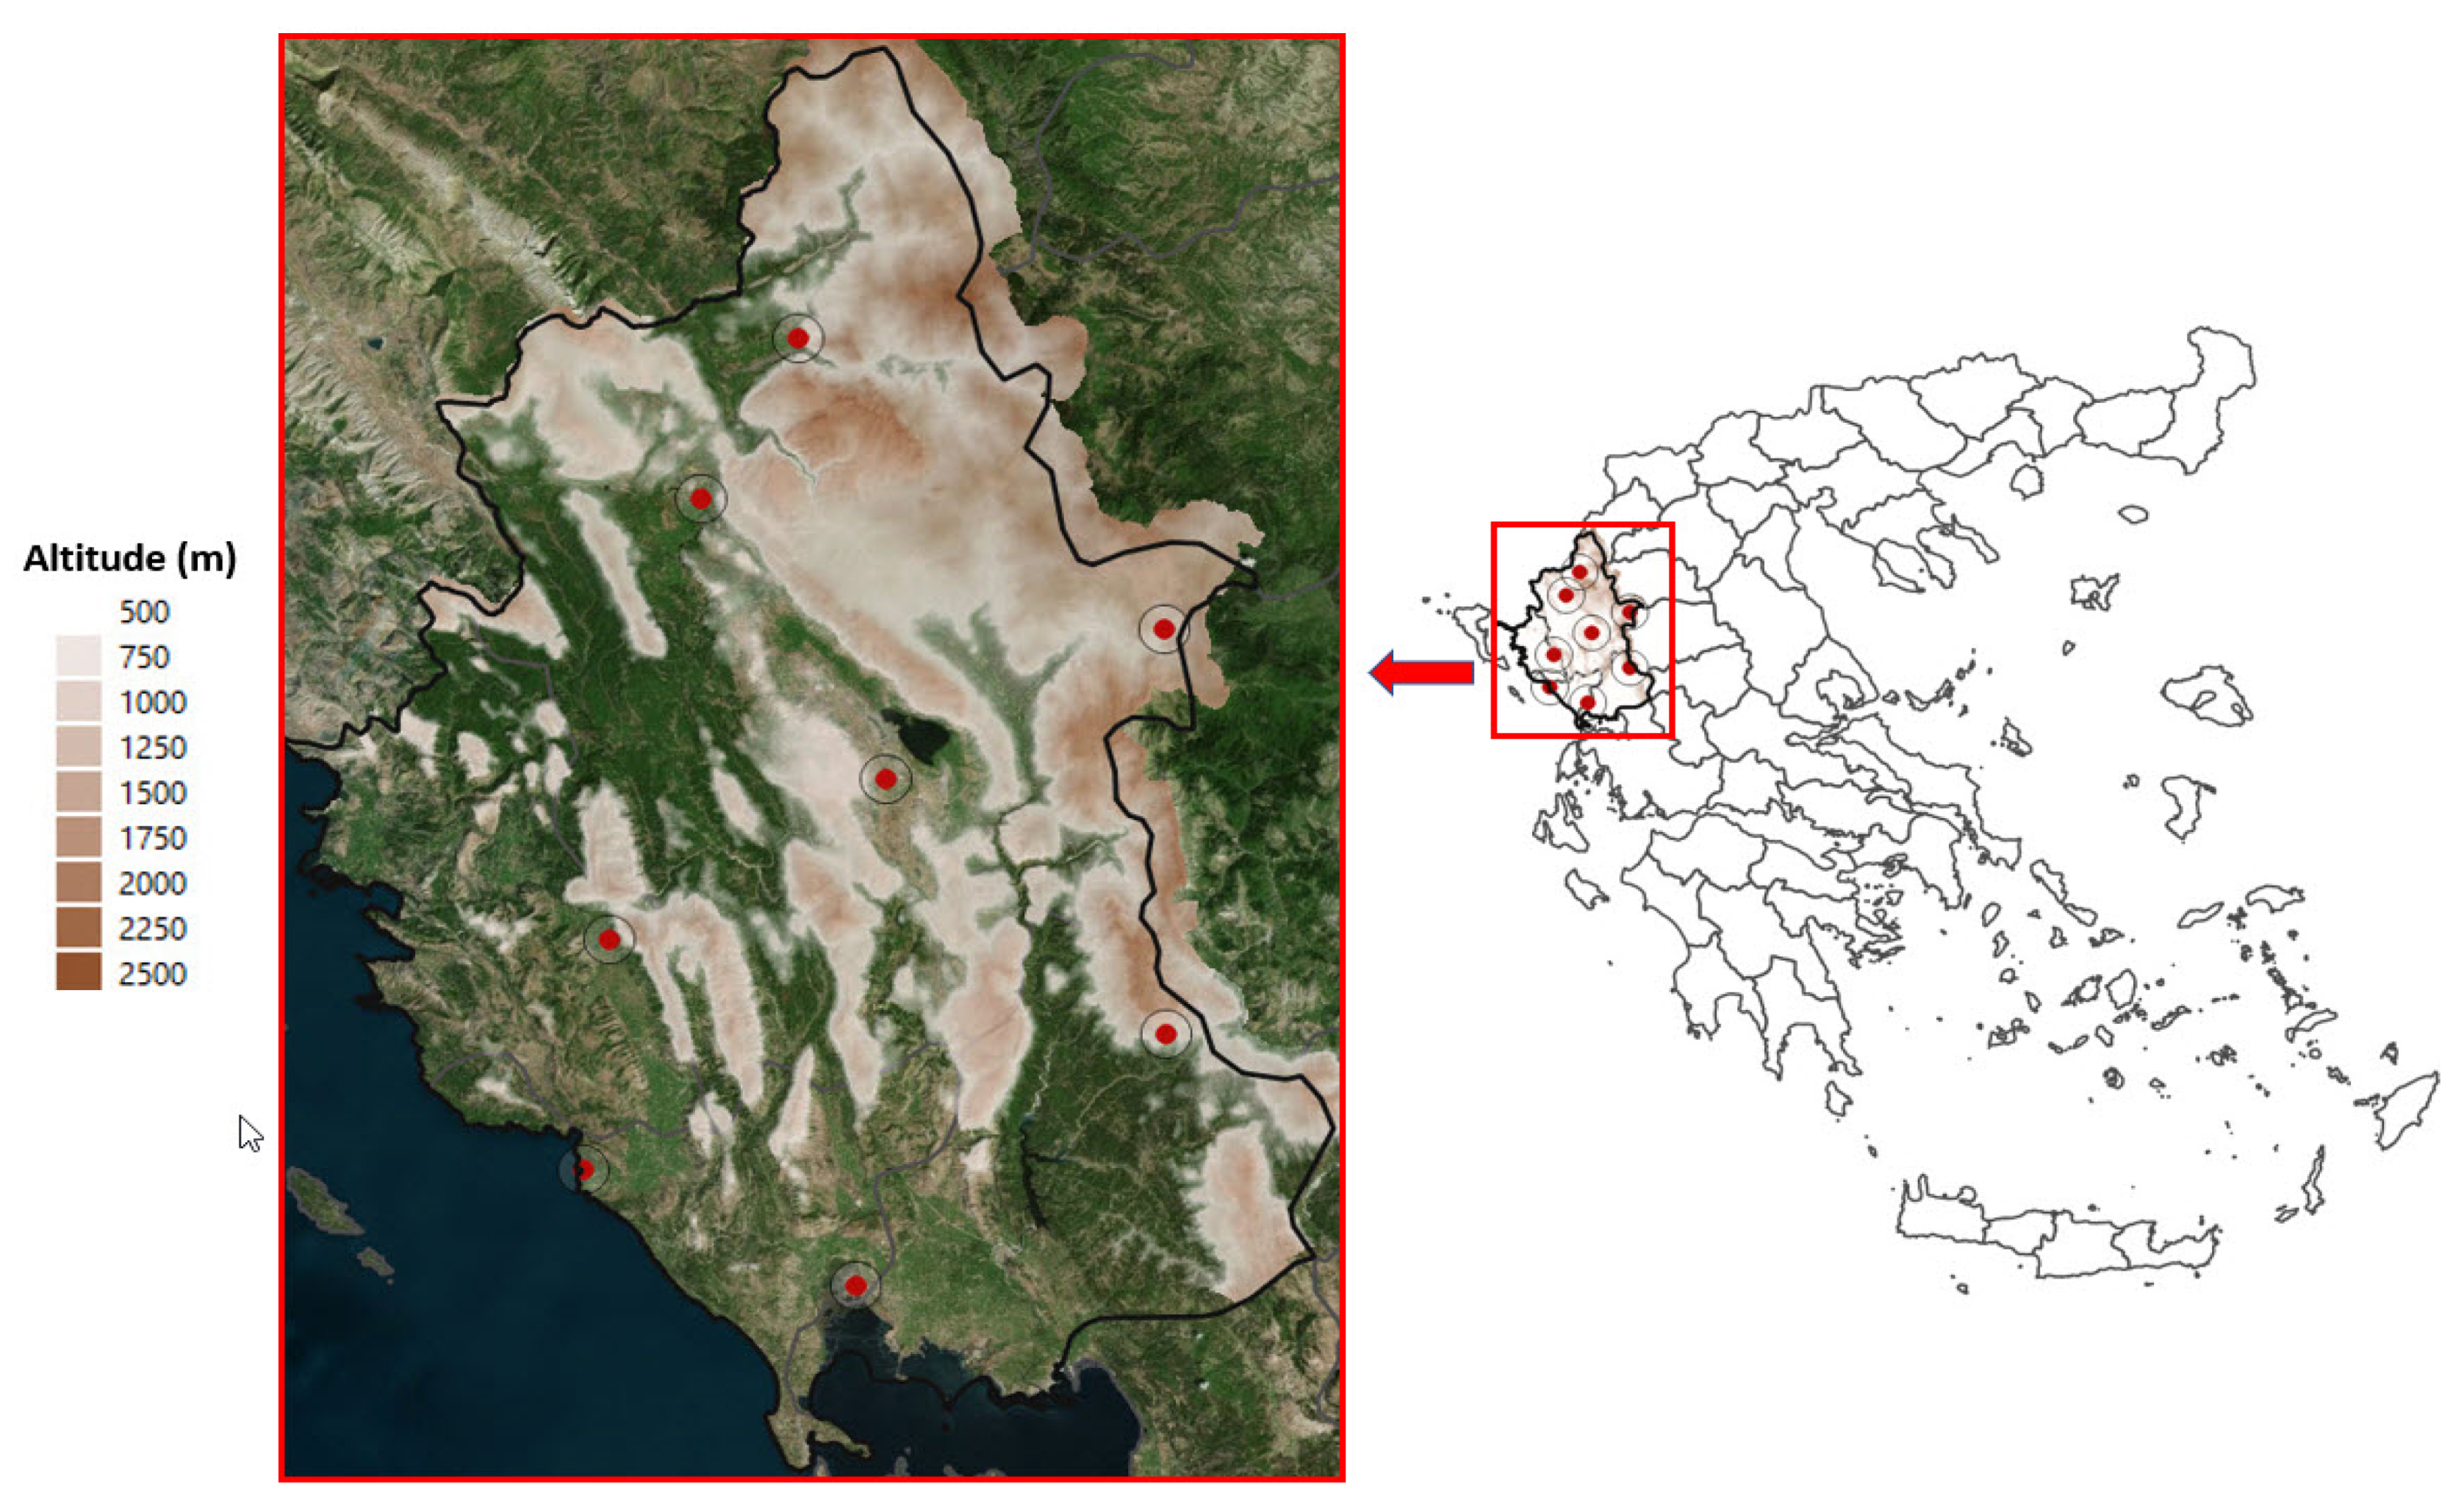
For the needs of the study, namely the validation of the satellite algorithm, measurements from eight different meteorological stations, spread across the whole Epirus region (Greece), were used (
Figure 1). The meteorological stations provided measurements for the rainfall every 30 min [
7,
8].
The rain algorithm made use of Meteosat satellite data. More specifically, images from the spinning enhanced visible and infrared imager (SEVIRI) satellite instrument on board the Meteosat satellite platform available at four channels (
Table 1) were used in the rain algorithm. This algorithm is part of an automated satellite-based and autonomous system [
9] that exclusively uses five SEVIRI (Spinning Enhanced Visible and InfraRed Imager) channels in order to detect and nowcast mainly cloud convection. This system has been extended to provide dust estimates [
10], while, in the present study, it was further extended to provide rain estimations whose accuracy was evaluated. The rain rate was estimated by the satellite algorithm every 15 min.
Regarding the procedure of the rain estimation by the algorithm, firstly, a cloud mask was applied on the SEVIRI multispectral data in order to characterize a specific pixel as rainy/not rainy. More specifically, if, for a pixel, (i) the brightness temperature (BT) in the channel of 10.8μm (BT10.8μm) was lower than 250 K, (ii) the brightness temperature difference (BTD) between the channels 6.2 μm and 7.3μm (BTD6.2μm-7.3μm) was larger than -20 K, and (iii) the temperature difference between the channels 10.8 μm and 12.0 μm (BTD10.8μm-12.0μm) was smaller than 3 K, then a rain rate (mm/hr) estimate was assigned to this pixel. Otherwise, the pixel was considered to be not rainy. It was mentioned that, subsequently, the rain estimate was performed by a non-linear (exponential) model, having as an independent variable the BT10.8μm.
Finally, an automated procedure was followed that spatiotemporally correlated the two different datasets. Every 30 min, the total satellite-based rainfall estimations (on a pixel basis) were correlated with the relative (in time and space) half-hourly rainfall measurements. This procedure was developed and applied for 20 selected rainy days of the year 2019, during which significant amounts of rainfall were recorded from the network of the eight ground-based meteorological stations. As a result of this procedure, a final dataset of 1323 pairs of values in total was created (satellite-based rain estimates and rainfall measurements from the network of the meteorological stations). In the following, two different categories of statistics were calculated for the evaluation of the rain algorithm: error statistics (
Table 2) and statistical scores based on a 2 × 2 contingency table (
Table 3).
3. Results
In the first part of the analysis, the statistical metrics of the mean error (ME), the mean absolute error (MAE), the root mean square error, and the Pearson correlation coefficient were calculated using the equations of
Table 2, where the computed values are also listed. In the equations of
Table 2, the term
is the rain rate calculated from the meteorological stations,
is the rain rate estimated from the satellite-based rain algorithm, and n is the total number of utilized values.
It should be mentioned that the calculation of the statistics in
Table 2 were made only for pairs with
values larger than 0.5 mm/hr. This choice was made because it is crucial to evaluate the accuracy of the rain algorithm exclusively in cases for which notable rainfall occurred.
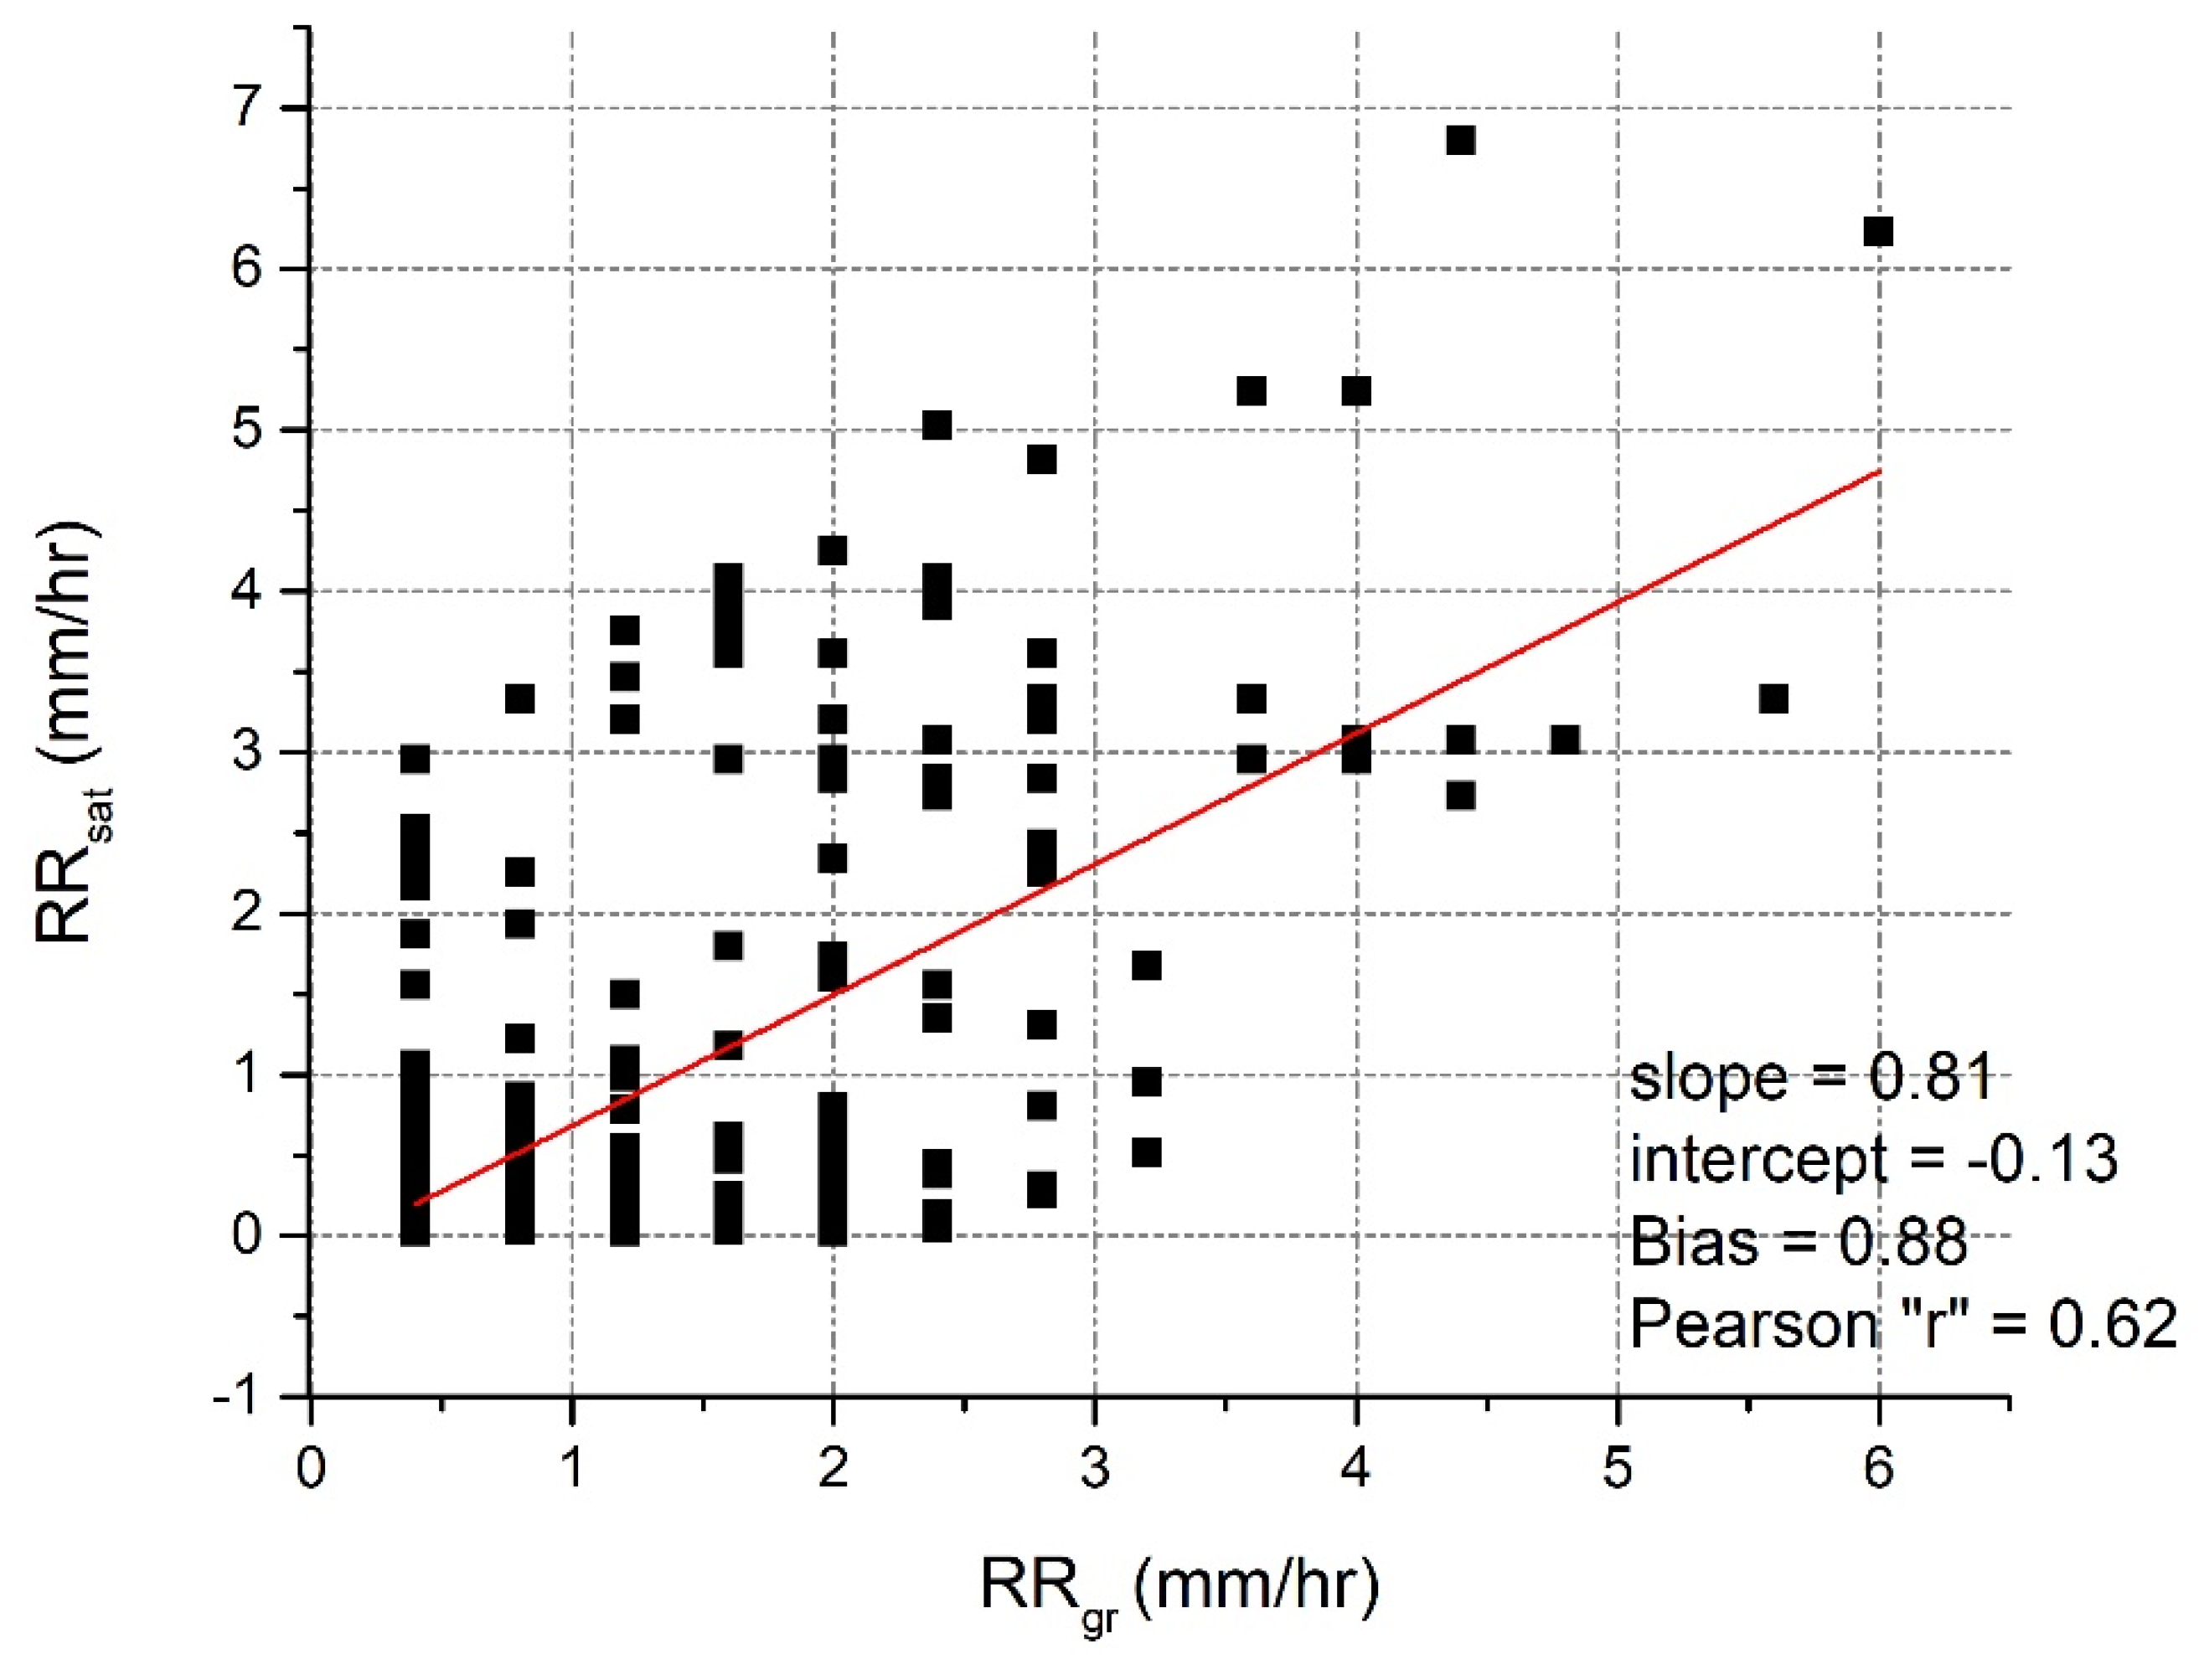
Figure 2 displays the scatterplot between the ground-based measurements and the satellite-based estimates of rain rates, with an overall satisfactory correlation coefficient (0.62).
In the second part of the evaluation, the statistical scores listed in
Table 3 were calculated using Equations (1)–(3). Such statistical scores are widely used to highlight the differences between the mean of the forecasts and the mean of the observations [
11]. More specifically, the POD stands for the probability of detection, FAR stands for the false alarm ratio, POFD stands for probability of false detection, and BS stands for the overall (systematic) bias. The symbols H (hit), M (miss), CN (correct negative), and FA (false alarm) are parameters that are presented in
Table 3. From a practical standpoint, H refers to the number of correct rain estimates (measurements and estimates were found as rainy), FA refers to the total number of satellite-estimated pixel values that were wrongly assigned with a value larger than zero (rain) while the relative real measurements were zero (no rain), M refers to the observed rainy values that were wrongly estimated as not-rainy, and finally, CN refers to the total number of paired values that both (satellite and ground) do not belong to the rainy ones (no rain values for both of the measurements and estimates). Ιn this type of statistics, the whole dataset (1323 paired values) was used, because the nature of these statistical metrics included the cases where either the rain gauge measurement or the correlated satellite estimate had a zero rain value. The computed probability of false detection, probability of detection, and the bias score were equal to 0.22, 0.69, and 0.88, respectively, indicating a relatively good performance of the rain satellite algorithm.
4. Discussion
The first results of the evaluation of rain estimates obtained with a satellite-based algorithm, using exclusively the 10.8 μm channel of Meteosat-11, against ground-based measurements showed a satisfactory agreement and good performance of the algorithm. This was highlighted by the computed statistical metrics, revealing an ME value equal to 0.22 mm/h (14% error with respect to the mean value of station recordings), which indicates a slight underestimation. The MAE of 1.57 mm/h denotes a satisfactory accuracy, taking into account the completely different nature of the two compared datasets. Indeed, the spatial resolution of Meteosat-11, which had a spatial resolution of about 4x4 km2 across the study domain, cannot capture any local spatial variations of the actual rain rate occurring in a spatial scale finer than its pixel resolution. Nevertheless, the first results are promising. The computed RMSE error equal to 2.36 mm/h suggests that there are not significant differences between the compared pairs of values, while the correlation coefficient of 0.62 highlights a satisfactory covariance between the real measurements and their relative estimates.
These conclusions and promising results concerning the rain satellite algorithm are corroborated by the additionally computed statistical scores. The computed probability of false detection was found equal to 0.22, meaning that only 22% of the total number of the paired values were classified wrongly (cases where the algorithm estimated rain, while the meteorological stations did not record rain). The probability of detection highlighted a 69% chance for a right satellite estimation (cases where the algorithm estimated rain and the meteorological stations recorded rain), while the bias score was 0.88, confirming that the estimations are very close to the observations in the majority of the examined cases.
5. Conclusions
This study presented the results of a preliminary quantitative evaluation of a satellite-based rain estimation algorithm using measurements from a network of ground-based meteorological stations. The study domain was the Epirus region (Greece), which is one of the rainiest areas of Greece, with a complex relief and where a network of eight meteorological stations distributed across the study area are available. The undertaken statistical analysis led to satisfactory results, which highlights the promising performance of the satellite-based rain estimation using Meteosat data.
The automatic and reliable rain rate estimation with an algorithm using exclusively images from the Meteosat satellites can be useful and can support both operational and research activities aimed at the real-time monitoring and nowcasting (very short-range forecasting) of rain, providing modern and useful services to final users and the wide public.
Further improvements, including updating the existing statistical scheme for making estimates by using multispectral information and developing sophisticated decision trees in the estimation procedure, are the objective of ongoing work, with a main aim to optimize these encouraging preliminary results. Additionally, the use of a sample of paired values larger than the one utilized here will be considered in relevant future work.
Author Contributions
Conceptualization, N.H. and S.K.; methodology, S.K.; software, S.K.; validation, S.K., C.J.L. and N.H.; formal analysis, S.K.; investigation, S.K.; resources, S.K, N.H. and C.J.L.; data curation, S.K. and C.J.L.; writing—original draft preparation, S.K.; writing—review and editing, N.H, S.K. and C.J.L.; visualization, S.K.; supervision, N.H.; project administration, N.H.; funding acquisition, N.H. All authors have read and agreed to the published version of the manuscript. Please turn to the CRediT taxonomy for the explanation of terms.
Funding
This research was funded by the European Regional Development Fund (ERDF), through the Structural Funds and Cohesion Fund 2014–2020, Operational Program “Epirus”, Priority Axis “Strengthening Regional Competitiveness by Developing Innovation and ICT”, title: “Development and Use of Digital Systems, Products and Services by the Local Authorities” and specific title: “Online Platform for Automatic Information of the Public and Local Authorities for Possible Occurrence of Severe Weather Phenomena in Epirus Prefecture, Greece,” grant number 82740.
Institutional Review Board Statement
Not applicable.
Informed Consent Statement
Not applicable.
Data Availability Statement
The data presented in this study are available on request from the corresponding author.
Conflicts of Interest
The authors declare no conflict of interest. The funders had no role in the design of the study; in the collection, analyses, or interpretation of data; in the writing of the manuscript; or in the decision to publish the results.
References
- Levizzani, V.; Amorati, R.; Meneguzzo, F. A Review of Satellite-based Rainfall Estimation Methods. In MUSIC—MUltiple-Sensor Precipitation Measurements, Integration, Calibration and Flood Forecasting, 2002; Deliverable 6.1. MUSIC—EVK1-CT-2000-00058; Bologna, Italy, 2002. [Google Scholar]
- Levizanni, V.; Schmetz, J.; Lutz, H.L.; Kerkmann, J.; Alberoni, P.P.; Cervino, M. Precipitation estimations from geostationary orbit and prospects for METEOSAT Second Generation. Meteorol. Appl. 2001, 8, 23–41. [Google Scholar] [CrossRef]
- Sehad, M.; Ameur, S. A multilayer perceptron and multiclass support vector machine based high accuracy technique for daily rainfall estimation from MSG SEVIRI data. Adv. Space Res. 2020, 66, 1250–1262. [Google Scholar] [CrossRef]
- Lazri, M.; Labadi, K.; Brucker, J.M.; Ameur, S. 2020.Improving satellite rainfall estimation from MSG data in Northern Algeria by using a multi-classifier model based on machine learning. J. Hydrol. 2020, 584. [Google Scholar] [CrossRef]
- Bouaita, B.; Moussaoui, A.; Bachari, N.E.I. Rainfall estimation from MSG images using fuzzy association rules. J. Intell. Fuzzy Syst. 2019, 37, 1357–1369. [Google Scholar] [CrossRef]
- Tapiador, F.J.; Marcos, C.; Sancho, M.J. The Convective Rainfall Rate from Cloud Physical Properties Algorithm for Meteosat Second-Generation Satellites: Microphysical Basis and Intercomparisons using an Object-Based Method. Remote Sens. 2019, 11, 527. [Google Scholar] [CrossRef]
- Bartzokas, A.; Kotroni, V.; Lagouvardos, K.; Lolis, C.J.; Gkikas, A.; Tsirogianni, M.I. Weather forecast in north-western Greece: RISKMED warnings and verification of MM5 model. Nat. Hazards Earth Syst. Sci. 2010, 10, 383–394. [Google Scholar] [CrossRef][Green Version]
- Christofilakis, V.; Tatsis, G.; Votis, C.T.; Chronopoulos, S.K.; Kostarakis, P.; Lolis, C.J.; Bartzokas, A. Rainfall Measurements Due to Radio Frequency Signal Attenuation at 2 GHz. J. Signal Inf. Proc. 2018, 9, 192–201. [Google Scholar]
- Kolios, S.; Hatzianastassiou, N. Quantitative Aerosol Optical Depth detection during dust outbreaks from Meteosat imagery using an Artificial Neural Network model. Remote Sens. 2019, 11, 1022. [Google Scholar] [CrossRef]
- Kolios, S. Study of Mesoscale Cloud System Oscillations Capable of Producing Convective Gravity Waves. Climate 2018, 6, 25. [Google Scholar] [CrossRef]
- Wilks. Statistical Methods in the Atmospheric Sciences, 4th ed.; Elsevier Publishing: Amsterdam, The Netherlands, 2019; ISBN 9780128158234. [Google Scholar]
| Publisher’s Note: MDPI stays neutral with regard to jurisdictional claims in published maps and institutional affiliations. |
© 2020 by the authors. Licensee MDPI, Basel, Switzerland. This article is an open access article distributed under the terms and conditions of the Creative Commons Attribution (CC BY) license (https://creativecommons.org/licenses/by/4.0/).


