Article

Chemical Characterization of Particulate Matter in the Renaissance City of Ferrara

1
Department of Physics and Earth Sciences, University of Ferrara, via Saragat 1, 44121 Ferrara, Italy
2
ENEA, Fusion and Technology for Nuclear Safety and Security Department—Nuclear Safety, Security and Sustainability Division, via Martiri di Monte Sole 4, 40129 Bologna, Italy
*
Author to whom correspondence should be addressed.
Geosciences 2021, 11(6), 227; https://doi.org/10.3390/geosciences11060227
Submission received: 15 April 2021 / Revised: 17 May 2021 / Accepted: 21 May 2021 / Published: 24 May 2021
(This article belongs to the Special Issue Natural and Environmental Hazards of Cultural Heritage)

Abstract

:
Atmospheric aerosols are today a key issue in air pollution, mostly related to public health. Two test areas in Ferrara, one in the city center (urban location) and one in the industrial area (industrial location), were studied in June–July 2016 using the SEM technique to identify the environmental impact of some potential pollutant sources. Collection was performed using adhesive tapes applied on the surface of road signs, which allows to select particulate matter moving on air with diffusion movement and to exclude the particles usually deposed by the gravitational process. Dimensional characterization has shown that, usually, smaller particles tend to aggregate themselves in bigger polycrystalline particles with the geometric diameter of up to 10 μm. Micro-analytical data have revealed a wide heterogeneous range of compositions: more abundant silicate followed by carbonate, chlorine, sulphate, carbon, and organic. This preliminary study has highlighted that the Renaissance city of Ferrara is affected by an environmental problem linked to the presence of particulate matter induced by industrial activities, as is the case with some of the most polluted cities in the world. The observations and analytical data pointed out the need for further investigation to better define the features of the fine particulate matter. This will be useful to preserve the cultural heritage of this Medieval-Renaissance city.

1. Introduction

In 1999, the European Community established limit values for airborne particulate matter (PM) in urban air related to its size with the 99/30/EC Directive [1]. For this reason, the Member States were encouraged to prepare action plans and strategies to abate the high concentration of particulate matter through physical and chemical characterization of the PM10 fraction (the fraction of aerosol particles with the aerodynamic diameter less than 10 μm) and PM2.5 fraction (the fraction of aerosol particles with the aerodynamic diameter less than 2.5 μm). Therefore, in the last decades, atmospheric particulate matter has been subject to many studies, most of them with chemical scope [2,3,4].
The high presence of particulate matter in the atmosphere has not only produced effects on human health [5,6,7,8,9] but it also might have caused the deterioration of monuments [10,11]. Environmental studies have shown that these negative effects could be related to the size and chemical composition of airborne particulates [12,13]. In addition, it is important to take in consideration that human activity, such as industry, fuel combustion, and agriculture, would increase the concentrations of some contaminants, which could be related to the causes of deterioration [14].
Generally, the aerosol in urban areas was made from a mixture of primary particles emitted from several sources, which could be anthropogenic and/or natural. The major elements in the aerosol may result from crustal origin from re-suspended dust [15,16] or from industrial activities [17,18]; for example fuel oil, cement and ceramic industries [19,20], coal combustion processes [21], products of refuse incineration [22,23], or traffic pollutants from vehicle exhausts [24,25], motor oil [26], tire and brake abrasion [27], or wood burning processes for domestic and commercial purposes [28,29]. Knowing the chemical composition of the analyzed particles could allow to recognize the sources of the pollutants and to implement mitigation plans in the areas most subject to pollution. In many cities around the world, airborne particulate pollution has created serious damage to monuments and cultural heritage sites [30,31,32], and, if not promptly acted upon, fractures, black crusts, and other important deteriorations could be created on the surface of the buildings.
As far as urban aerosols are concerned [33], characterization by size is continuously analyzed through cascade impactors, drum samplers, and so on [34,35]; however, the composition of the variety of the particles is a bit difficult, which has subsequently led to an insufficient environmental dataset on the effect of different components on cultural heritage sites.
Many plausible mechanisms have been proposed to explain the effect of particulate matter on historical buildings, including chemical composition of the particles. In addition, PM acts as a vehicle for the atmospheric transport of organic substances or metallic composts adsorbed on their surface [36,37,38,39]. Accordingly, the ability of atmospheric particulate matter to transport foreign substances could be the cause of the deterioration of the monuments and of the cultural heritage sites [40,41,42]. The walls and facades of important buildings and historical monuments become dirty due to the presence of metal particles and/or oxides that could create black crusts on the surfaces of the buildings [43,44,45], which require human intervention to be removed.
The actual legislation is limited in specifying a certain mass of particles per cubic centimeter [46,47], irrespective of their size and composition. This is particularly unsatisfactory since smaller particles (≤1 μm) are believed to be more relevant in regard to damaging cultural heritage sites [48,49], compared with bigger ones. Moreover, certain types of aerosol particles are more chemically active than others [50,51].
It is also important to better understand the physical and chemical nature of ambient aerosols and the processes responsible for their formation and diffusion: aerosol particles are commonly modelled as spheres to make straightforward calculations of their geometrical properties and physical behavior. However, particles collected on filters, used for sampling urban air, display a very large number of shapes and sizes [52,53,54]. Disregarding this variety might result in not adequately considering the effects of processes such as the absorption of volatile molecules of pollutants and water, chemical reactivity, and gravitational settling. Even though there are studies that individually characterize PM, not enough attention is commonly given to their morphometric features.
The aim of this study is to define the chemical composition and morphological features of the total particulate matter collected with a non-conventional passive method in the city of Ferrara, in order to highlight the possible existing differences (compositional and temporal) between the urban location and the industrial ones. This information could be crucial in better understanding the possible relationship between particulate matter pollution and the damage made to the cultural heritage site in the historical center of the city of Ferrara.

2. Materials and Methods

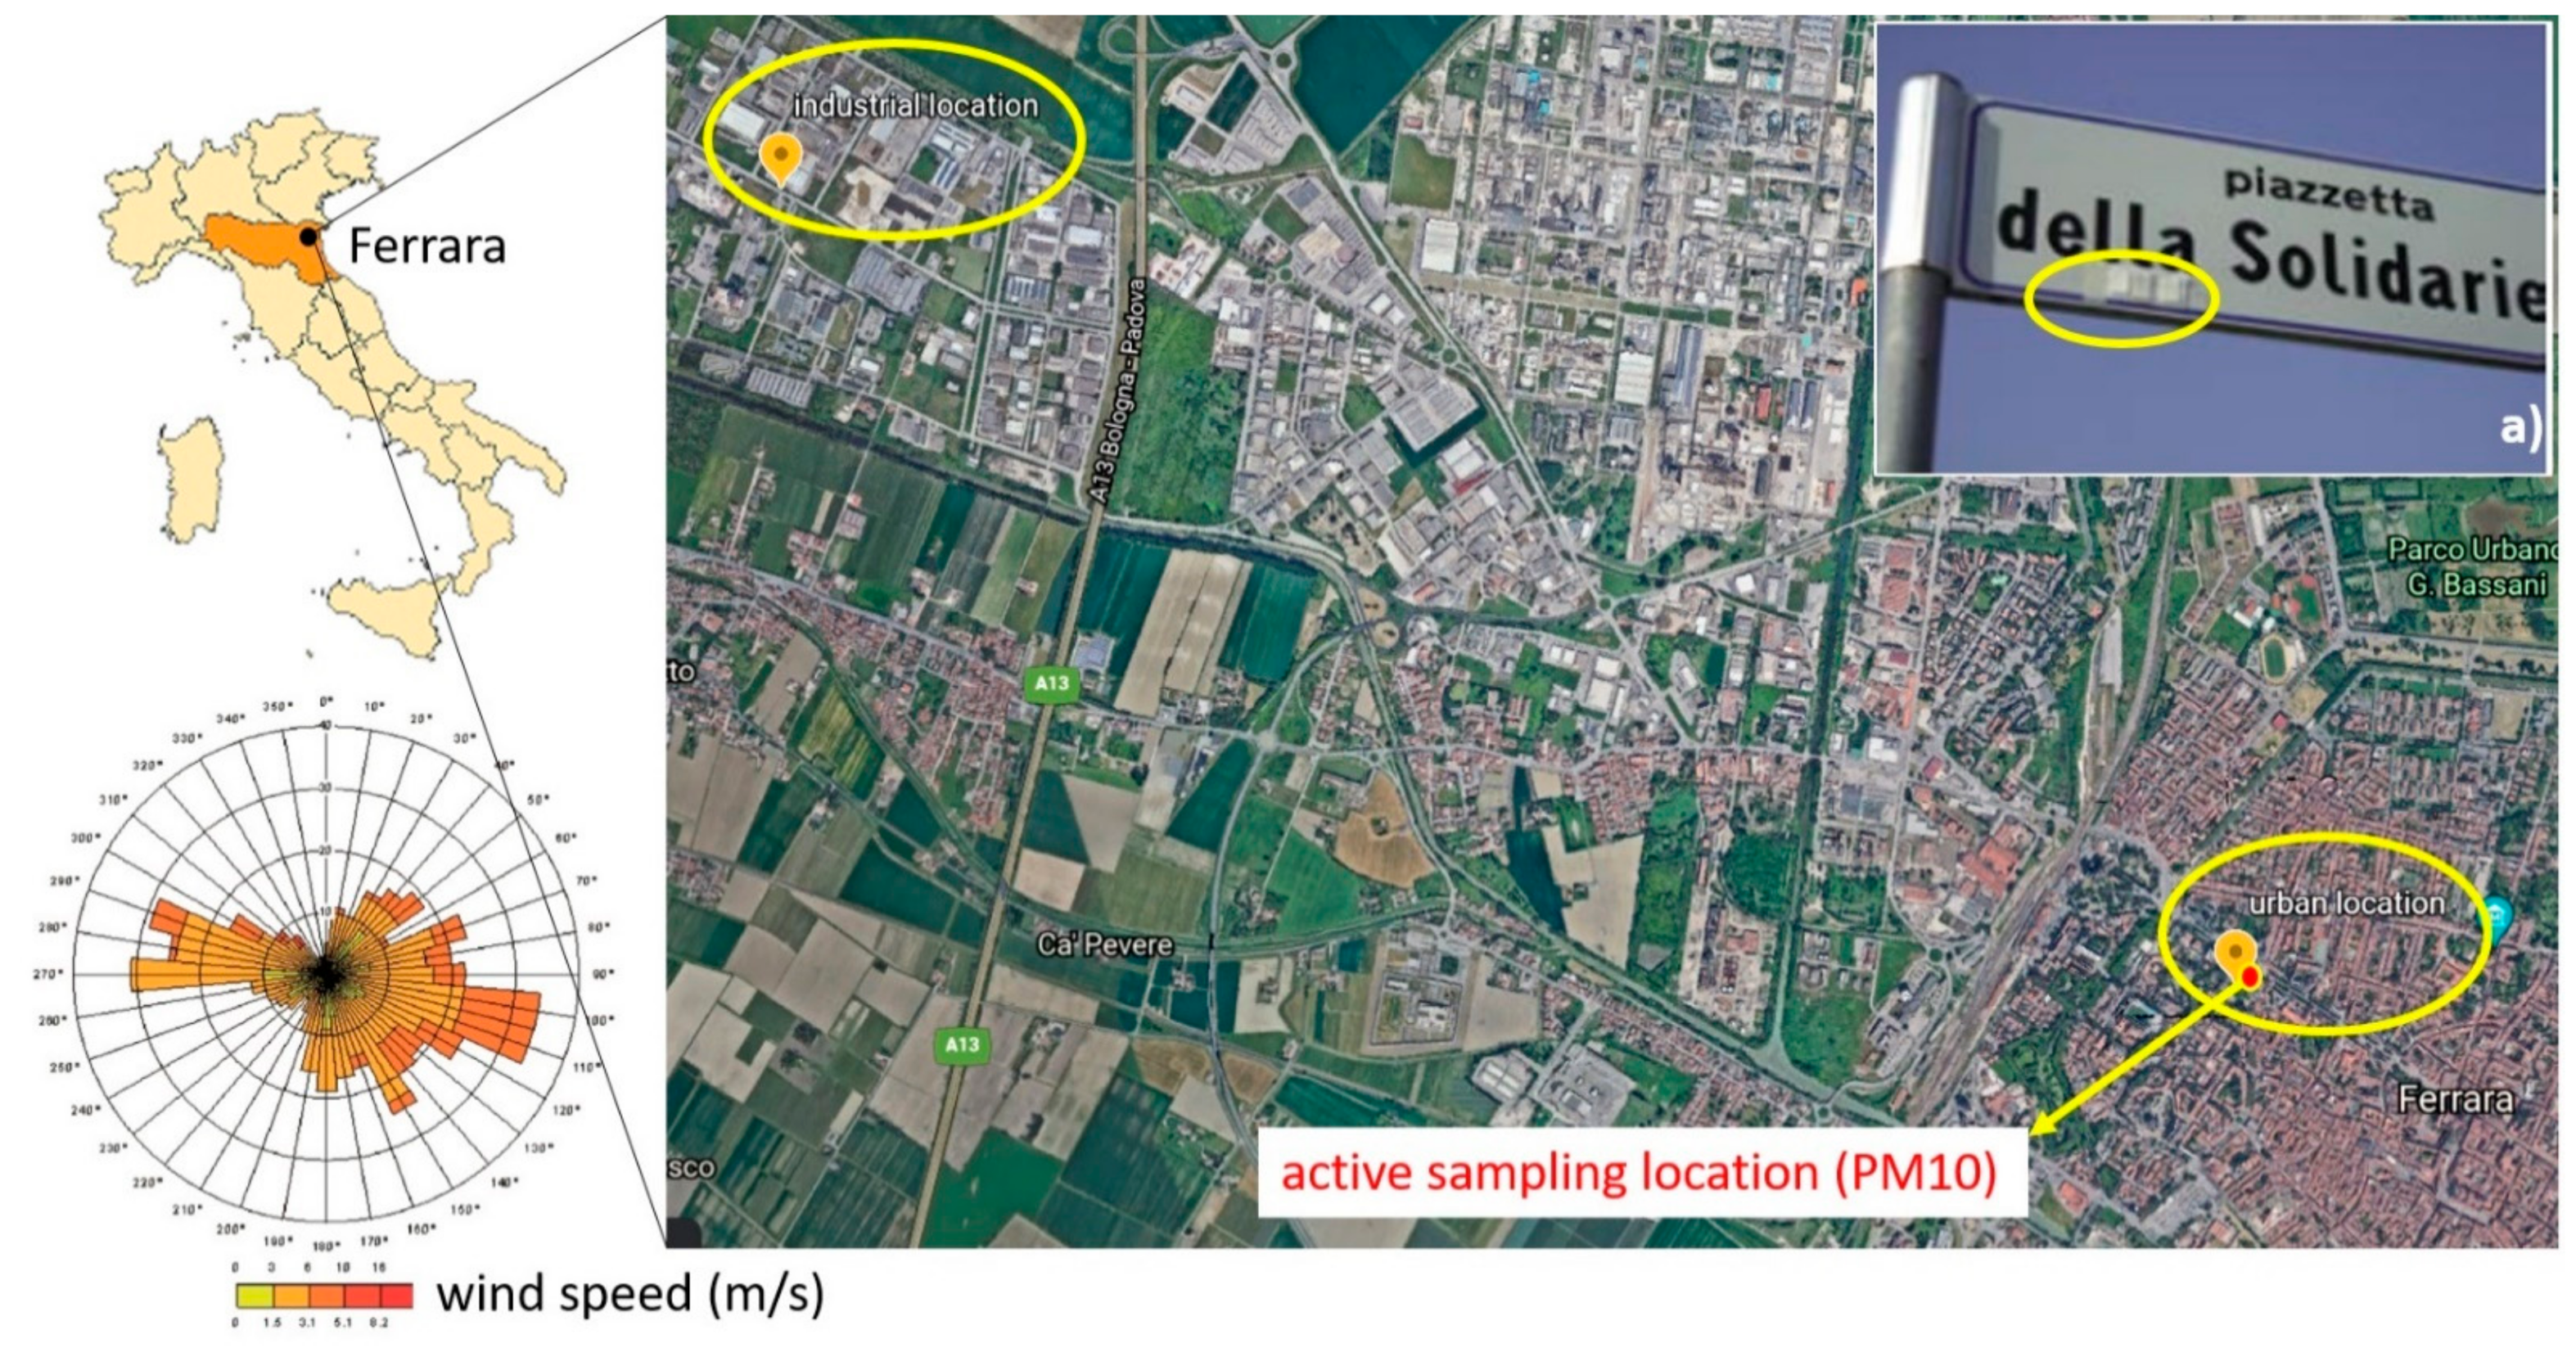
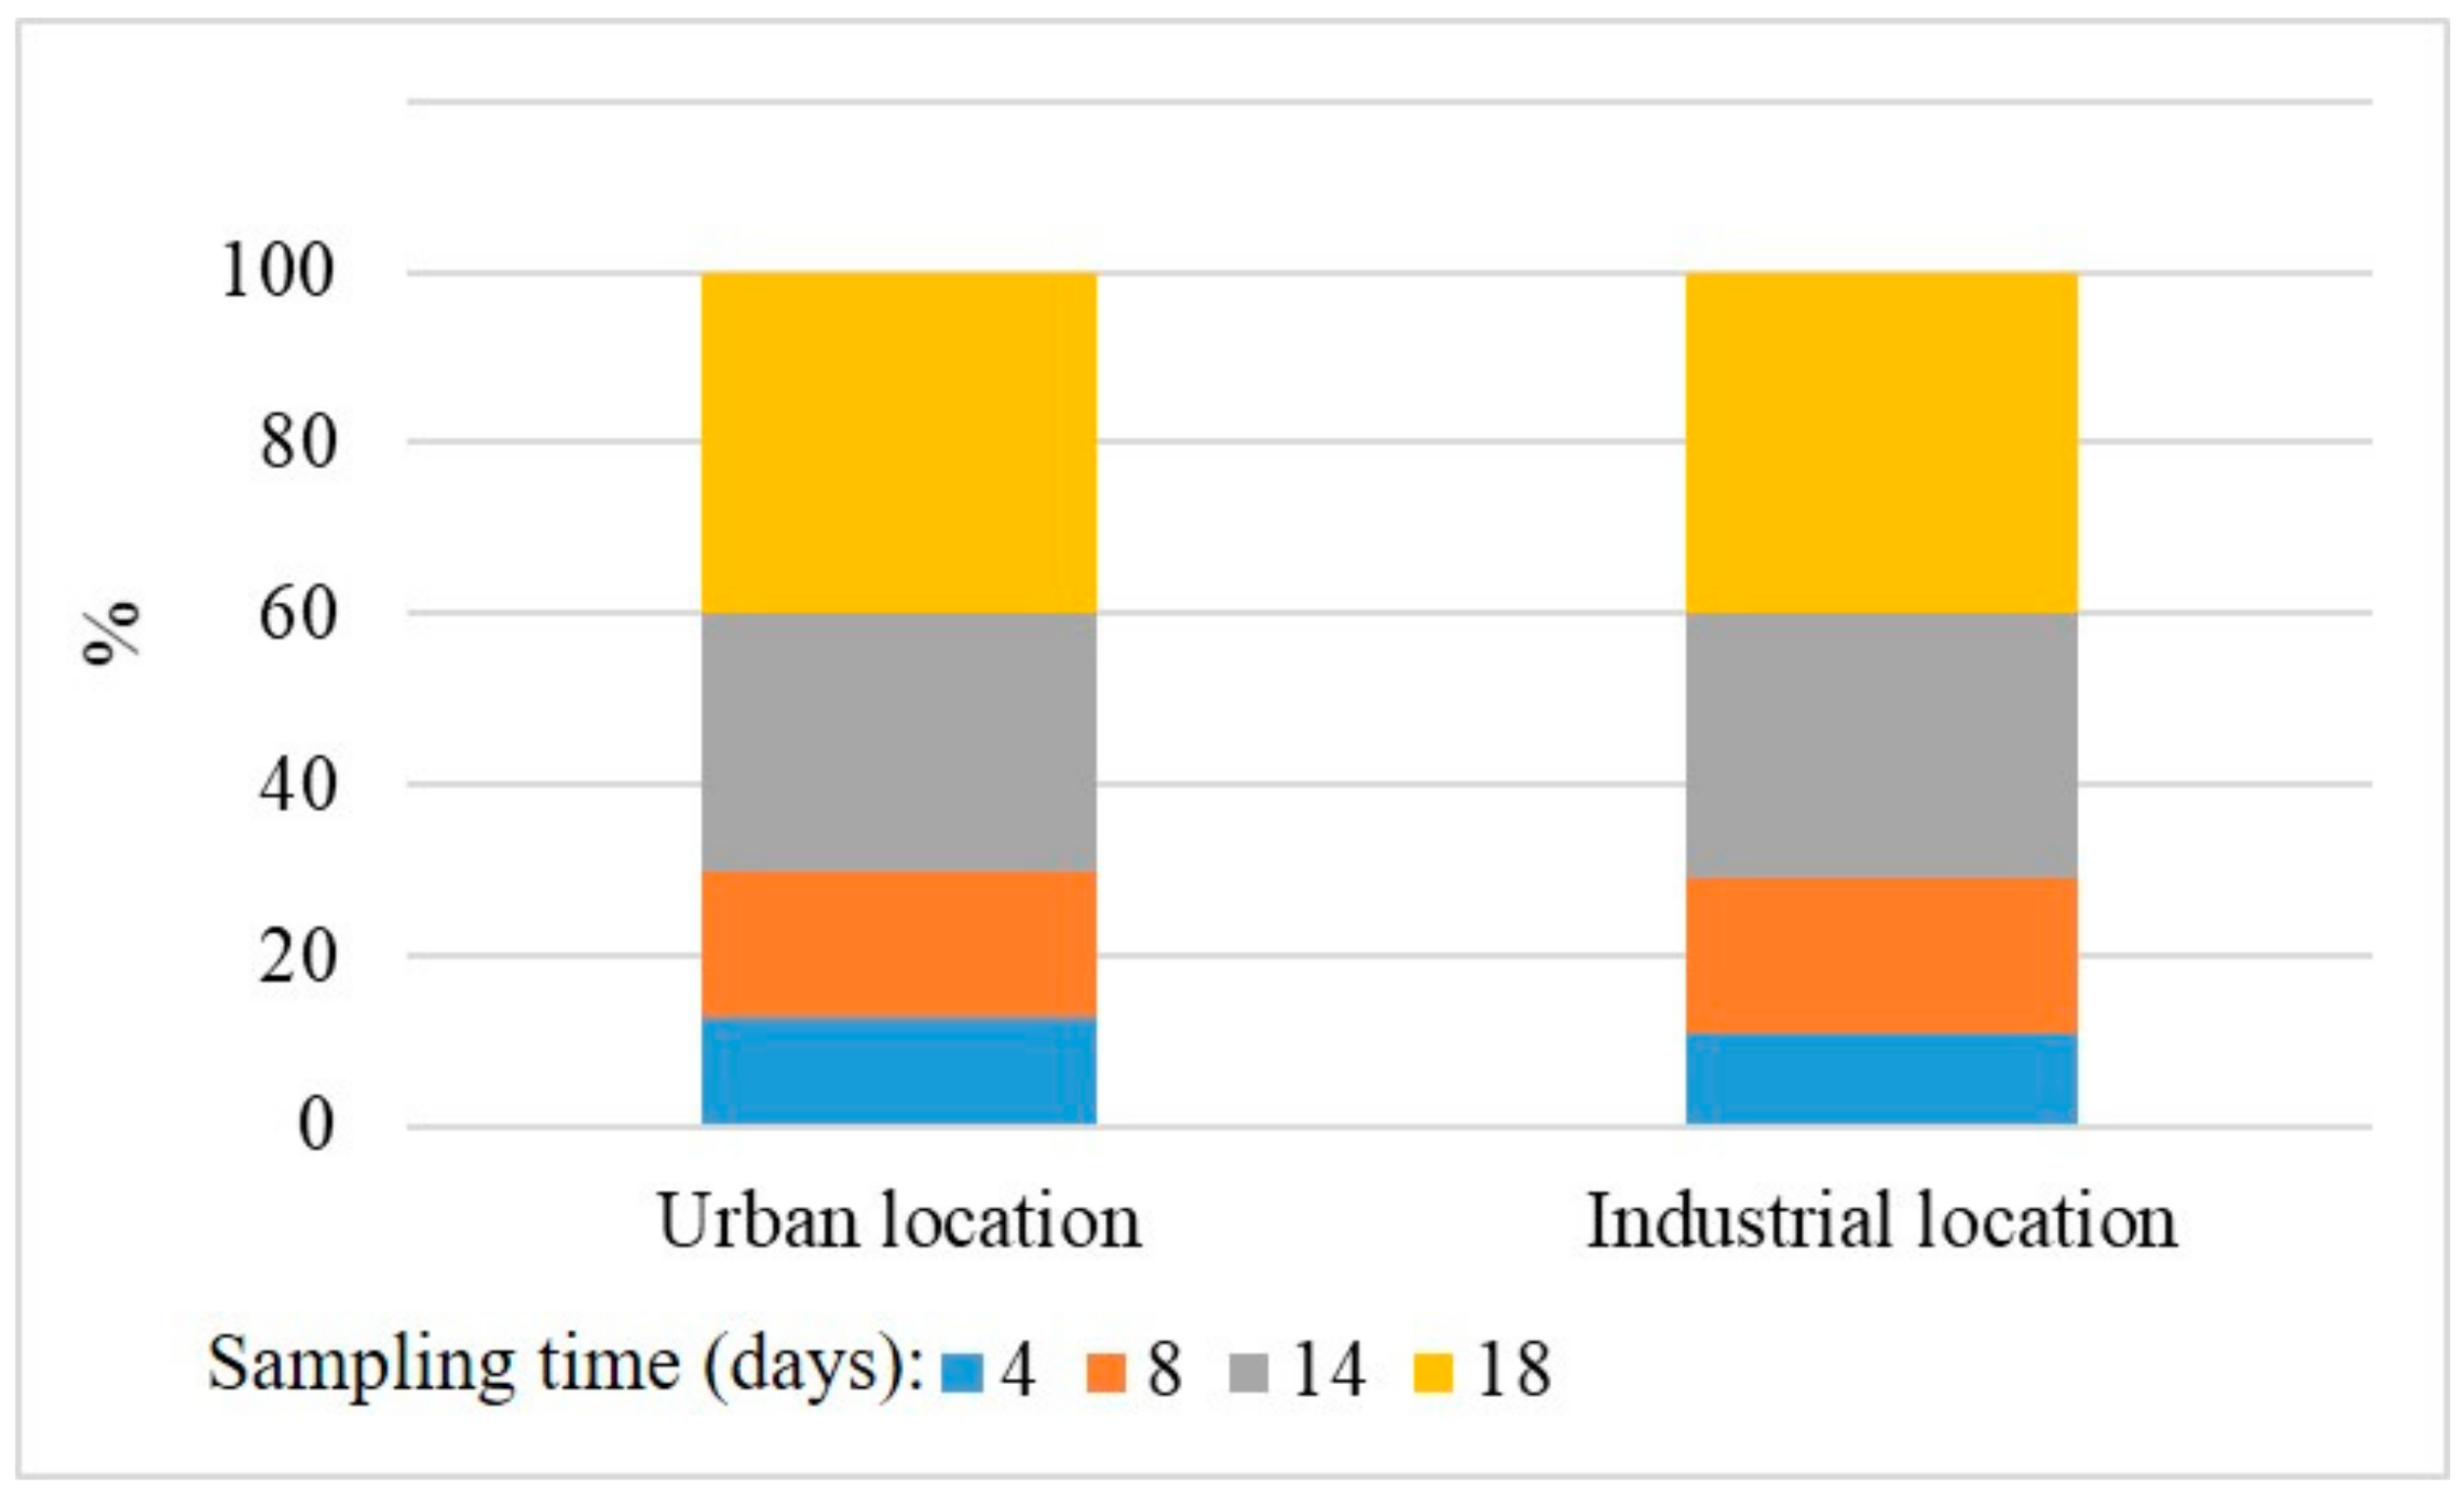
2.1. Study Area, Sampling and Meteorological Conditions

Two test sites in the city of Ferrara were considered in this work: in the city center, called “urban location” (44°50′29.7″ N and 11°36′43.0″ E), and in an industrial area, called “industrial location” (44°51′44.2″ N and 11°33′23.6″ E). The city of Ferrara is located in the north-eastern part of Italy, south of the Po Valley (Emilia Romagna region—Figure 1), at about 40 km north from Bologna and around 60 km from the Adriatic Sea.
The city of Ferrara is characterized by a historic center, rich in ancient buildings and historic churches [45,55,56]. The walls and facades of this buildings and monuments become dirty due to the presence of metal particles and/or oxides that create black crusts on the surfaces of the buildings [45].
In the northern part of the city, there is a high-traffic highway (A13) and two important industrial zones: a chemical industry named “Polo Chimico” and an extended area (Cassana), where many small factories/industries have their headquarters, which is named “Piccola Media Industria (PMI)” (Figure 1, “industrial location”). These areas are the principal sources of atmospheric pollution in Ferrara with an intense environmental impact. The Piccola Media Industria site is characterized by many industries with different activities, but the urban solid waste incinerator present here is the most important cause of pollution. In these areas, the major emissions are nitrate oxides (NOx), sulphate oxides (SOx), carbon oxides (CO), volatile organic compounds with the exclusion of methane (NMVOC), total suspended particles (PTS), hydrochloric acid (HCl), and ammonia (NH3) [57].
PM samples were collected during June and July 2006 (between 27 June and 14 July), using adhesive tapes positioned both in the industrial and in the urban location. In the industrial location, the sampling points were selected around the urban solid waste incinerator (in the yellow circle on the top left side of the map in Figure 1); on the other side, in the urban location, they have been selected in a crossing way with high traffic (in the yellow circle at the bottom of the map in Figure 1).
In each sampling area, adhesive tapes were applied on the surface of road signs, and situated at the same height (about 2 m above ground level) in horizontal position (Figure 1a): in the industrial location, ten sampling road signs were selected, and one in the urban location was selected. In every road sign, four adhesive tapes were placed on the surface and collected at different times, 4 days, 8 days, 14 days, and 18 days, in order to verify if temporal variation can affect the composition of PM. The adhesive tapes used were in polypropylene. This non-conventional type of collection was preferred because it allows to select particles that move on air with diffusion movement and to exclude particles usually deposed following gravity rules.
Ferrara is characterized by a subcontinental cold-temperate climate, with weak winds, shortage of precipitations, and a high relative humidity. Land-level morphology and climate conditions facilitate the instauration of acute phenomena of atmospheric pollution, as reported in [57].
During the sampling period, the meteorological data were collected in the ARPA active sampling location (Figure 1—44°50′29.7″ N and 11°36′43.0″ E). The sampling period, characterized by the absence of precipitations, was between June–July 2006, and the meteorological data during this period were in according with the seasonal averages. The dominant winds were in direction of W to E and from E-S-E to W, and their average velocity was about 5 m/s (Figure 1). Relative humidity values were constantly measured in two different times of the day, at noon and midnight, with values ranging, in the first case, between a minimum of 30% and a maximum of 82%, and, in the second case, between a minimum of 43% and a maximum of 82%. The average air temperature was measured at 2 m from the ground every 12 h, fluctuating between a minimum of 21 °C and a maximum of 31 °C in the first part of the day (until noon), and a minimum of 17 °C and a maximum of 26 °C in the second part of the day (from noon to midnight).

2.2. Analytical Methods

Morphological characteristics, sizes, and elemental analyses of individual particles were identified by a Scanning Electron Microscopy (SEM) EVO® 40 Series (Carl Zeiss AG, EVISA, Oberkochen, Germany) equipped with an Energy Dispersive X-ray Spectrometer (EDS) (Oxford instruments Inca 300 EDS system, Oxfordshire, UK) for X-ray microanalysis, at the Centro di Microscopia Elettronica of Ferrara University. The particle size and the surface morphology of the sampled aerosol particles were investigated in high resolution mode (up to 20,000×) with a working voltage of 20 kV, which corresponds to the detection limit of 1 μm particle size. High-resolution images of particles were obtained by the regulation of vacuum inside the instrument chamber. The analyses were qualitative and were performed in the manual mode [58,59]. SEM-EDS measurements were performed on the adhesive tape samples. Portions of the samples were mounted on aluminum support SEM “stubs” with a double sided tape, which had a conductive graphite base. The samples were then coated with a thin layer of gold (coating) film by electric arc high vacuum method using an Edwards S150 Sputter Coater and then analyzed by SEM. The EDS technique is able to characterize the chemical composition of particles whose diameter is greater than 1 μm [60]. The SEM technique has been considered useful in order to evaluate the geological characteristics of PM [61,62,63], to be able to determine the possible sources of the particles observed and to better understand the possible relationship between PM pollution and its impact on monuments [64,65].
The calculation of the oxides considered the proportion pertaining to atomic weights (AW) and molecular weights (MW):
weight oxide % = weight % of the element × MW oxide/AW element
The oxides were calculated for Si, Al, Fe, Mg, Ca, Na, K, Mn, Zn, Ti, and S in the case of silicate, carbonate, mixed, and sulphate particles. The particles called “mixed” were those particles not well identified and devoid of elements that predominate over the others. In the case of chlorine particles, oxygen was rarely present; therefore, it was necessary to process the data obtained directly from the microanalysis, i.e., relating to the elements. In the case of carbon particles (from traffic), the data provided by the microanalysis were used because they were anthropogenic particles and the transformation into oxides of the elements did not make sense.
Finally, in the case of carbonate particles, it was useful to process the data using the CIPW (Cross, Iddings, Pirsson, and Washington) regulatory calculation [66], thanks to which the molecular proportions have been calculated starting from the percentages by weight of the oxides.
The PM sampled with adhesive tapes was compared with the PM sampled on Teflon® filters from the station of the Regional Environmental Protection Agency (ARPA Emilia Romagna) located in Corso Isonzo in the center of Ferrara, which is 250 m farther from the urban location of the sampling with adhesive tapes. The sampling system of the control units of the ARPA fixed monitoring network was completely similar to that of an impactor [67]. The ARPA monitoring station considered was one of the traffic stations in which PM10 was measured with a beta radiation absorption analyzer, corresponding to one of the automated methods with certification of equivalence to the reference method envisaged by the legislation: the gravimetric method.

3. Results

SEM-EDS analysis showed the wide compositional variety of the particles collected in the two different sites.
Figure 2 shows the percentage of the average of particles observed on the filters collected in the two different sampling sites (urban location and industrial location) at the different sampling periods (4, 8, 14, and 18 days). It can be seen that no substantial differences were observed between the two sampling sites related to the mass of the particles collected.
The EDS on the adhesive tape revealed a composition mainly of carbon and oxygen (Figure 3a), as well as the gold obviously used for the cover. The presence of copper could be linked to the metallization which involves the use of a copper disk on which the gold layer was applied. The adhesive tape has proven to be suitable for SEM observations, but it tended to degrade itself with increasing sampling times. Figure 3b,c shows two different examples of evident alterations and bulges on the adhesive tapes, making them unusable for SEM-EDS observations.
The morphological analysis of geometric diameter of the particles collected highlighted the prevalence of particles with diameters higher than 10 μm (68.1%) at both sampling sites. Carbon particles, mainly cenosphere (typical of the combustion of motor vehicle fuels), were easily recognizable through the typical rounded shape and diameter between 30 and 40 μm (Figure 4a), and organic particles, mainly pollen, with rounded or elongated shapes and a diameter ranging from 10 to 30 μm, were also observed (Figure 4b). Cenosphere and pollen were important in the aggregation processes, as very often they acted as a “base” for the smallest particles, with dimensions less than 10 μm, deposited on their surface in increasing quantities and creating large aggregates, even up to 50 μm. These particles, which settled on cenosphere or on pollen, had a highly variable composition, from silica to carbonate, and from chlorinated to carbonaceous. A similar behavior was observed for chlorides, which tended to grow on the surface of the cenosphere (Figure 4c).
Instead, considering each sampling site, the particles collected revealed that dimensional variations are related to temporal variations. Figure 5 shows the mean values (expressed in percentage) of multiple measurements collected for each sampling period (4, 8, 14, and 18 days). In detail, from the quantitative point of view, an increase in the percentage of the particles with geometric diameters higher than 10 μm with the increasing of time was observed (Figure 5). The presence of particles with diameter >10 μm increased on filters exposed to sampling for a longer time: from 55% of particles, after a 4-day sampling, to 81% of particles, after an 18-day sampling. This could probably be related to a progressive aggregation of the smaller fraction of particulate matter during the time (which in fact decreased with the sampling time), forming larger particles (>10 μm).
The microanalysis showed different kinds of particles: 90% of inorganic particles (silicates, carbonates, sulphates, chlorides, C-particles, and agglomerates) and 10% of organic particles.
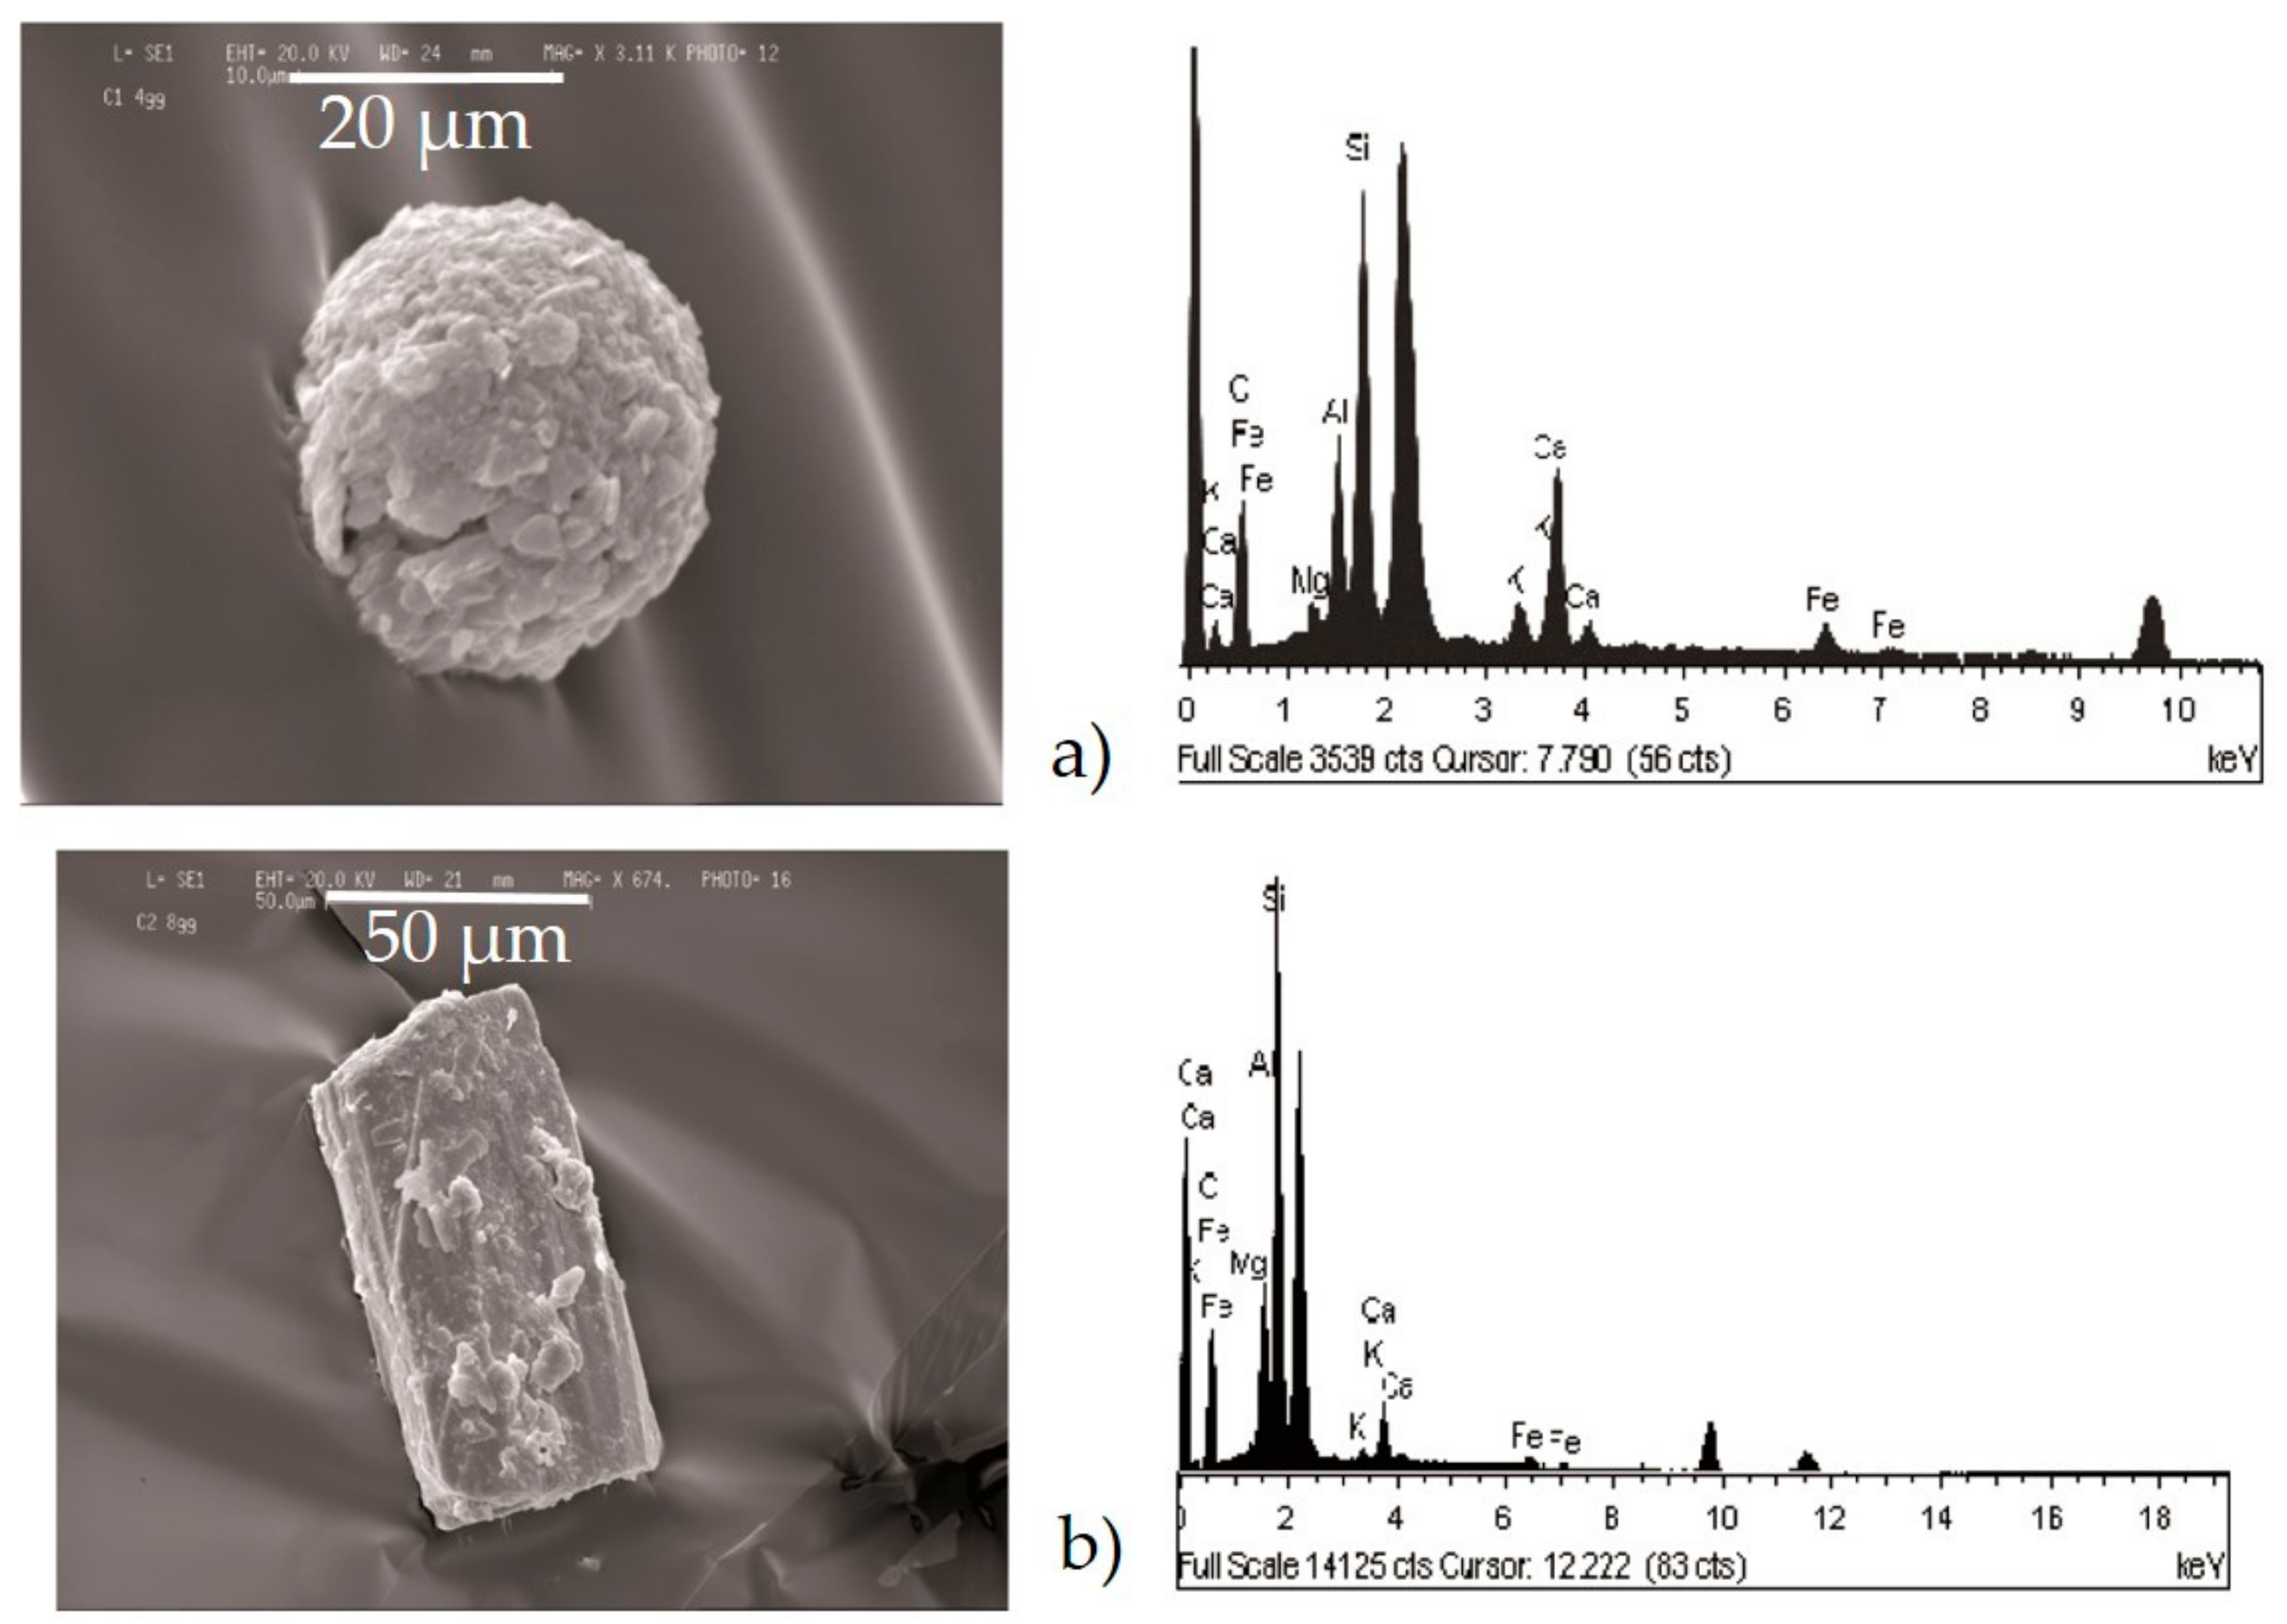
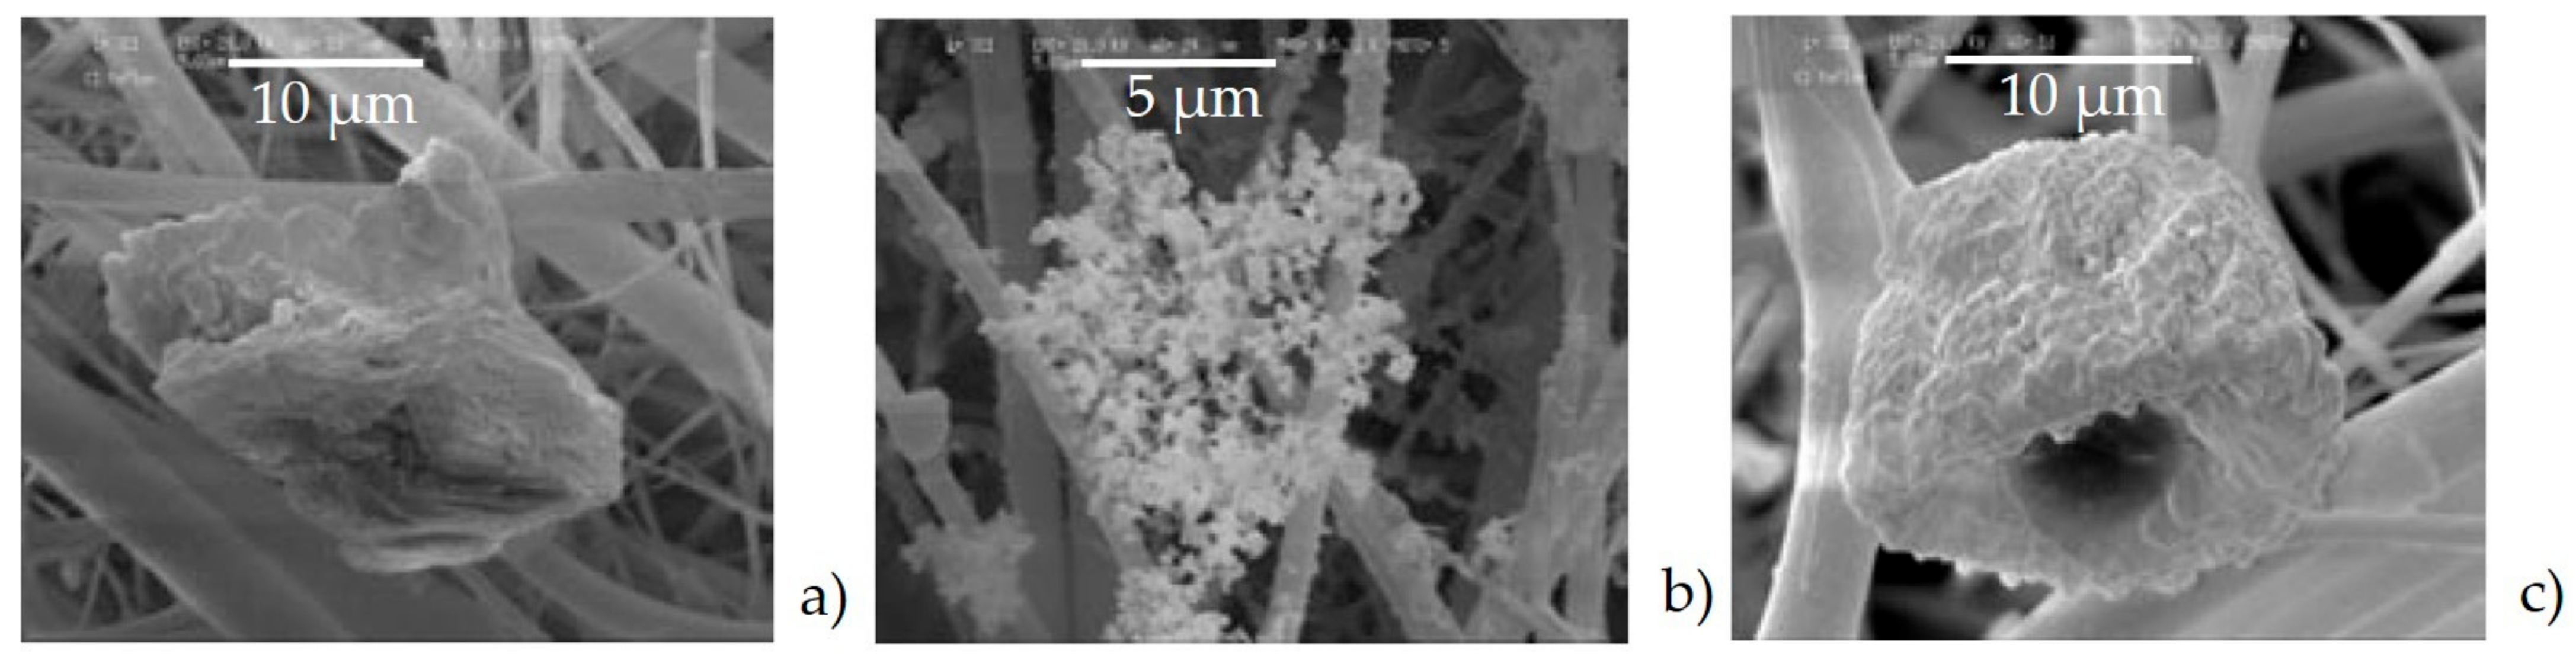
Agglomerates (Figure 6a) were composed by different kinds of small particles that joined together to form a single particle. The spectrum showed the prevalence of silicates with the high peak of Si, Al, Fe, as well as Mg. The aggregates on the adhesive tapes appeared as a single monodisperse particle: they were not surrounded by other particles, such as those with a small size. This suggested that aggregation occurred directly in the atmosphere and not after being captured by sampling.
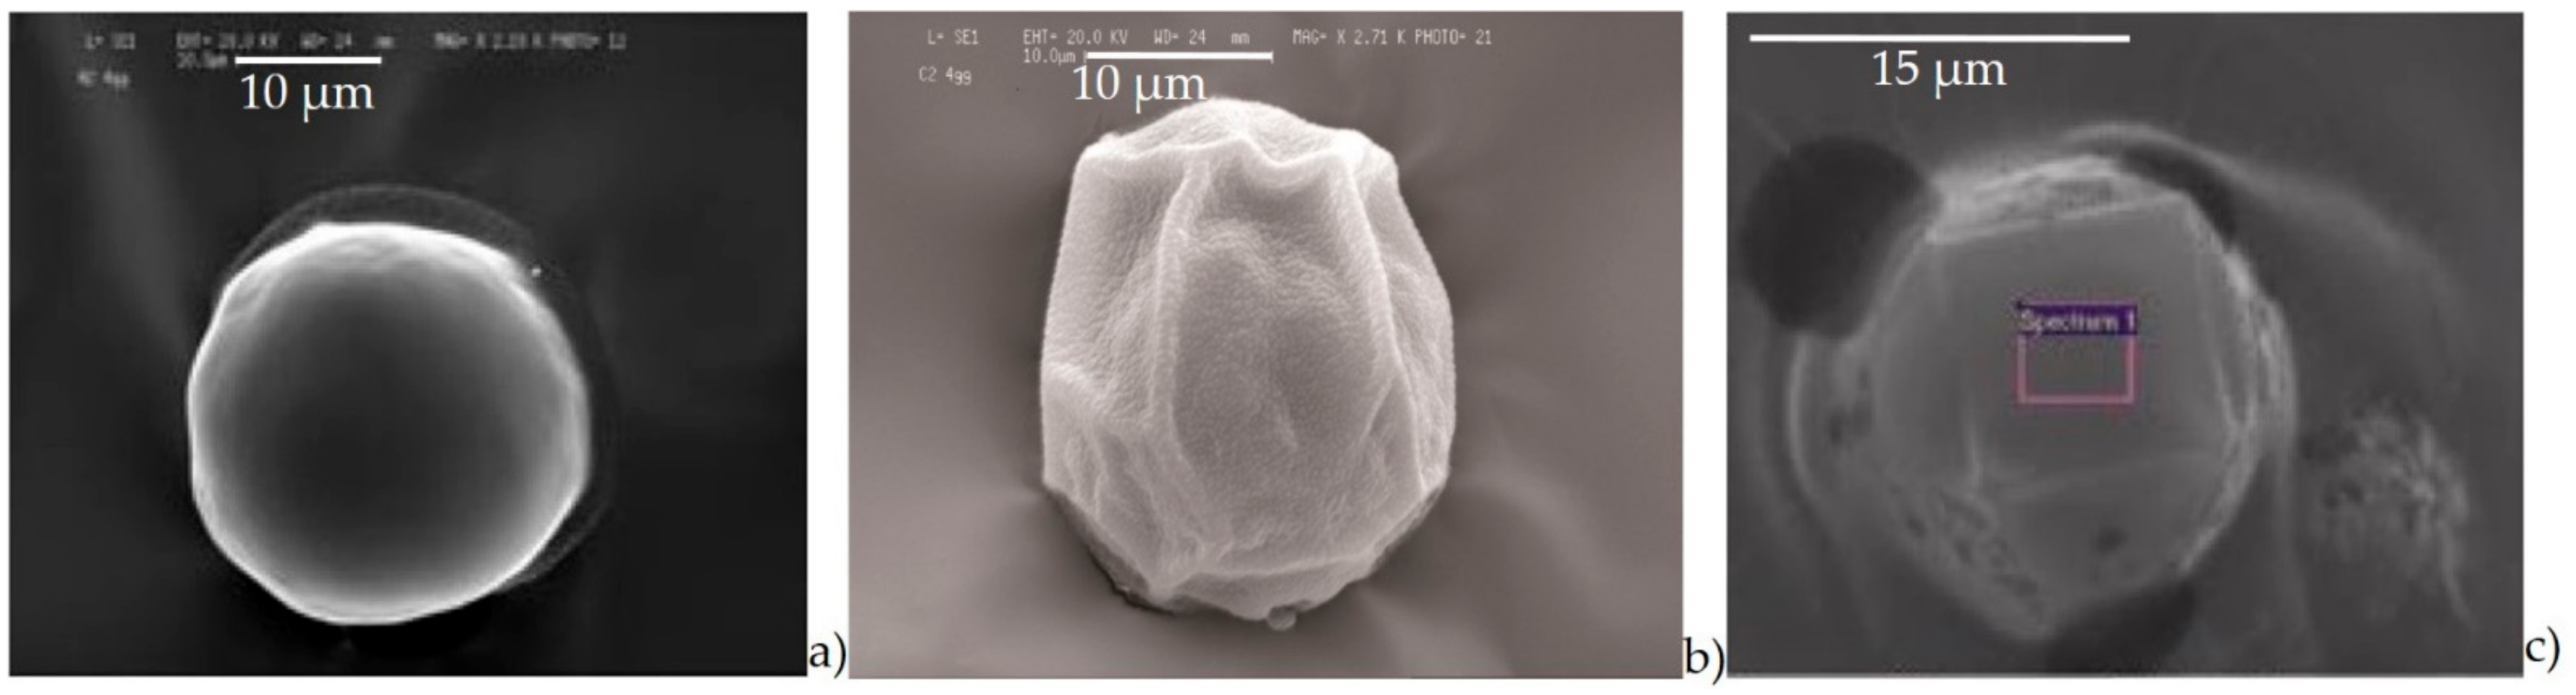
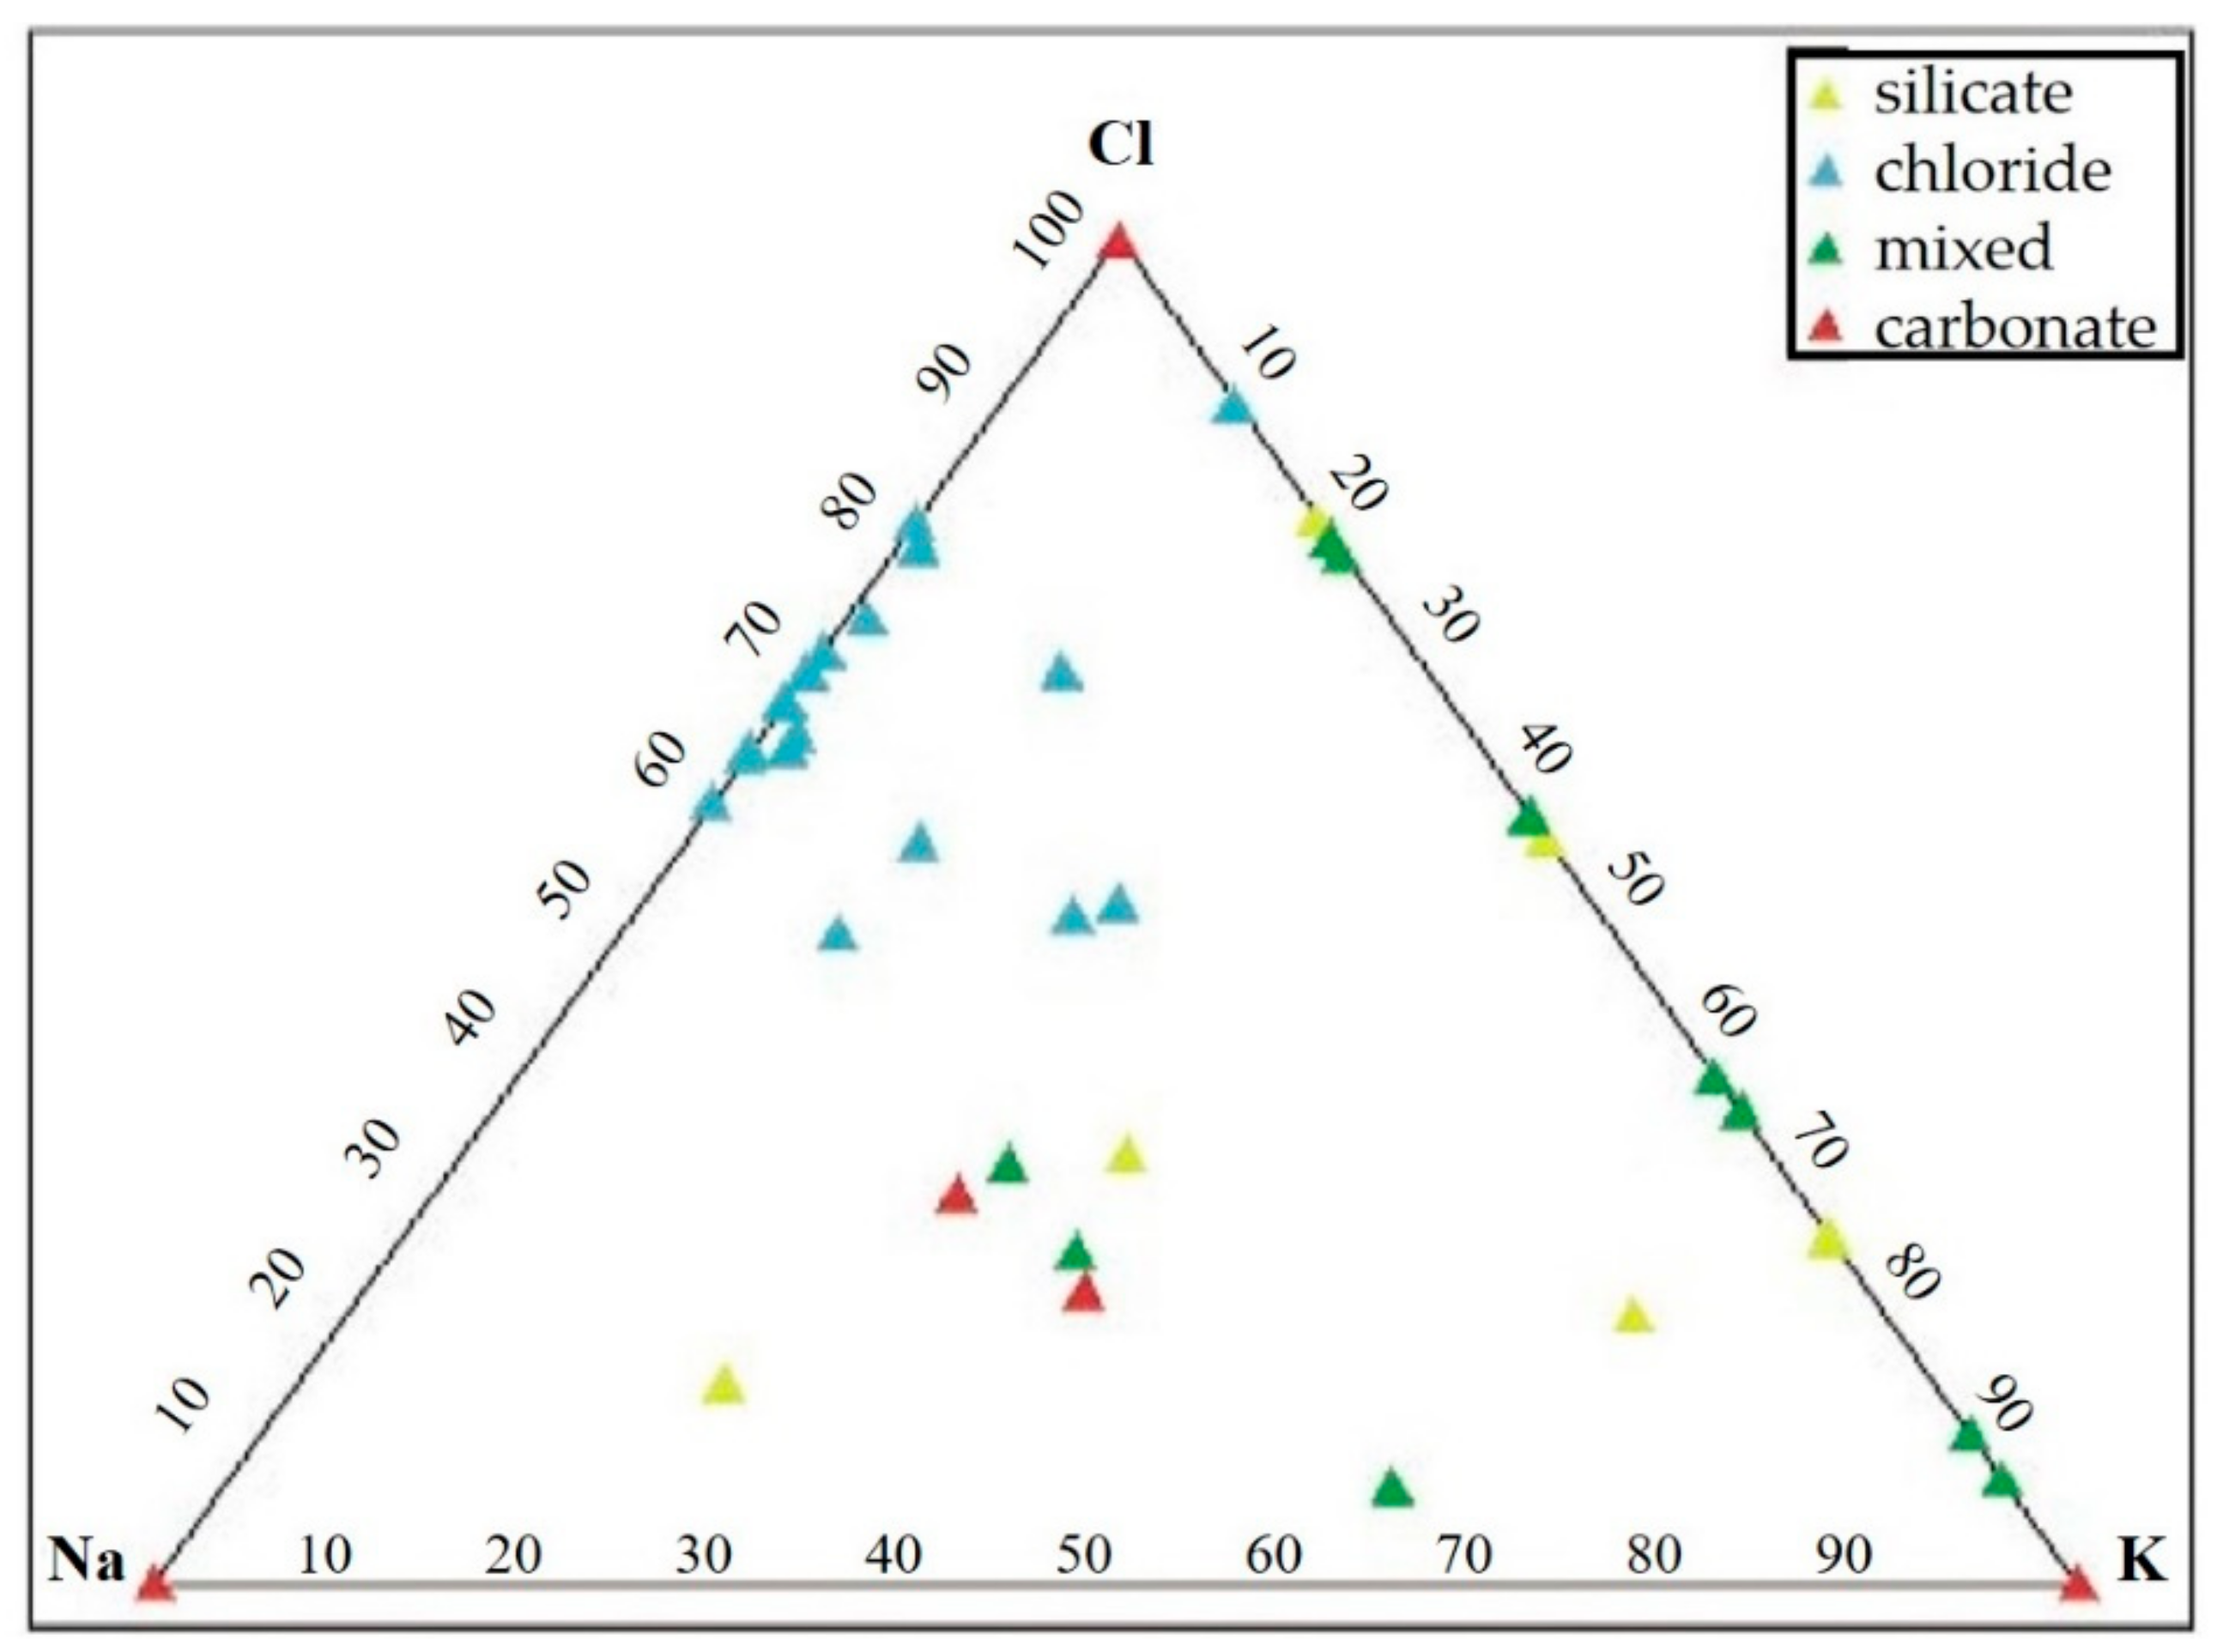
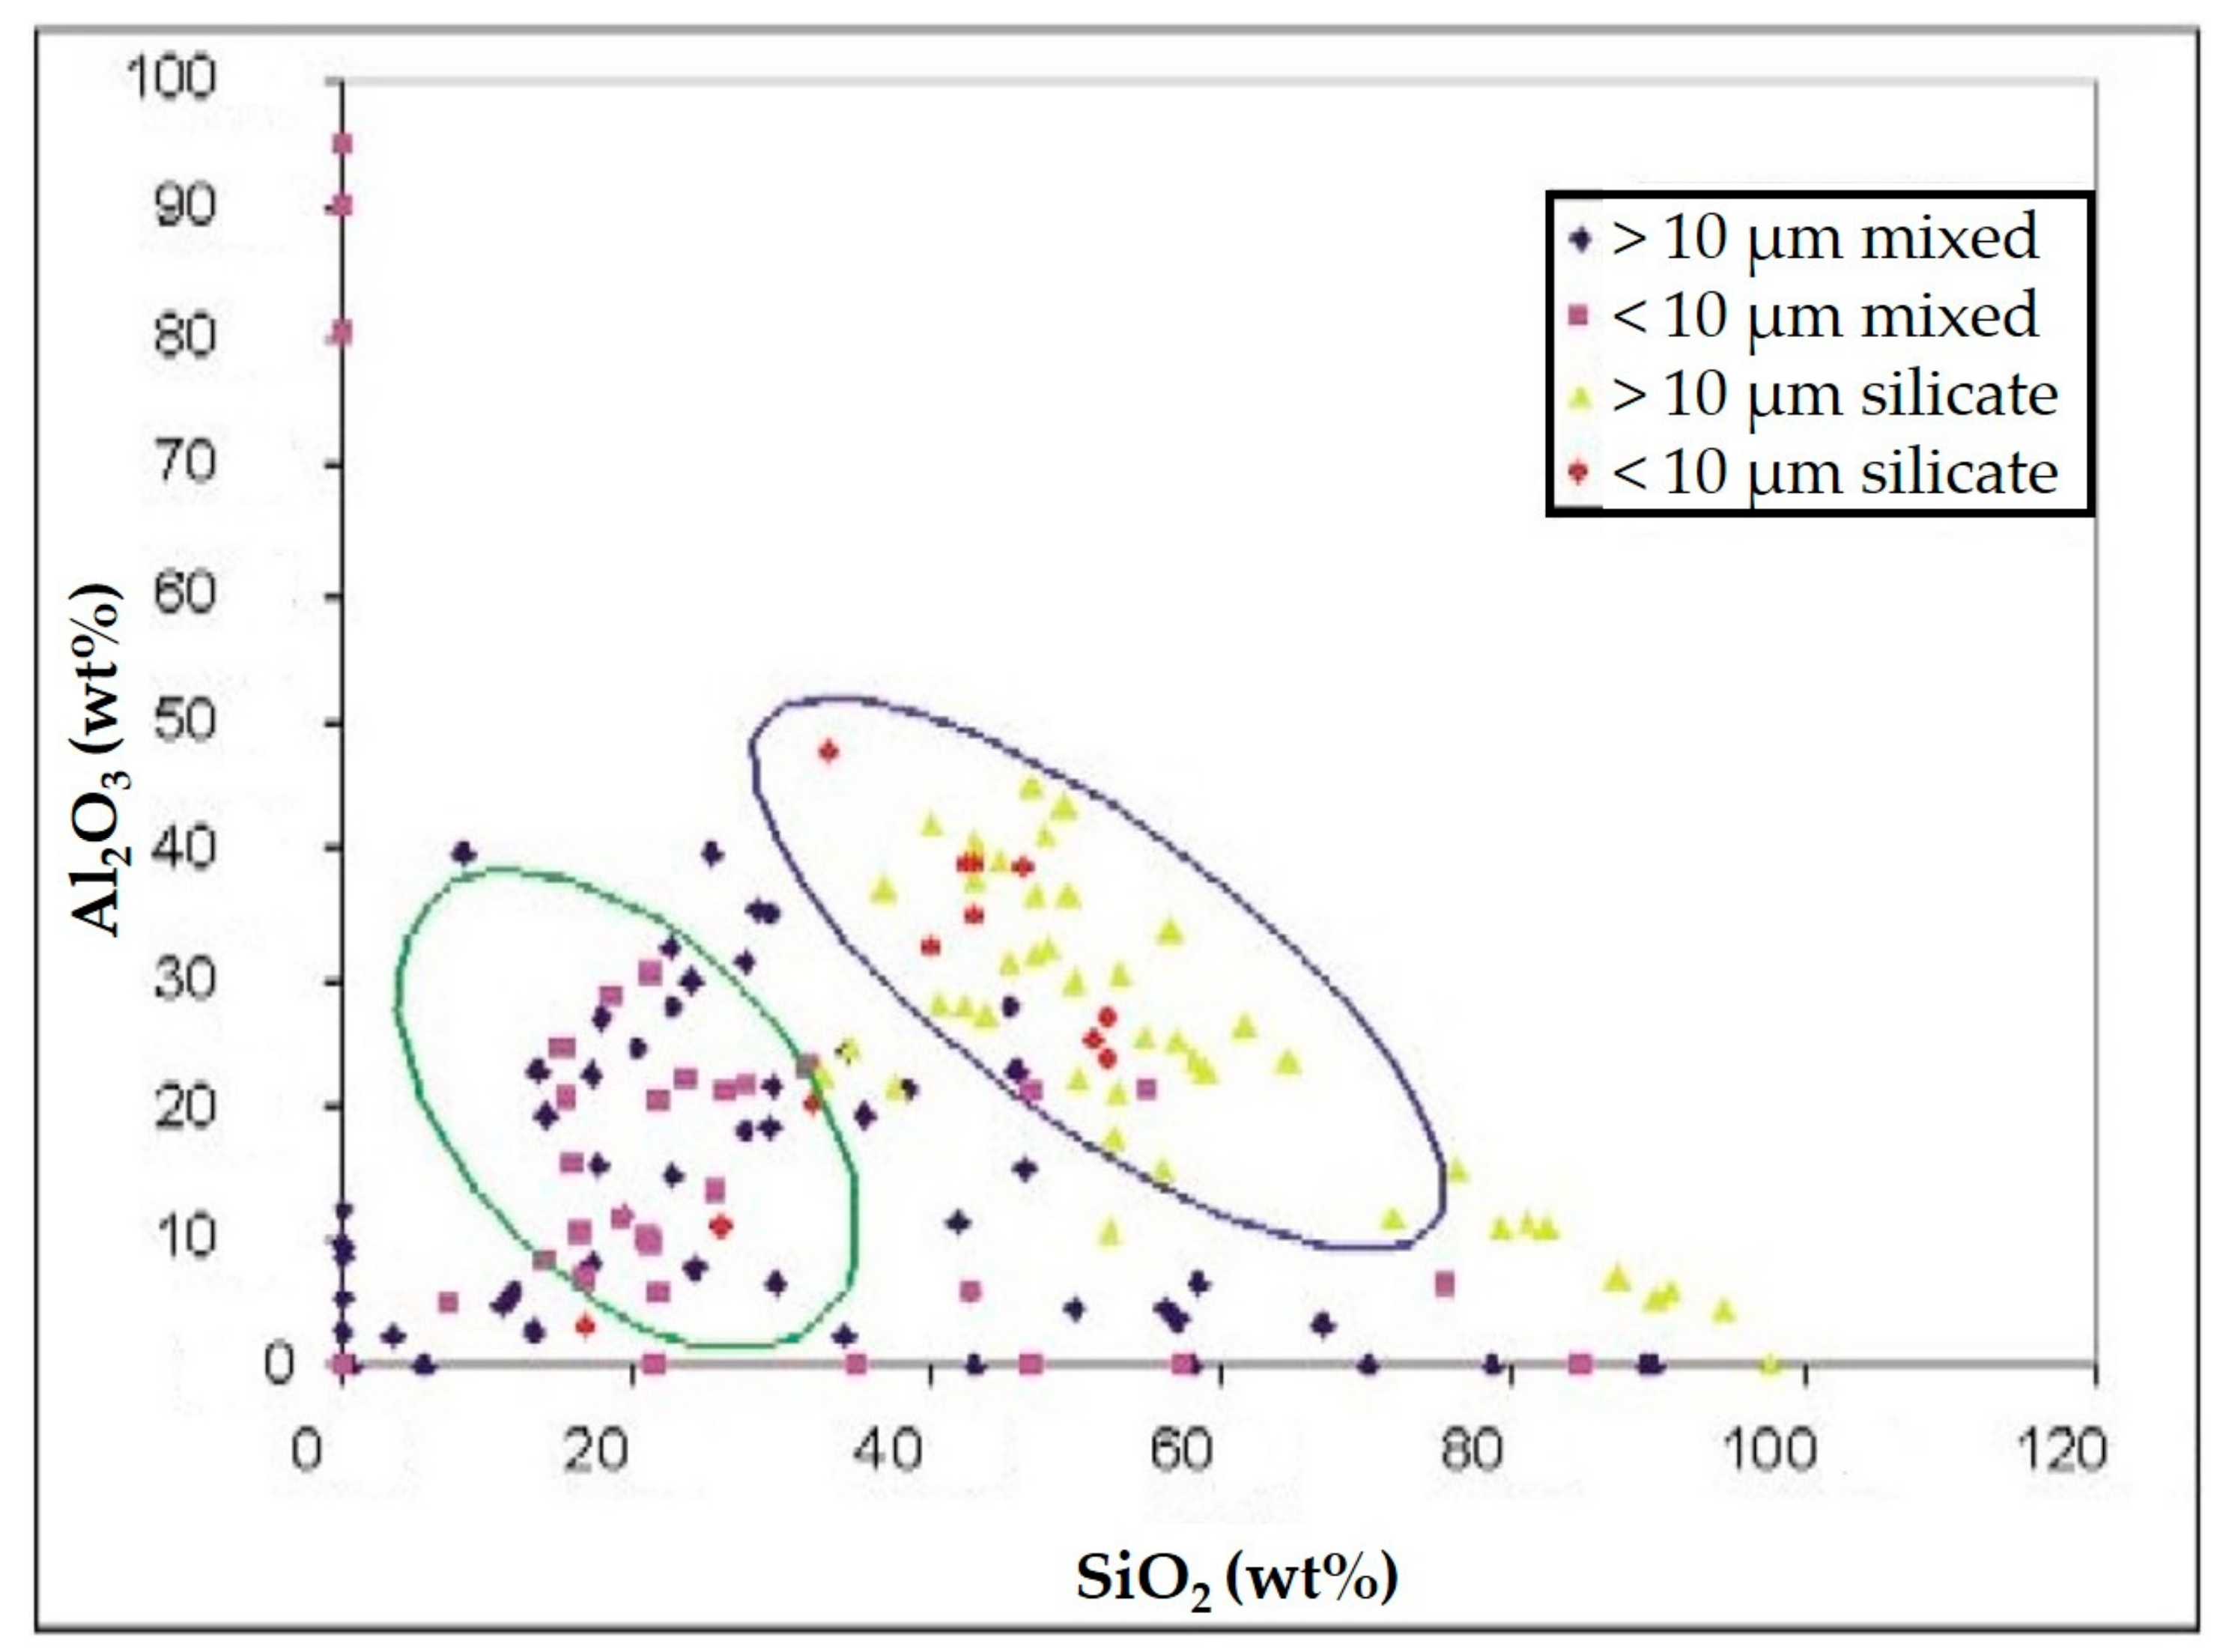
Silicates (Figure 6b) with variable shapes, from rounded to elongated or irregular globular. The spectrum showed high peaks of Si, followed by Al, Fe, Mg, Ca, K, and sometimes small peaks of Na, Ti, and Zn. The natural ones originated form airborne soil dust from windblown soil dust and re-suspension of dust from roads. The anthropic ones could be assumed as fly ash particles originating from different kinds of combustion processes (coal-fired plants, traffic, and urban sources).
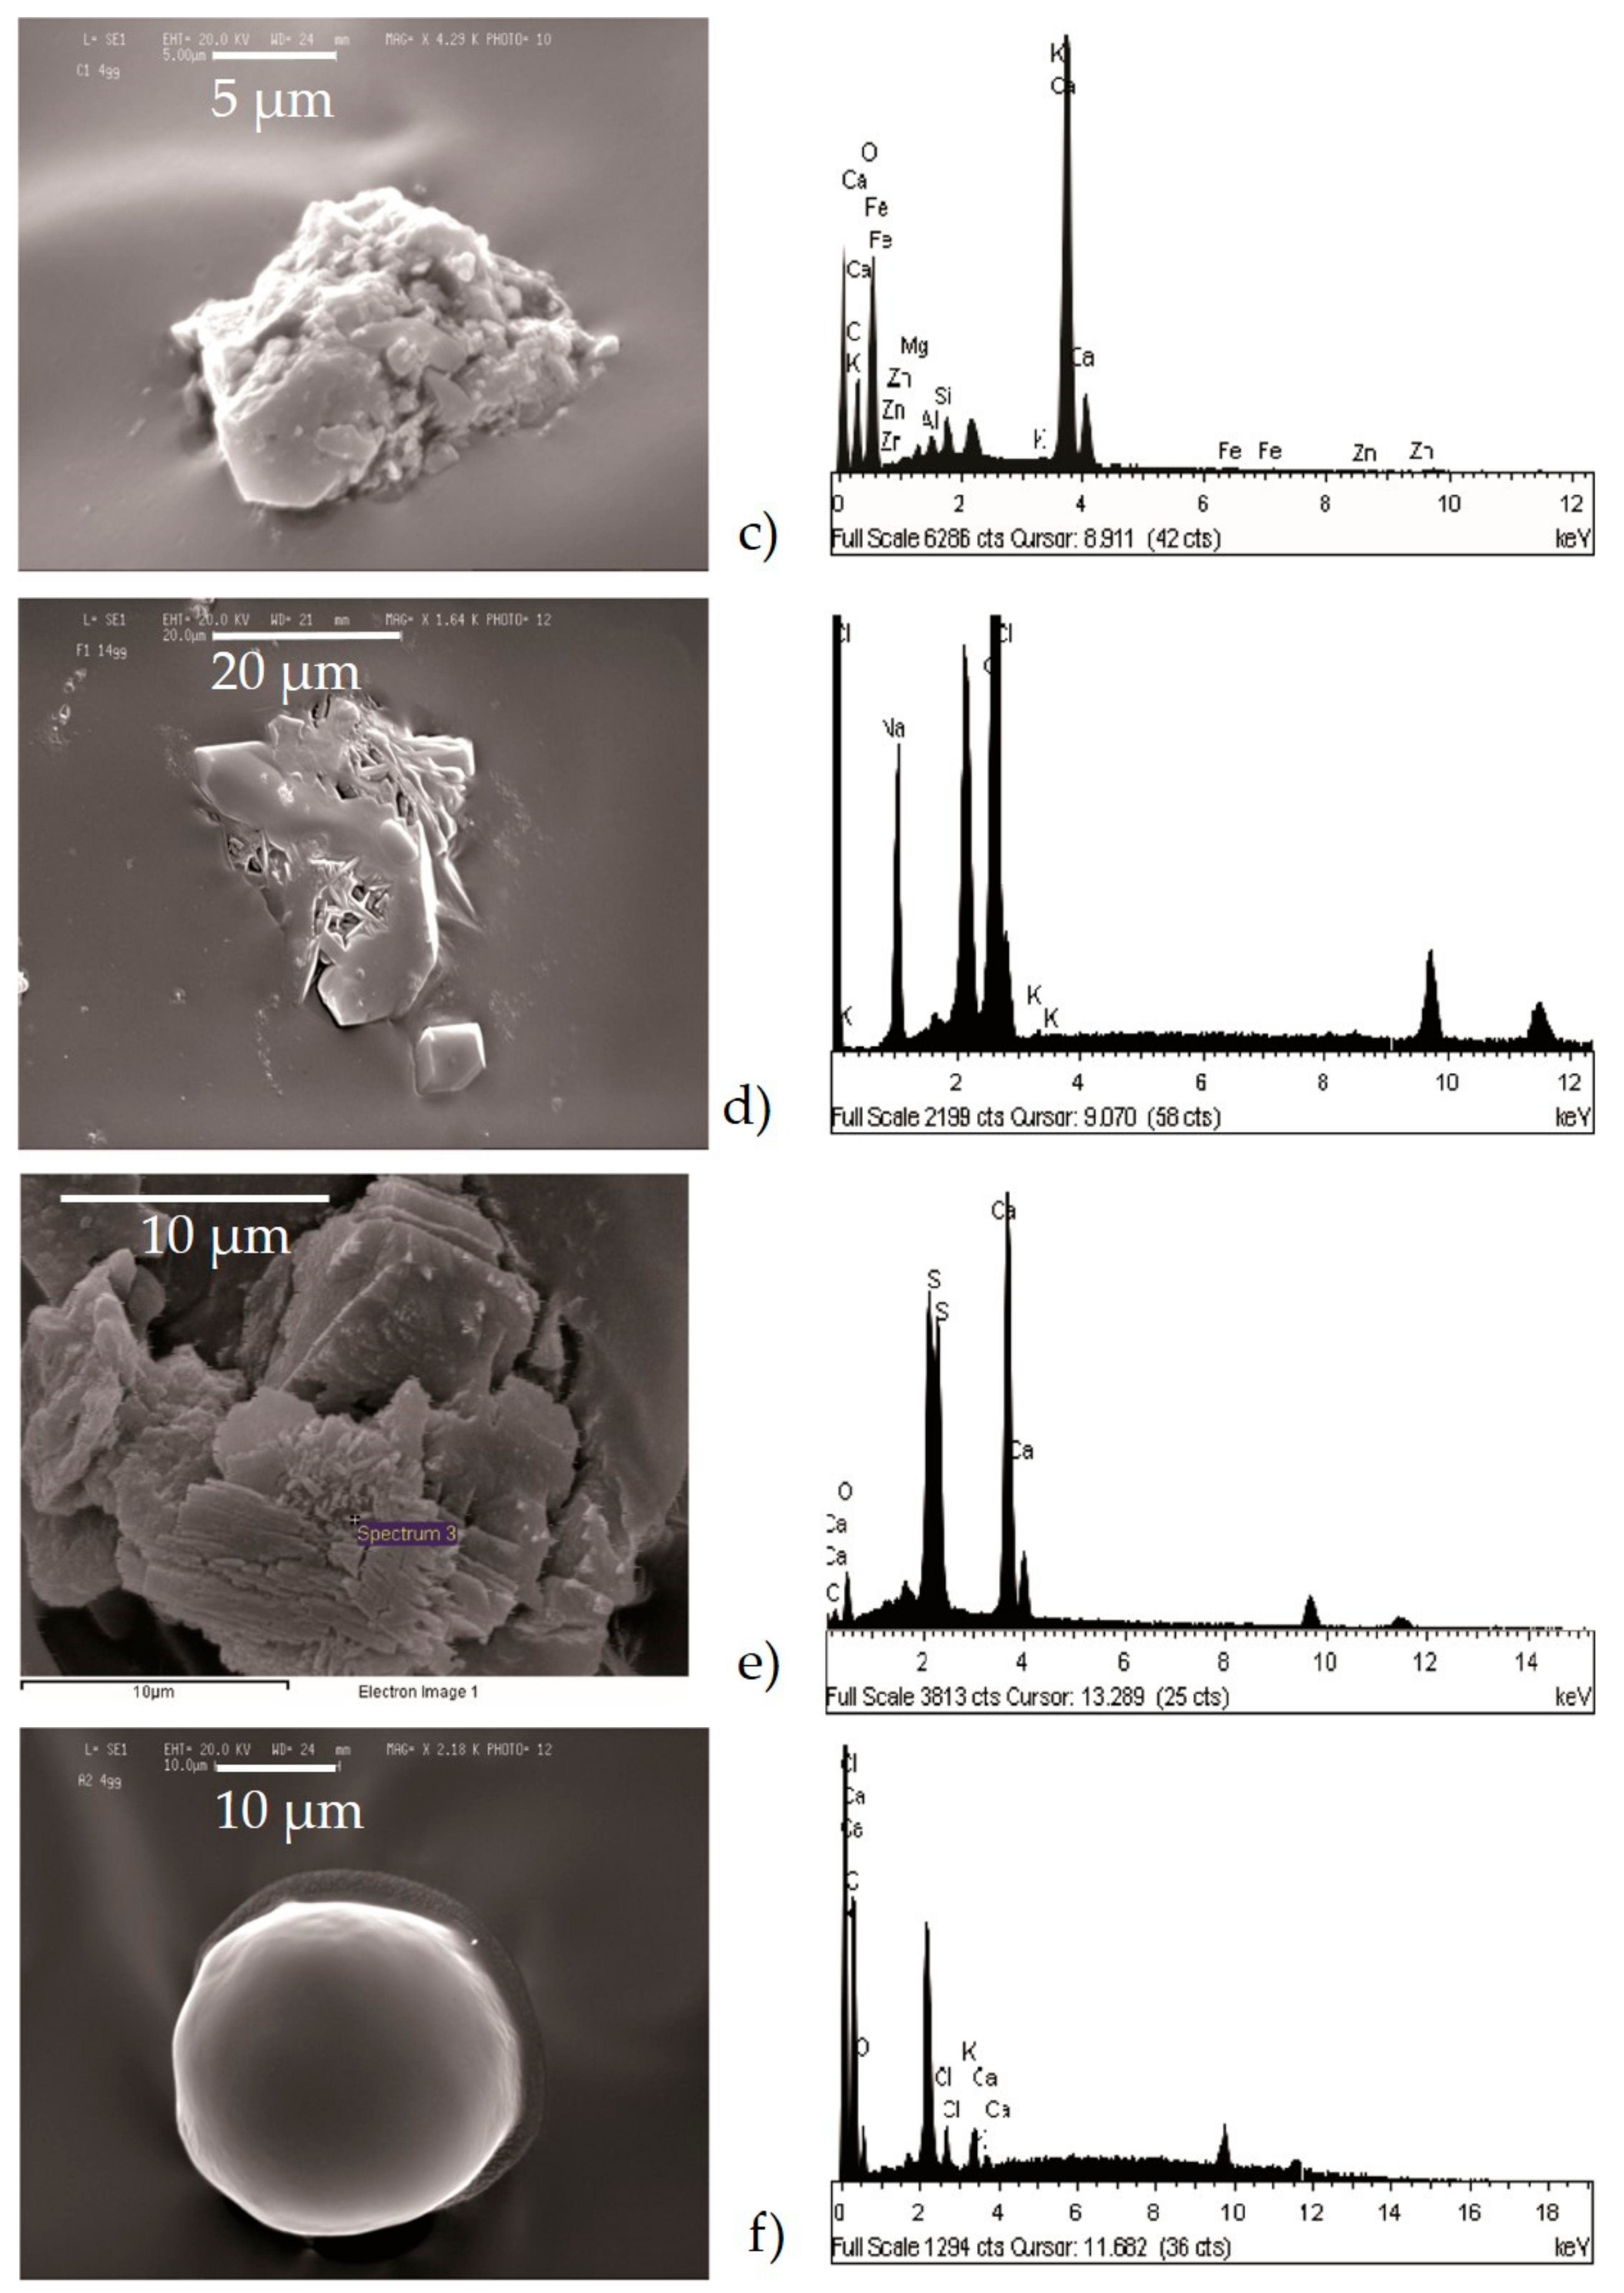
Carbonates (Figure 6c) showed high peaks in Ca and Mg with impurities of Al, Fe, Cl, alkali (Na, K), and Si. These particles were probably of limestone and/or dolomitic origin. Limestone was distributed as crustal minerals and was widely used in building manufacturing and in metallurgic processes, and dolomite was generally used in metallurgical, chemical, and glass industry, in fertilizers, in ceramics, and as filler in paper and plastic industry. The content of Al, Fe, and Si could be related to impurities present both in dolomites and in limestone. The presence of narrow quantities of Cl and alkali could be explained with the presence of airborne halite particles in the atmosphere.
Chlorides (Figure 6d) showed a high value of Cl and Na, and K was also present. Generally, these kinds of particles are natural particles originating from marine aerosol; however, knowing the sampling area, which is rich in industrial activity, they were probably related to the fertilizer industry.
Sulphates (Figure 6e) were less abundant than others and were characterized by high peaks of S and Ca. They could be related to the presence of gypsum particles.
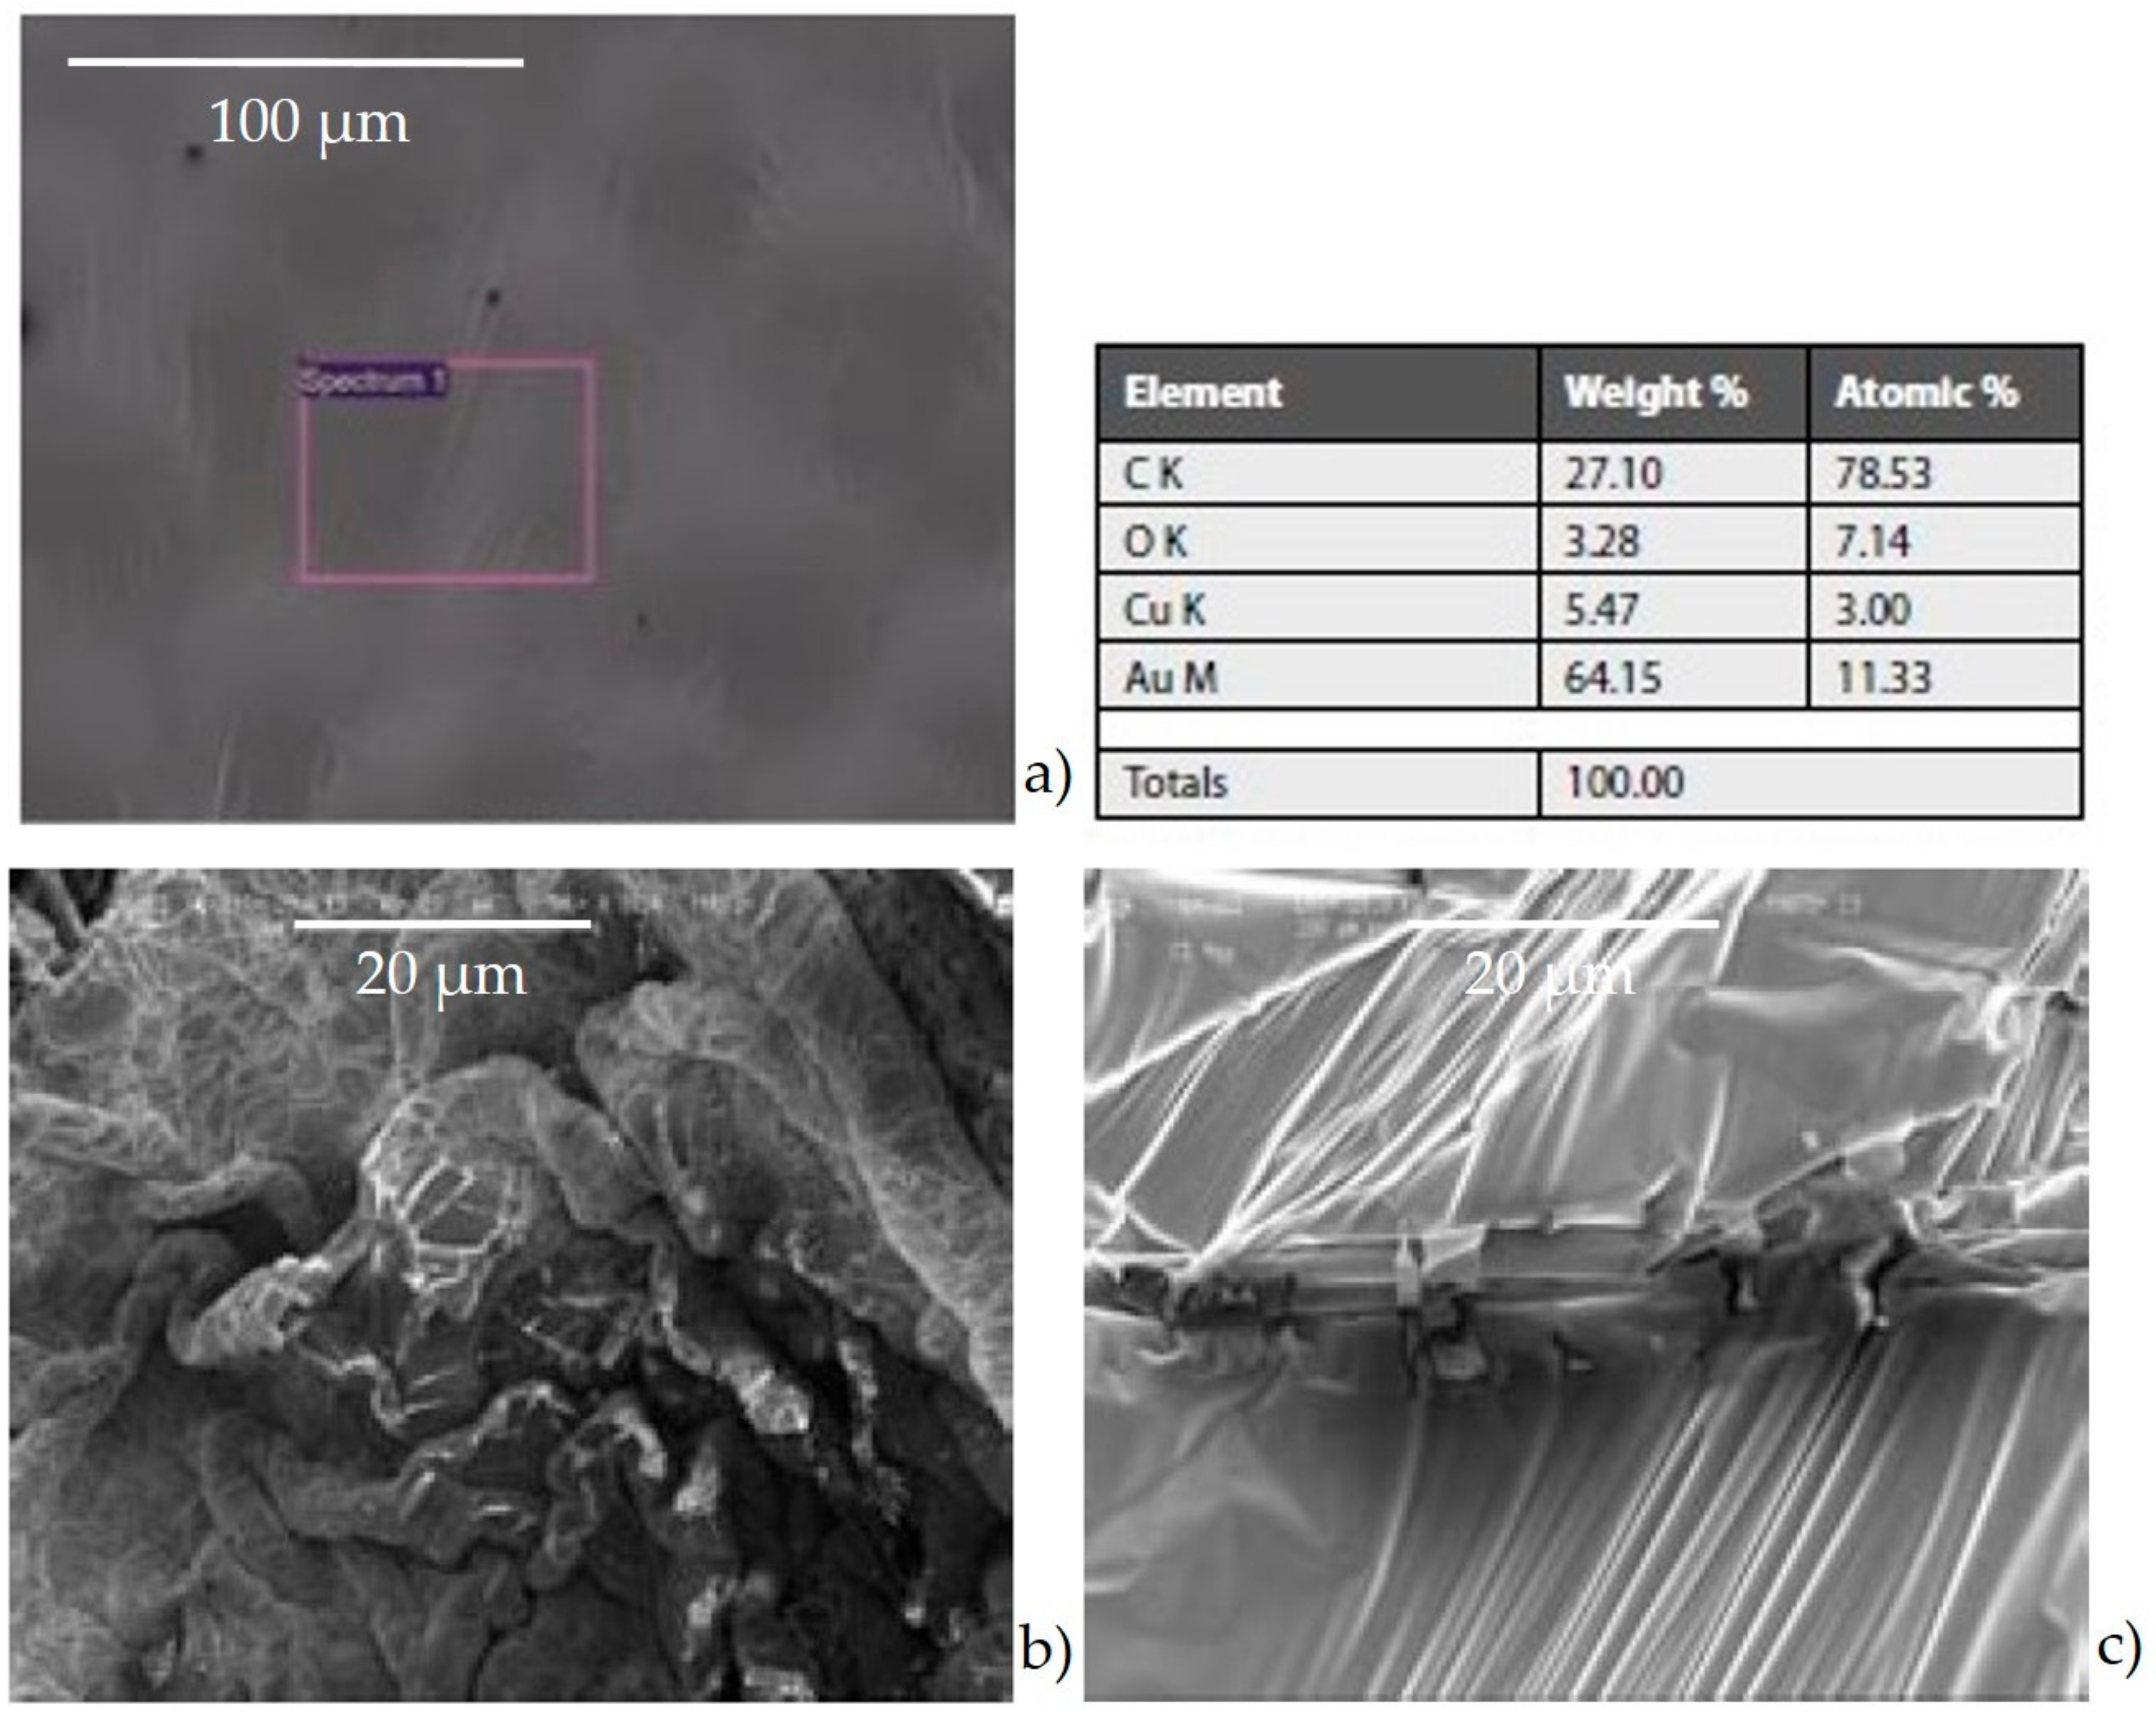
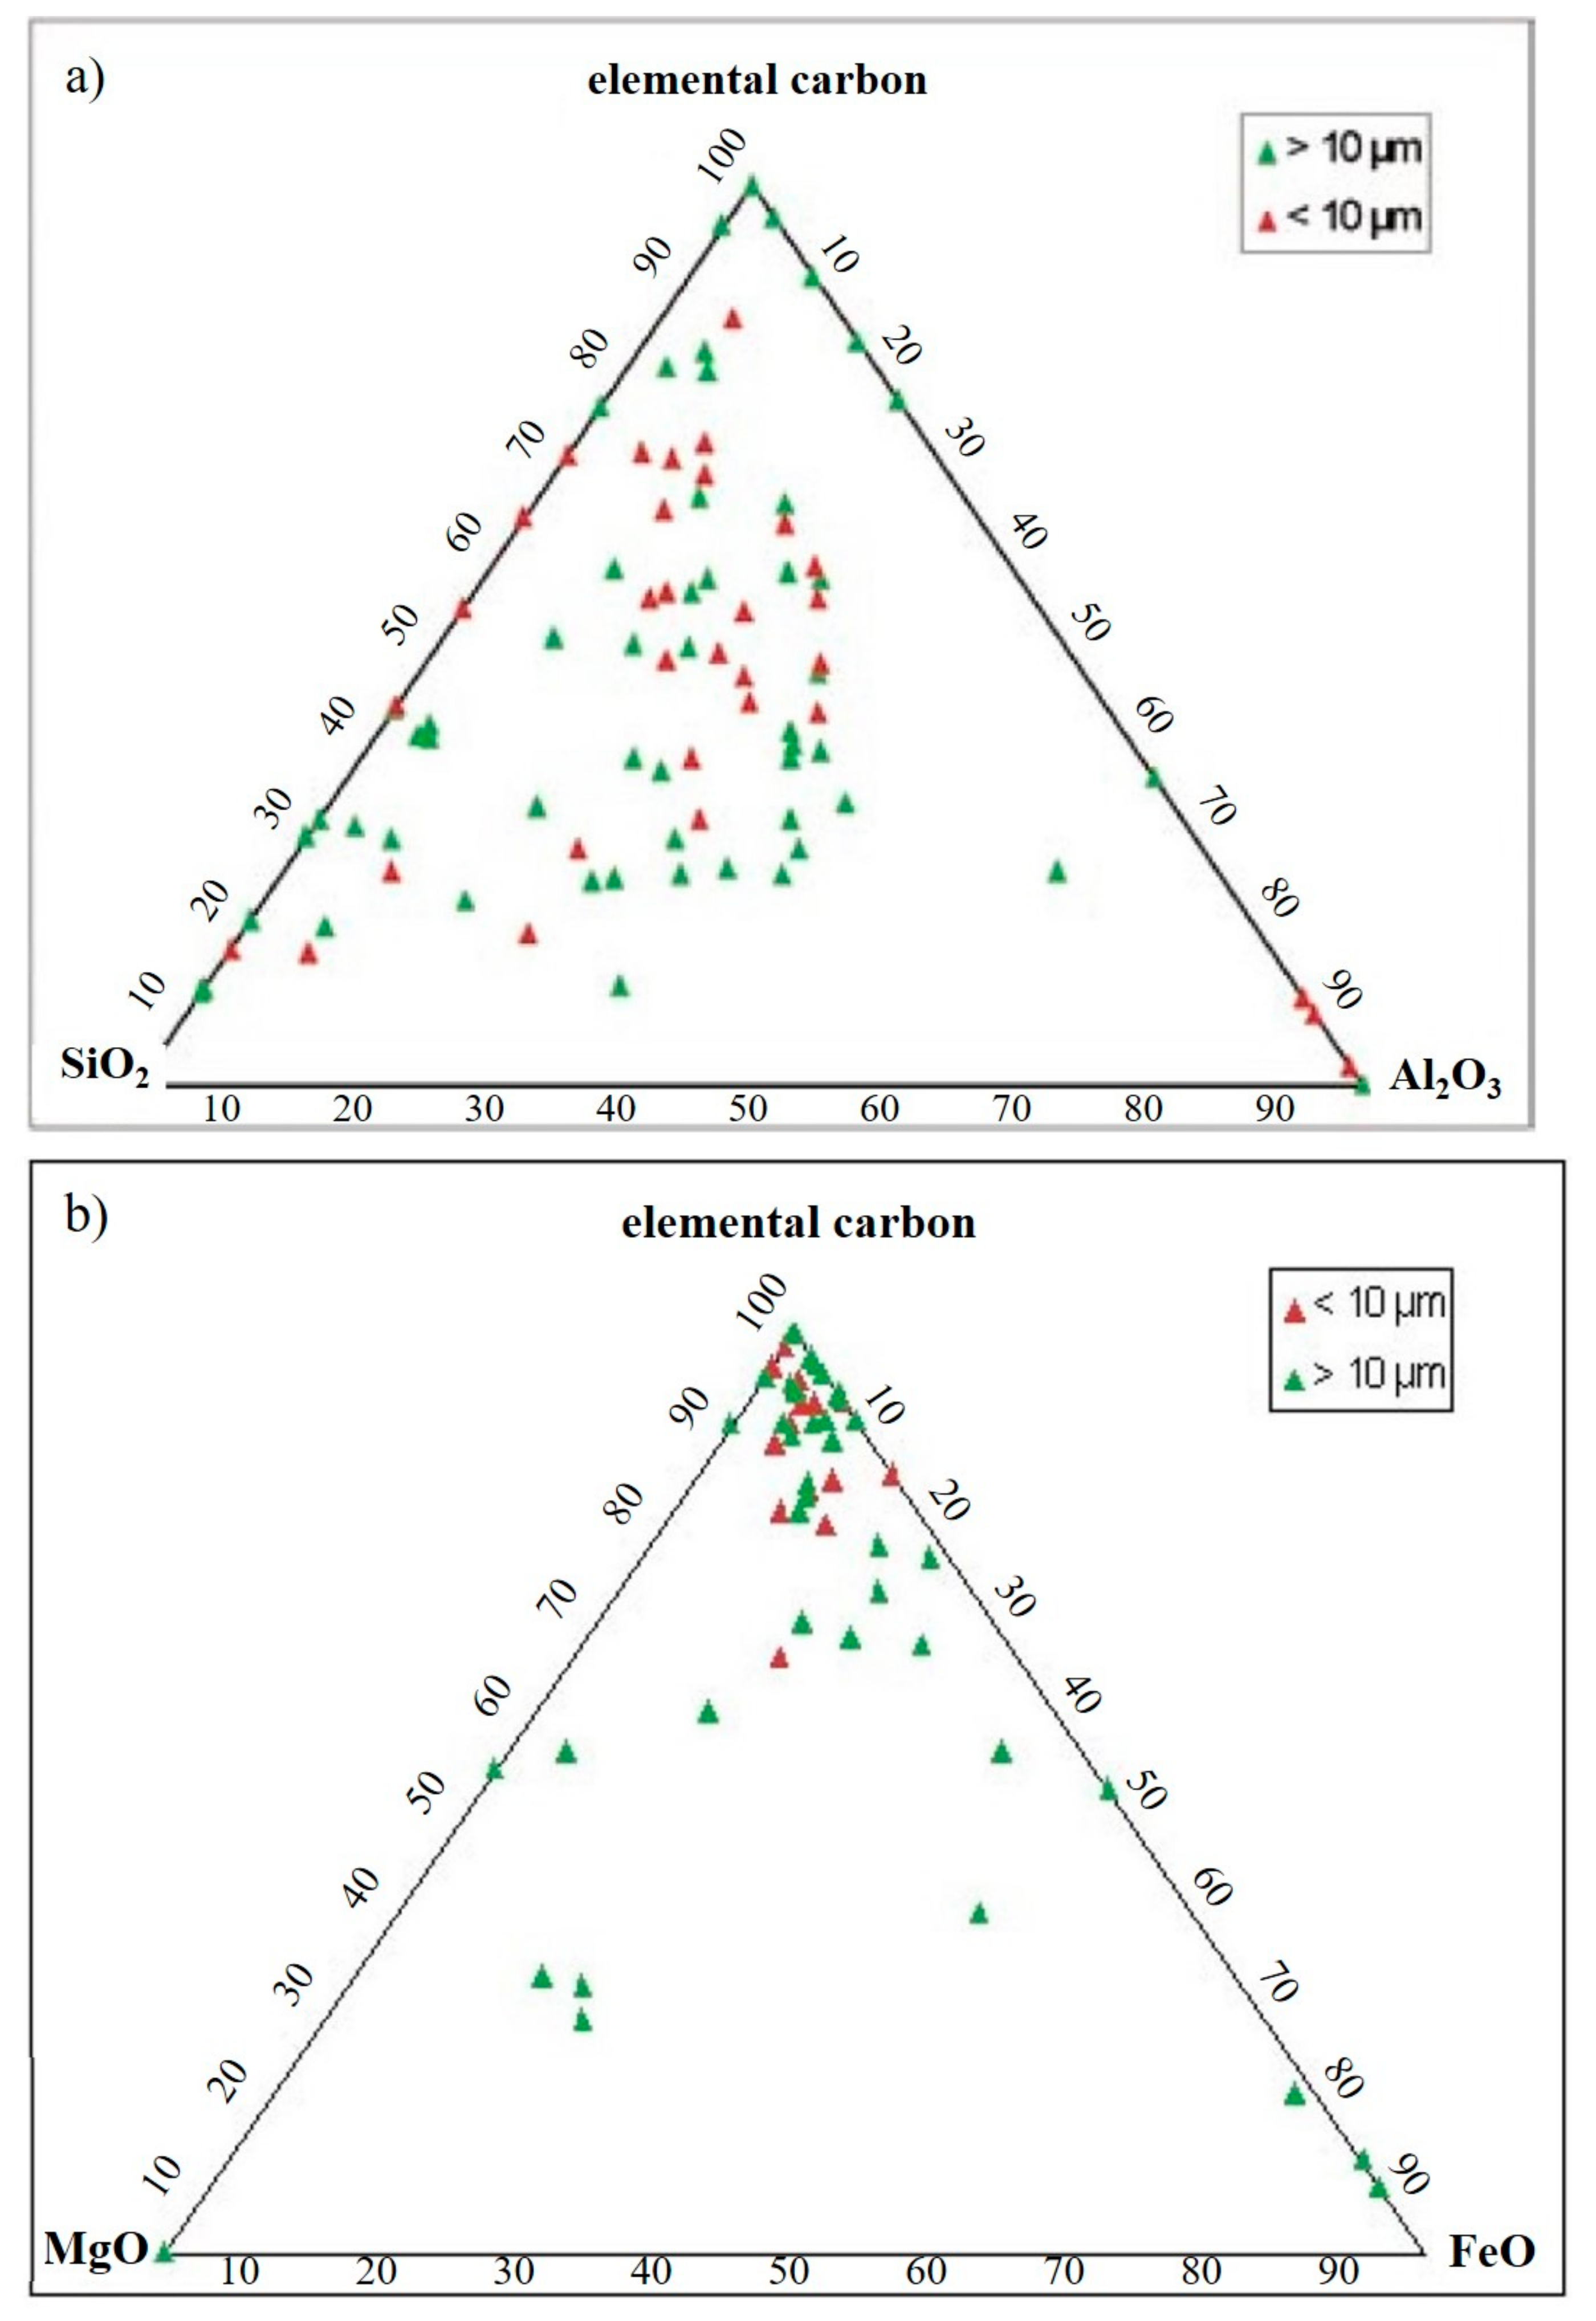
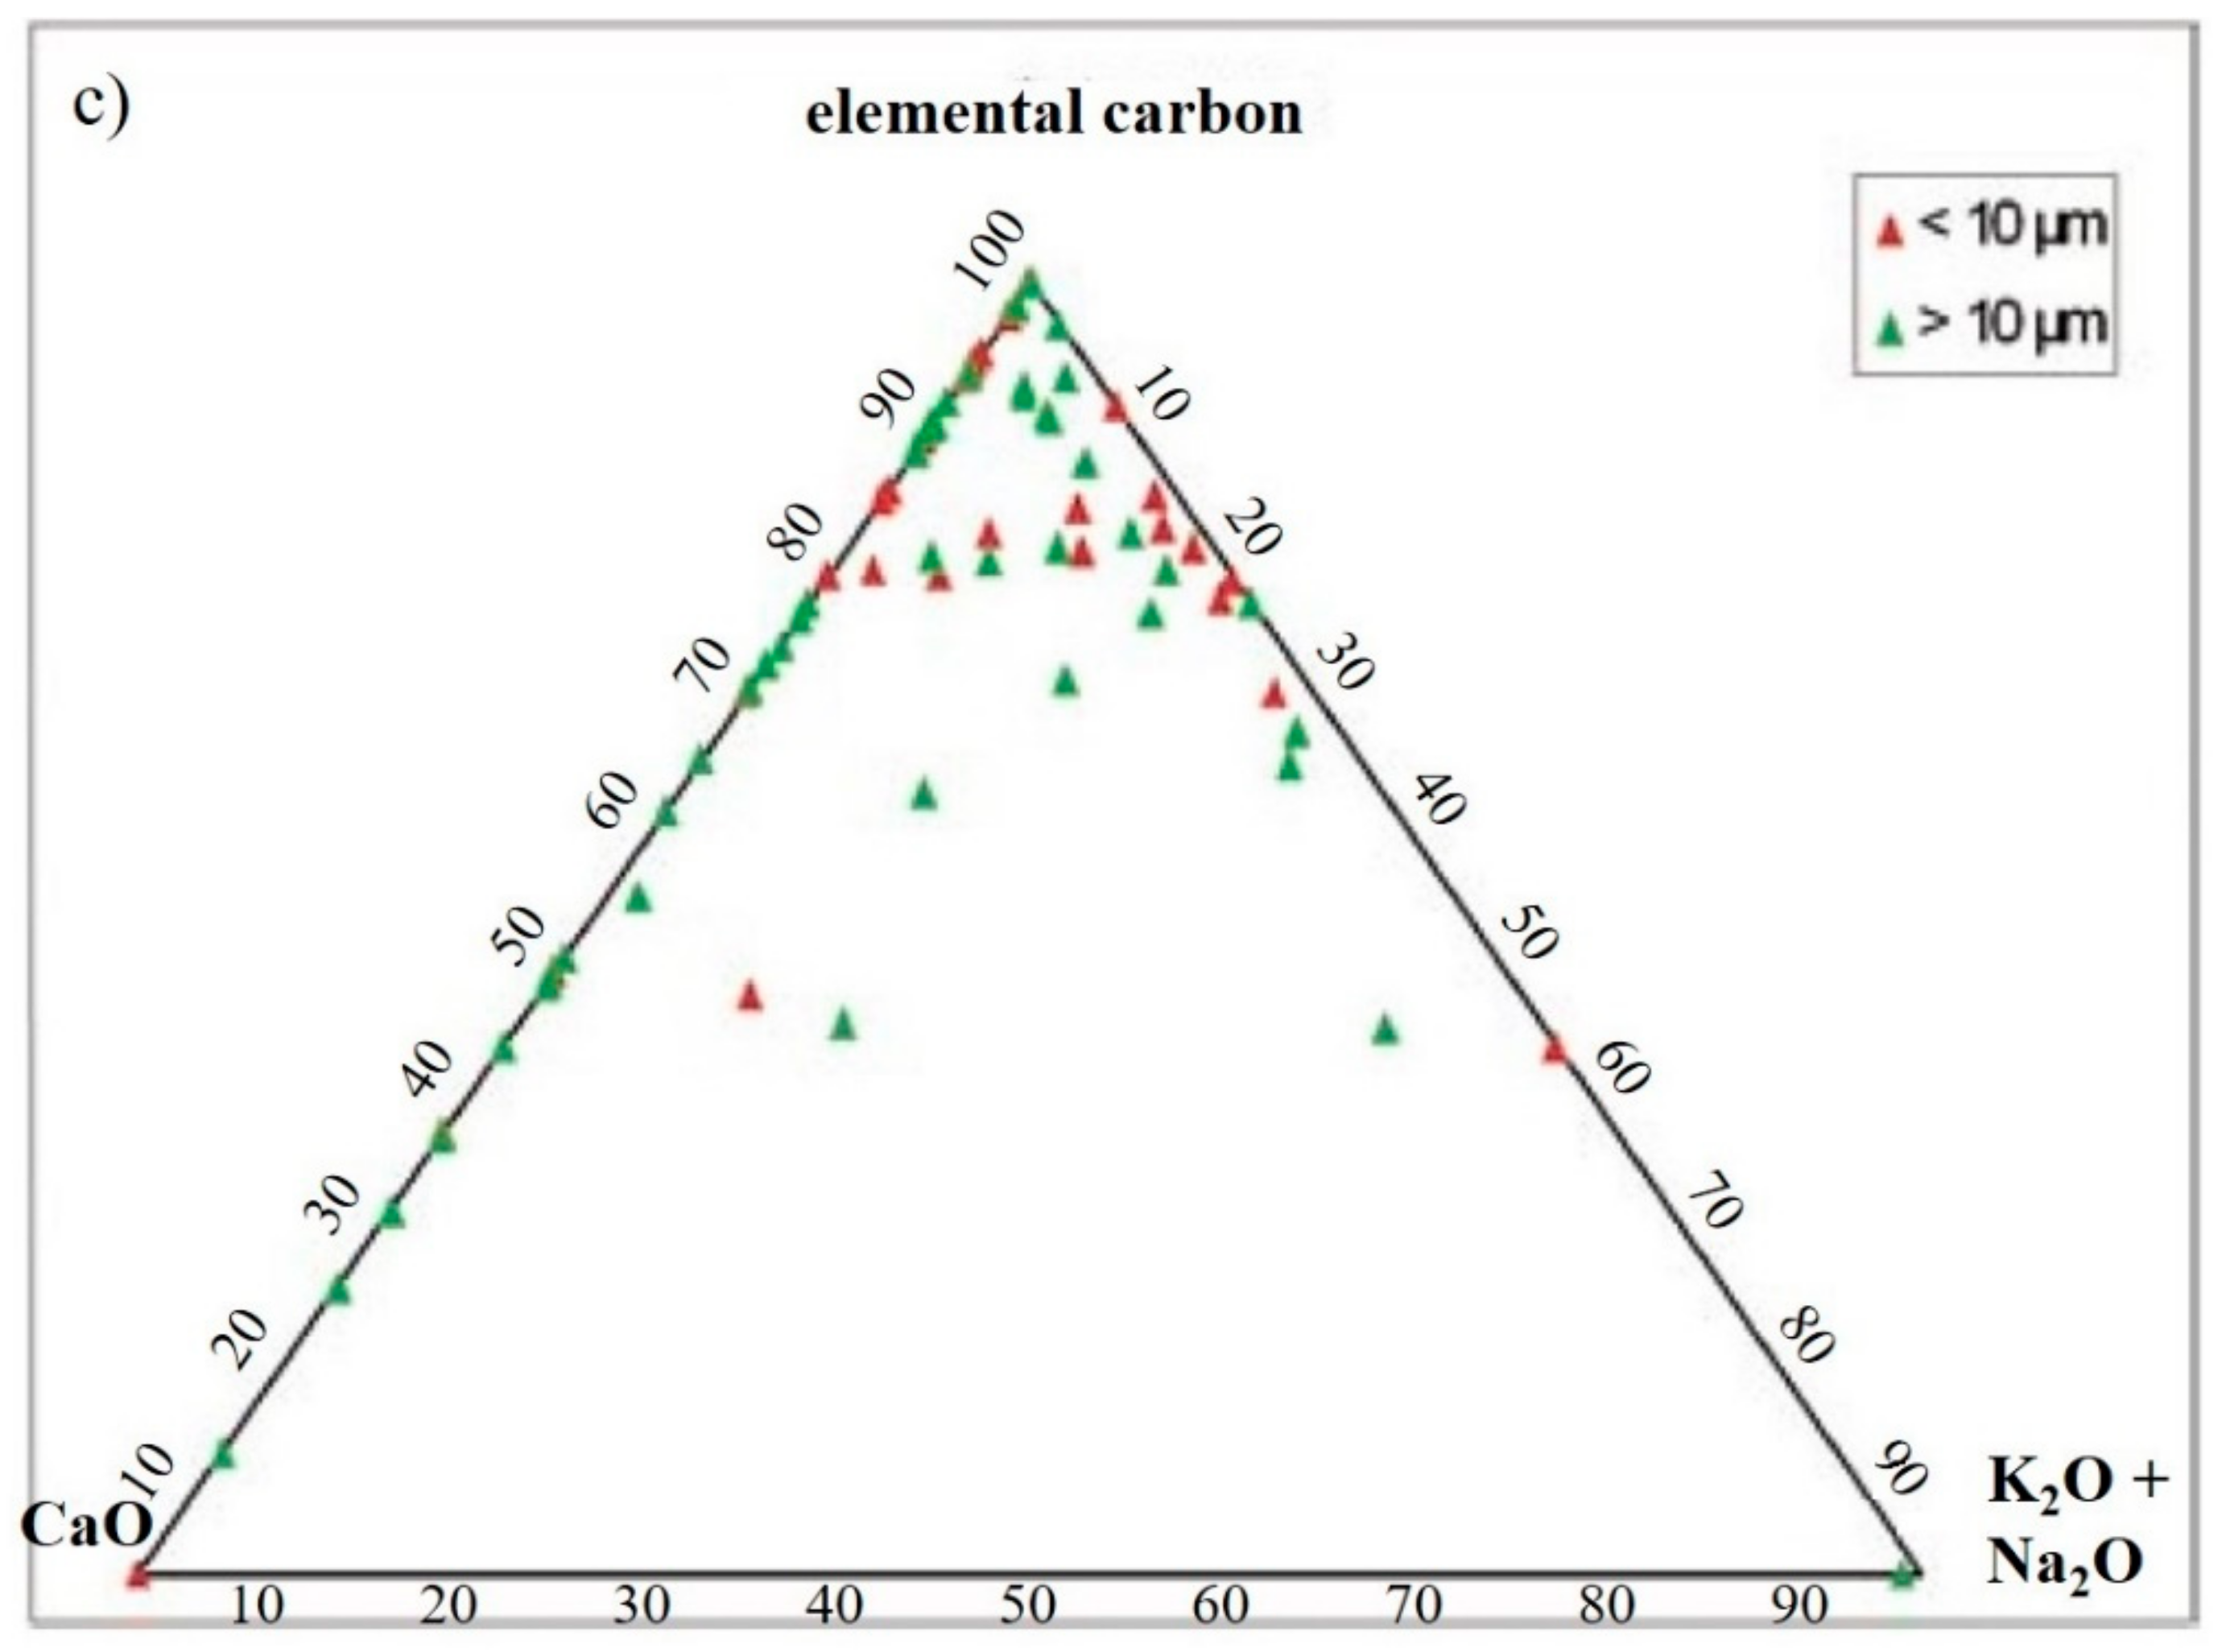
C-particles (Figure 6f) presented a large size and a rounded shape typical of traffic particles coming from the combustion of oils. The spectrum showed high peaks of C and O and very small Ca, Cl, and alkali peaks, which was probably related to the impurities present in the atmosphere.
Organic particles were mostly represented by pollens whose spectrum was characterized by C and O high peaks (see Figure 6g). The pollens analyzed belong to the Chenopodiaceae family form walnut (Figure 6g), pine (Figure 6h), and chicory (Figure 6i). Moreover, lichens (Figure 6j), one of the most important sources of natural stone degradation [68,69], were observed.

4. Discussion

On the Teflon® filters from the station of the Regional Environmental Protection Agency (ARPA Emilia Romagna), it was possible to characterize the particles observed at SEM-EDS as silicate (Figure 7a), carbonate, and C-particles (Figure 7b). Organic particles were also observed, belonging to the Chenopodiaceae family: for example, poplar pollens (Figure 7c).
Figure 8 shows the compositional differences between the inorganic and organic particles collected on the adhesive tapes in the urban location (our sampling) and on the Teflon® filters by ARPA Emilia Romagna, expressed in percentage. Since the sampling time on the Teflon® filters by ARPA is 5 continuous days, we compared the data only with the samples collected after 4 days, in order to have a more similar comparison. The data obtained show a very similar value percentage of the organic and inorganic particles collected in the same period of time.
The data obtained with the microanalysis were processed in order to obtain the weight percentage (wt%) of the relative oxides. These values were then compared with each other discriminating them on the basis of dimensional characteristics.
The values obtained from the silicate particles were plotted in binary variation diagrams in which the components Al2O3, FeO, MgO, CaO, K2O, and Na2O were plotted with respect to silica oxide (SiO2). The diagrams in Figure 9 show particles less than 10 μm and more than 10 μm, which were compared with each other and with the major natural components.
In detail, considering the diagram Al2O3 vs. SiO2 (Figure 9a), the particles show different values of silica oxide (between 0% and 100%) while very low values of aluminum oxide were observed with a maximum of 45 wt%; furthermore, there were no marked compositional differences between particles of different sizes. To verify the relationship between the compositions of the analyzed particles and the common particles from natural contribution, the compositions of clays, alkali-feldspar, and concrete were plotted in the diagram, using the data available in Deer et al. [70], which reports the analyses representative of the common particles from natural contribution. This comparison allowed to verify a significant contribution of natural elements. In particular, the group of particles characterized by a concentration of Al2O3 between 20 and 45 wt% had compositions comparable with those of clay minerals (kaolinite and illite) and alkaline silicates (feldspars), the origin of which could be defined as mainly natural, attributable to the clayey-silty matrix of the soils. However, it should be noted that some particles were characterized by a spherical shape, so they could be related to the combustion product of silicate particles. In addition, particles that deviated from the main trend were: (i) particles with low SiO2 values, generally characterized by spherical shapes that often aggregated on larger carbonaceous particles; and (ii) Al2O3 particles with the composition similar to that of a common cement. It was not a coincidence that these particles were mostly present in the samples collected in the industrial location.
The FeO vs. SiO2 diagram (Figure 9b) shows that particles with SiO2 < 60 wt% had a strong dispersion related to FeO concentrations and that there were no significant compositional differences between particles of different sizes. Furthermore, the composition of some clay minerals (illite, montmorillonite, and vermiculite) was comparable with that of the analyzed particles. On the other hand, high concentrations in SiO2 (>60 wt%) and low FeO contents (<3 wt%) were correlated exclusively on the coarser particles, and these compositions were not comparable with the chemistry of the common natural contribution.
MgO concentrations were comparable with those of FeO, and, in particular, the MgO vs. SiO2 diagram (Figure 9c) shows that there was no correlation between the two oxides. The particles showed different values of silica oxide (between 0% and 100%) while very low values of magnesium oxide were observed, with a maximum of 20 wt%. In addition, the presence of particles with anomalous MgO enrichments (around 20 wt%), with a composition similar to that of enstatite, should also be noted, even if these values still suggest the presence of non-natural products. In addition, in this case, the composition of some clay minerals (illite and montmorillonite) and biotite was plotted, which falls into the most abundant group of particles (below 10 wt% of MgO), confirming that the collected particles had a composition comparable to that of natural contribution, commonly present in the soils.
In the diagram CaO vs. SiO2 (Figure 9d), the clay minerals (illite, montmorillonite, and vermiculite) fell into the largest group of particles with CaO values < 10 wt%. Two groups were identified; a first group with trends along the mixing line between concretes and silicates (wollastonite), and a second group closer to the composition of the soils (clays).
In the diagram K2O vs. SiO2 (Figure 9e), plagioclase, biotite, clay minerals (vermiculite), and leucite were plotted, which allowed to compare the chemical composition of the analyzed particulate with the composition of biotite, plagioclase, and vermiculite. Of note were the particles with high K2O values (about 20 wt%), which could be produced by the interaction between the alkalis present in organic ash and the silicate matrix during the combustion processes [71,72]. In fact, these particles had a chemistry similar to that of leucite, which could testify the reaction of feldspar with the alkaline elements from the organic substance [73]. Therefore, this reaction could probably favor the combustion processes of silica-undersaturated phases [74], which are not present in the natural sediments of the Po Valley.
Finally, in the Na2O vs. SiO2 diagram (Figure 9f), all of the analyzed particles showed very low Na2O values (equal to or close to zero or below 1 wt%). These concentrations were comparable with those of common clay minerals (illite and vermiculite) and biotite. Moreover, higher values (around 10 wt%) were observed; these concentrations were higher than those that characterize the common natural contribution. In this case, the compositions were comparable with silica under-saturation phases and with nepheline, an uncommon mineral, which is not present in the sediments of the Po Valley.
Carbonate particles were mainly made up of calcite and dolomite; in many cases, they also showed the presence of oxides such as Al2O3, K2O, and Na2O. For this reason, a ternary diagram was created by relating carbonates, excess oxides, and elemental carbon. The values were obtained using the CIPW regulatory calculation method, with which the weight percentages of carbonates of Ca, Mg, Ca and Mg, Fe of the oxides of Ca, Mg, Al, K, and Na, as well as elemental carbon, were calculated; the latter two types were considered to be in excess, following the calculation of carbonates. From the ternary diagram of Figure 10, it could be observed that most of the particles tended to concentrate in the vertex of the carbonates. It should be emphasized that pure carbonates were stable at room temperature, while mixed compositions were obtained only at high temperatures or in combustion processes. The presence of mixed compositions could suggest the anthropic origin of many of the carbonates analyzed. This was particularly evident for iron-rich carbonates and for samples that often had excessive amounts of unburnt carbon. The presence of elemental carbon could confirm an anthropic origin, e.g., typical of the combustion of fuels (petrol and diesel). Other particles, on the other hand, tend to disperse toward the apex of the excess of oxides (CaO, MgO, Al2O3, K2O, and Na2O), which could suggest the presence, e.g., of nitrates [75,76,77].
For chlorine particles, the values of the elements of Cl, Na, and K, obtained by microanalysis, were considered. The values were plotted in a ternary diagram, discriminating the particles not from dimension but for their composition, as the chlorine was not only present in chlorine particles, but also in silicate, carbonate, and mixed ones. Looking at the ternary diagram (Figure 11), it could be seen that the particles were mixed chlorides of Na and K (mostly from Na than from K). This could suggest a natural origin, e.g., sea spray [78,79,80]. The silicate, carbonate, and mixed particles, instead, exhibited a completely different behavior: most of them were in fact distributed on the Cl-K side, with a dispersion parallel to the Na-K side. This could suggest that the Cl present in these particles was almost always linked to K, from which an anthropic source was deduced, e.g., of fertilizers [81,82].
For mixed particles, main oxides (SiO2, Al2O3, FeO, MgO, CaO, K2O, and Na2O) and elemental carbon were considered. As described above, the particles called “mixed” were those particles not well identified and devoid of elements that predominate over the others. This type of particles showed a typically silicate composition, but with high percentages of carbon, the contribution of which probably derived from the fact that most of these particles were aggregates deposited on cenosphere or pollen. Observing the binary diagram (SiO2 vs. Al2O3Figure 12), it could be seen that the mixed particles tend to distribute themselves in the same way as the silicate particles but are translated toward the lower values. This could be explained by a possible dilution: the presence of C acts as a diluent and therefore the relative percentages by weight of the oxides had lower values compared with those of the silicate particles [83,84].
The influence of carbon in the mixed particles was observed through the ternary diagrams of Figure 13, in which the particles were discriminated in relation to size (> 10 μm and <10 μm). The elemental C-SiO2-Al2O3 diagram (Figure 13a) shows a similar distribution of the two types of particles: both were composed mainly of SiO2 and elemental C, with a low value of Al2O3. Many particles deviated from the composition of the natural contribution but seemed to approach those of inert materials and such as concrete. In the elemental C-MgO-FeO diagram (Figure 13b), the particles with dimensions less than 10 μm were concentrated in the vertex of the elemental C, while the particles with dimensions greater than 10 μm tended to scatter toward the vertices of MgO and of FeO, while keeping the percentages of these oxides very low. Moreover, in this case, the strong contribution of anthropogenic carbon particles is shown. Finally, in the elemental C-CaO-K2O + Na2O diagram (Figure 13c), a greater concentration in the vertex of the elemental carbon toward the oxides of Ca and alkalis was observed concerning particles with dimensions greater than 10 μm. In particular, it was possible to note the presence of many plotted particles along the elemental C-CaO side, for which C was probably to be considered as oxide; thus, CO2. For particles with intermediate composition, the same assumptions made in the previous cases were applied, i.e., those related to an anthropic source and the formation of aggregates with a carbonaceous core [85,86].

5. Conclusions

The focus of the work presented was to characterize the chemical and morphological composition of particulate matter sampled in two different areas of the city of Ferrara. The sampling was performed in the summer of 2006 using adhesive tapes positioned both close to the industrial location of the city and in the urban location, in order to find out whether important differences occur between the two areas. This information could be important in understanding the impact of PM pollution on the cultural heritage of the city of Ferrara.
The analyses showed that there were no substantial differences between the industrial and urban locations considered. This could suggest that the dispersion of pollutants from the sources was fairly homogeneous in the city area.
The sampling method with adhesive substrates was indicated only for short-term sampling (no longer than 13–15 days) and during seasonal periods with not-too-high temperature and humidity, as they tend to deform, creating real swellings and compromising SEM observation, as a result.
The particle observation highlighted that dimensional differences were related to temporal variations; in fact, we observed an increase in the percentage of the particles with geometric diameters higher than 10 μm, with the increasing of time. This could be explained hypothesizing a progressive aggregation of the smaller fraction of particulate matter during the time, which tend to aggregate each other forming larger particles directly in the atmosphere.
On the basis of SEM-EDS microanalysis, different kinds of particles were observed: silicates and carbonates from natural origin; chlorides and C-particles were probably related to impurities present in the atmosphere. C-particles could affect the pollution and deterioration of the facades of the buildings in the historic center because they are particles that could easily accumulate pollutants.
This preliminary study highlighted that Ferrara was affected by an environmental pollution linked to the presence of particulate matter probably induced by industrial activities. The observations and the analytical data pointed out the need for further investigations to better define the features of the fine particulate matter. This will be useful not only to prevent human disease, but also to preserve the cultural heritage of this Medieval-Renaissance city.

Author Contributions

Conceptualization, E.M., C.T., and A.R.; methodology, E.M. and C.T.; formal analysis, E.M. and C.T.; investigation, E.M. and C.T.; resources, E.M.; data curation, E.M., C.T., and A.R.; writing—original draft preparation, C.T.; visualization, E.M. and C.T.; supervision, A.R.; project administration, E.M.; funding acquisition, E.M. All authors have read and agreed to the published version of the manuscript.

Funding

This research received no external funding.

Data Availability Statement

Not applicable.

Acknowledgments

We would like to thank Maria Rita Bovolenta for her precious help in analyzing samples by SEM-EDS.

Conflicts of Interest

The authors declare no conflict of interest.

References

  1. Council Directive 1999/30/EC of 22 April 1999 Relating to Limit Values for Sulphur Dioxide, Nitrogen Dioxide and Oxides of Nitrogen, Particulate Matter and Lead in Ambient Air. Available online: http://eur-lex.europa.eu/LexUriServ/LexUriServ.do?uri=OJ:L:1999:163:0041:0060:EN:PDF (accessed on 15 April 2021).
  2. Polica, S.; Sahu, S.K.; Pandit, G.G. Chemical characterization of atmospheric particulate matter and their source apportionment at an emerging industrial coastal city, Visakhapatnam, India. Atmos. Pollut. Res. 2016, 7, 725–733. [Google Scholar] [CrossRef] [Green Version]
  3. Rushingabigwi, G.; Nsengiyumva, P.; Sibomana, L.; Twizere, C.; Kalisa, W. Analysis of the atmospheric dust in Africa: The breathable dust’s fine particulate matter PM2.5 in correlation with carbon monoxide. Atmos. Environ. 2020, 224, 117319. [Google Scholar] [CrossRef]
  4. Zhang, C.; Zou, Z.; Chang, Y.; Zhang, Y.; Wang, X.; Yang, X. Source assessment of atmospheric fine particulate matter in a Chinese megacity: Insights from long-term, high-time resolution chemical composition measurements from Shanghai flagship monitoring supersite. Chemosphere 2020, 251, 126598. [Google Scholar] [CrossRef] [PubMed]
  5. De Rooij, M.M.T.; Smit, L.A.M.; Erbrink, H.J.; Hagenaars, T.J.; Hoek, G.; Ogink, N.W.M.; Winkel, A.; Heederik, D.J.J.; Wouters, I.M. Endotoxin and particulate matter emitted by livestock farms and respiratory health effects in neighboring residents. Environ. Int. 2019, 132, 105009. [Google Scholar] [CrossRef]
  6. Liu, Z.; Zhang, H.; Pan, W.; Xue, Q.; Fu, J.; Liu, G.; Zheng, M.; Zhang, A. A novel computational solution to the health risk assessment of air pollution via joint toxicity prediction: A case study on selected PAH binary mixtures in particulate matters. Ecotoxicol. Environ. Saf. 2019, 170, 427–435. [Google Scholar] [CrossRef]
  7. Francová, A.; Chrastný, V.; Vítková, M.; Šillerová, H.; Komárek, M. Health risk assessment of metal(loid)s in soil and particulate matter from industrialized regions: A multidisciplinary approach. Environ. Pollut. 2020, 260, 114057. [Google Scholar] [CrossRef]
  8. Qin, N.; Liang, P.; Wu, C.; Wang, G.; Xu, Q.; Xiong, X.; Wang, T.; Zolfo, M.; Segata, N.; Qin, H.; et al. Longitudinal survey of microbiome associated with particulate matter in a megacity. Genome Biol. 2020, 21, 55. [Google Scholar] [CrossRef] [Green Version]
  9. Ramírez, O.; Sánchez de la Campa, A.M.; Sánchez-Rodas, D.; De la Rosa, J.D. Hazardous trace elements in thoracic fraction of airborne particulate matter: Assessment of temporal variations, sources, and health risks in a megacity. Sci. Total Environ. 2020, 710, 136344. [Google Scholar] [CrossRef]
  10. Fermo, P.; Comite, V.; Ciantelli, C.; Sardella, A.; Bonazza, A. A multi-analytical approach to study the chemical composition of total suspended particulate matter (TSP) to assess the impact on urban monumental heritage in Florence. Sci. Total Environ. 2020, 740, 140055. [Google Scholar] [CrossRef]
  11. Samara, C.; Melfos, V.; Kouras, A.; Karali, E.; Zacharopoulou, G.; Kyranoudi, M.; Papadopoulou, L.; Pavlidou, E. Morphological and geochemical characterization of the particulate deposits and the black crust from the Triumphal Arch of Galerius in Thessaloniki, Greece: Implications for deterioration assessment. Sci. Total Environ. 2020, 734, 139455. [Google Scholar] [CrossRef]
  12. Kampa, M.; Castanas, E. Human Health Effects of Air Pollution. Environ. Pollut. 2008, 151, 362–367. [Google Scholar] [CrossRef]
  13. Kim, H.W.; Ahn, E.K.; Jee, B.K.; Yoon, H.K.; Lee, K.H.; Lim, Y. Nanoparticulate-Induced Toxicity and Related Mechanism in Vitro and in Vivo. J. Nanopart. Res. 2009, 11, 55–65. [Google Scholar] [CrossRef]
  14. Pacyna, J.M.; Pacyna, E.G. An Assessment of Global and Regional Emissions of Trace Metals to the Atmosphere from Anthropogenic Sources Worldwide. Environ. Res. 2001, 9, 269–298. [Google Scholar] [CrossRef]
  15. Askariyeh, M.H.; Venugopal, M.; Khreis, H.; Birt, A.; Zietsman, J. Near-Road Traffic-Related Air Pollution: Resuspended PM2.5 from Highways and Arterials. Int. J. Environ. Res. Public Health 2020, 17, 2851. [Google Scholar] [CrossRef]
  16. Candeias, C.; Vicente, E.; Tomé, M.; Rocha, F.; Ávila, P.; Célia, A. Geochemical, Mineralogical and Morphological Characterisation of Road Dust and Associated Health Risks. Int. J. Environ. Res. Public Health 2020, 17, 1563. [Google Scholar] [CrossRef] [Green Version]
  17. Lucarelli, F.; Calzolai, G.; Chiari, M.; Giardi, F.; Czelusniak, C.; Nava, S. Hourly Elemental Composition and Source Identification by Positive Matrix Factorization (PMF) of Fine and Coarse Particulate Matter in the High Polluted Industrial Area of Taranto (Italy). Atmosphere 2020, 11, 419. [Google Scholar] [CrossRef] [Green Version]
  18. Zeng, Q.; Tao, J.; Chen, L.; Zhu, H.; Zhu, S.; Wang, Y. Estimating Ground-Level Particulate Matter in Five Regions of China Using Aerosol Optical Depth. Remote Sens. 2020, 12, 881. [Google Scholar] [CrossRef] [Green Version]
  19. Dourado, T.A.; Gemeiner, H.; Gomes, A.C.F.; Almeida, E.; da Silva, A.C.; Valadão, N.; Menegário, A.A.; Govone, J.S.; Gastmans, D. Elemental Composition of Particulate Matter in the Southeastern Brazilian Ceramic Pole by Synchrotron Radiation X-ray Fluorescence Technique (SR-XRF). J. Braz. Chem. Soc. 2020, 31, 1203–1215. [Google Scholar] [CrossRef]
  20. Feng, S.X.; Pan, S.Q.; Wang, Y.R. Research on the Application of Porous Ceramic Waste Gas Purification Device in Ceramic Kiln. Mater. Sci. Forum 2020, 980, 410–418. [Google Scholar] [CrossRef]
  21. Liu, Z.; Bode, V.; Hadayati, P.; Onay, H.; Sudhölter, E.J.R. Understanding the stability mechanism of silica nanoparticles: The effect of cations and EOR chemicals. Fuel 2020, 280, 118650. [Google Scholar] [CrossRef]
  22. Conca, E.; Malandrino, M.; Giacomino, A.; Inaudi, P.; Buoso, S.; Bande, S.; Sacco, M.; Abollino, O. Contribution of the Incinerator to the Inorganic Composition of the PM10 Collected in Turin. Atmosphere 2020, 11, 400. [Google Scholar] [CrossRef] [Green Version]
  23. Di Ciaula, A.; Gentilini, P.; Diella, G.; Lopuzzo, M.; Ridolfi, R. Biomonitoring of Metals in Children Living in an Urban Area and Close to Waste Incinerators. Int. J. Environ. Res. Public Health 2020, 17, 1919. [Google Scholar] [CrossRef] [Green Version]
  24. Viskup, R.; Wolf, C.; Baumgartner, W. Qualitative and Quantitative Characterisation of Major Elements in Particulate Matter from In-use Diesel Engine Passenger Vehicles by LIBS. Energies 2020, 13, 368. [Google Scholar] [CrossRef] [Green Version]
  25. Giechaskiel, B. Particle Number Emissions of a Diesel Vehicle during and between Regeneration Events. Catalysts 2020, 10, 587. [Google Scholar] [CrossRef]
  26. Park, J.; Choi, I.; Oh, J.; Lee, C. Nitrogen Oxides and Particulate Matter from Marine Diesel Oil (MDO), Emulsified MDO, and Dimethyl Ether Fuels in Auxiliary Marine Engines. J. Mar. Sci. Eng. 2020, 8, 322. [Google Scholar] [CrossRef]
  27. Winkler, A.; Contardo, T.; Vannini, A.; Sorbo, S.; Basile, A.; Loppi, S. Magnetic Emissions from Brake Wear are the Major Source of Airborne Particulate Matter Bioaccumulated by Lichens Exposed in Milan (Italy). Appl. Sci. 2020, 10, 2073. [Google Scholar] [CrossRef] [Green Version]
  28. Bralewska, K.; Rakowska, J. Concentrations of Particulate Matter and PM-Bound Polycyclic Aromatic Hydrocarbons Released during Combustion of Various Types of Materials and Possible Toxicological Potential of the Emissions: The Results of Preliminary Studies. Int. J. Environ. Res. Public Health 2020, 17, 3202. [Google Scholar] [CrossRef]
  29. Dirks, K.N.; Chester, A.; Salmond, J.A.; Talbot, N.; Thornley, S.; Davy, P. Arsenic in Hair as a Marker of Exposure to Smoke from the Burning of Treated Wood in Domestic Wood Burners. Int J. Environ. Res. Public Health 2020, 17, 3944. [Google Scholar] [CrossRef] [PubMed]
  30. Lazaridis, M.; Katsivela, E.; Kopanakis, I.; Raisi, L.; Mihalopoulos, N.; Panagiaris, G. Characterization of airborne particulate matter and microbes inside cultural heritage collections. J. Cult. Herit. 2018, 30, 136–146. [Google Scholar] [CrossRef]
  31. Morillas, H.; Maguregui, M.; Gallego-Cartagena, E.; Marcaida, I.; Carral, N.; Madariaga, J.M. The influence of marine environment on the conservation state of Built Heritage: An overview study. Sci. Total Environ. 2020, 745, 140899. [Google Scholar] [CrossRef]
  32. Radulescu, C.; Stihi, C.; Ion, R.-M.; Dulama, I.-D.; Stanescu, S.-G.; Stirbescu, R.M.; Teodorescu, S.; Gurgu, I.-V.; Let, D.-D.; Olteanu, L.; et al. Seasonal Variability in the Composition of Particulate Matter and the Microclimate in Cultural Heritage Areas. Atmosphere 2019, 10, 595. [Google Scholar] [CrossRef] [Green Version]
  33. Park, S.S.; Kim, Y.J. Source contributions to fine particulate matter in an urban atmosphere. Chemosphere 2005, 59, 217–226. [Google Scholar] [CrossRef] [PubMed]
  34. England, G.C.; Watson, J.G.; Chow, J.C.; Zielinska, B.; Chang, M.C.O.; Loos, K.R.; Hidy, G.M. Dilution-Based Emissions Sampling from Stationary Sources: Part 1—Compact Sampler Methodology and Performance. J. Air Waste Manag. Assoc. 2007, 57, 65–78. [Google Scholar] [CrossRef] [PubMed]
  35. Planquette, H.; Sherrell, R.M. Sampling for particulate trace element determination using water sampling bottles: Methodology and comparison to in situ pumps. Limnol. Oceanogr. Methods 2012, 10. [Google Scholar] [CrossRef] [Green Version]
  36. Hassan, S.A.M. Multiscientific approach for the characterization and assessment of the degradation state of the historical Al-Shafi’i mosque walls (Jeddah, Kingdom of Saudi Arabia). Sci. Cult. 2021, 7, 1–19. [Google Scholar]
  37. Abu-Allaban, M.; El-Khalili, M.M.M. Antiquity impact of air pollution at Gadara, Jordan. Mediterr. Archaeol. Archaeom. 2014, 14, 191–199. [Google Scholar]
  38. Abdel-Kareem, O. Monitoring, controlling and prevention of the fungal deterioration of textile artifacts in the museum of jordanian heritage. Mediterr. Archaeol. Archaeom. 2010, 10, 85–96. [Google Scholar]
  39. Naif, A.H.; Fakhoury, L.A.; Sakr, Y.M. A critical anthology of international charters, conventions & principles on documentation of cultural heritage for conservation, monitoring & management. Mediterr. Archaeol. Archaeom. 2021, 21, 291–310. [Google Scholar]
  40. Lamhasni, T.; El-Marjaoui, H.; El Bakkali, A.; Lyazidi, S.A.; Haddad, M.; Ben-Ncer, A.; Benyaich, F.; Bonazza, A.; Tahri, M. Air pollution impact on architectural heritage of Morocco: Combination of synchronous fluorescence and ATR-FTIR spectroscopies for the analyses of black crusts deposits. Chemosphere 2019, 225, 517–523. [Google Scholar] [CrossRef]
  41. Silva, L.F.O.; Pinto, D.; Neckel, A.; Dotto, G.L.; Oliveira, M.L.S. The impact of air pollution on the rate of degradation of the fortress of Florianópolis Island, Brazil. Chemosphere 2020, 251, 126838. [Google Scholar] [CrossRef]
  42. Spezzano, P. Mapping the susceptibility of UNESCO World Cultural Heritage sites in Europe to ambient (outdoor) air pollution. Sci. Total Environ. 2021, 754, 142345. [Google Scholar] [CrossRef] [PubMed]
  43. La Russa, M.F.; Fermo, P.; Comite, V.; Belfiore, C.M.N.; Barca, D.; Carioni, A.; De Santis, M.; Barbagallo, L.F.; Ricca, M.; Ruffolo, S.A. The Oceanus statue of the Fontana di Trevi (Rome): The analysis of black crust as a tool to investigate the urban air pollution and its impact on the stone degradation. Sci. Total Environ. 2017, 593–594, 297–309. [Google Scholar] [CrossRef]
  44. Comite, V.; Fermo, P. The effects of air pollution on cultural heritage: The case study of Santa Maria delle Grazie al Naviglio Grande (Milan). Eur. Phys. J. Plus 2018, 133, 556. [Google Scholar] [CrossRef]
  45. Marrocchino, E.; Telloli, C.; Vaccaro, C. Geochemical and Mineralogical Characterization of Construction Materials from Historical Buildings of Ferrara (Italy). Geosciences 2021, 11, 31. [Google Scholar] [CrossRef]
  46. Directive 2004/107/EC of the European Parliament and of the Council Relating to Arsenic, Cadmium, Mercury, Nickel and Polycyclic Aromatic Hydrocarbons in Ambient Air (Fourth Daughter Directive). Available online: https://eur-lex.europa.eu/LexUriServ/LexUriServ.do?uri=OJ:L:2005:023:0003:0016:EN:PDF (accessed on 15 April 2021).
  47. European Parliament. Consolidated Text: Directive 2008/50/EC of the European Parliament and of the Council of 21 May 2008 on Ambient Air Quality and Cleaner Air for Europe; European Parliament: Brussels, Belgium, 2008. [Google Scholar]
  48. Grau-Bové, J.; Strlič, M. Fine particulate matter in indoor cultural heritage: A literature review. Herit. Sci. 2013, 1, 8. [Google Scholar] [CrossRef] [Green Version]
  49. Kuzmichev, A.A.; Azarov, V.N.; Stefanenko, I.V. The Impact of Dust Particles on Cultural Heritage Objects in the Field of Environmental Mechanics. Appl. Mech. Mater. 2018, 878, 259–262. [Google Scholar] [CrossRef]
  50. Fettweis, M.; Francken, F.; Pison, V.; Van den Eynde, D. Suspended particulate matter dynamics and aggregate sizes in a high turbidity area. Mar. Geol. 2006, 235, 63–74. [Google Scholar] [CrossRef]
  51. Cates, A.M.; Ruark, M.D.; Hedtcke, J.L.; Posner, J.L. Long-term tillage, rotation and perennialization effects on particulate and aggregate soil organic matter. Soil Tillage Res. 2016, 155, 371–380. [Google Scholar] [CrossRef]
  52. Willis, R.D.; Blanchard, F.T.; Conner, T.L. Guidelines for the Application of SEM/EDX Analytical Techniques to Particulate Matter Samples; EPA-600/R-02-070; U.S. Environmental Protection Agency: Research Triangle Park, NC, USA, 2002. [Google Scholar]
  53. Shi, Z.; Shao, L.; Jones, T.P.; Whittaker, A.G.; Lu, S.; Bérubé, K.A.; He, T.; Richards, R.J. Characterization of airborne individual particles collected in an urban area, a satellite city and a clean air area in Beijing, 2001. Atmos. Environ. 2003, 37, 4097–4108. [Google Scholar] [CrossRef]
  54. Ebert, M.; Weinbruch, S.; Hoffmann, P.; Ortner, H.M. The chemical composition and complex refractive index of rural and urban influenced aerosols determined by individual particle analysis. Atmos. Environ. 2004, 38, 6531–6545. [Google Scholar] [CrossRef]
  55. Ghirardo, D.Y. Lucrezia Borgia’s Palace in Renaissance Ferrara. J. Soc. Archit. Hist. 2005, 64, 474–497. [Google Scholar] [CrossRef]
  56. Caglioti, B. Costabili Palace and the Architecture “All’Antica” in Ferrara at the End of the XV Century. Athens J. Archit. 2021, 7, 173–198. [Google Scholar]
  57. Arpae Emilia Romagna. Rapporto Sulla Qualità dell’Aria del Comune di Ferrara—Dati 2006; Arpae Emilia Romagna: Bologna, Italy, 2006. [Google Scholar]
  58. Telloli, C. Metal concentrations in snow samples in an urban area in the Po Valley. Int. J. Geosci. 2014, 5, 116–1136. [Google Scholar] [CrossRef] [Green Version]
  59. Telloli, C.; Chicca, M.; Leis, M.; Vaccaro, C. Fungal spores and pollen in particulate matter collected during agricultural activities in the Po Valley (Italy). J. Environ. Sci. 2016, 46, 229–240. [Google Scholar] [CrossRef]
  60. Wilkinson, K.; Lundkvist, J.; Seisenbaeva, G.; Kessler, V. New tabletop SEM-EDS-based approach for cost-efficient monitoring of airborne particulate matter. Environ. Pollut. 2011, 159, 311–318. [Google Scholar] [CrossRef]
  61. Moreno, T.; Gibbons, W.; Jones, T.; Richards, R. The geology of ambient aerosols: Characterising urban and rural/coastal silicate PM10–2.5 and PM2.5 using high-volume cascade collection and scanning electron microscopy. Atmos. Environ. 2003, 37, 4265–4276. [Google Scholar] [CrossRef]
  62. Telloli, C.; Malaguti, A.; Mircea, M.; Tassinari, R.; Vaccaro, C.; Berico, M. Properties of agricultural aerosol released during wheat harvest threshing, plowing and sowing. J. Environ. Sci. 2014, 26, 1903–1912. [Google Scholar] [CrossRef]
  63. Telloli, C.; Chicca, M.; Pepi, S.; Vaccaro, C. Saharan dust particles in snow samples of Alps and Apennines during an exceptional event of transboundary air pollution. Environ. Monit. Assess. 2018, 190, 37. [Google Scholar] [CrossRef]
  64. Calparsoro, E.; Maguregui, M.; Giakoumaki, A.; Morillas, H.; Madariaga, J.M. Evaluation of black crust formation and soiling process on historical buildings from the Bilbao metropolitan area (north of Spain) using SEM-EDS and Raman microscopy. Environ. Sci. Pollut. Res. 2017, 24, 9468–9480. [Google Scholar] [CrossRef]
  65. Silva, L.T.; Mendes, B.; Oliveira, C.; Reis, C.; Silva, P.L.; Silva, J.F. Monitoring the potential effect of particulate matter on cultural heritage. Contribution of an environmental monitoring system. In Proceedings of the IRAS 2019—First International Symposium on Risk Analysis and Safety of Complex Structures and Components, Porto, Portugal, 1–2 July 2019; pp. 312–314. [Google Scholar]
  66. Chen, X.; Zhang, Y.; Huo, H.; Wu, Z. Study of high tensile strength of natural continuous basalt fibers. J. Nat. Fibers 2020, 17, 214–222. [Google Scholar] [CrossRef]
  67. D.M. 20 Maggio 1991. Criteri per la Raccolta Dei Dati Inerenti la Qualità dell’Aria. G.U. 1991 n.126. Available online: https://www.isprambiente.gov.it/files/aria/d.m.20maggio-1991.pdf (accessed on 15 April 2021).
  68. Ozvan, A.; Dincer, I.; Akin, M.; Oyan, V.; Tapan, M. Experimental studies on ignimbrite and the effect of lichens and capillarity on the deterioration of Seljuk Gravestones. Eng. Geol. 2015, 185, 81–95. [Google Scholar] [CrossRef]
  69. Sohrabi, M.; Favero-Longo, S.F.; Pérez-Ortega, S.; Ascaso, C.; Haghighat, Z.; Talebian, M.H.; Fadaei, H.; de los Rios, A. Lichen colonization and associated deterioration processes in Pasargadae, UNESCO world heritage site, Iran. Int. Biodeter. Biodeg. 2017, 117, 171–182. [Google Scholar] [CrossRef]
  70. Deer, W.A.; Howie, R.A.; Zussman, J. An Introduction to the Rock-Forming Minerals; Longman Scientific & Technical: London, UK, 1992. [Google Scholar]
  71. Tomohiro, K.; Satoshi, K. Identification of Individual Si-Rich Particles Derived from Kosa Aerosol by the Alkali Elemental Composition. Bull. Chem Soc. Jpn. 2001, 74, 723–729. [Google Scholar]
  72. Leong, H.Y.; Leong Ong, D.E.; Sanjayan, J.G.; Nazari, A. The effect of different Na2O and K2O ratios of alkali activator on compressive strength of fly ash based-geopolymer. Constr. Build. Mater. 2016, 106, 500–511. [Google Scholar] [CrossRef] [Green Version]
  73. Li, X.; Zhi, L.; Shi, W.; Kong, L.; Bai, J.; Yu, J.; Reinmoller, M.; Guhl, S.; Meyer, B.; Li, W. Effect of K2O/Na2O on fusion behavior of coal ash with high silicon and aluminum level. Fuel 2020, 265, 116964. [Google Scholar] [CrossRef]
  74. Henderson, C.M.B. Composition, Thermal Expansion and Phase Transitions in Framework Silicates: Revisitation and Review of Natural and Synthetic Analogues of Nepheline-, Feldspar- and Leucite-Mineral Groups. Solids 2021, 2, 1–49. [Google Scholar] [CrossRef]
  75. Galindo, N.; Yubero, E.; Clemente, A.; Nicolas, J.F.; Varea, M.; Crespo, J. PM events and changes in the chemical composition of urban aerosols: A case study in the western Mediterranean. Chemosphere 2020, 244, 125520. [Google Scholar] [CrossRef]
  76. Wang, Y.; Tang, G.; Zhao, W.; Yang, Y.; Wang, L.; Liu, Z.; Wen, T.; Cheng, M.; Wang, Y.; Wang, Y. Different roles of nitrate and sulfate in air pollution episodes in the North China Plain. Atmos. Environ. 2020, 224, 117325. [Google Scholar] [CrossRef]
  77. Kakavas, S.; Pandis, S.N. Effects of urban dust emissions on fine and coarse PM levels and composition. Atmos. Environ. 2021, 246, 118006. [Google Scholar] [CrossRef]
  78. Dimitriou, K.; Paschalidou, A.K.; Kassomenos, P.A. Distinct synoptic patterns and air masses responsible for long-range desert dust transport and sea spray in Palermo, Italy. Theor. Appl. Climatol. 2017, 130, 1123–1132. [Google Scholar] [CrossRef]
  79. Bertram, T.H.; Cochran, R.E.; Grassian, V.H.; Stone, E.A. Sea spray aerosol chemical composition: Elemental and molecular mimics for laboratory studies of heterogeneous and multiphase reactions. Chem. Soc. Rev. 2018, 47, 2374–2400. [Google Scholar] [CrossRef] [PubMed]
  80. Gregoris, E.; Morabito, E.; Barbaro, E.; Feltracco, M.; Toscano, G.; Merico, E.; Grasso, F.M.; Cesari, D.; Conte, M.; Contini, D.; et al. Chemical characterization and source apportionment of size-segregated aerosol in the port-city of Venice (Italy). Atmos. Pollut. Res. 2021, 12, 261–271. [Google Scholar] [CrossRef]
  81. Agbede, T.M.; Adekiya, A.O.; Eifediyi, E.K. Impact of poultry manure and NPK fertilizer on soil physical properties and growth and yield of carrot. J. Hortic. Res. 2017, 25, 81–88. [Google Scholar] [CrossRef] [Green Version]
  82. Merico, E.; Grasso, F.M.; Cesari, D.; Decesari, S.; Belosi, F.; Manarini, F.; De Nuntiis, P.; Rinaldi, M.; Gambaro, A.; Morabito, E.; et al. Characterisation of atmospheric pollution near an industrial site with a biogas production and combustion plant in southern Italy. Sci. Total Environ. 2020, 717, 137220. [Google Scholar] [CrossRef] [PubMed]
  83. Bove, M.C.; Brotto, P.; Calzolai, G.; Cassola, F.; Cavalli, F.; Fermo, P.; Hjorth, J.; Massabò, D.; Nava, S.; Piazzalunga, A.; et al. Prati PM10 source apportionment applying PMF and chemical tracer analysis to ship-borne measurements in the Western Mediterranean. Atmos. Environ. 2016, 125, 140–151. [Google Scholar] [CrossRef]
  84. Daellenbach, K.R.; Stefenelli, G.; Bozzetti, C.; Vlachou, A.; Fermo, P.; Gonzalez, R.; Piazzalunga, A.; Colombi, C.; Canonaco, F.; Hueglin, C.; et al. Prévôt Long-term chemical analysis and organic aerosol source apportionment at nine sites in central Europe: Source identification and uncertainty assessment. Atmos. Chem. Phys. 2017, 17, 13265–13282. [Google Scholar] [CrossRef] [Green Version]
  85. Malaguti, A.; Mircea, M.; La Torretta, T.M.G.; Telloli, C.; Petralia, E.; Stracquadanio, M.; Berico, M. Comparison of online and offline methods for measuring fine secondary inorganic ions and carbonaceous aerosols in the Central Mediterranean area. Aerosol Air Qual. Res. 2015, 15, 2641–2653. [Google Scholar] [CrossRef] [Green Version]
  86. Patino, D.; Pérez-Orozco, R.; Porteiro, J.; Lapuerta, M. Characterization of biomass PM emissions using thermophoretic sampling: Composition and morphological description of the carbonaceous residues. J. Aerosol Sci. 2019, 127, 49–62. [Google Scholar] [CrossRef]
Figure 1. Map of the sampling sites. On the top left is the Emilia Romagna with the city of Ferrara. On the right side is the map of Ferrara city, where the industrial location (in the yellow circle, top left) and the urban location (in the yellow circle, bottom right) are shown: the red circle shows the position of the ARPA active sampling location for PM10 monitoring. On the top right, an example of adhesive tapes applied on the surface of the road signs is shown.
Geosciences 11 00227 g001
Figure 2. Percentage of the average of particles observed on the filters collected in the two different sampling sites (urban location and industrial location). The blue part represents the PM collection after 4 days; the red part, after 8 days; the green part, after 14 days; and the yellow part, after 18 days.
Geosciences 11 00227 g002
Figure 3. SEM images of the adhesive tape: (a) before the sampling (scale: 60 μm) and relative X-ray microanalysis; (b) and (c) after 14 days of sampling.
Geosciences 11 00227 g003
Figure 4. Some example of rounded particles: (a) cenosphere; (b) pollen; (c) NaCl particles growing on a cenosphere.
Geosciences 11 00227 g004
Figure 5. Relative percentages of the mean values of multiple measurements related to the dimensional differences of particles collected for each sampling periods analyzed (4, 8, 14, and 18 days).
Geosciences 11 00227 g005
Figure 6. Some examples of the particles collected on adhesive tapes and analyzed by SEM-EDS, on the left side, the photo image of the particles, and on the right side, the related spectrum: (a) aggregates; (b) silicate; (c) carbonate; (d) chloride; (e) sulphate; (f) carbon particle; (gi) Chenopodiaceae pollen; (j) lichens.
Geosciences 11 00227 g006aGeosciences 11 00227 g006bGeosciences 11 00227 g006c
Figure 7. Some examples of the particles collected on Teflon® filters by ARPA Emilia Romagna and observed by SEM-EDS: (a) silicate; (b) C-particle; (c) organic particle.
Geosciences 11 00227 g007
Figure 8. Average percentage of the inorganic and organic particles collected on the adhesive tapes, which were collected in the urban location and compared with particles collected on the Teflon® filters by ARPA Emilia Romagna.
Geosciences 11 00227 g008
Figure 9. Binary diagrams of silica oxide, compared with other element oxides, and expressed in weight oxide percentage (wt%), based on the data of Deer et al. [70], and related to: (a) Al2O3 vs. SiO2; (b) FeO vs. SiO2; (c) MgO vs. SiO2.; (d) CaO vs. SiO2; (e) K2O vs. SiO2; (f) Na2O vs. SiO2.
Geosciences 11 00227 g009aGeosciences 11 00227 g009bGeosciences 11 00227 g009c
Figure 10. Ternary diagram between elemental carbon, carbonates, and major oxides (surplus in CaO, MgO, K2O, Na2O, and Al2O3), expressed as weight oxide percentage (wt%).
Geosciences 11 00227 g010
Figure 11. Ternary diagram between chlorine (Cl), sodium (Na), and potassium (K), expressed as weight percentage (wt%), in which silicate, chloride, carbonate, and mixed particles were observed.
Geosciences 11 00227 g011
Figure 12. Binary diagram between Al2O3 and SiO2 of the mixed particles (blue and violet colors) compared with the silicate particles (yellow and red colors), expressed in weight oxide percentage (wt%).
Geosciences 11 00227 g012
Figure 13. Ternary diagram expressed in weight oxide percentage (wt%) comparing particles less than 10 μm (colored in red) and more than 10 μm (colored in green). The diagrams are related to: (a) elemental carbon, SiO2, Al2O3; (b) elemental carbon, MgO, FeO; (c) elemental carbon, CaO, K2O + Na2O.
Geosciences 11 00227 g013aGeosciences 11 00227 g013b
Publisher’s Note: MDPI stays neutral with regard to jurisdictional claims in published maps and institutional affiliations.

