3.1 General case
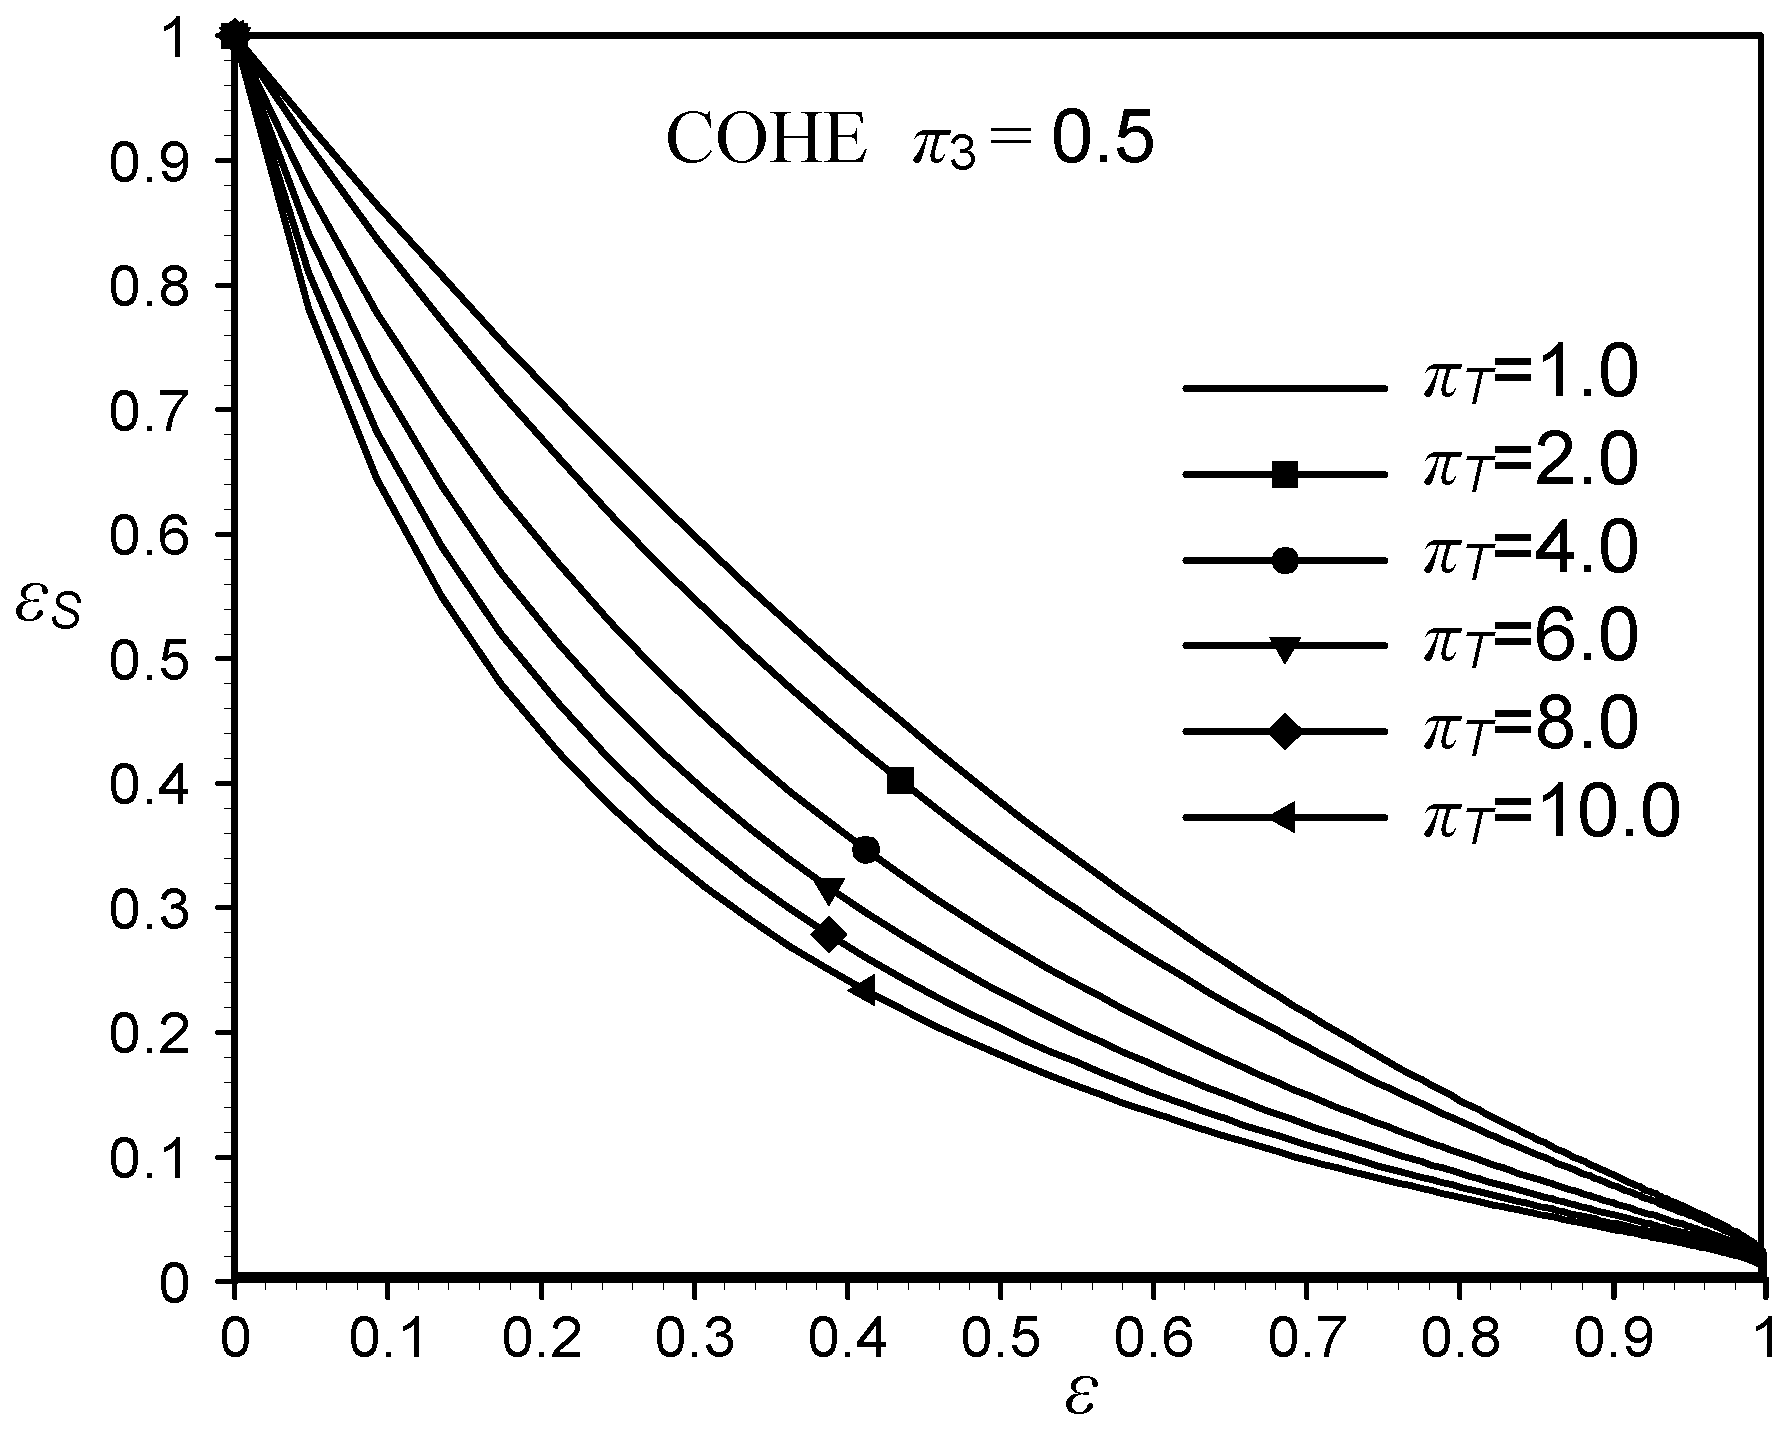
Figure 1a.
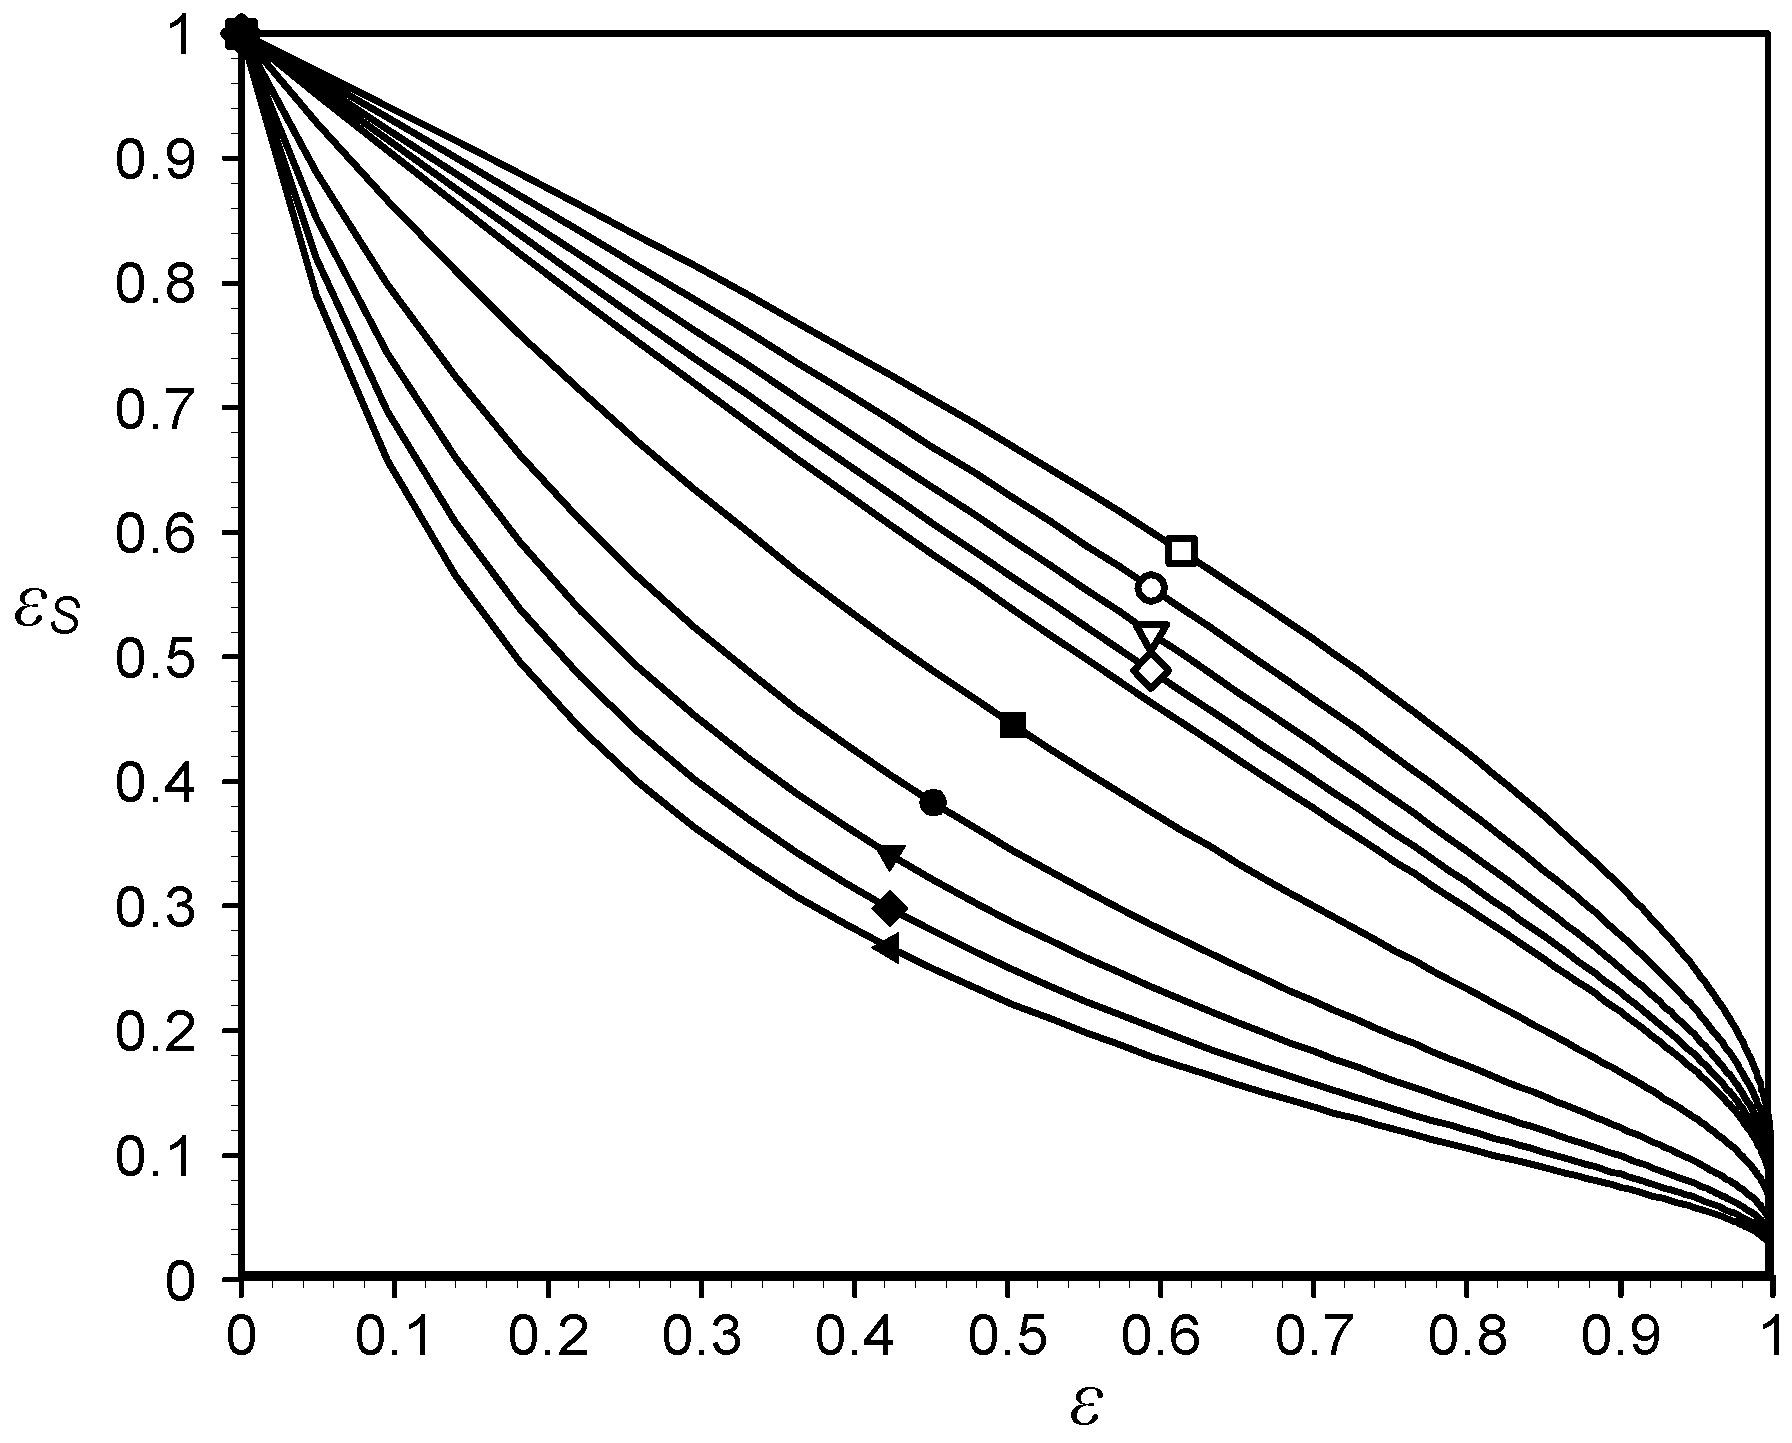
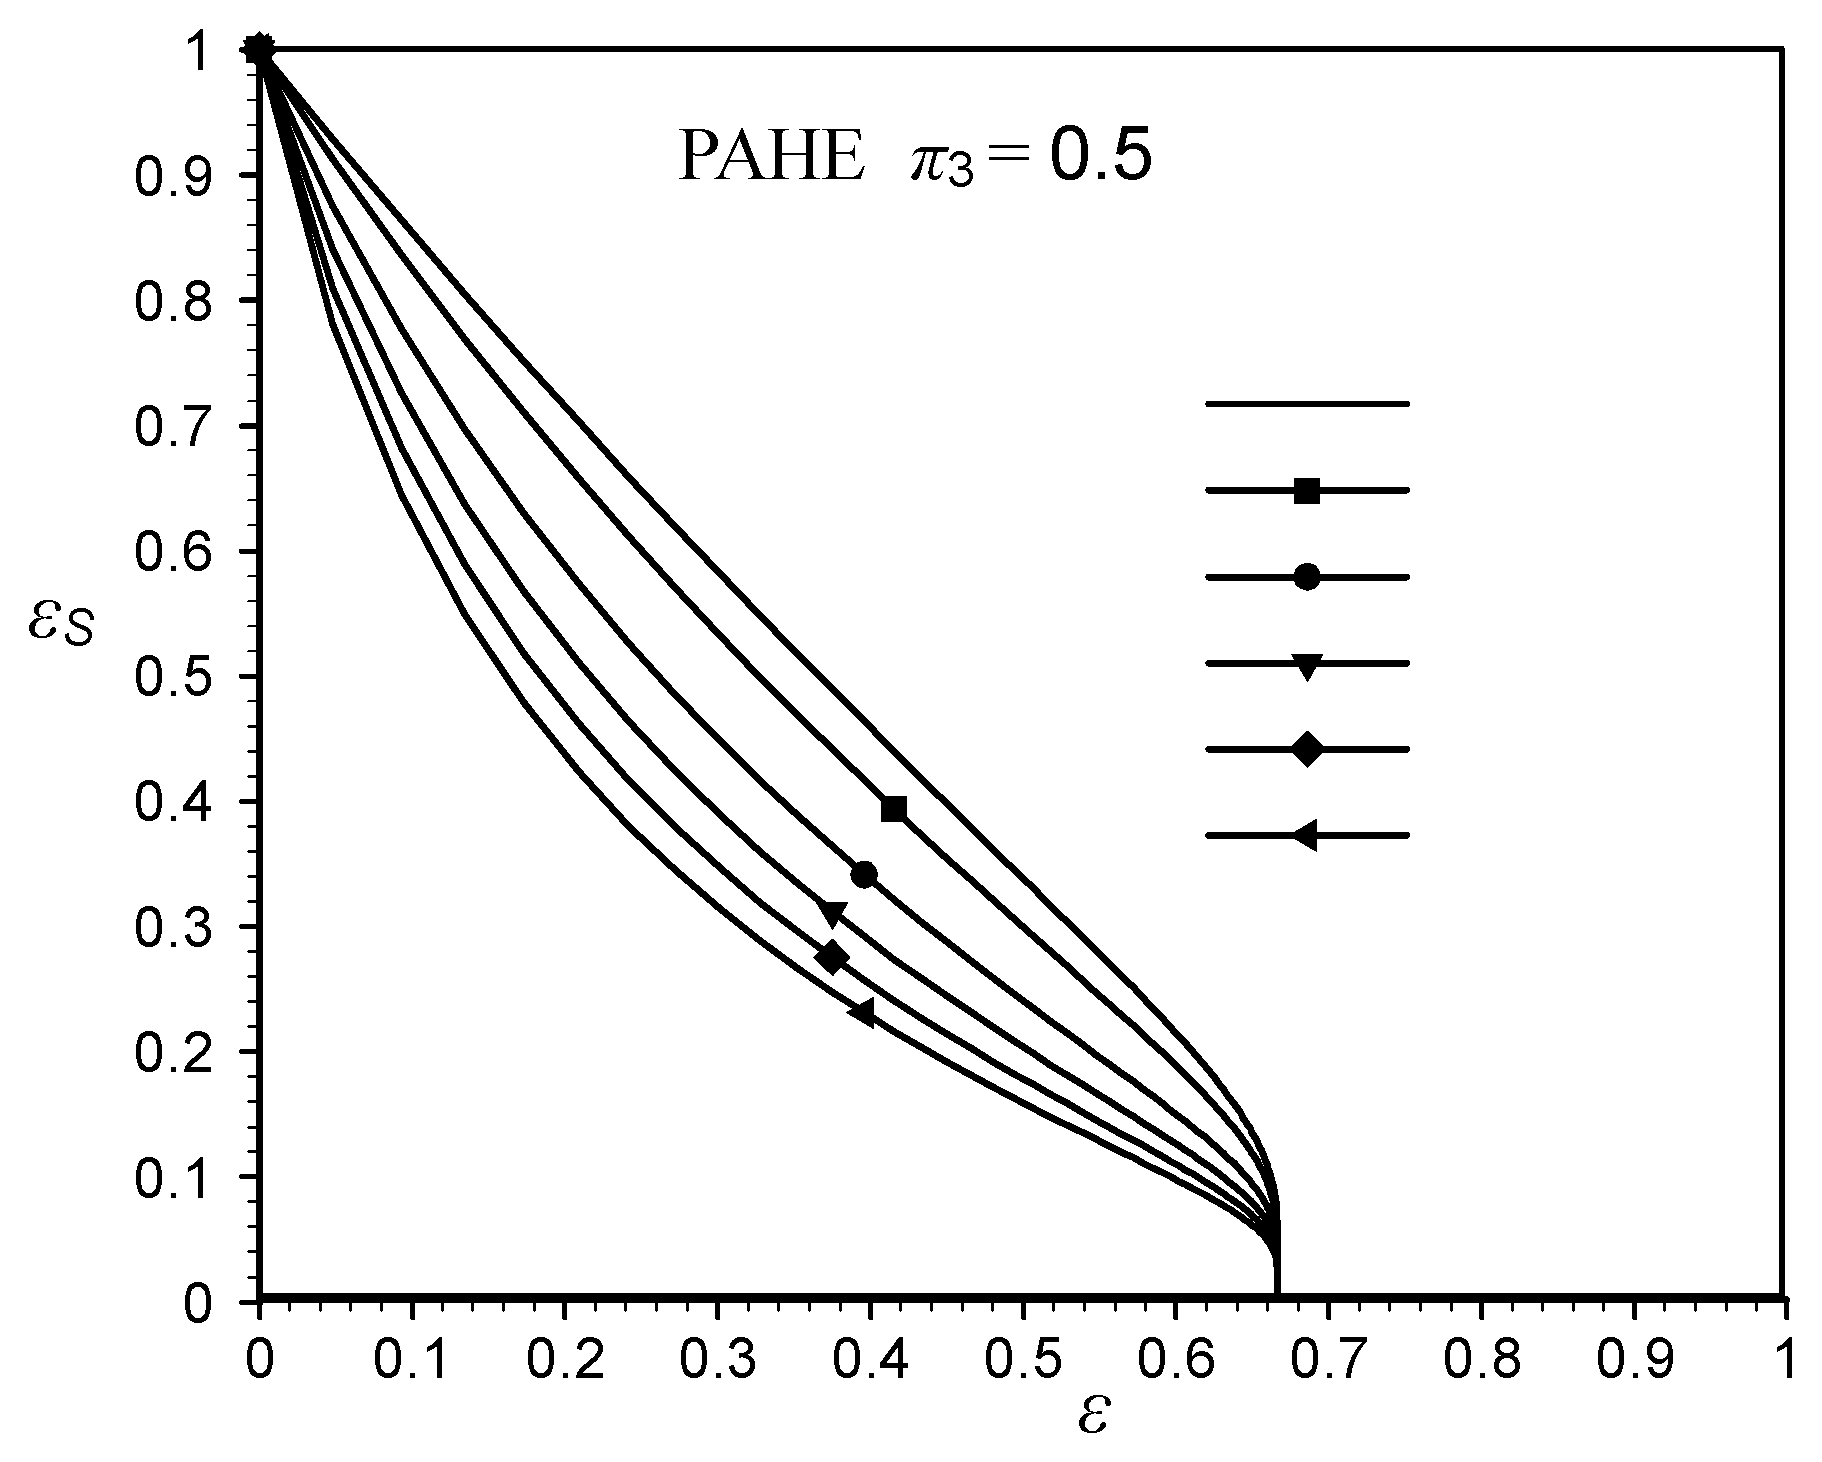
Relative entropy generation εS as a function of the heat exchanger effectiveness ε for π3=0.5 and πT =0.2 to 1, for a parallel flow heat exchanger
Figure 1a.
Relative entropy generation εS as a function of the heat exchanger effectiveness ε for π3=0.5 and πT =0.2 to 1, for a parallel flow heat exchanger
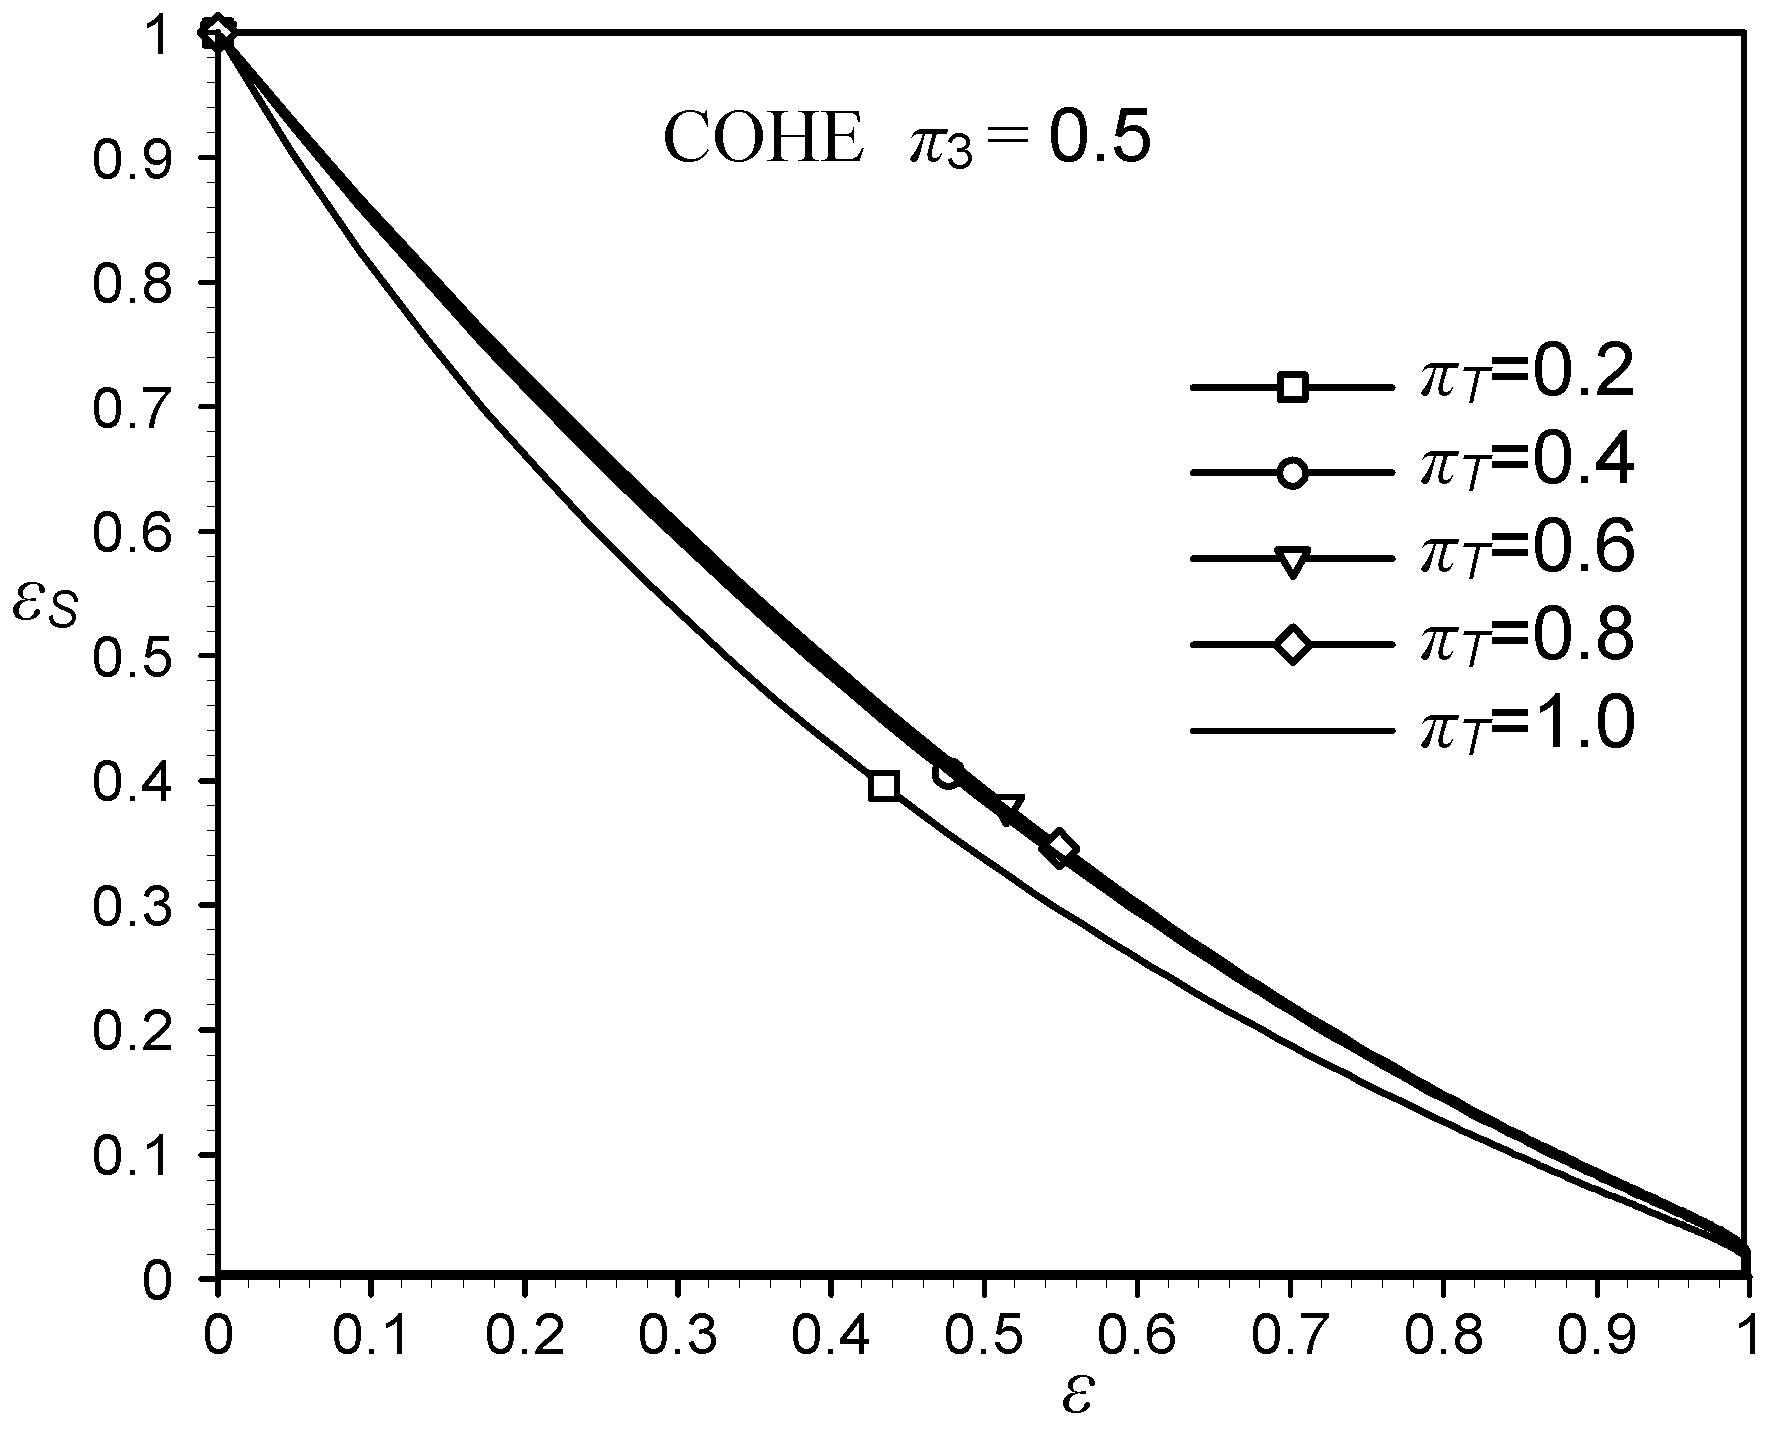
Figure 1b.
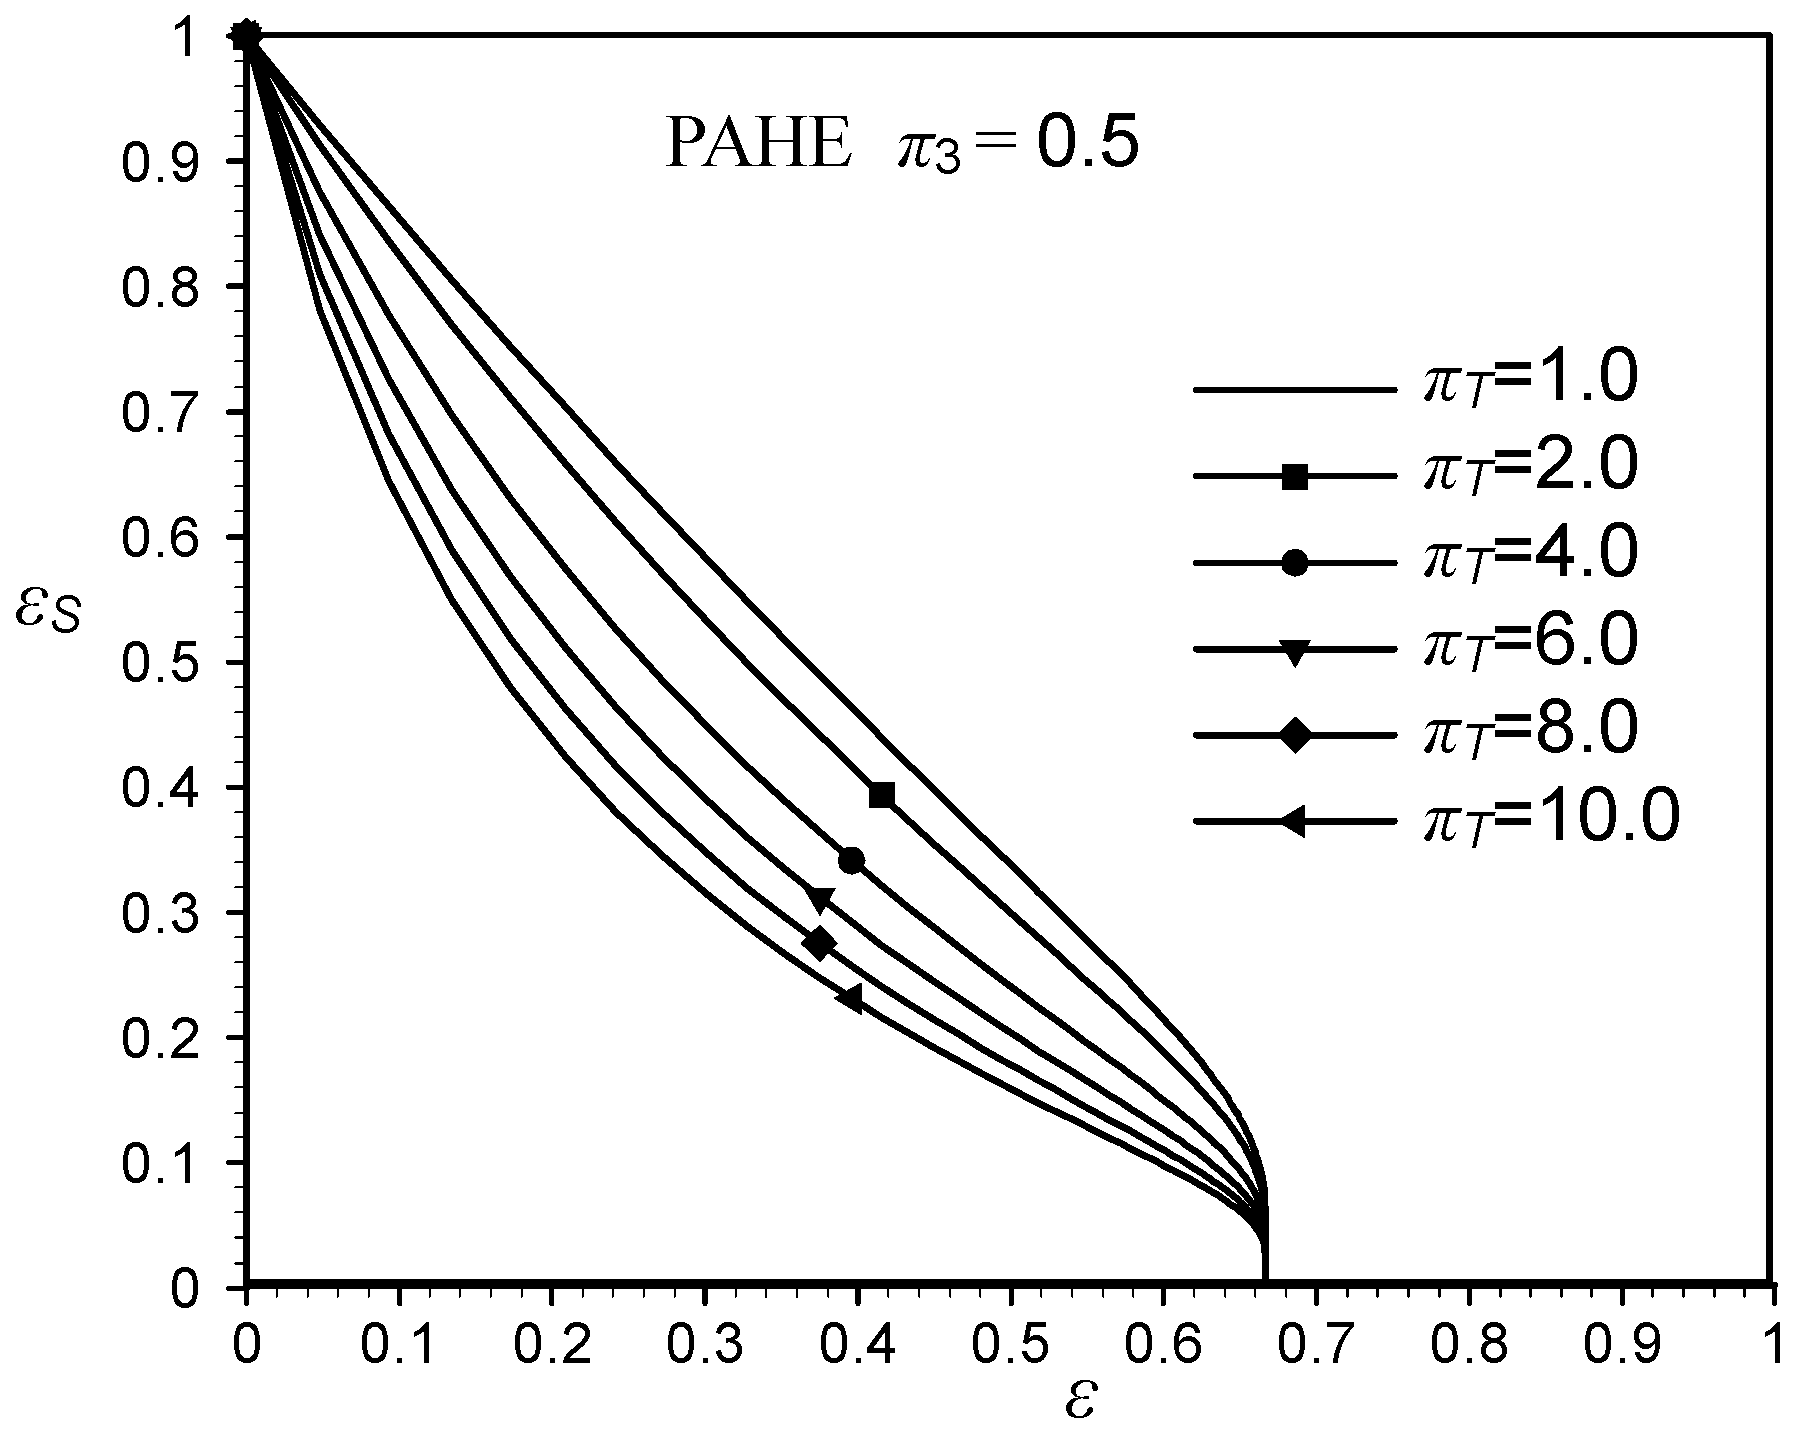
Relative entropy generation εS as a function of the heat exchanger effectiveness ε for π3=0.5 and πT=1 to 10, for a parallel flow heat exchanger
Figure 1b.
Relative entropy generation εS as a function of the heat exchanger effectiveness ε for π3=0.5 and πT=1 to 10, for a parallel flow heat exchanger
Eq.(18) clearly indicates that for
π3 = 0.5 and
π2 → ∞ the effectiveness of a parallel flow heat exchanger tends to 2/3, as it shown in
Figure 1a and
Figure 1b. From these diagrams it may be seen that ε
S increases with
πT increasing from 0.2 to 1 and decreases again with
πT increasing 1 to 10.
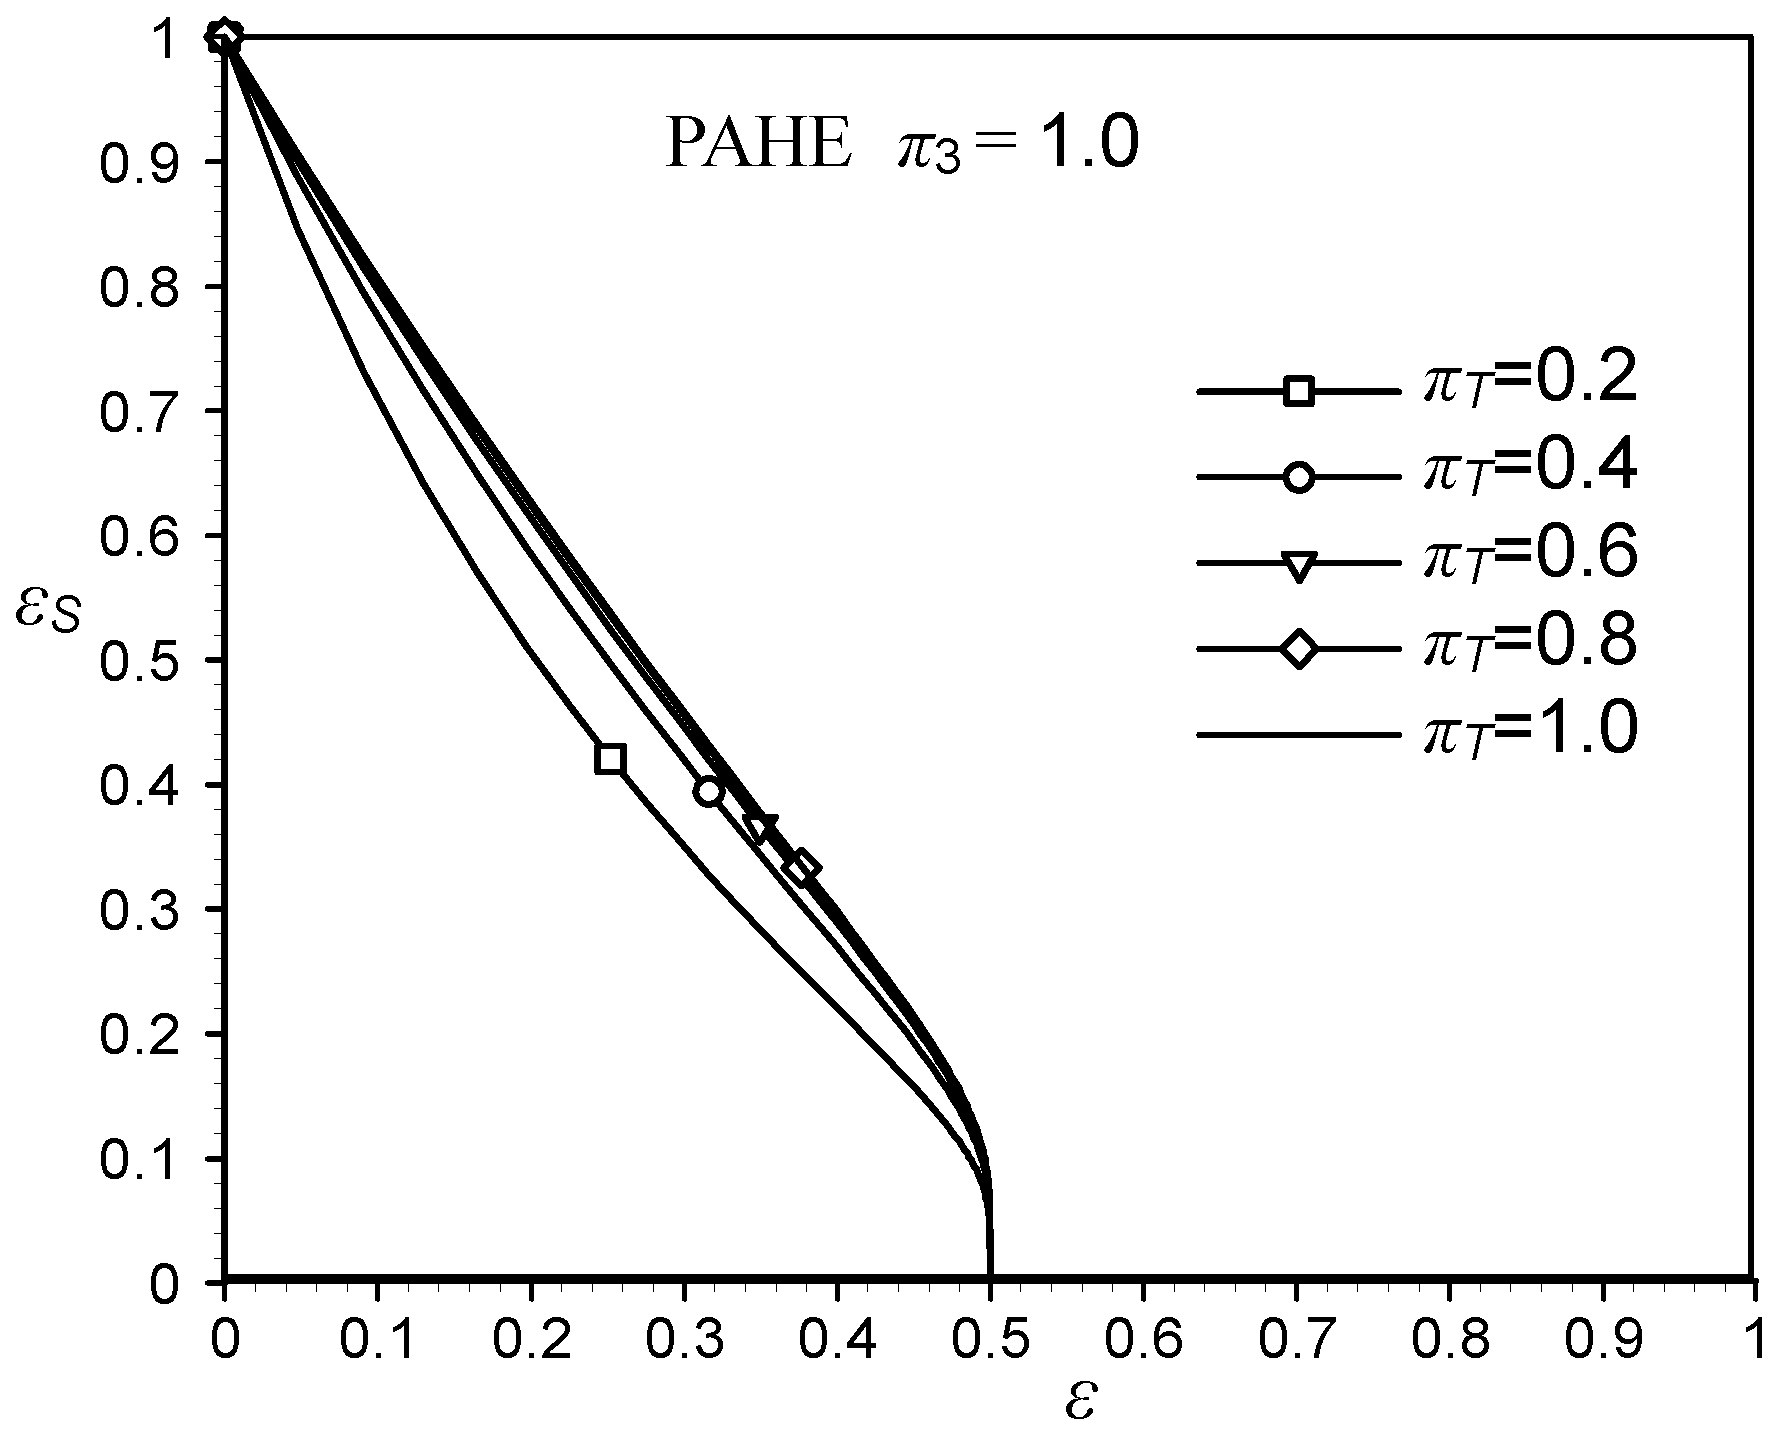
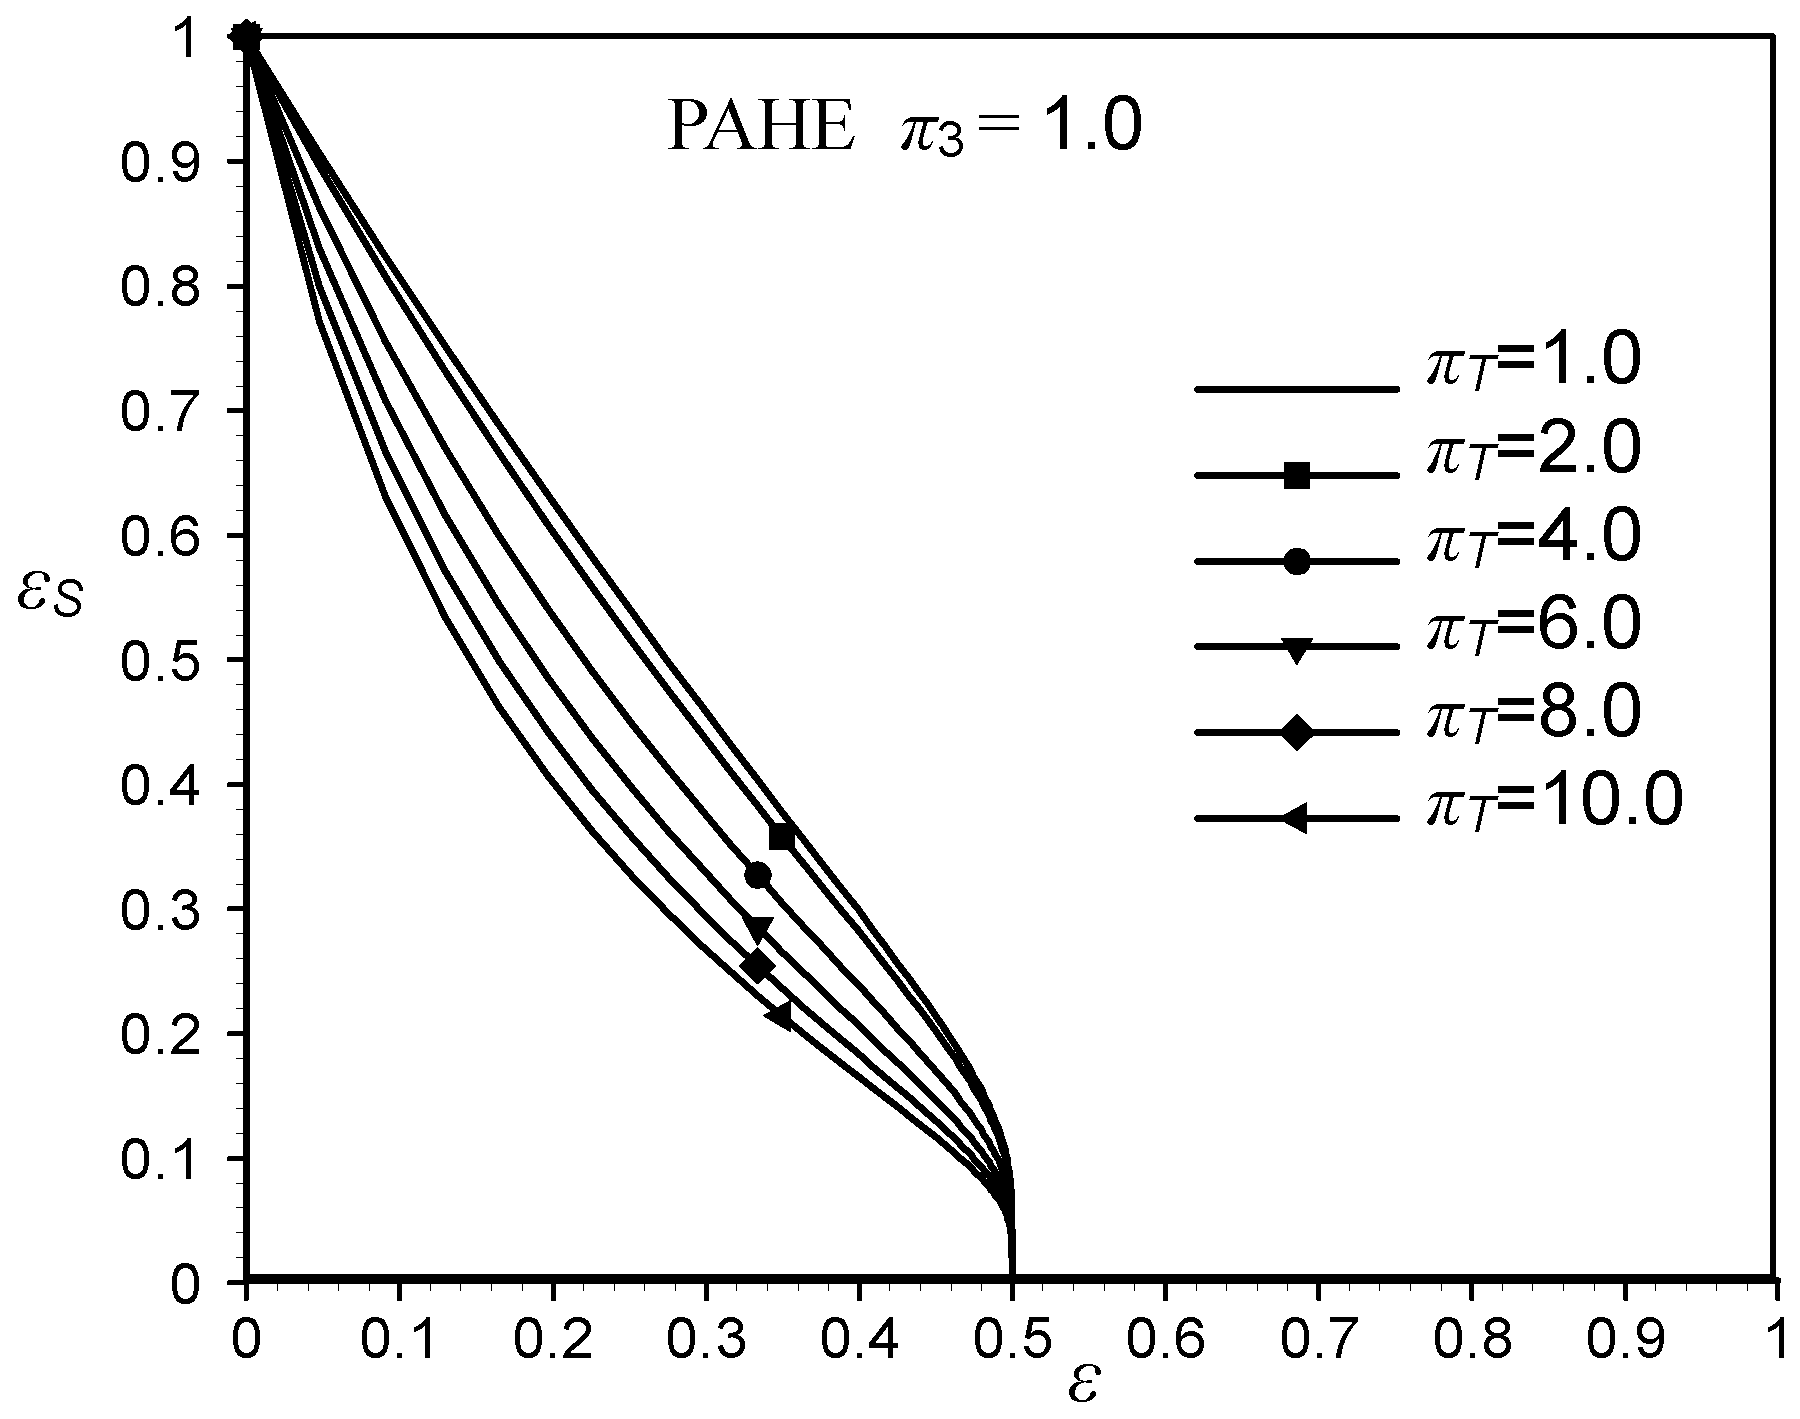
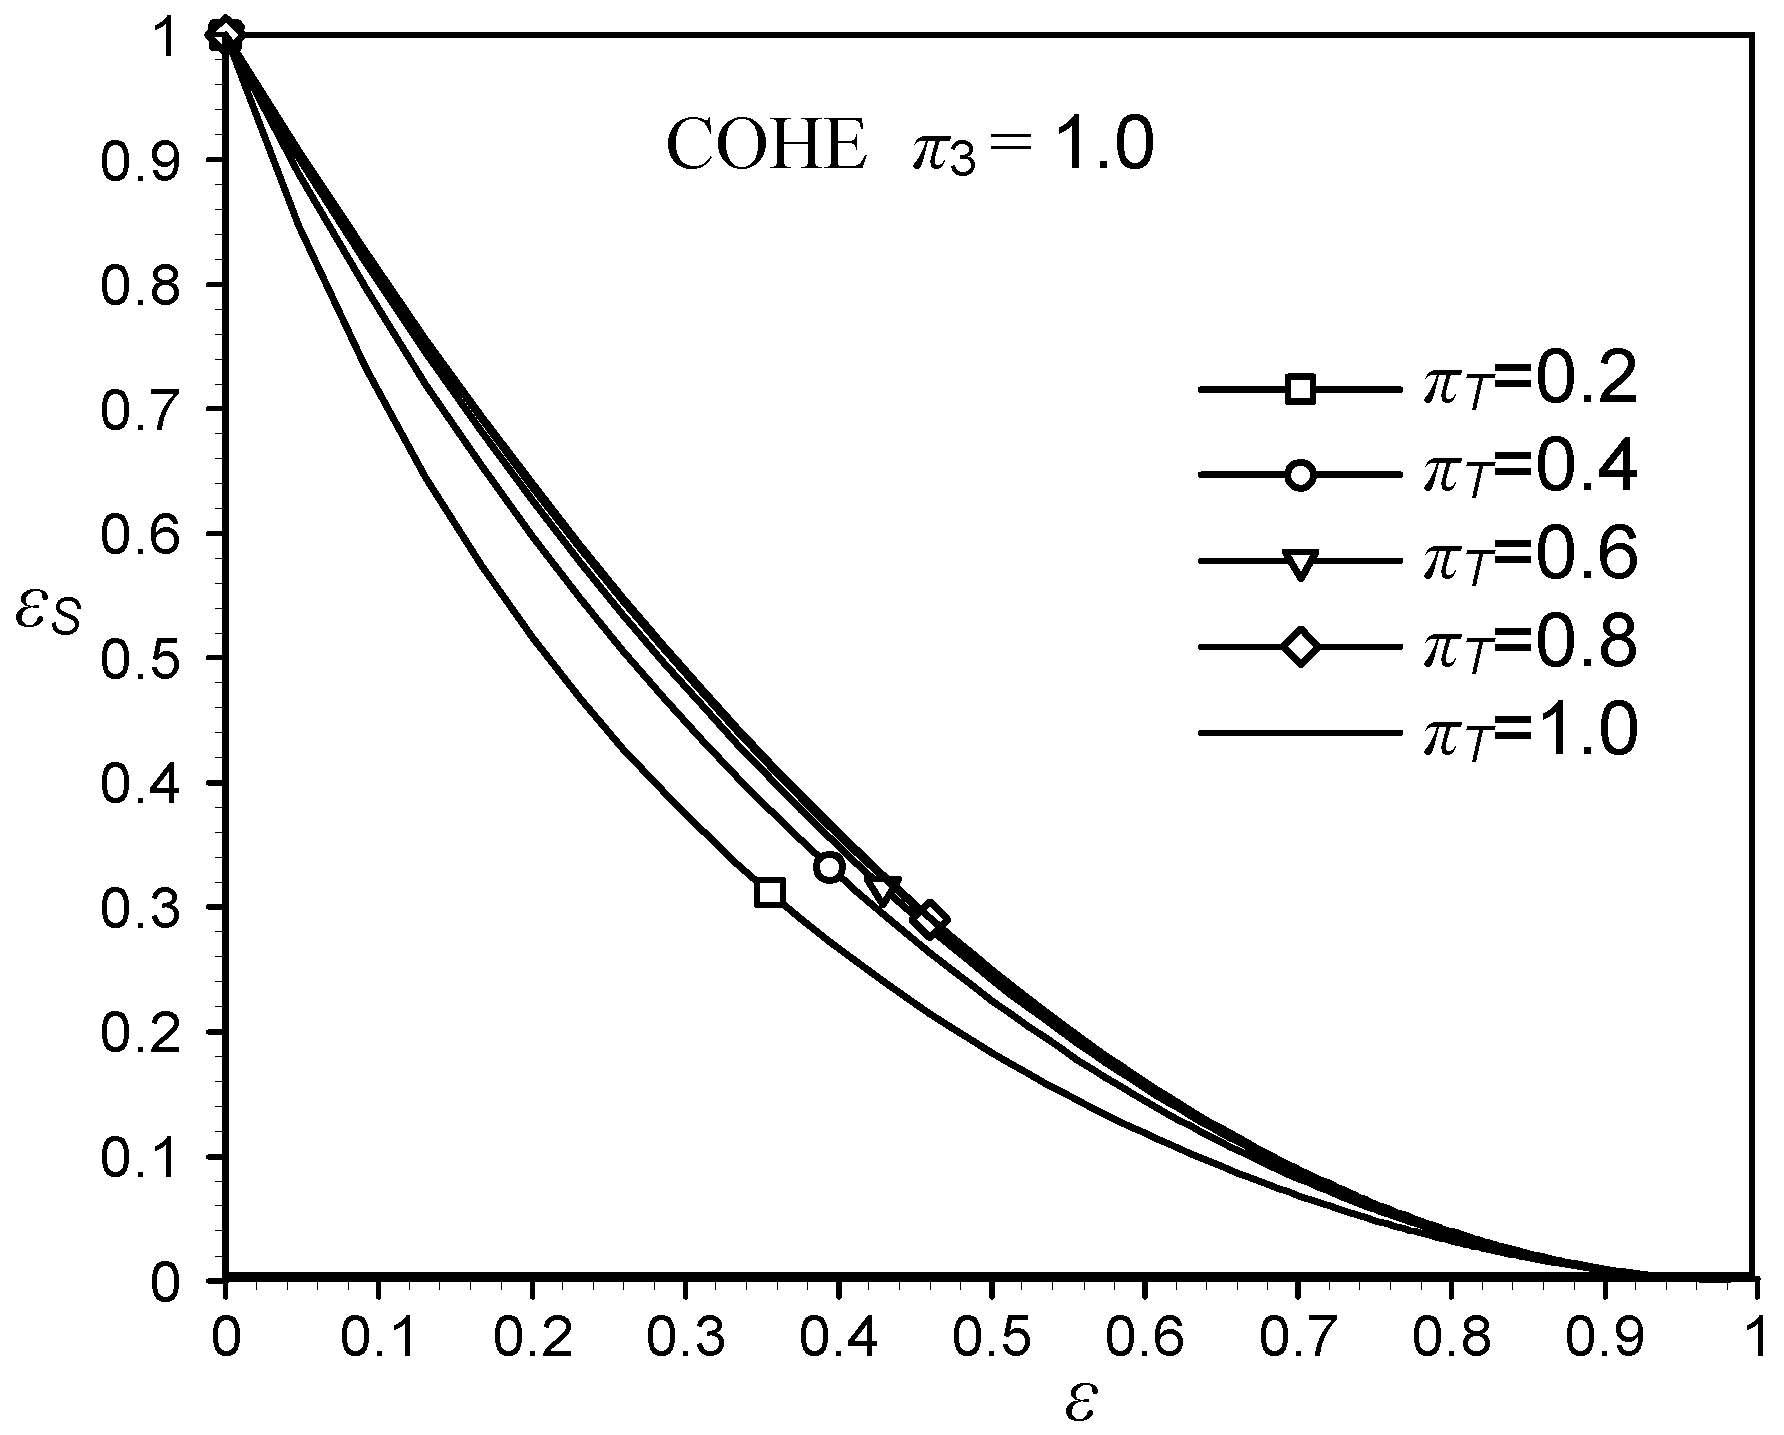
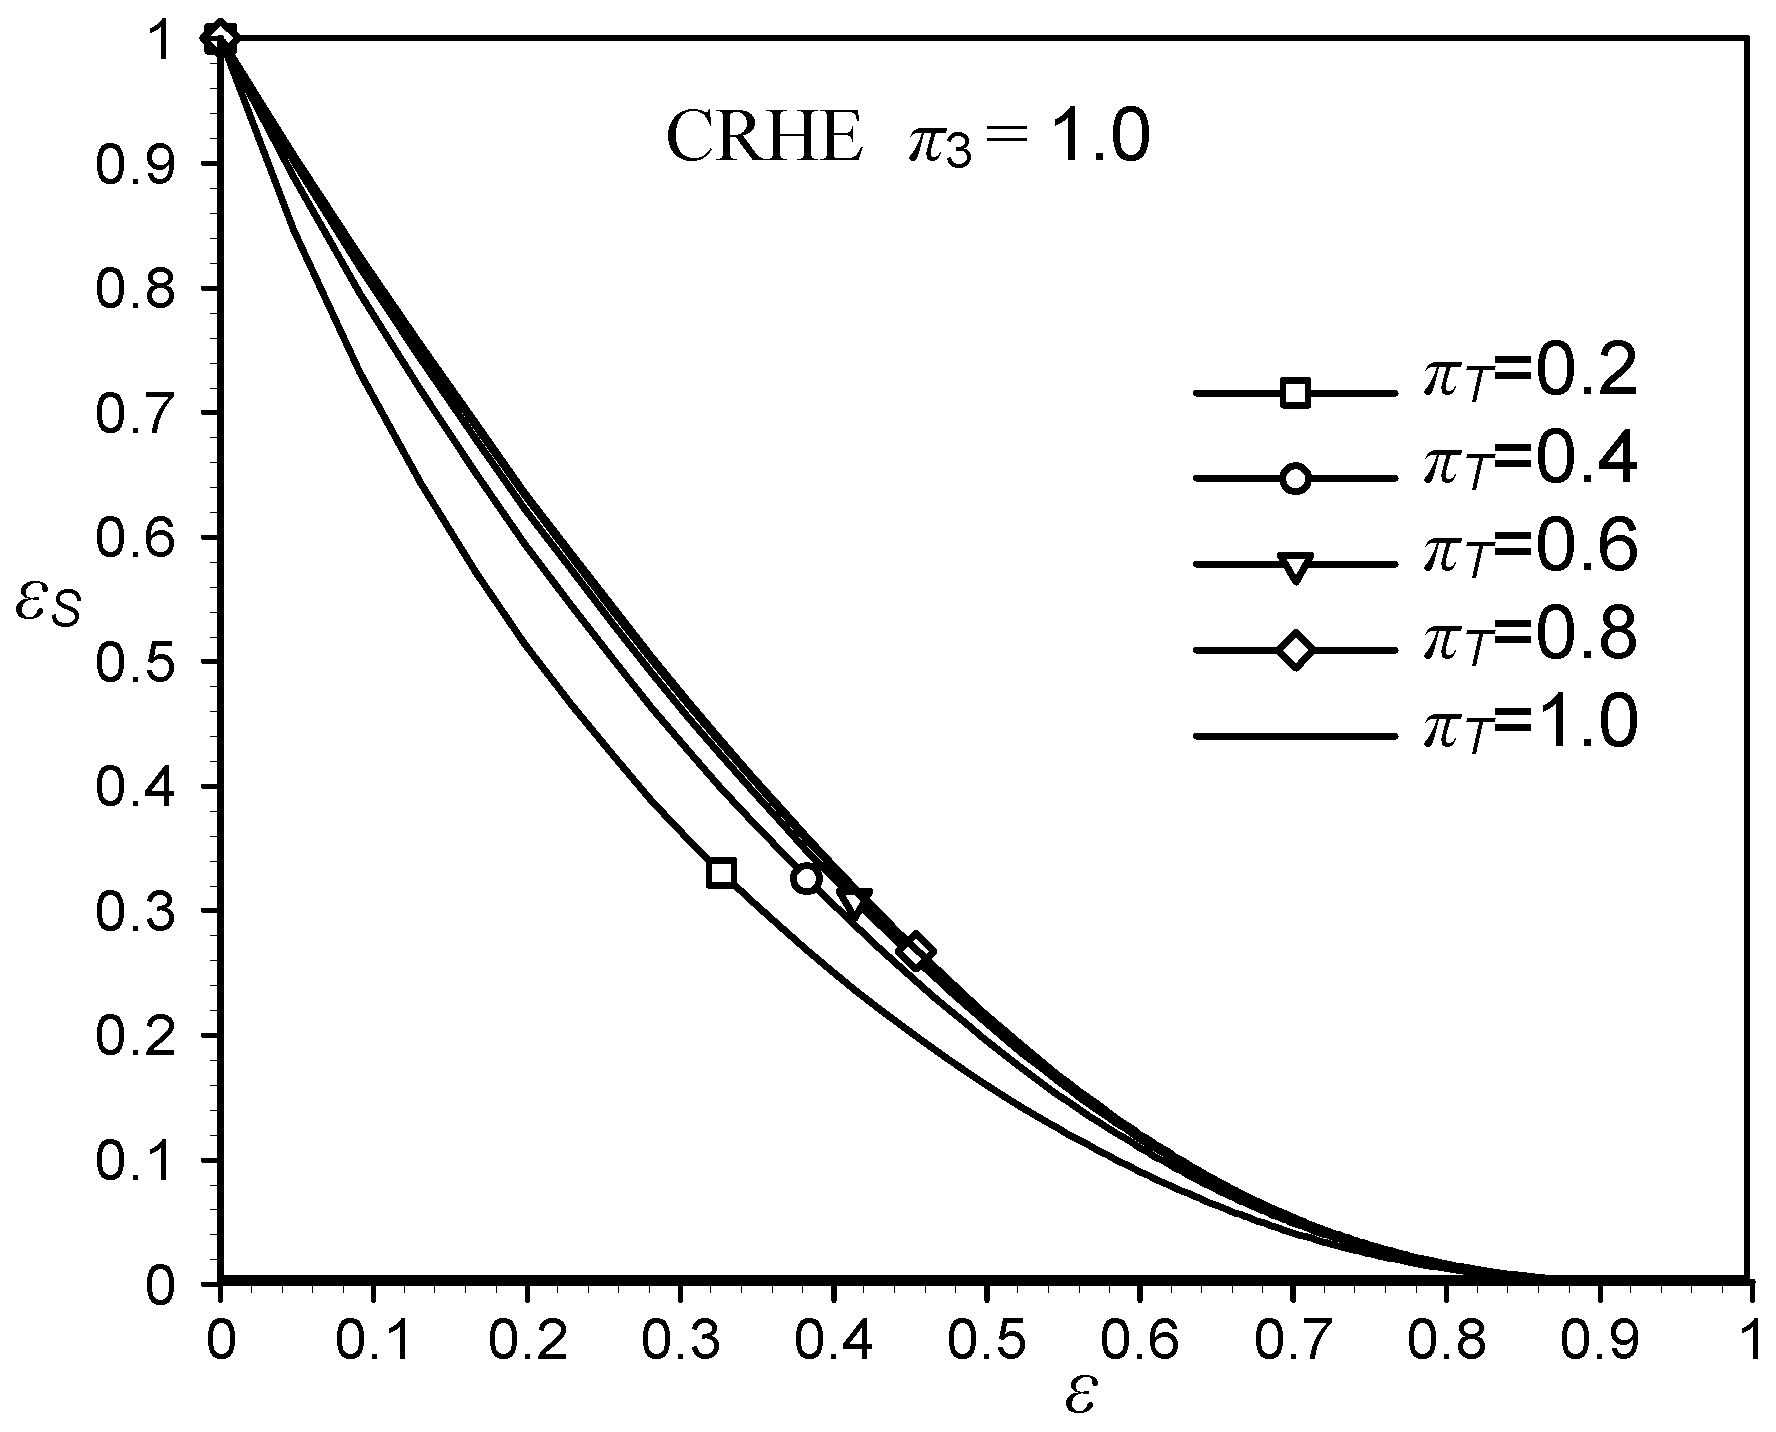
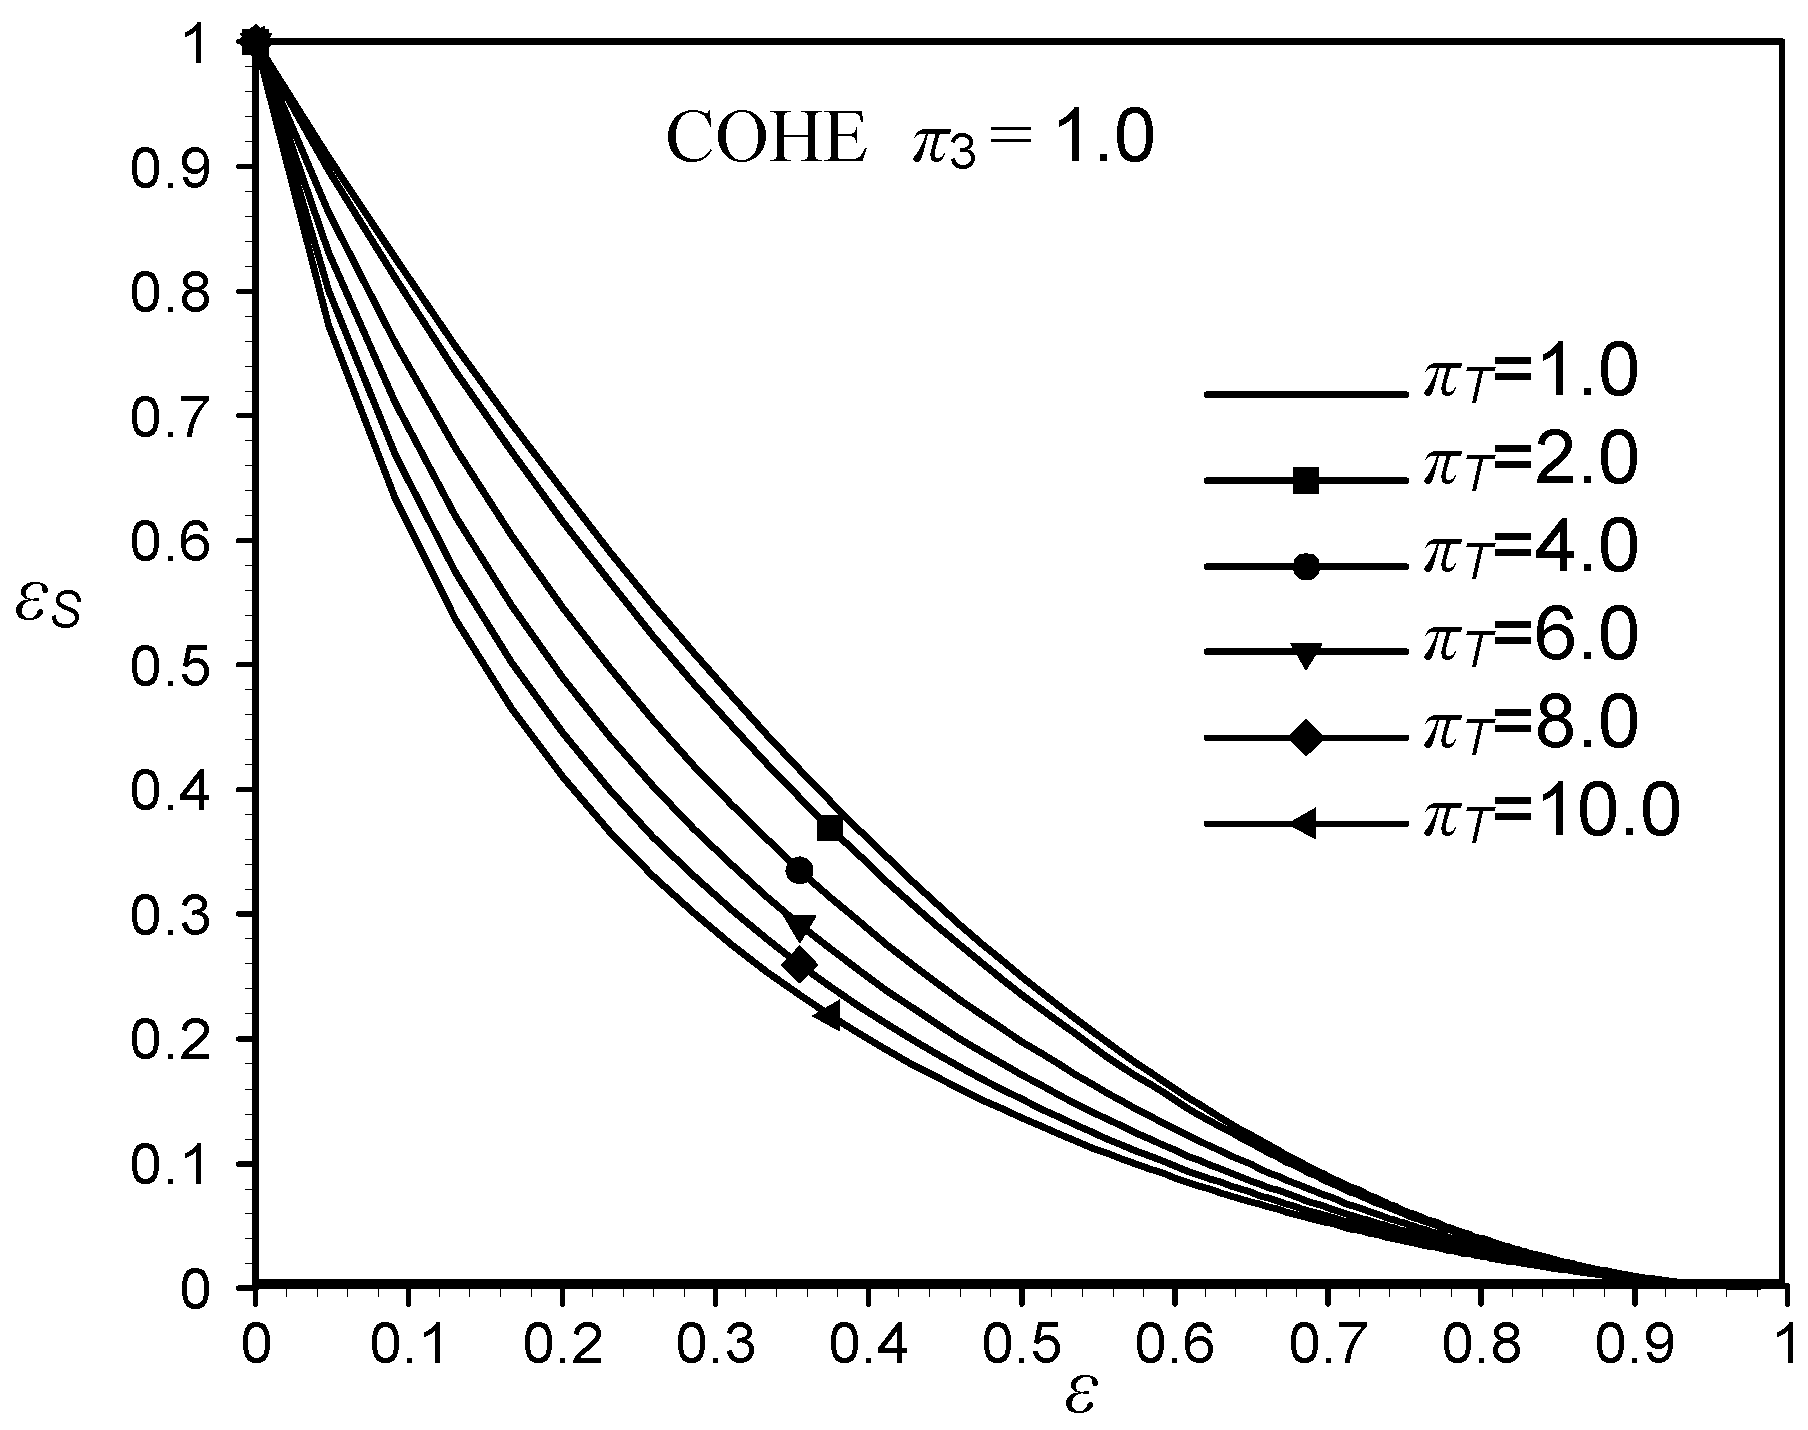
For
π3 = 1 the limiting value of the parallel flow heat exchanger effectiveness is 0.5, as it is shown in
Fig. 2a and
Fig. 2b.
Figure 2a.
Relative entropy generation εS as a function of the heat exchanger effectiveness ε for π3=1.0 and πT =0.2 to 1, for a parallel flow heat exchanger
Figure 2a.
Relative entropy generation εS as a function of the heat exchanger effectiveness ε for π3=1.0 and πT =0.2 to 1, for a parallel flow heat exchanger
Figure 2b.
Relative entropy generation εS as a function of the heat exchanger effectiveness ε for π3=1.0 and πT =1 to 10, for a parallel flow heat exchanger
Figure 2b.
Relative entropy generation εS as a function of the heat exchanger effectiveness ε for π3=1.0 and πT =1 to 10, for a parallel flow heat exchanger
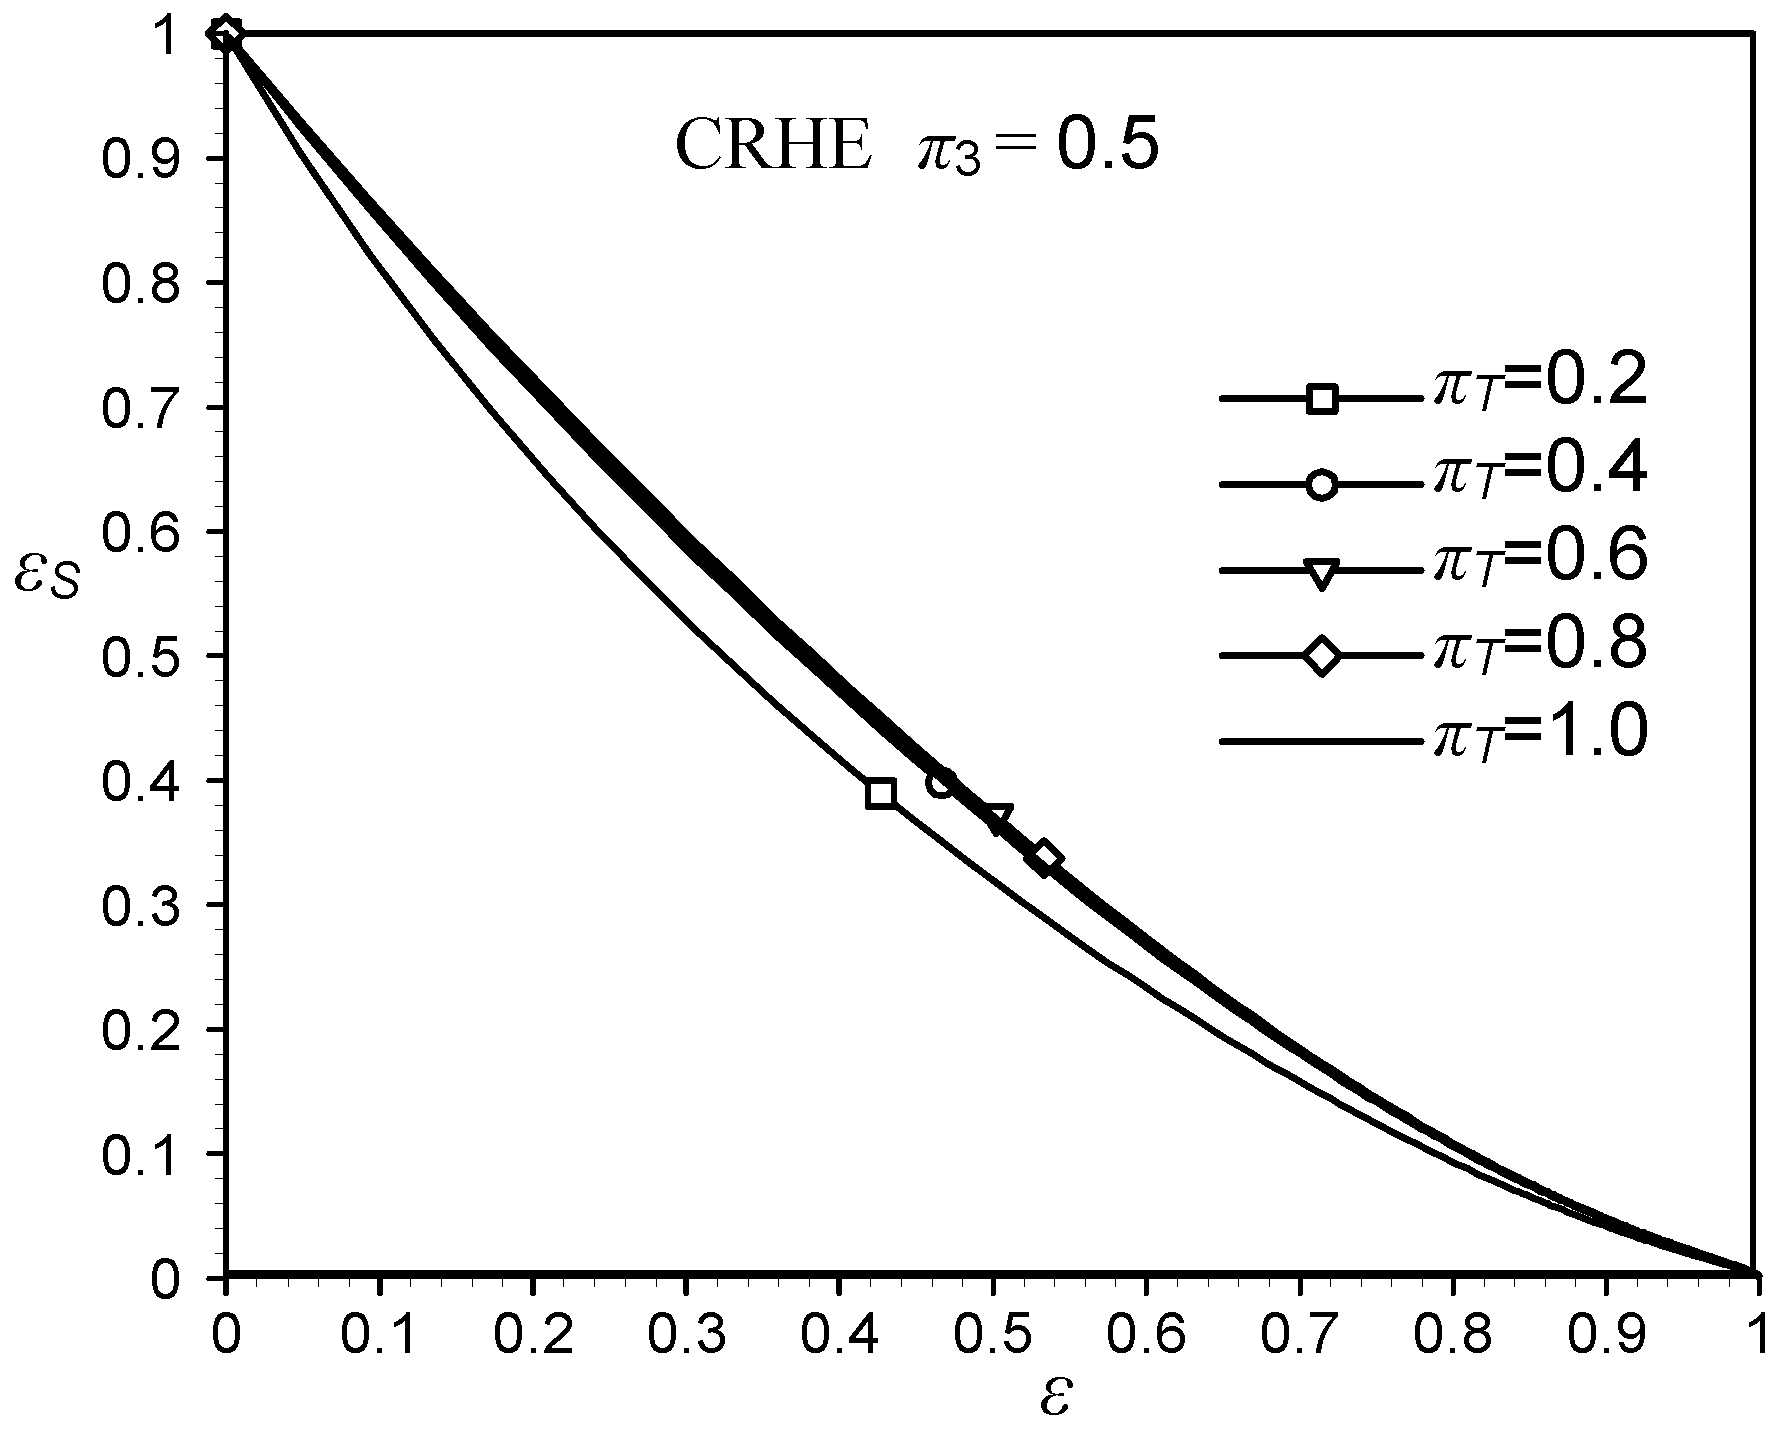
Figure 3a.
Relative entropy generation εS as a function of the heat exchanger effectiveness ε for π3=0.5 and πT =0.2 to 1, for a counterflow heat exchanger
Figure 3a.
Relative entropy generation εS as a function of the heat exchanger effectiveness ε for π3=0.5 and πT =0.2 to 1, for a counterflow heat exchanger
Figure 3b.
Relative entropy generation εS as a function of the heat exchanger effectiveness ε for π3 =0.5 and πT =1 to 10, for a counterflow heat exchanger
Figure 3b.
Relative entropy generation εS as a function of the heat exchanger effectiveness ε for π3 =0.5 and πT =1 to 10, for a counterflow heat exchanger
Figure 5a,
Figure 5b,
Figure 6a and
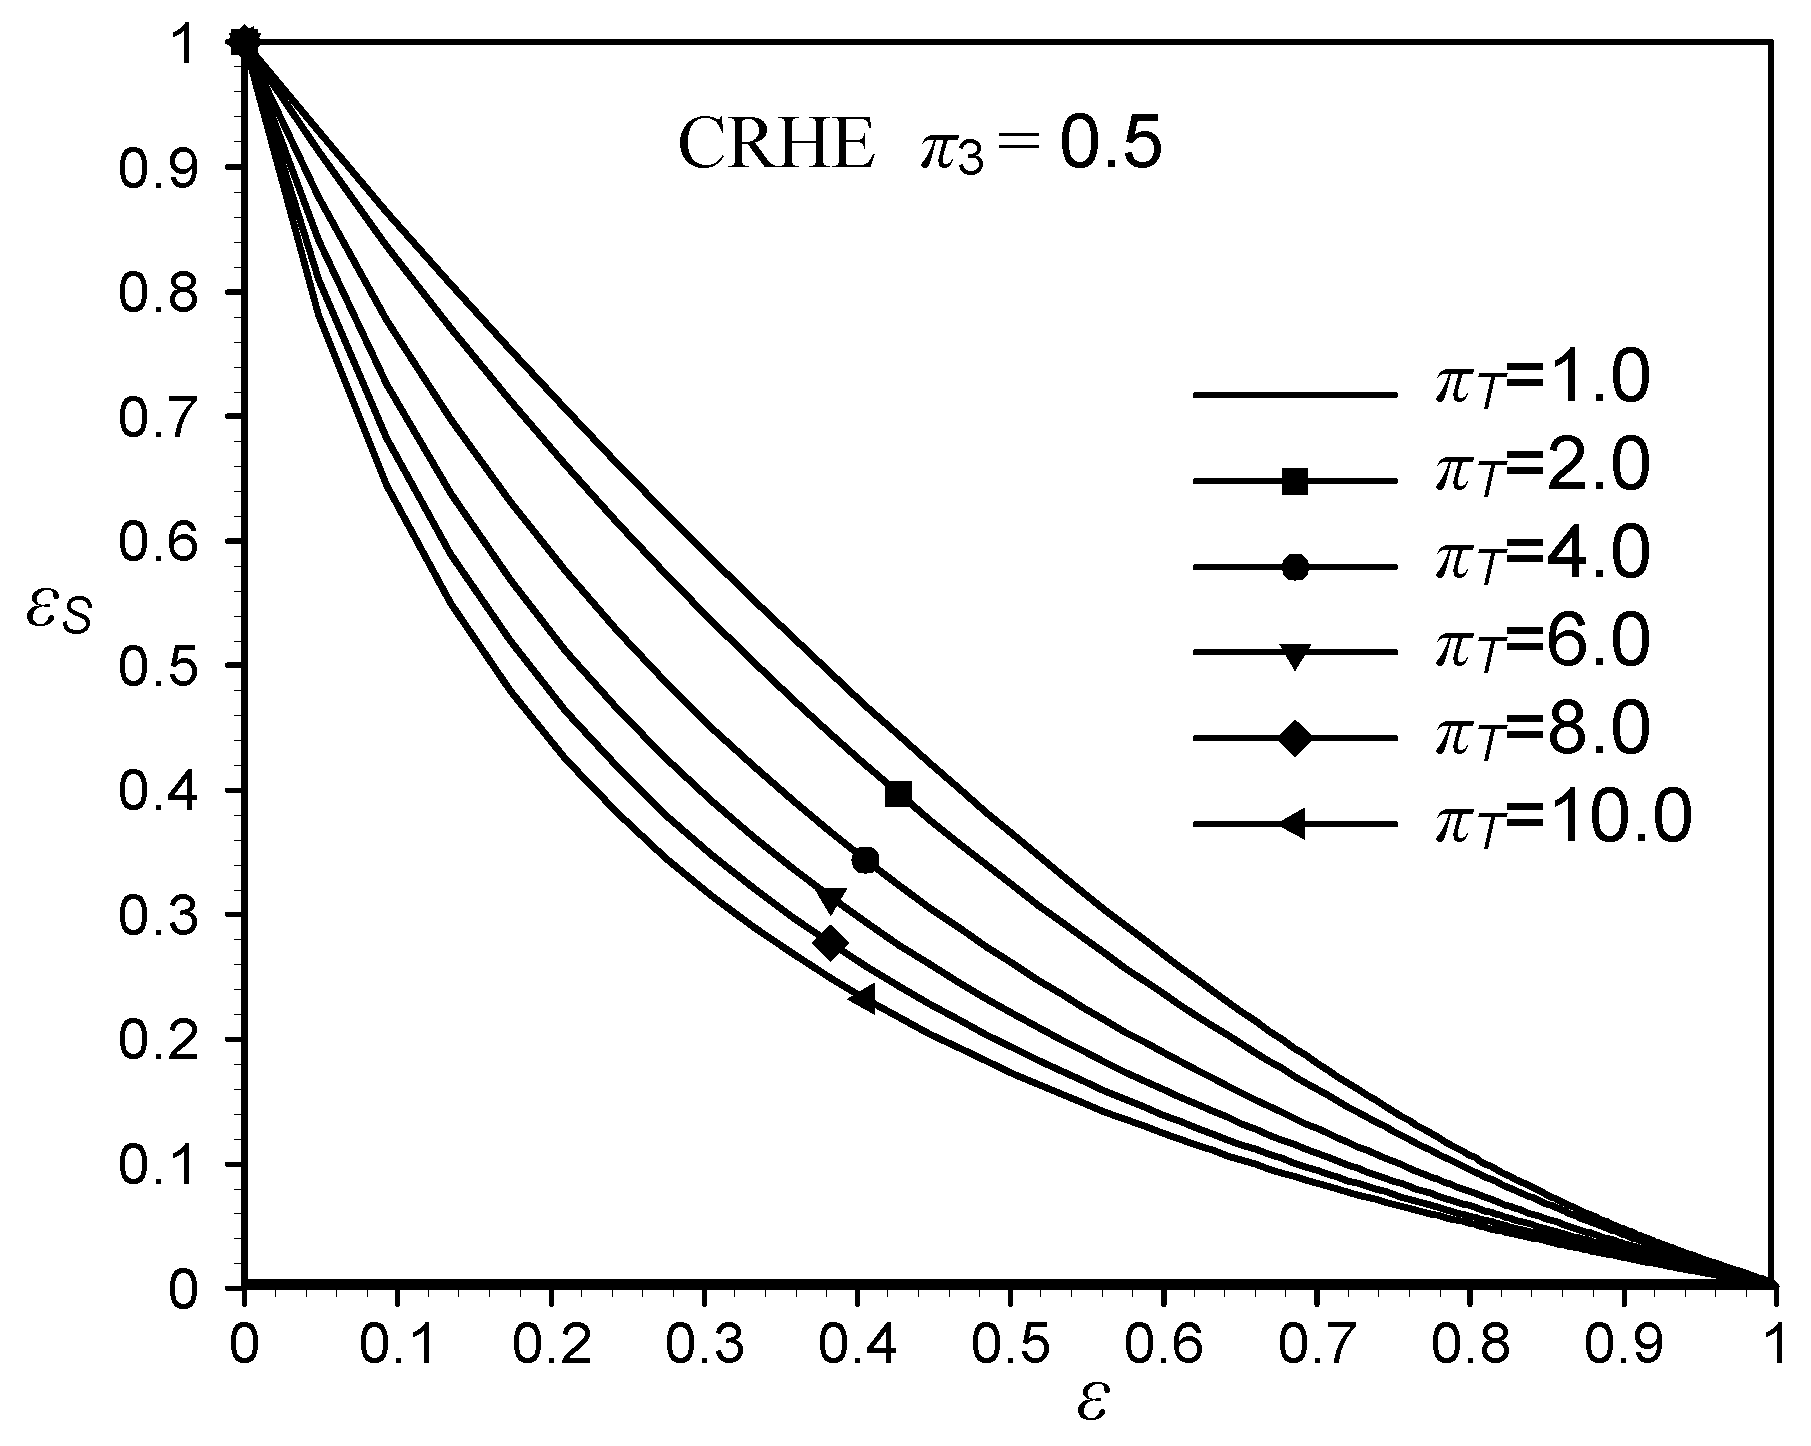
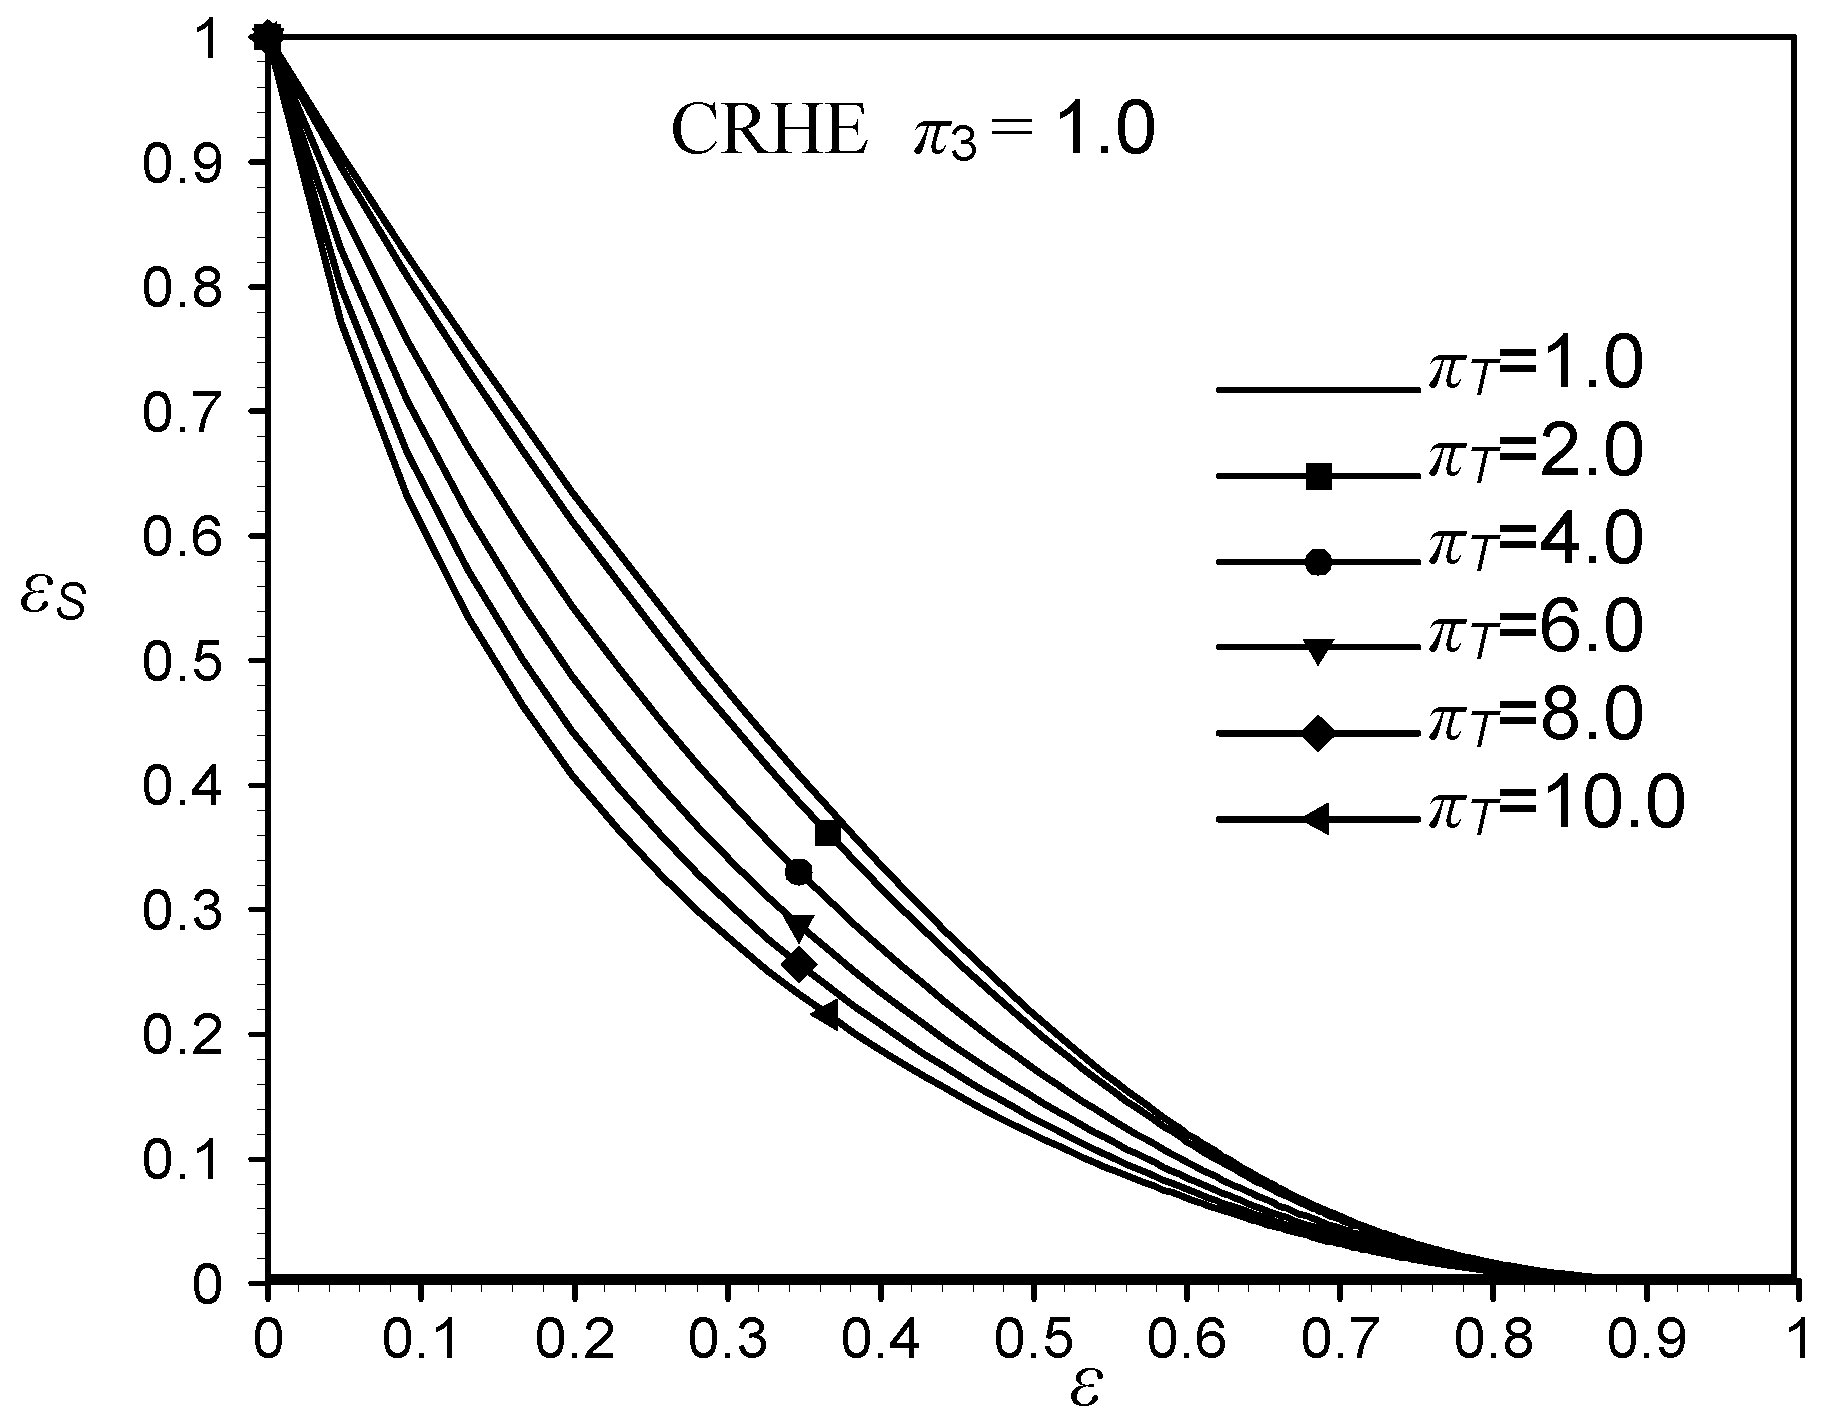
Figure 6b show the relative entropy generation as a function of the heat exchanger effectiveness for the cross-flow heat exchanger.
Fig. 5a and
Fig. 5b correspond to
π3 = 0.5 , while
Fig. 6a and
Fig. 6b are for
π3 = 1. In
Fig. 5a and
Fig. 6a the parameter
πT varies from 0.2 to 1 and in
Fig. 5b and
Fig. 6b from 1 to 10. The plotted results were obtained by using a numerical integration [
9] giving accurate results at least in three significant digits.
Figure 4a.
Relative entropy generation εS as a function of the heat exchanger effectiveness ε for π3 =1 and πT =0.2 to 1, for a counterflow heat exchanger
Figure 4a.
Relative entropy generation εS as a function of the heat exchanger effectiveness ε for π3 =1 and πT =0.2 to 1, for a counterflow heat exchanger
Figure 4b.
Relative entropy generation εS as a function of the heat exchanger effectiveness ε for π3 =1 and πT =1 to 10, for a counterflow heat exchanger
Figure 4b.
Relative entropy generation εS as a function of the heat exchanger effectiveness ε for π3 =1 and πT =1 to 10, for a counterflow heat exchanger
Figure 5a.
Relative entropy generation εS as a function of the heat exchanger effectiveness ε for π3 =0.5 and πT =0.2 to 1, for a cross-flow heat exchanger
Figure 5a.
Relative entropy generation εS as a function of the heat exchanger effectiveness ε for π3 =0.5 and πT =0.2 to 1, for a cross-flow heat exchanger
Figure 5b.
Relative entropy generation εS as a function of the heat exchanger effectiveness ε for π3 =0.5 and πT =1 to 10, for a cross-flow heat exchanger
Figure 5b.
Relative entropy generation εS as a function of the heat exchanger effectiveness ε for π3 =0.5 and πT =1 to 10, for a cross-flow heat exchanger
Figure 6a.
Relative entropy generation εS as a function of the heat exchanger effectiveness ε for π3 =1 and πT =0.2 to 1, for a cross flow heat exchanger
Figure 6a.
Relative entropy generation εS as a function of the heat exchanger effectiveness ε for π3 =1 and πT =0.2 to 1, for a cross flow heat exchanger
Figure 6b.
Relative entropy generation εS as a function of the heat exchanger effectiveness ε for π3 =1 and πT =1 to 10, for a cross-flow heat exchanger
Figure 6b.
Relative entropy generation εS as a function of the heat exchanger effectiveness ε for π3 =1 and πT =1 to 10, for a cross-flow heat exchanger
For this type of heat exchanger, the effectiveness also tends to one when
π2 → ∞, regardless of the parameter
πT.
Table 1 shows the values of the relative entropy generation
εS and parameter
π2 for
ε = 0.4 ,
π3 = 0.5 and 1.0 and
πT = 0.2 and 10.
Table 1.
Calculated ε and π2 for ε =0.4 and selected π3 and πT
Table 1.
Calculated ε and π2 for ε =0.4 and selected π3 and πT
| Heat exchanger | | ε = 0.4 |
| π3 = 0.5 | π3 = 1.0 |
| πT = 0.2 | πT = 10 | πT = 0.2 | πT = 10 |
| PAHE | εS | 20.400 | 0.220 | 0.215 | 0.165 |
| π2 | 0.610 | 0.610 | 0.805 | 0.805 |
| CRHE | εS | 20.415 | 0.230 | 0.245 | 0.185 |
| π2 | 0.590 | 0.590 | 0.710 | 0.710 |
| COHE | εS | 20.420 | 0.235 | 0.265 | 0.195 |
| π2 | 0.575 | 0.575 | 0.667 | 0.667 |
It is obvious from
Table 1 that, for the given effectiveness, the counterflow heat exchanger generates most of the entropy rate, but it has the smallest surface area (parameter
π2).
3.2 Cases of an evaporator or a condenser
In the case of an evaporator or a condenser (
C2 → ∞ and
π3 = 0) the entropy generation for all three types of heat exchangers becomes identical, as shown in Eq. (14), so the relative entropy generation can be shown as a function of
ε and
πT, as in
Fig. 7.
Figure 7.
Relative entropy generation εS as a function of the heat exchanger effectiveness ε for πT =0.2 to 10 and π3=0 (meaning of symbols is the same as in the previous figures)
Figure 7.
Relative entropy generation εS as a function of the heat exchanger effectiveness ε for πT =0.2 to 10 and π3=0 (meaning of symbols is the same as in the previous figures)
For
ε → 1 , the heat exchanger surface area obviously tends to infinity, and consequently
NS → 0. Since the
NS,max takes a finite value depending on
πT only, the relative entropy generation tends to zero for
A0 → ∞. Further it can be noticed in
Fig. 7 that the parametric curves corresponding to
πT > 1 are concave, while those for
πT < 1 are convex. For the given heat exchanger effectiveness the relative entropy generation grows if drops the
πT. For e.g.
ε =0.4 ,
πT = 10 and 0.2,
εS becomes 0.275 and 0.735, respectively. For
εS = 0.5 and
πT = 10 and 0.2, the achieved heat exchanger effectiveness is 0.18 and 0.715, respectively.
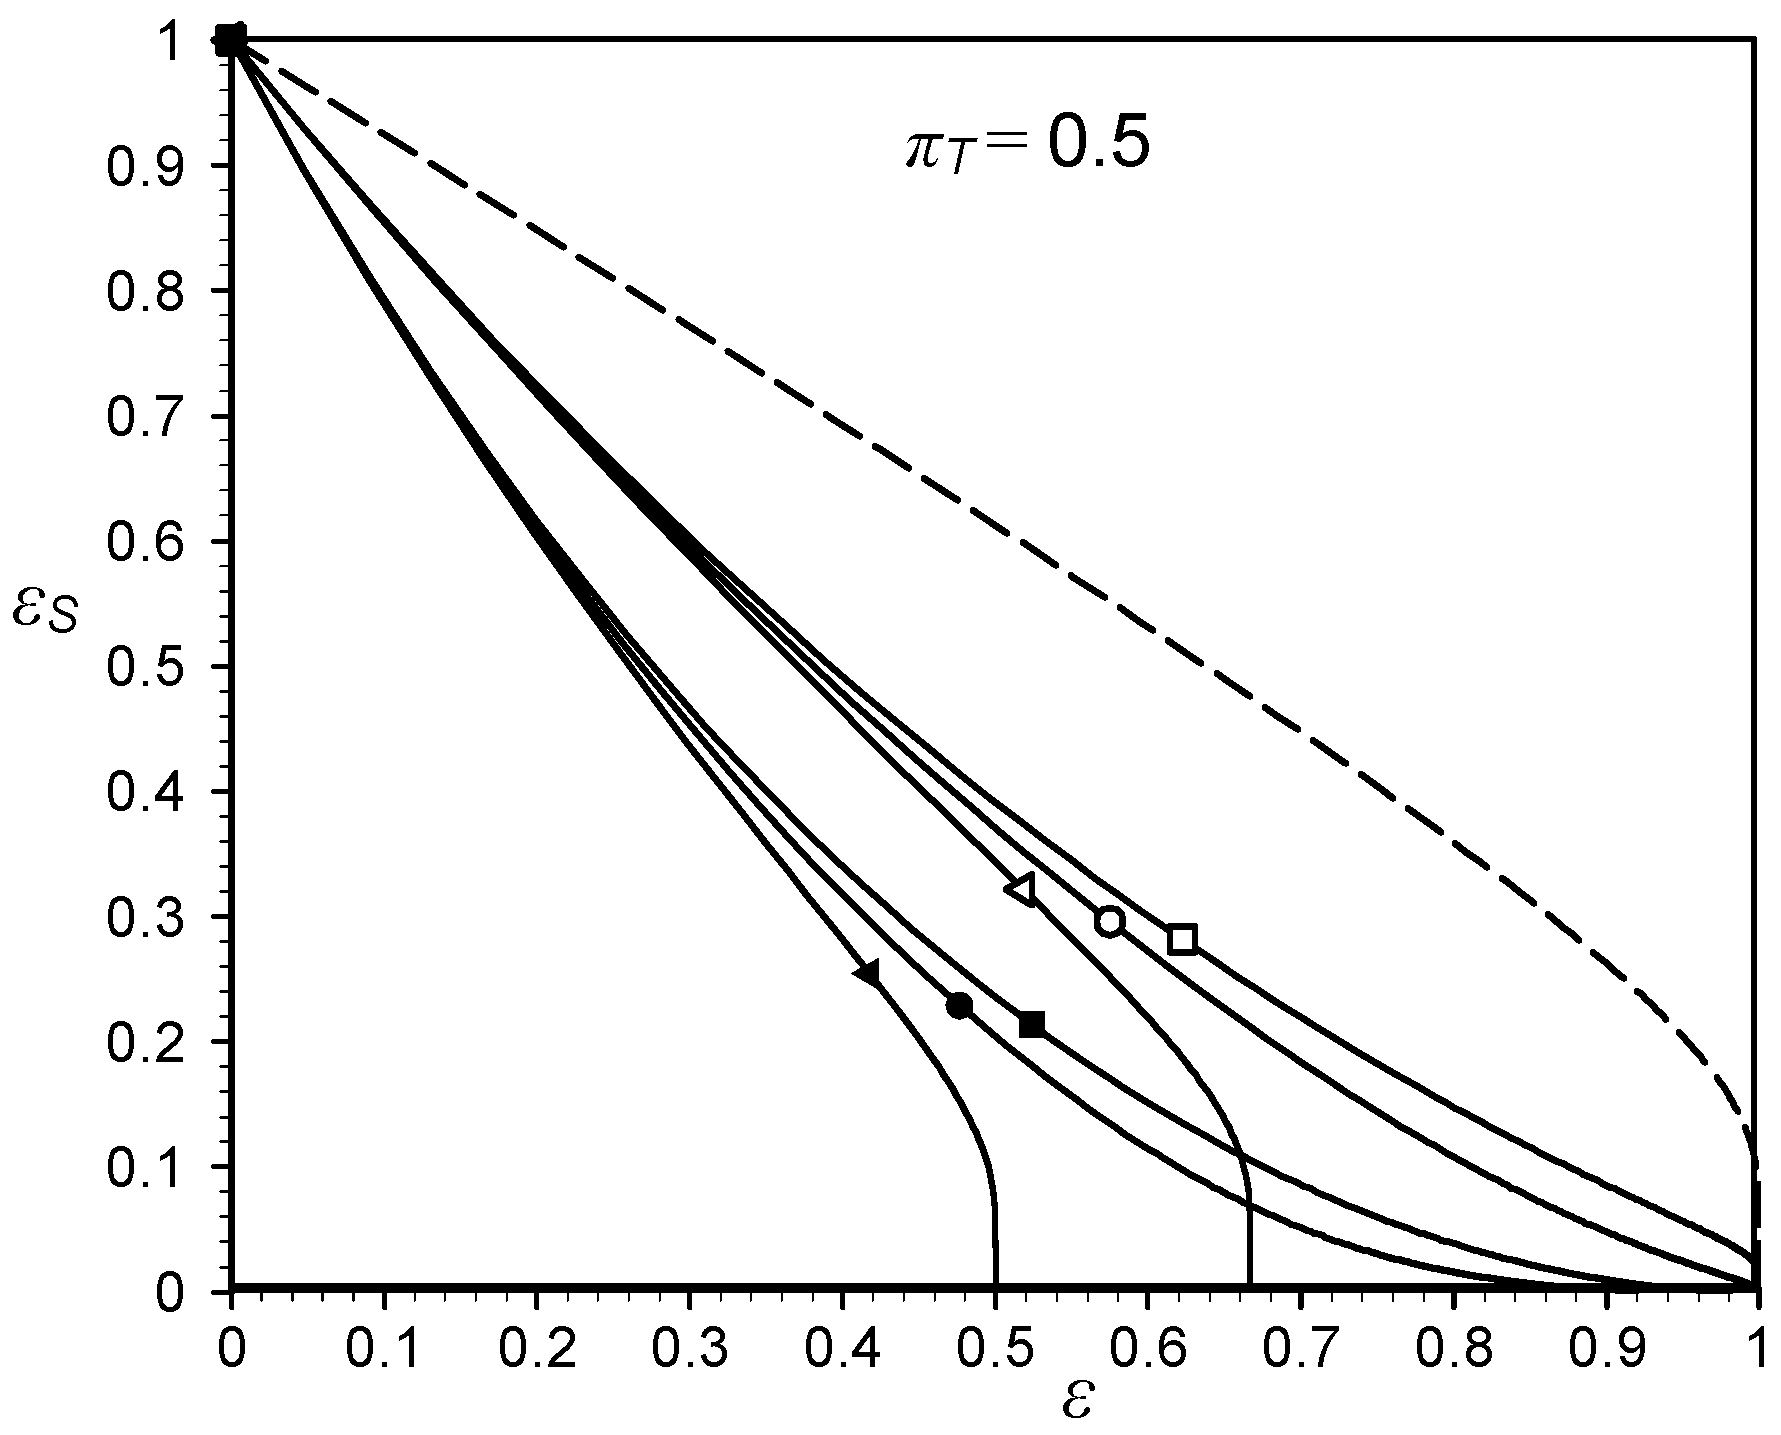
Fig. 8 shows the relative entropy generation as a function of heat exchanger effectiveness for
πT = 0.5 and for three values of
π3(0; 0.5 and 1) and for all three types of heat exchangers. The solution for
π3 = 0 is the same for all the three types.
Figure 8.
Relative entropy generation εS of the PAHE (triangles) COHE (squares) and CRHE (circles) versus the heat exchanger effectiveness ε for the π3 =0 (dashed line); 0.5 (outlined symbols) and 1 (filled symbols) and for πT =0.5
Figure 8.
Relative entropy generation εS of the PAHE (triangles) COHE (squares) and CRHE (circles) versus the heat exchanger effectiveness ε for the π3 =0 (dashed line); 0.5 (outlined symbols) and 1 (filled symbols) and for πT =0.5
It may be seen that in the range 0 < ε < 0.2 and for a given πT, the type of heat exchanger has no influence on the relative entropy generation. For a given εS evaporator or condenser is the most effective, followed by the counterflow, cross-flow and parallel flow heat exchanger respectively. As concluded earlier, for a given ε the maximal relative entropy generation occurs in an evaporator or condenser, followed by the counterflow heat exchanger, while it becomes minimal in the parallel flow heat exchanger.


