1. Introduction
A gas-to-methanol process comprises primarily the preparation and purification of the feedstock gas, as well as the synthesis and refining of methanol [
1,
2]. The process entails the supply, demand, conversion, and storage of various energy media, mainly including gas and steam. The irregular rhythm of methanol production often leads to serious energy waste problems. It is, therefore, necessary to implement scientific and reliable optimization schemes to ensure the safety and economic viability of the integrated gas and steam energy system for the gas-to-methanol process [
3,
4,
5].
In recent years, optimal scheduling for energy systems has received increasing attention from both industry and academic communities [
6,
7,
8,
9,
10]. Abdollahi et al. [
11] conducted multi-objective optimization for the design of a small, distributed combined cooling, heating, and power system, incorporating reliability and availability into the thermo-economic model and using risk analysis for final decision making. Di Somma et al. [
12] obtained a mixed-integer linear programming (MILP) model for a building energy supply system, focusing on energy costs and efficiency under the combination of fossil and renewable energy. Zeng et al. [
13] developed a multi-period MILP model for complex, large-scale energy optimization problems, targeting the actual operating characteristics of various energy-coupling equipment in iron and steel plants. Daraei et al. [
14] assessed the impact of renewable energy systems on the production planning of local combined heat and power plants, validating the feasibility of the optimization model through extreme operating conditions of energy supply and demand. Wei et al. [
15] proposed an optimization scheduling model for a multi-period gas–steam–electricity coupled energy system, considering gas holder penalties, energy procurement costs, and carbon emission costs. Zhou et al. [
16] established a two-layer optimization scheduling model for the operation feasibility of gas turbine standby in multi-energy system scheduling. Alhumaid et al. [
17] built a mixed-integer nonlinear programming model based on minimizing the total operational costs of energy storage systems by evaluating combinations of energy storage technologies and renewable energy sources. Wirtz et al. [
18] analyzed 24 MILP models for multi-sector energy system design and found that incorporating part-load efficiencies minimizes system costs. Guo et al. [
19] optimized integrated electric and thermal energy systems with economics and carbon emissions and adopted a multi-objective quantity regulation scheduling method. Lamari et al. [
20] introduced a multi-objective particle swarm optimization algorithm to reduce emissions and operating costs in virtual power plant systems. Monfaredi et al. [
21] studied a novel optimal operation and planning method for integrated energy systems (IESs) using an adaptive particle swarm optimization technique. Abu-Rayash et al. [
22] designed an integrated solar and wind energy system with compressed air and battery storage, achieving high efficiency and low emissions for a small city. Chen et al. [
23] presented an exergy analysis model and joint solution framework for IESs, providing accurate optimization and evaluation. Liu et al. [
24] formulated a day-ahead scheduling method for regional IESs with hot dry rock, reducing system costs, energy consumption, and emissions. There are two main limitations in the existing literature. First, these studies do not cover the energy system for the gas-to-methanol process. Second, a visual decision-making method for the multi-objective optimization of this process is not available.
The main contribution of this paper is to propose an optimal scheduling method using operating zone models and entropy weights for an energy system in a gas-to-methanol process. First, mechanistic models are developed based on the physical mechanisms of major production facilities, and unknown model parameters are estimated based on historical data through the genetic algorithm. A multi-objective optimization problem is formulated, with the objectives of minimizing gas loss, steam loss, and operating costs. The required operating constraints include equipment capacities, energy balance, and energy coupling relationships. The entropy weight approach is then employed to convert this problem into a single-objective optimization problem. Second, the optimization problem is solved based on an operating zone model, as it is composed of all steady-state data points from the mechanistic models satisfying all operation constraints, to formulate a high-dimensional geometric space. By projecting the operating zone model on the decision variable plane, an optimal scheduling solution is obtained in a visual manner with contour lines and auxiliary lines. In real industrial production, the gas-to-methanol process often relies on experience-based scheduling, leading to a lack of trust among industrial plant operators in optimizing-based decision-making. The main challenge is how to develop an optimization model for the gas-to-methanol process and to facilitate its visual decision-making within a multi-objective framework. To the best of our knowledge, such an optimal scheduling method using operating zone models and entropy weights for an energy system in a gas-to-methanol process is the first one in the literature. The proposed method resolves the above-mentioned challenge.
The remainder of this paper is structured as follows.
Section 2 introduces the problem description.
Section 3 covers mechanistic modeling and optimization problem formulation.
Section 4 presents detailed steps of the proposed method. Case studies based on Aspen Hysys are provided in
Section 5. Concluding remarks are given in
Section 6.
2. Problem Description
A schematic diagram of an energy system is shown in
Figure 1, consisting of a gas subsystem (green) and a steam subsystem (red) in a gas-to-methanol process. In the gas subsystem, the coke oven is the only gas production unit. Coal is distilled in the coke oven to produce the crude gas, which is purified through wet coking and is treated to obtain the gas
. There are four consumption branches of
: recycled gas,
, for the combustion chamber, combustion gas,
, for the steam boiler, conversion gas,
, for the methanol production, and storage gas,
, for the gas holder. Here,
is maintained in a certain ratio to
to provide the heat required for coking.
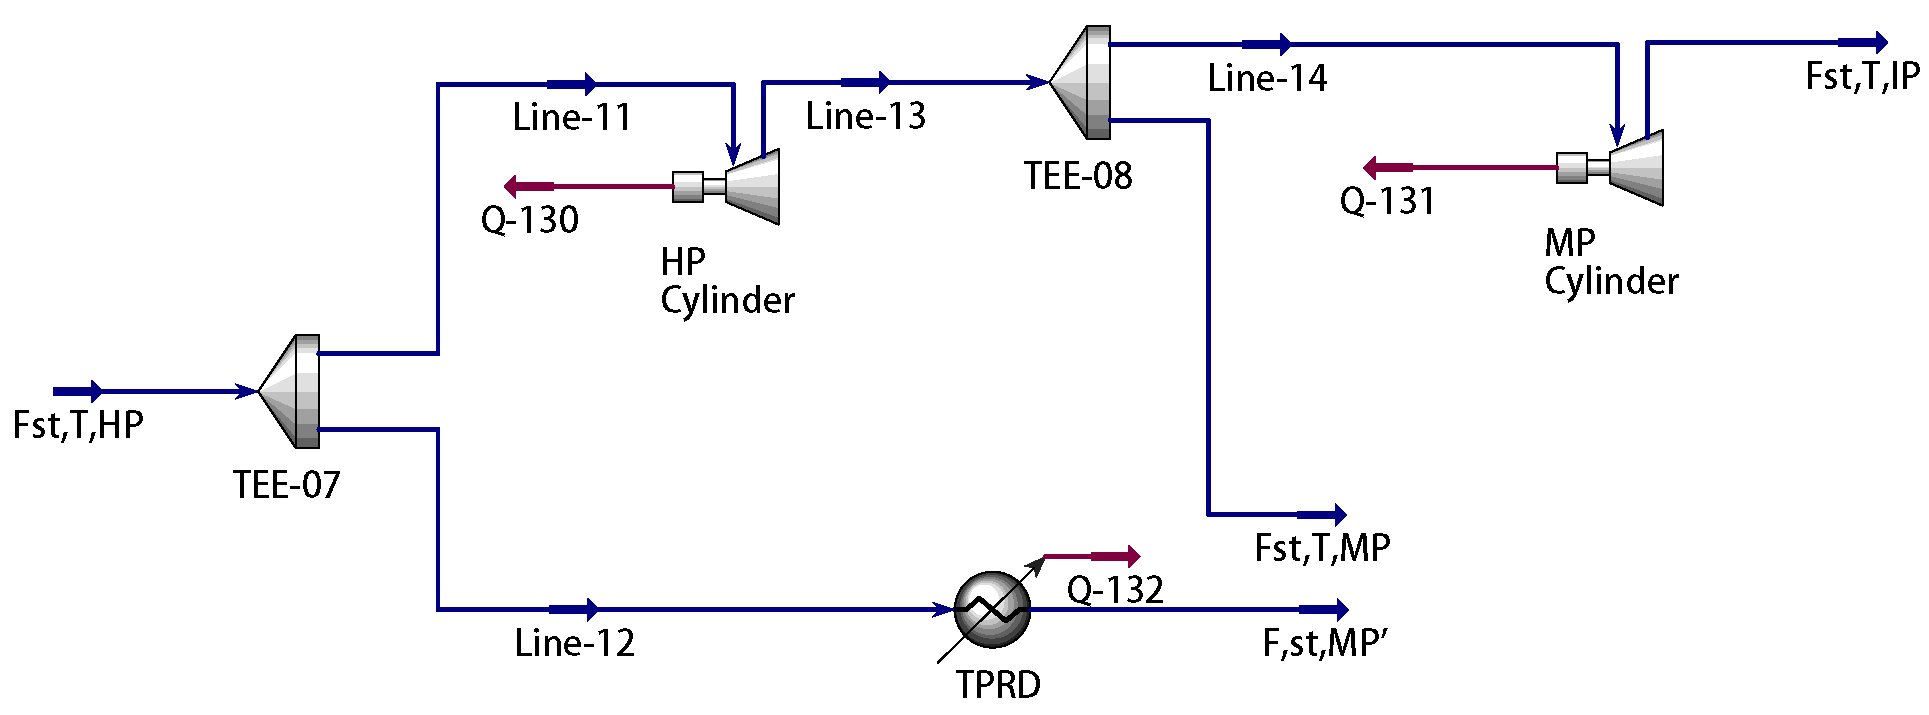
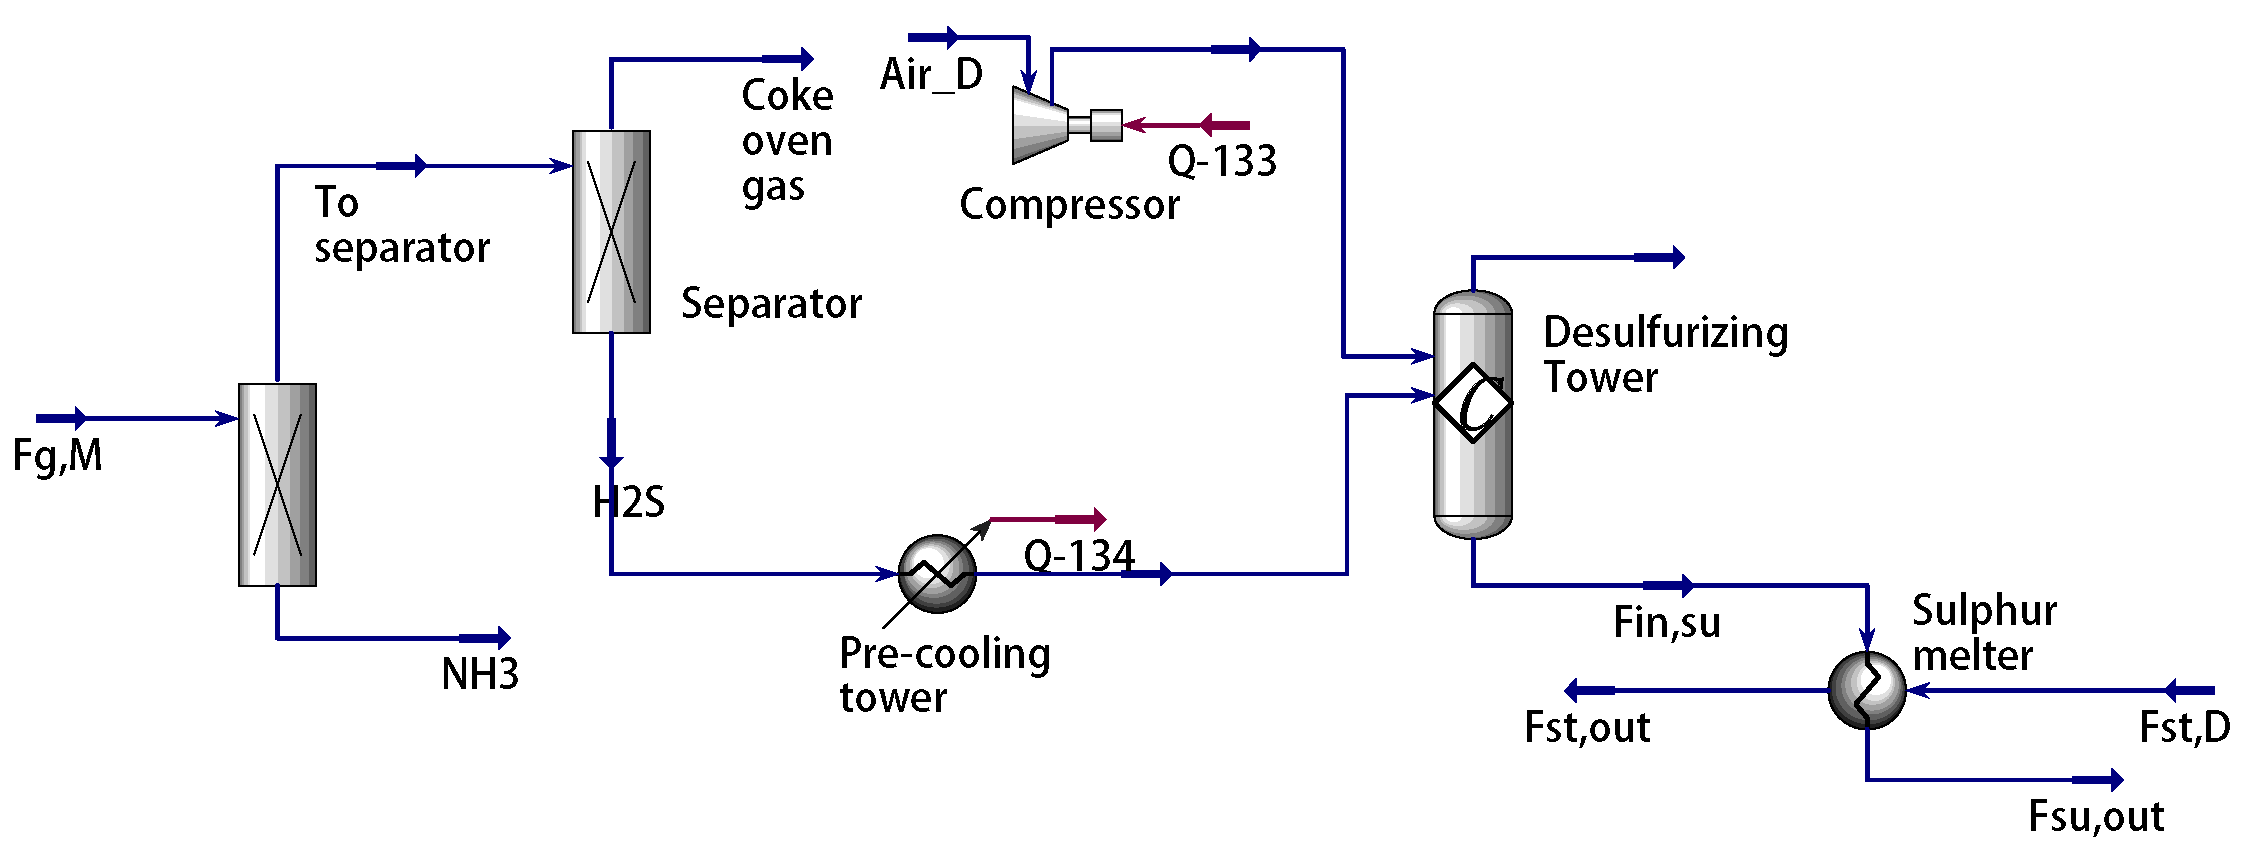
In the steam subsystem, the boiler and turbine unit are the facilities for producing steam. The boiler uses the heat of gas, , combustion to convert deaerated water into steam, . The steam, , from the turbine unit is extracted from the medium-pressure cylinder after cooling and pressure reduction. The steam-consuming facilities are mainly concentrated on methanol production. Organic sulfur is first removed from the gas, , via desulfurization so that it can enter the conversion subprocess. In the converter, and unsaturated hydrocarbons undergo oxidation and steam conversion reactions with pure oxygen to produce , , , and other active components required for the synthesis of methanol. These components are then transferred to the synthesis subprocess via a syngas compressor, and methanol is synthesized in the presence of a catalyst. Here, the steam required to convert the gas, , includes steam, , consumed via desulfurization, steam, , consumed via air separation to provide pure oxygen for the conversion subprocess, and steam, , consumed via the syngas compressor.
Due to the fluctuations in methanol production, there are often imbalances between the production and consumption of the gas and steam subsystems. These imbalances are reflected in the gas loss, , and steam loss, . Although the gas holder can buffer the imbalance in the gas subsystem, the small volume constraint of the gas holder often leads to a temporary excess or shortage of gas. In the steam subsystem, due to the lack of effective storage methods, industrial plant operators need to produce excess steam as a backup in practice to ensure the safety of methanol production and the efficient utilization of gas.
Given the current values of the total gas flow, , steam extraction, , and gas holder volume, , our objective is to solve an optimization problem in order to minimize the gas loss, steam loss, and operating costs. Operation constraints are mainly from equipment capacities, energy balance, and energy coupling relationships. The optimal solutions of the gases , , and need to be determined, preferably in a visual manner.
5. Case Studies
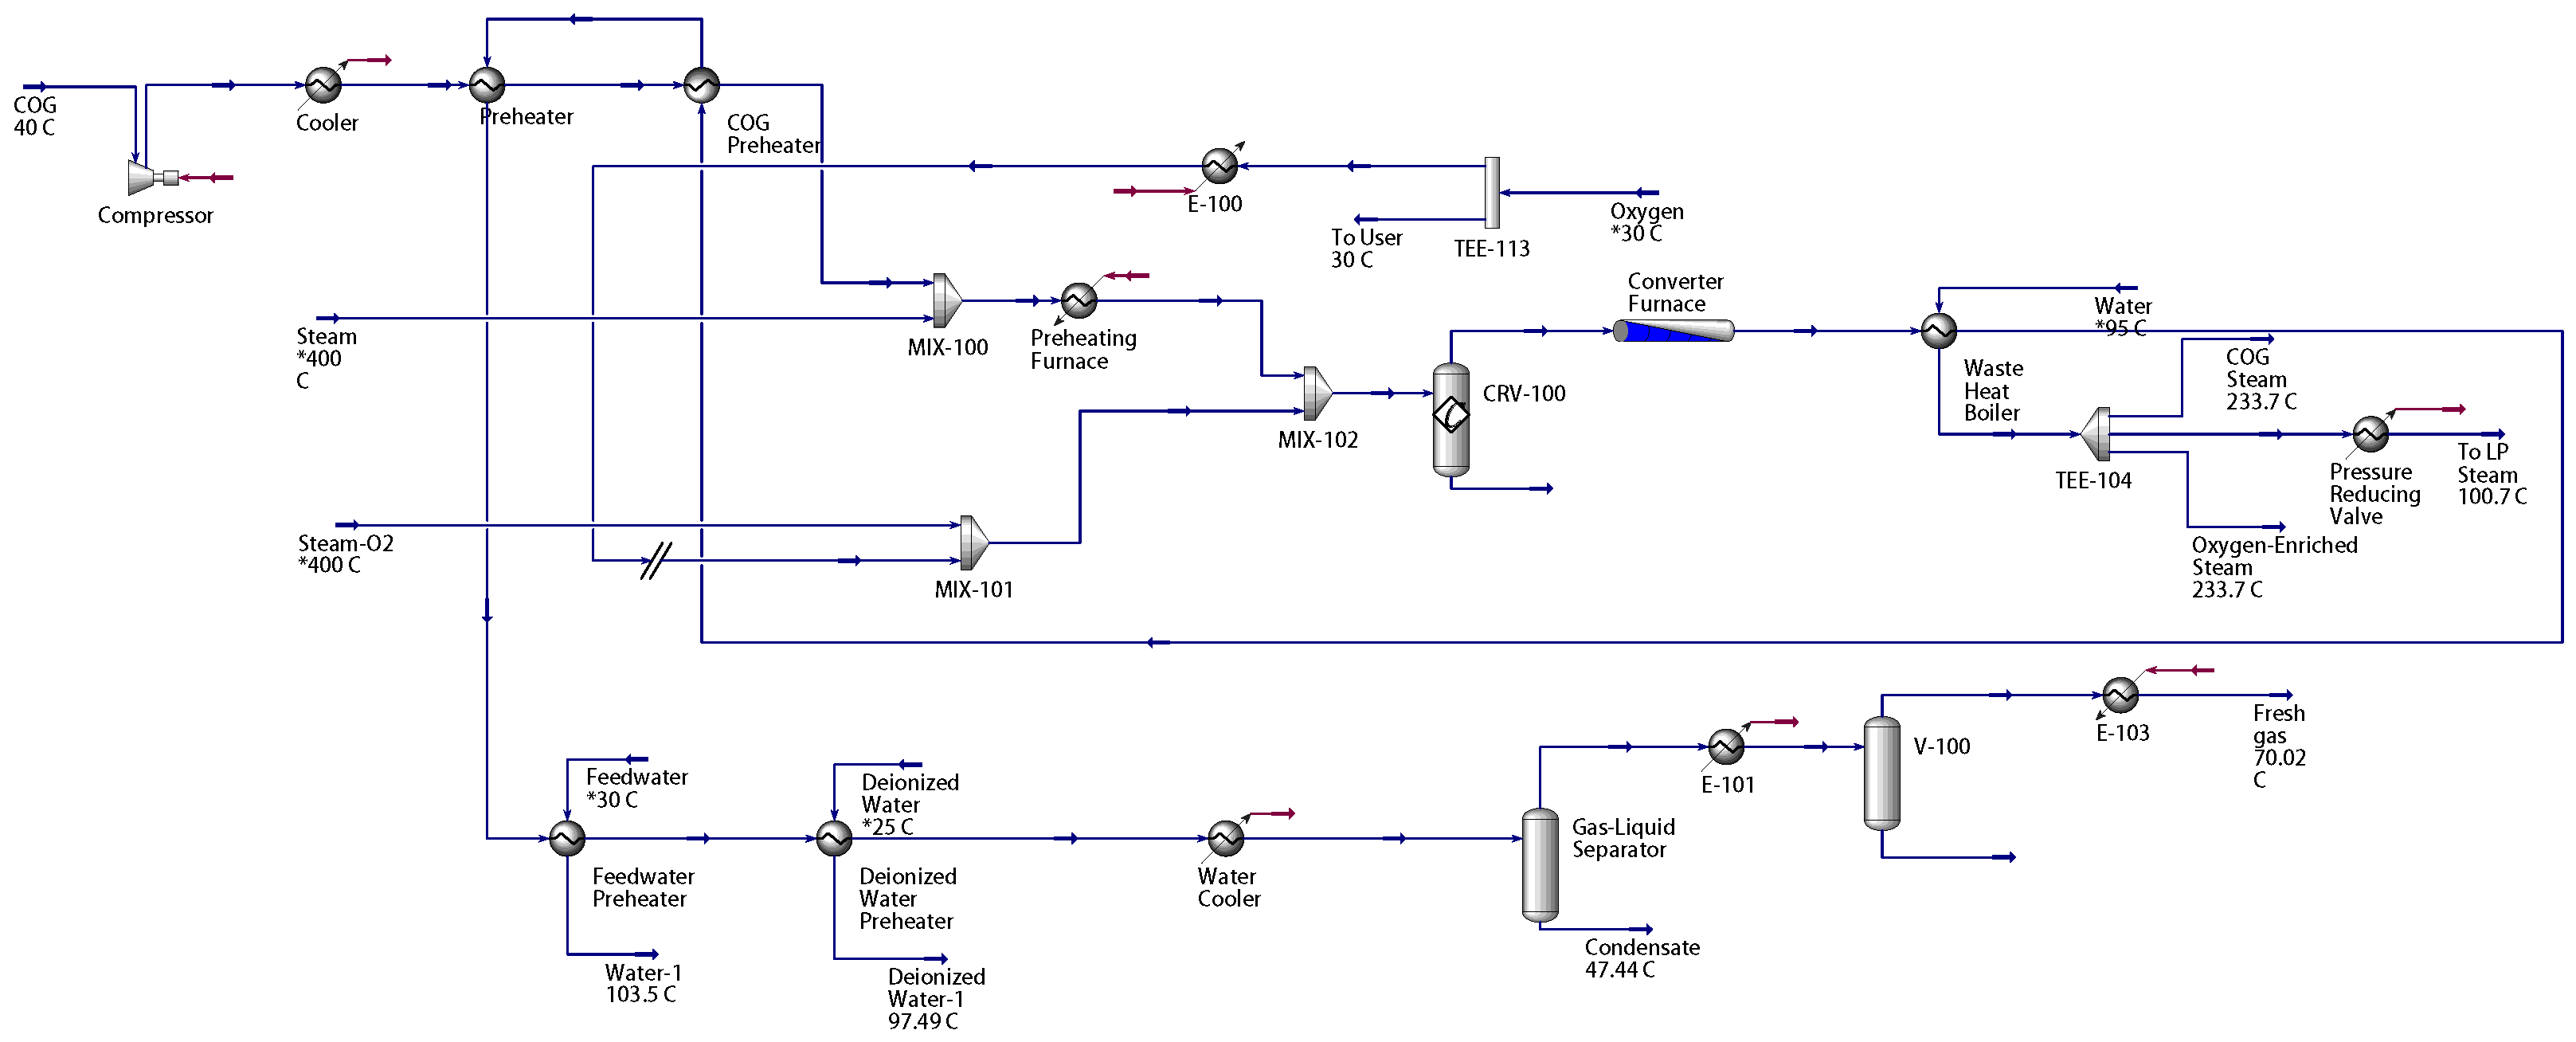
This section provides case studies based on Aspen Hysys to support and validate the proposed method. The mechanistic models of the desulfurization, air separation, syngas compressor, and steam boiler are given in (
17). A simulation model of the gas-to-methanol process in
Figure 2 is set up using Aspen Hysys V11 (Bedford, MA, USA).
Figure A1,
Figure A2,
Figure A3,
Figure A4,
Figure A5 and
Figure A6 depict the Aspen Hysys models of each subsystem in this process [
32]. Given the nominal values of the measurable variables in
Table 1 and the known parameters in
Table 2, the unknown parameters
,
,
, and
in (
16) are estimated using data from the Aspen Hysys model as shown in
Figure 3. The estimation results are shown in
Table 3. The output data from the mechanistic models is overlapped with the counterparts from the Aspen Hysys model in
Figure 3b–f. In particular, the numerical results in
Figure 3c illustrate that the ideal gas assumption in the air separation model is reasonable. Hence, the developed models are quite accurate and can be applied to subsequent optimal scheduling tasks.
The industrial data are used to validate the accuracy of the mechanistic models.
Figure 4,
Figure 5 and
Figure 6 provide the industrial data segments of the air separation and steam boiler models. The unknown model parameters are estimated by maximizing the goodness of fit between the measured output
y and the simulated output
from the mechanistic model;
The model parameters are calculated as
,
,
,
, and
using Equation (
38).
Figure 4j and
Figure 6c show the fitting results of the models. The data segments in
Figure 5 and
Figure 6d–f are used for model validation, with goodness of fit values of 80.84% and 79.33%, respectively. These results indicate that the air separation and steam boiler models in Equations (
7) and (
15) are valid.
To establish an operating zone model, the variation ranges of the variables
,
,
,
, and
in (
20) are given in
Table 4. The dataset for constructing the operating zone model is obtained as
, which is described in the form of a convex hull in (
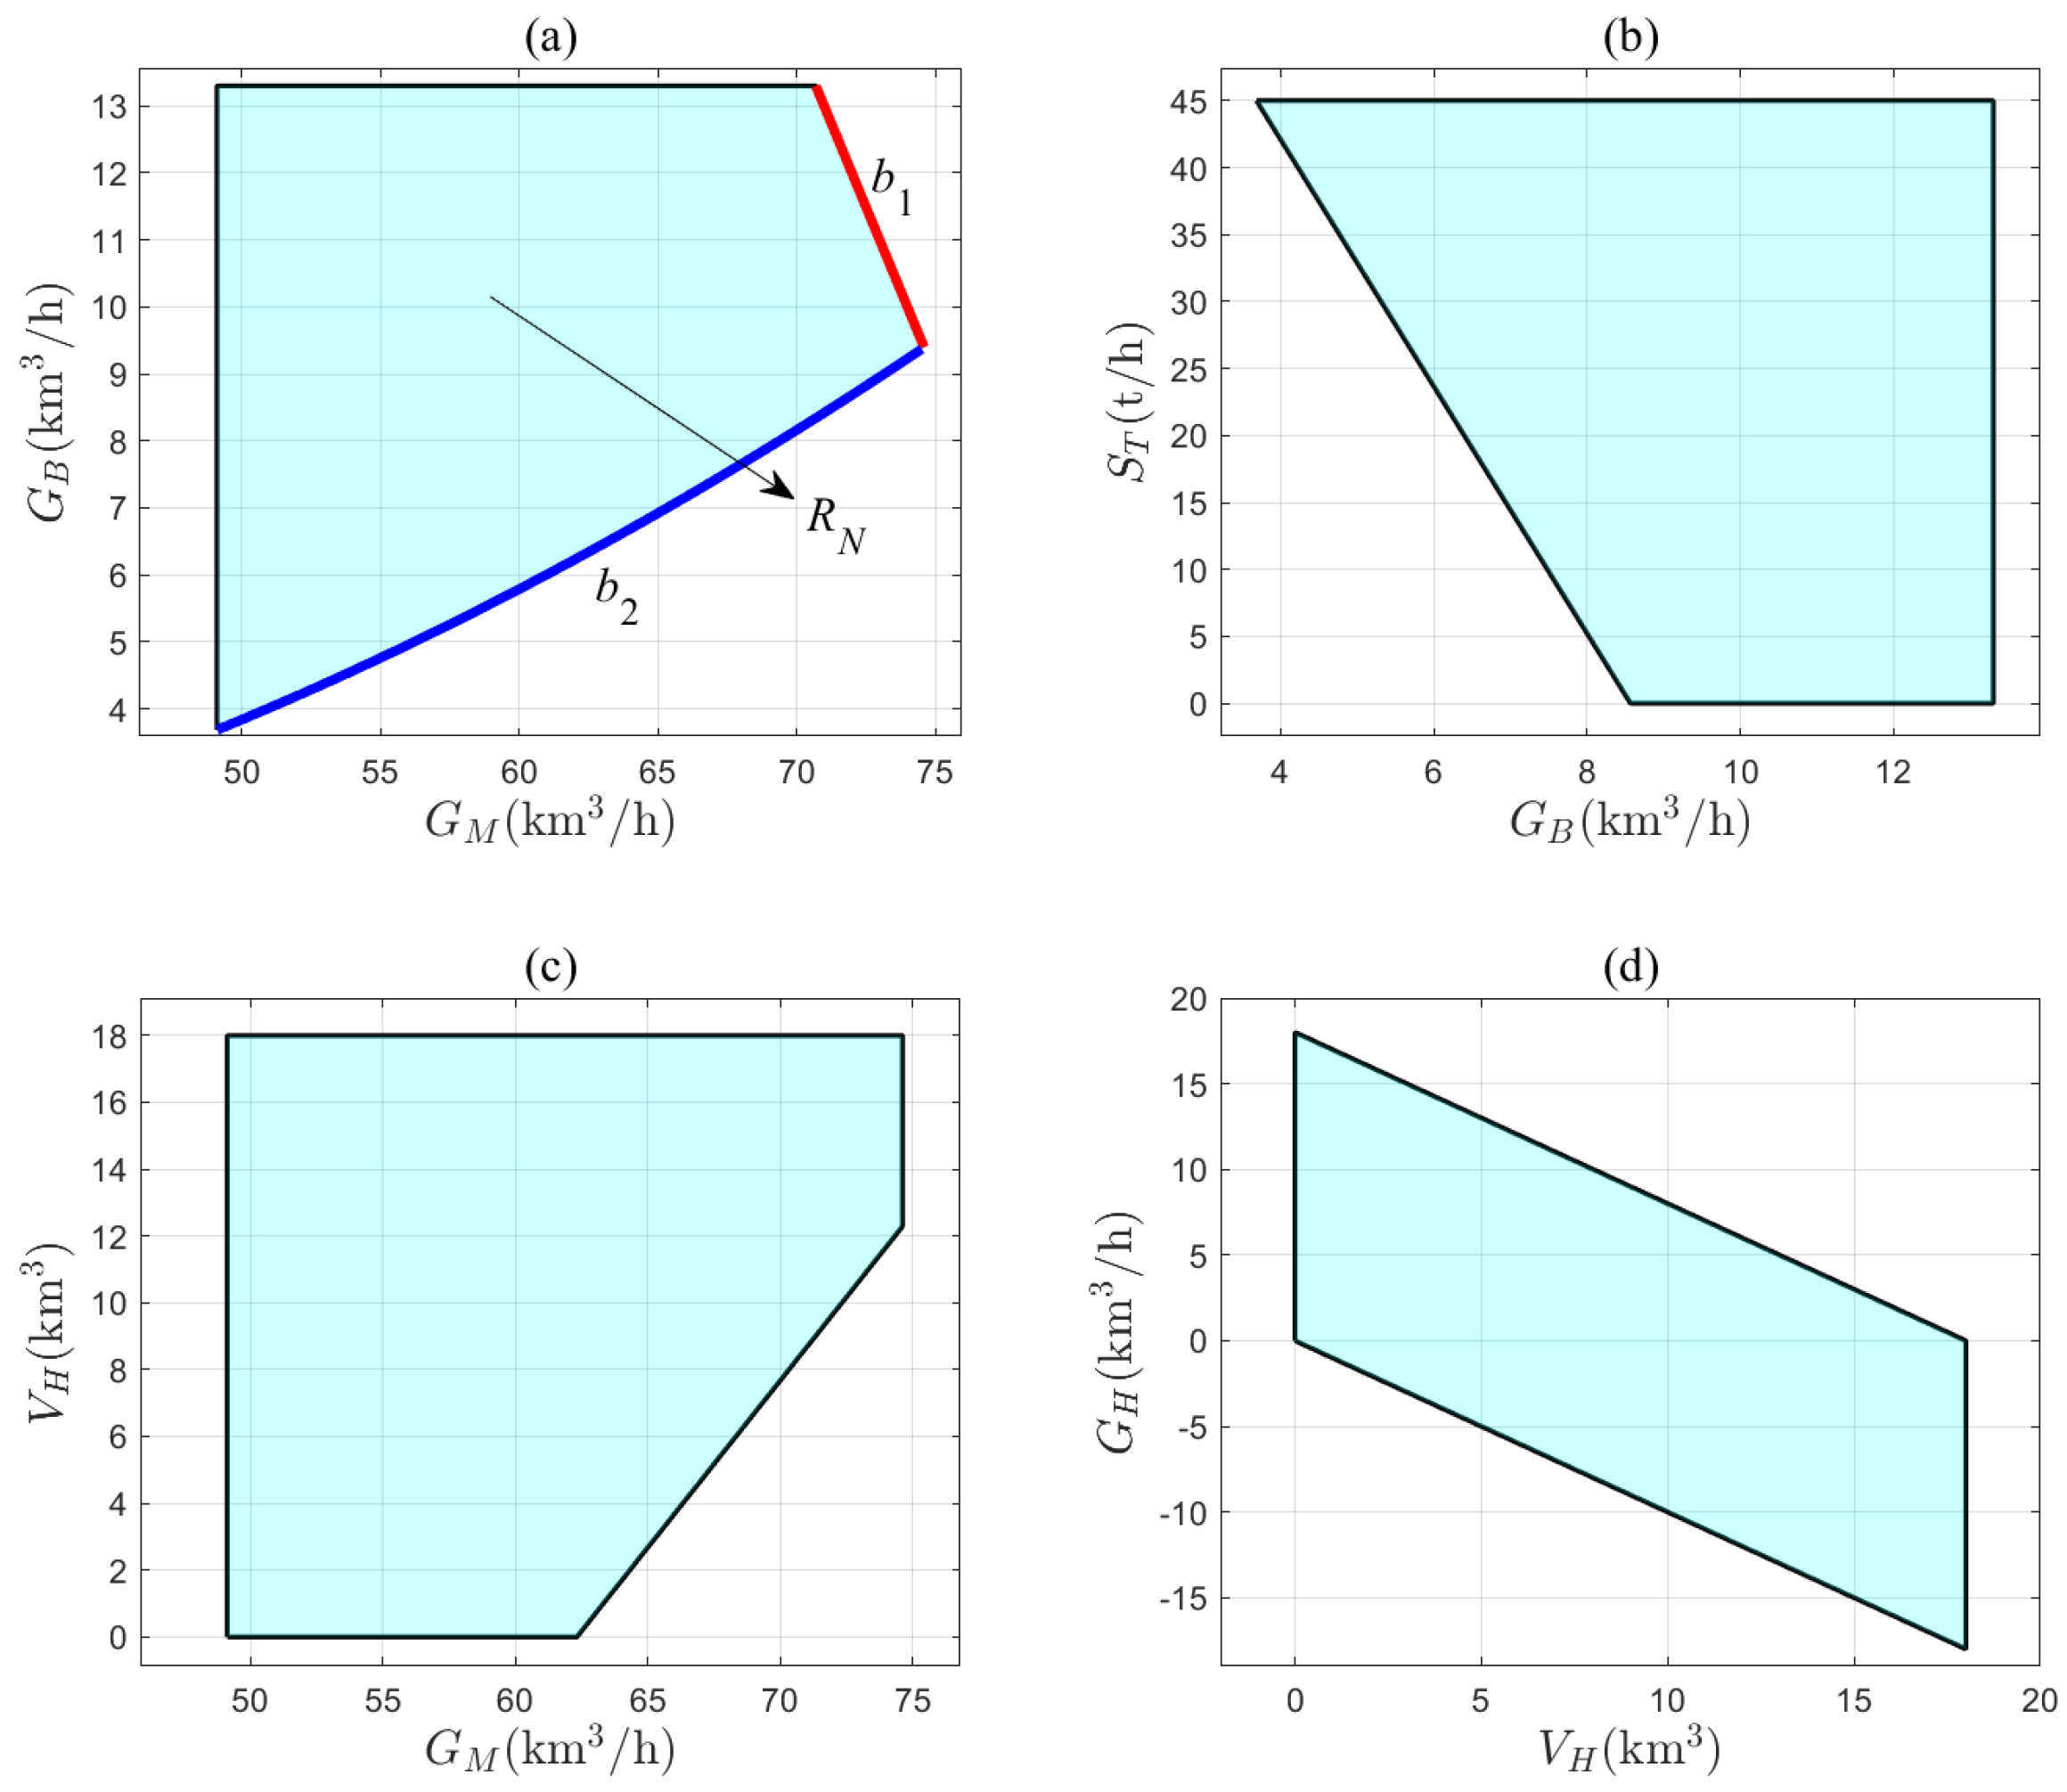
29). The operating zone model shows its projection regions on the two-dimensional planes in
Figure 7. Each boundary of these regions has a corresponding physical meaning. For example,
Figure 7a shows the projection region
of the operating zone model on the
–
plane. The physical meanings of the boundaries
and
are elaborated here.
- (1)
The boundary
corresponds to the operating conditions for
=
,
=
, and
= 0
. The mathematical expression for this boundary can be obtained from (
21) as
The total gas supply, , of the coke oven is maximized, and the full-capacity gas holder supplies all the gas to the system. As the demand for gas, , increases, the system can only maintain the balance between gas supply and demand by reducing the allocation of gas, , to the boiler.
- (2)
The boundary
corresponds to the operating condition for
=
,
= 0
, and
= 0 %. The mathematical description of this boundary is given by (
25) as
where
denotes the inverse function of
. The system has two sources of steam supply: the steam extraction,
, from the turbine and the steam generation,
, from the boiler. When
reaches its maximum value and the steam backup in the steam subsystem is fully utilized, the only way to maintain the balance between steam supply and demand as the gas demand,
, increases is to burn more gas,
, in the boiler to produce enough
.
The optimization problem in (
28) can now be solved. The total gas flow,
, is 110
, the turbine extraction,
, is 35
, the gas holder volume,
, is 8
, and the safety margin,
, is 10% for steam backup. The following price information is given: 234
for
, 500
for
, and 195
for
. Based on the dataset
, the entropy weights are calculated using (
30), with
,
, and
.
In the first stage, the dataset
that meets the input conditions
= 110
and
= 35
is obtained, and a constraint region
shown in
Figure 8 is the projection of this dataset onto the
–
plane. From (
39) and (
40), it is understood that the physical meanings of the boundaries
and
of the projection region
are limited by
and
, respectively. If
and
are given, the operating conditions of
and
cannot reach
and
. Therefore, the displacements of the boundaries from
to
along the vertical axis can be expressed as
and
. Here,
and
indicate that
and
move downward and upward, respectively, causing the projection region from
to
to shrink inward. Substituting the dataset
into (
32) yields the objective values
, which are plotted as a contour map in
Figure 8. The color distribution indicates that, as the values in the right color bar increase from low to high, the objective values expand from the white circle. In (
34), the optimal point (white circle) for the objective
is calculated as
=
. The gas balance line,
(red dashed line), and the steam balance line,
(black dashed line), under the conditions of
= 0
and
= 0
, respectively, are plotted from (
33) and (
25). Their intersection is the optimal point obtained in (
34), which indicates that, at this point, both the gas and steam subsystems can simultaneously achieve the zero-loss objective.
In the second stage, based on the gas holder volume
of 8
, the gas storage
is calculated in (
24). An energy storage region,
(yellow region), in (
35) is given in
Figure 9, where the upper limit,
, and lower limit,
, of
correspond to the operating conditions for
= 10
and
= −8
, respectively. Since
, the optimal point can be calculated using (
36) at different storage levels of the gas holder and is marked with a blue cross in the intersecting region of
and
. If the value of
is chosen to be −4
, the gas balance line
(red dashed line) can be obtained using (
21), as shown in
Figure 9. The intersection of
and
represents the optimal gas allocation value,
.
The scheduling schemes for the first and second stages are presented in
Table 5. To validate the feasibility of the energy allocation,
and
are fed into the Aspen Hysys model in
Figure 2. The simulation results from the Aspen Hysys model are provided in
Table 5. To assess the accuracy of the optimization results, an error percentage,
E, is defined as
Here, the real values are obtained from Aspen Hysys, the calculated values are provided via the proposed method, and the nominal values are given in the sixth column of
Table 5, based on the process operation manual. In general, the acceptable criterion for
E should be less than
. All error percentages in the last two columns of
Table 5 are less than 2%, showing that the calculated values are consistent with the real values. To evaluate the parameter sensitivity, a positive perturbation of 1% is introduced to all parameters in
Table 3. The experiment was then repeated with the updated parameter values in
Table 6. The optimized results are summarized in
Table 7. These results remain consistent with those in the second and third columns of
Table 5, demonstrating the credibility of the proposed method.
6. Conclusions
This paper has proposed an optimal scheduling method using operating zone models and entropy weights for an energy system in a gas-to-methanol process. The first step was to develop mechanistic models for major production facilities, including desulfurization, air separation, syngas compression, and steam boilers, based on their physical mechanisms. The unknown model parameters were then estimated using historical data through the genetic algorithm. A multi-objective optimization problem was formulated, with the objectives of minimizing gas loss, steam loss, and operating costs. Operation constraints were mainly from the equipment capacities, energy balance, and energy coupling relationships. The entropy weight approach was then employed to convert this problem into a single-objective optimization problem. The second step was to solve the optimization problem based on the operating zone model. Through a projection of the operating zone model onto the decision variable plane, the optimal scheduling solution was obtained in a visual manner with contour lines and auxiliary lines. Case studies based on Aspen Hysys illustrated the effectiveness of the proposed method.
In the case studies, the mechanistic models for air separation and steam boilers were validated using industrial data. The remaining models have yet to be validated. In future work, the models for desulfurization and syngas compressors will be validated using industrial data. The validated models will then be integrated into the optimization framework for scheduling in a real industrial setting.


