
An IPSO-FW-WSVM Method for Stock Trading Signal Forecasting


Abstract
:1. Introduction
2. Methodology
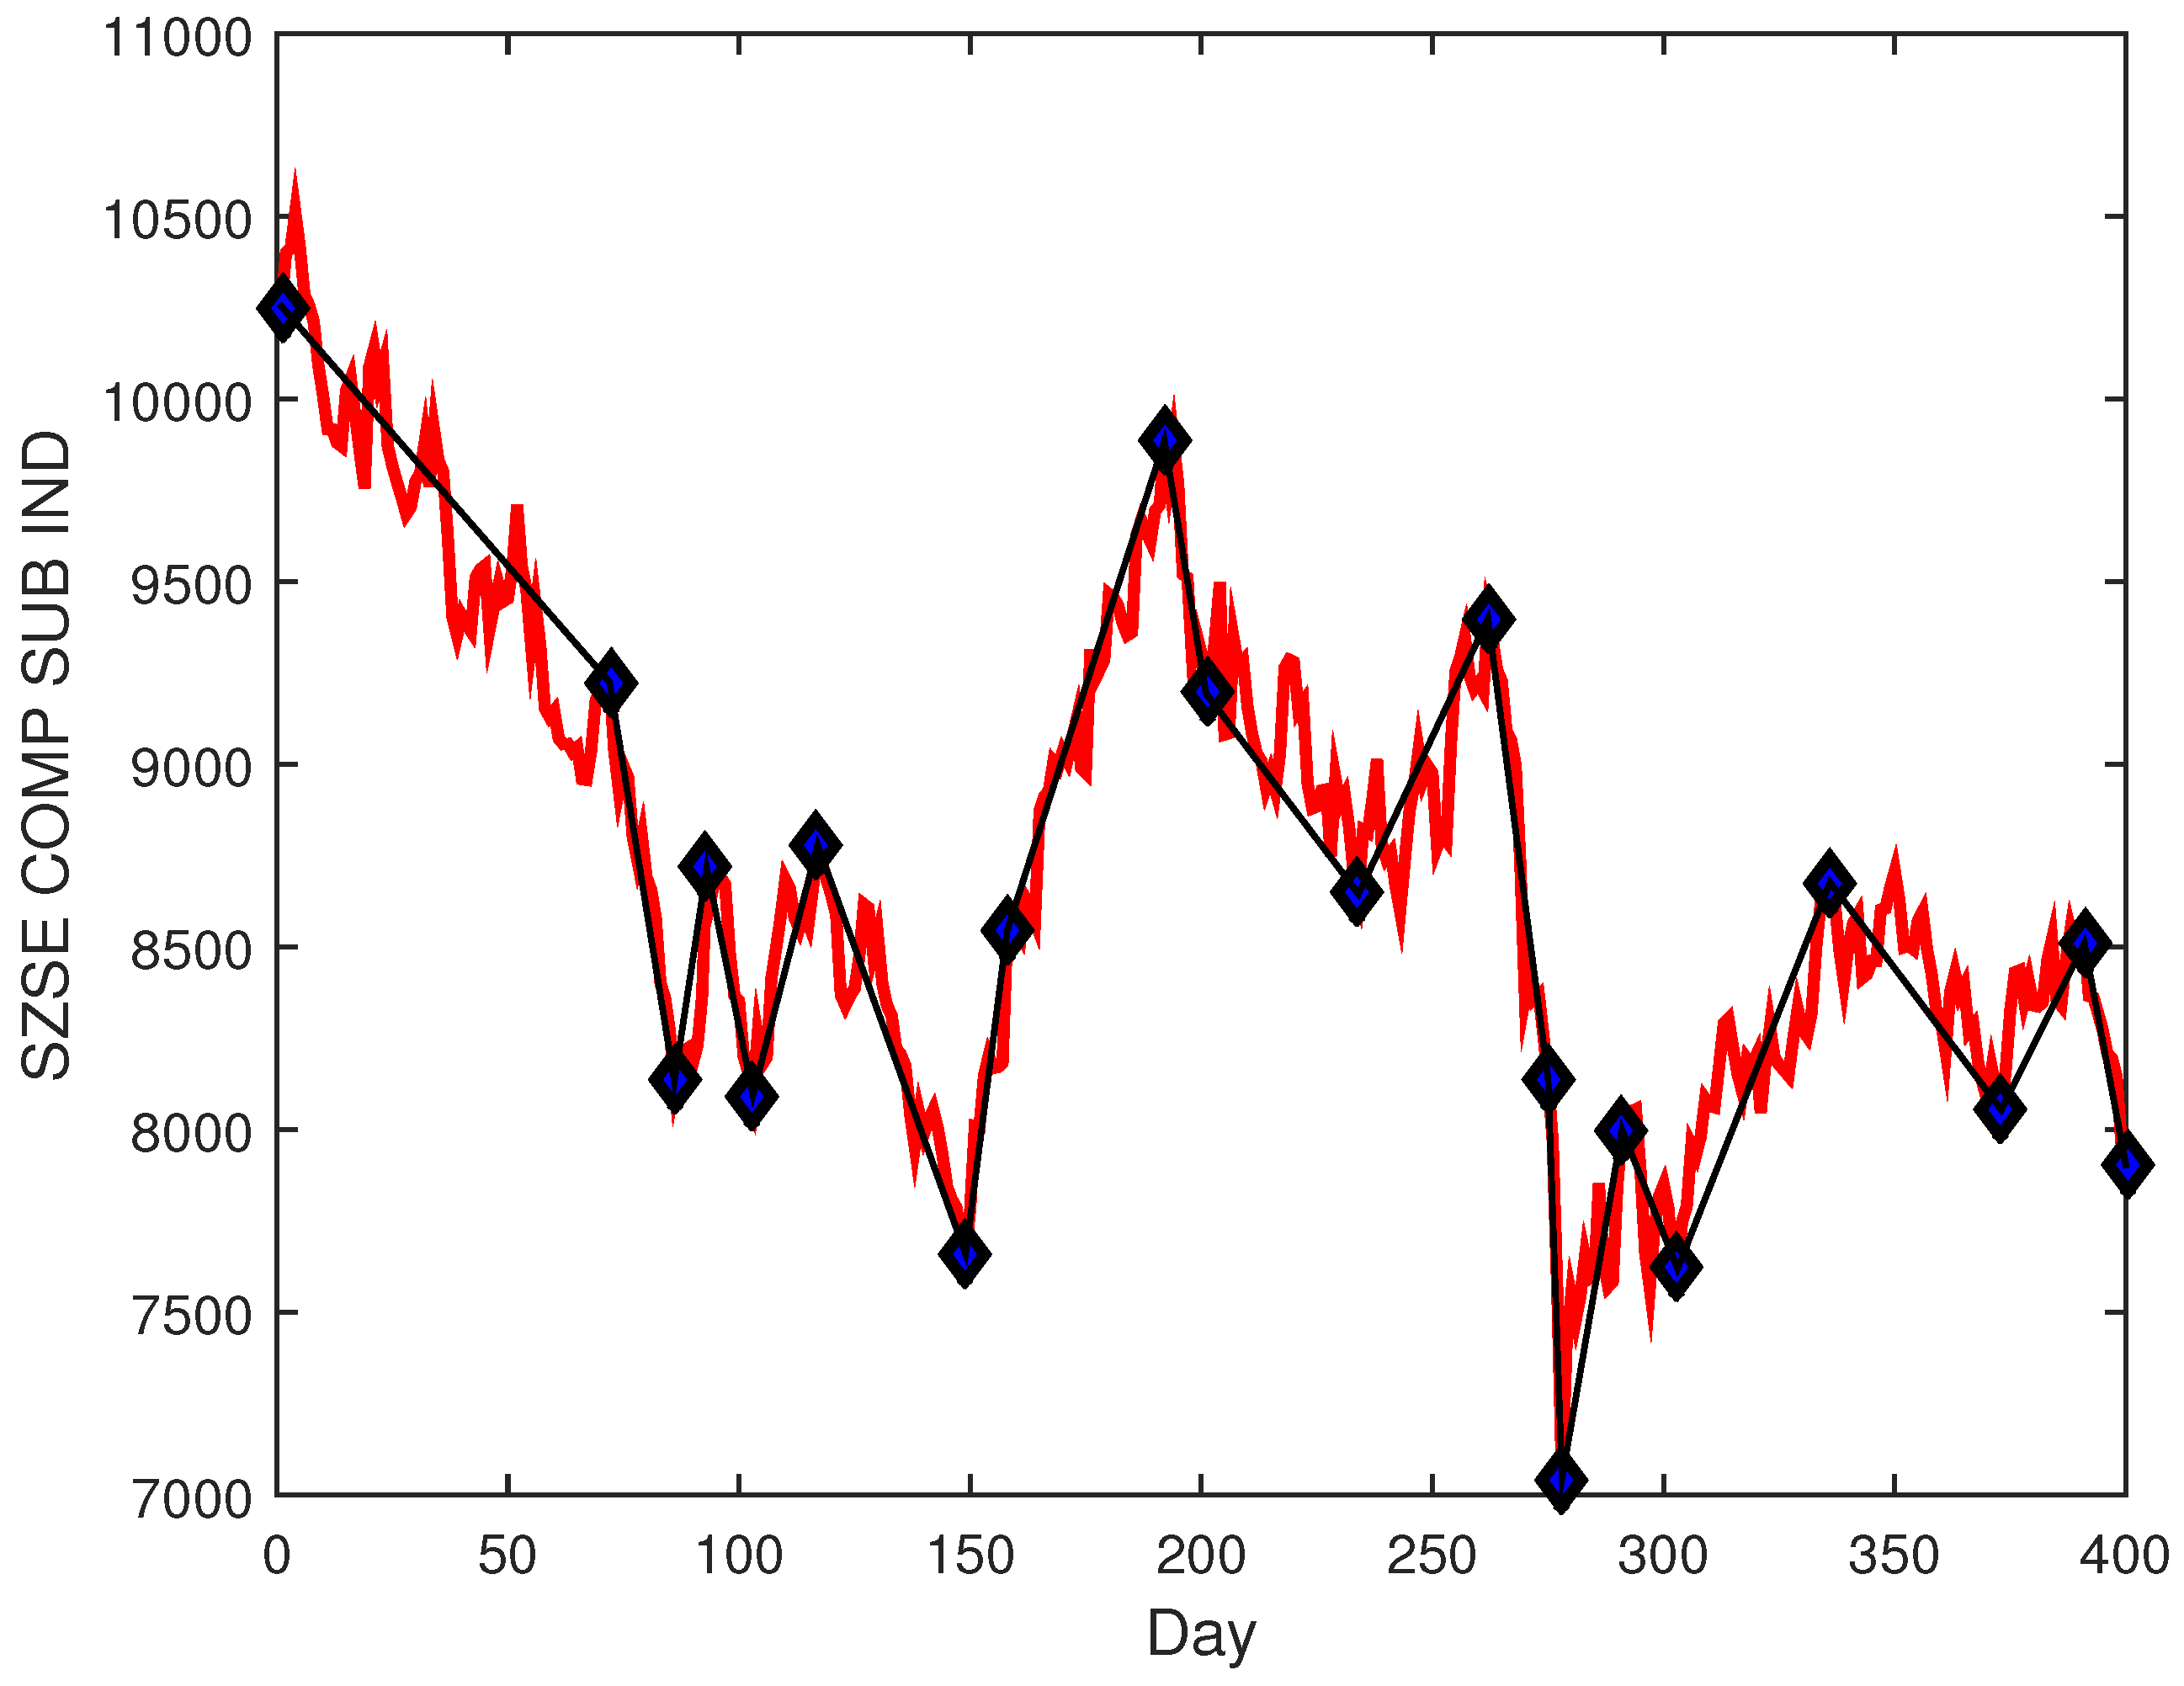
2.1. PLR
2.2. FW-WSVM Based on the Information Gain
2.3. FW-WSVM Parameter Optimization Based on IPSO
| Algorithm 1: Description of FW-WSVM parameter optimization based on IPSO |
|
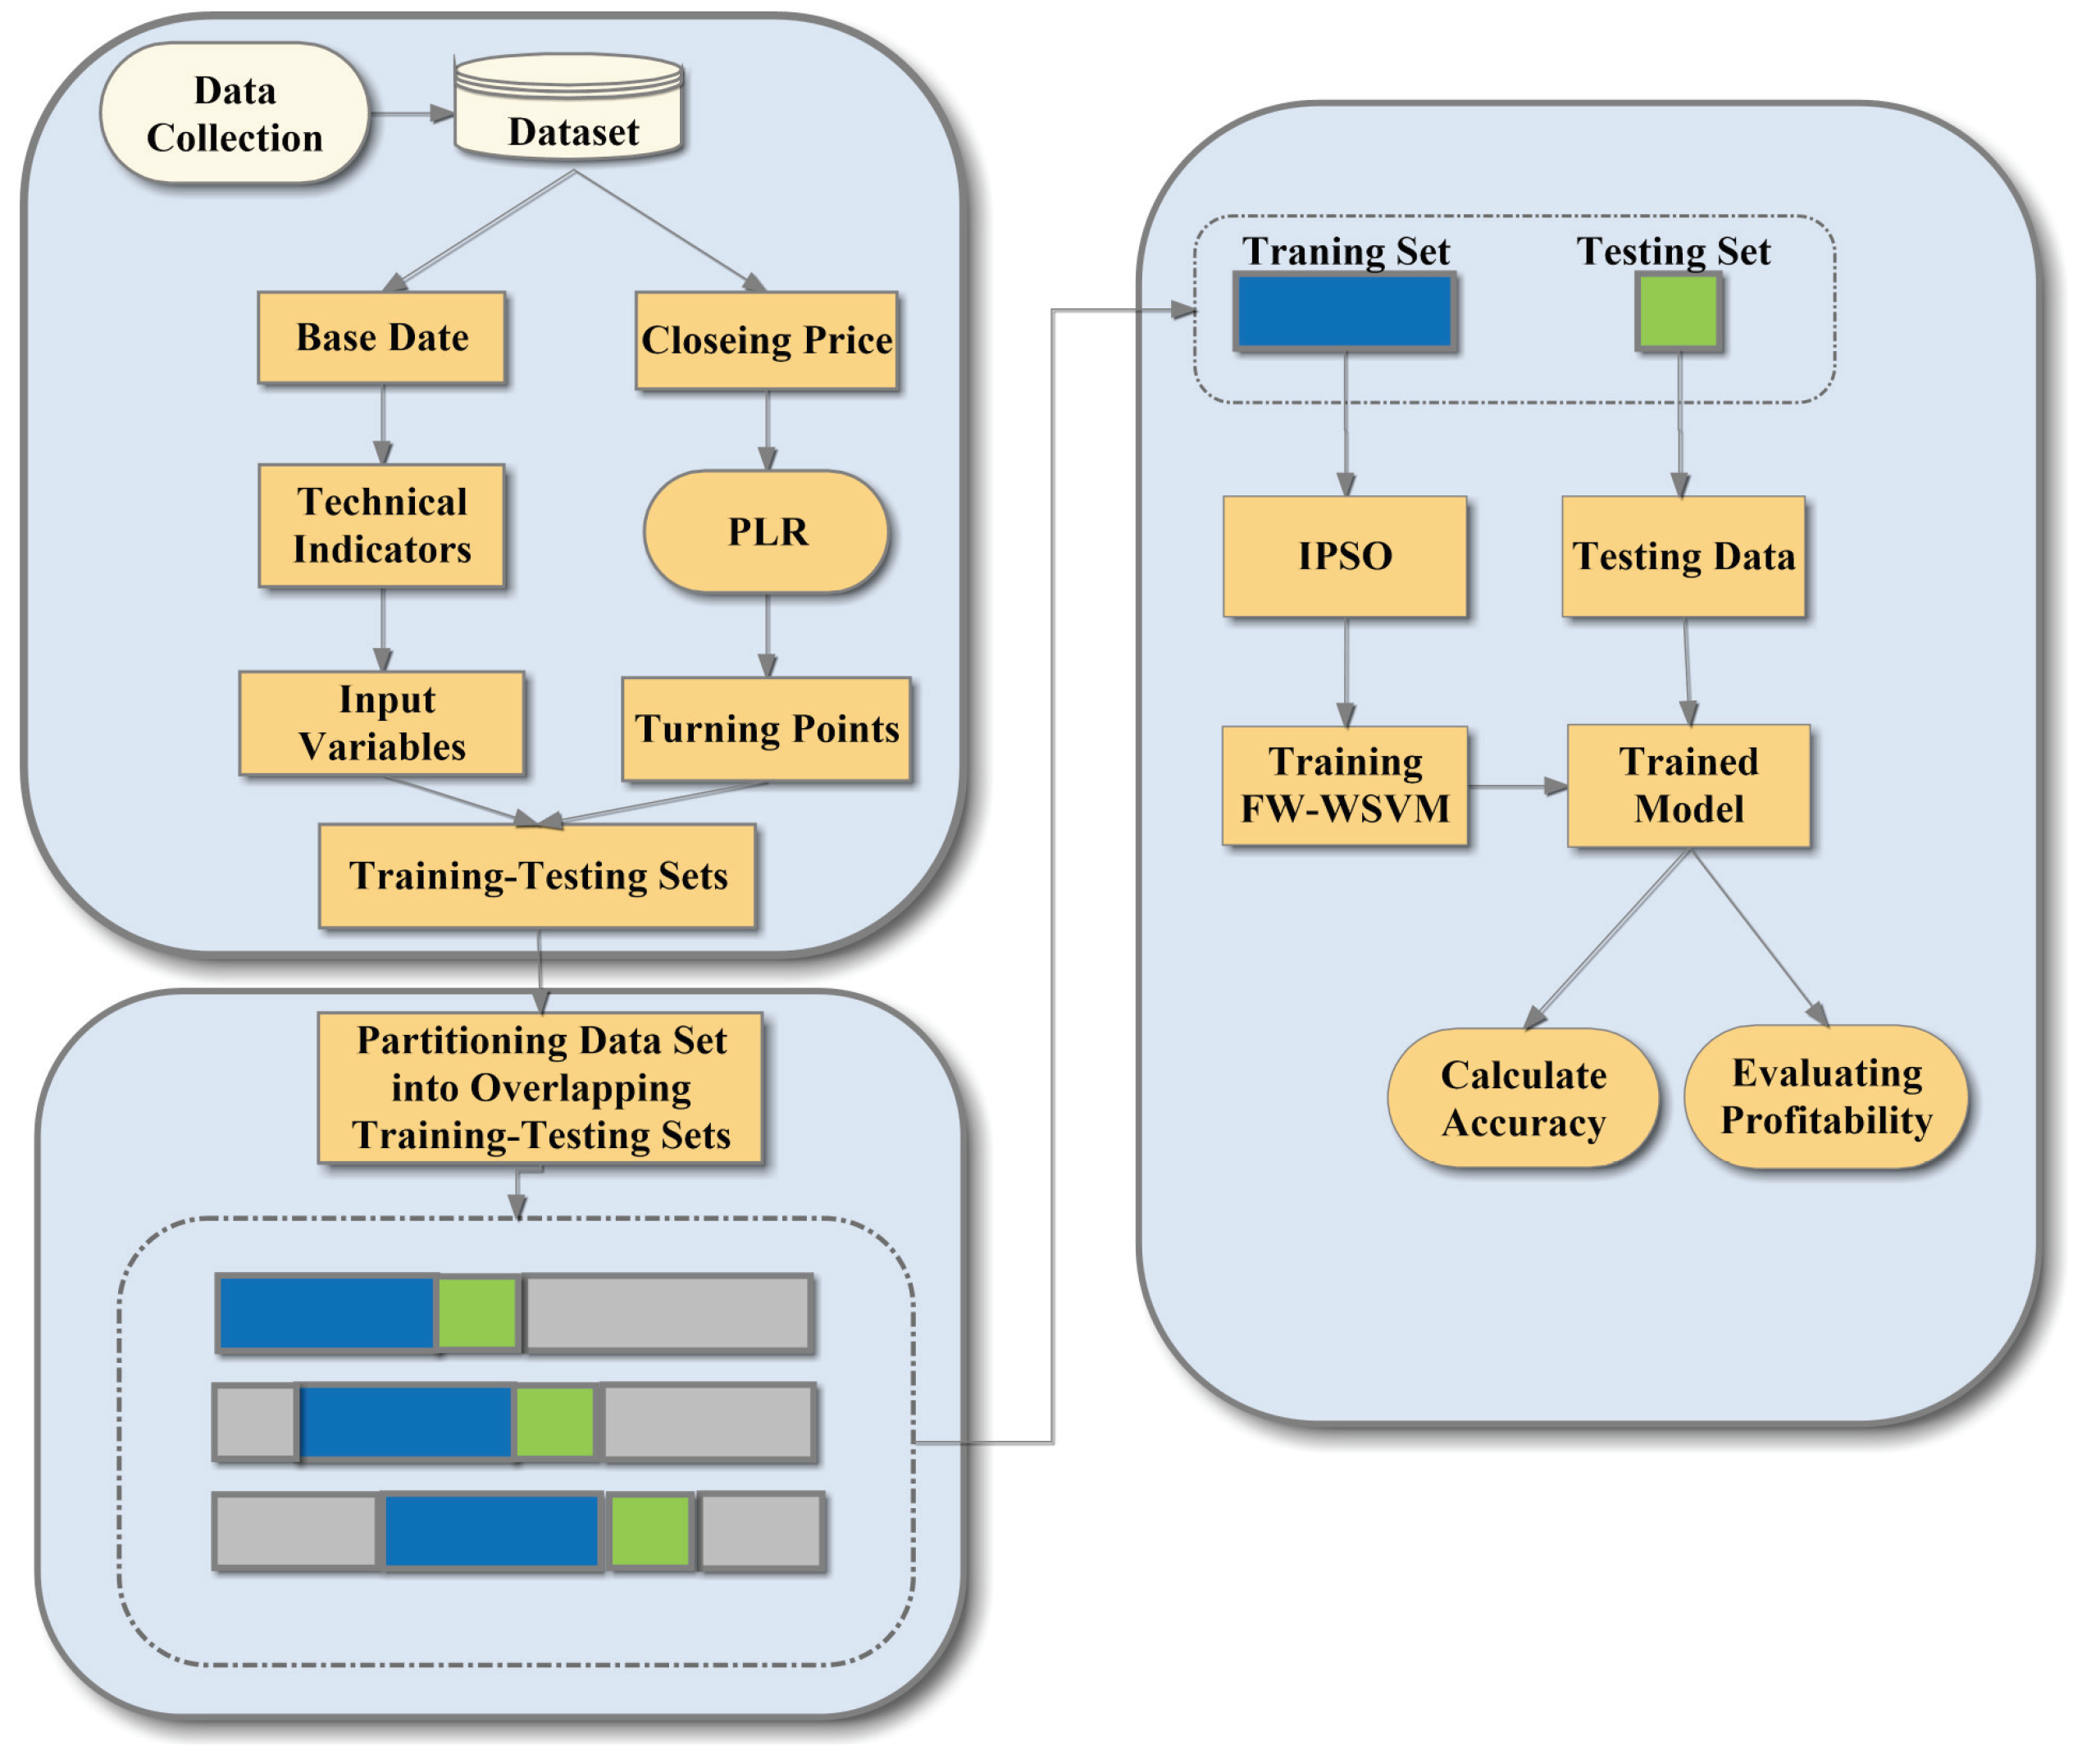
3. Research Design
3.1. Input Variable Selection
- (i)
- Simple Moving Average (SMA)The SMA is a method of statistical analysis that averages prices within a certain period of time for smoothing data.
- (ii)
- Exponential Moving Average (EMA)The EMA is a trend indicator. Its construction principle is to carry out a weighted arithmetic average on the price to judge the change trend for the price in the future.
- (iii)
- Moving Average Convergence/Divergence (MACD)The MACD is a technical indicator that uses the aggregation and separation between the short-term exponential moving average and the long-term exponential moving average of the closing price to judge the time of buying and selling.
- (iv)
- Average Transaction Price (ATP)The ATP is used to identify the average cost of a transaction and can provide more useful information.
- (v)
- Relative Strength Index (RSI)The RSI is a technical curve made according to the ratio of the sum of the rise and fall in a certain period of time. It can reflect the prosperity of the market in a certain period of time.
- (vi)
- Average True Range (ATR)The ATR measures volatility, taking into account any gaps in the price movement.
- (vii)
- William’s %R OscillatorThis is a momentum indicator that measures the overbought and oversold levels.
- (viii)
- Stochastic %K %DThis indicates the momentum of a stock and uses the current close price of the stock.
- (ix)
- Average Directional Movement Index (ADX)The ADX can be used to help measure the overall strength of a trend.
3.2. Data Labeling
3.3. Performance Measure
4. Experimental Results and Analysis
4.1. Data Collection and Experimental Set-Up
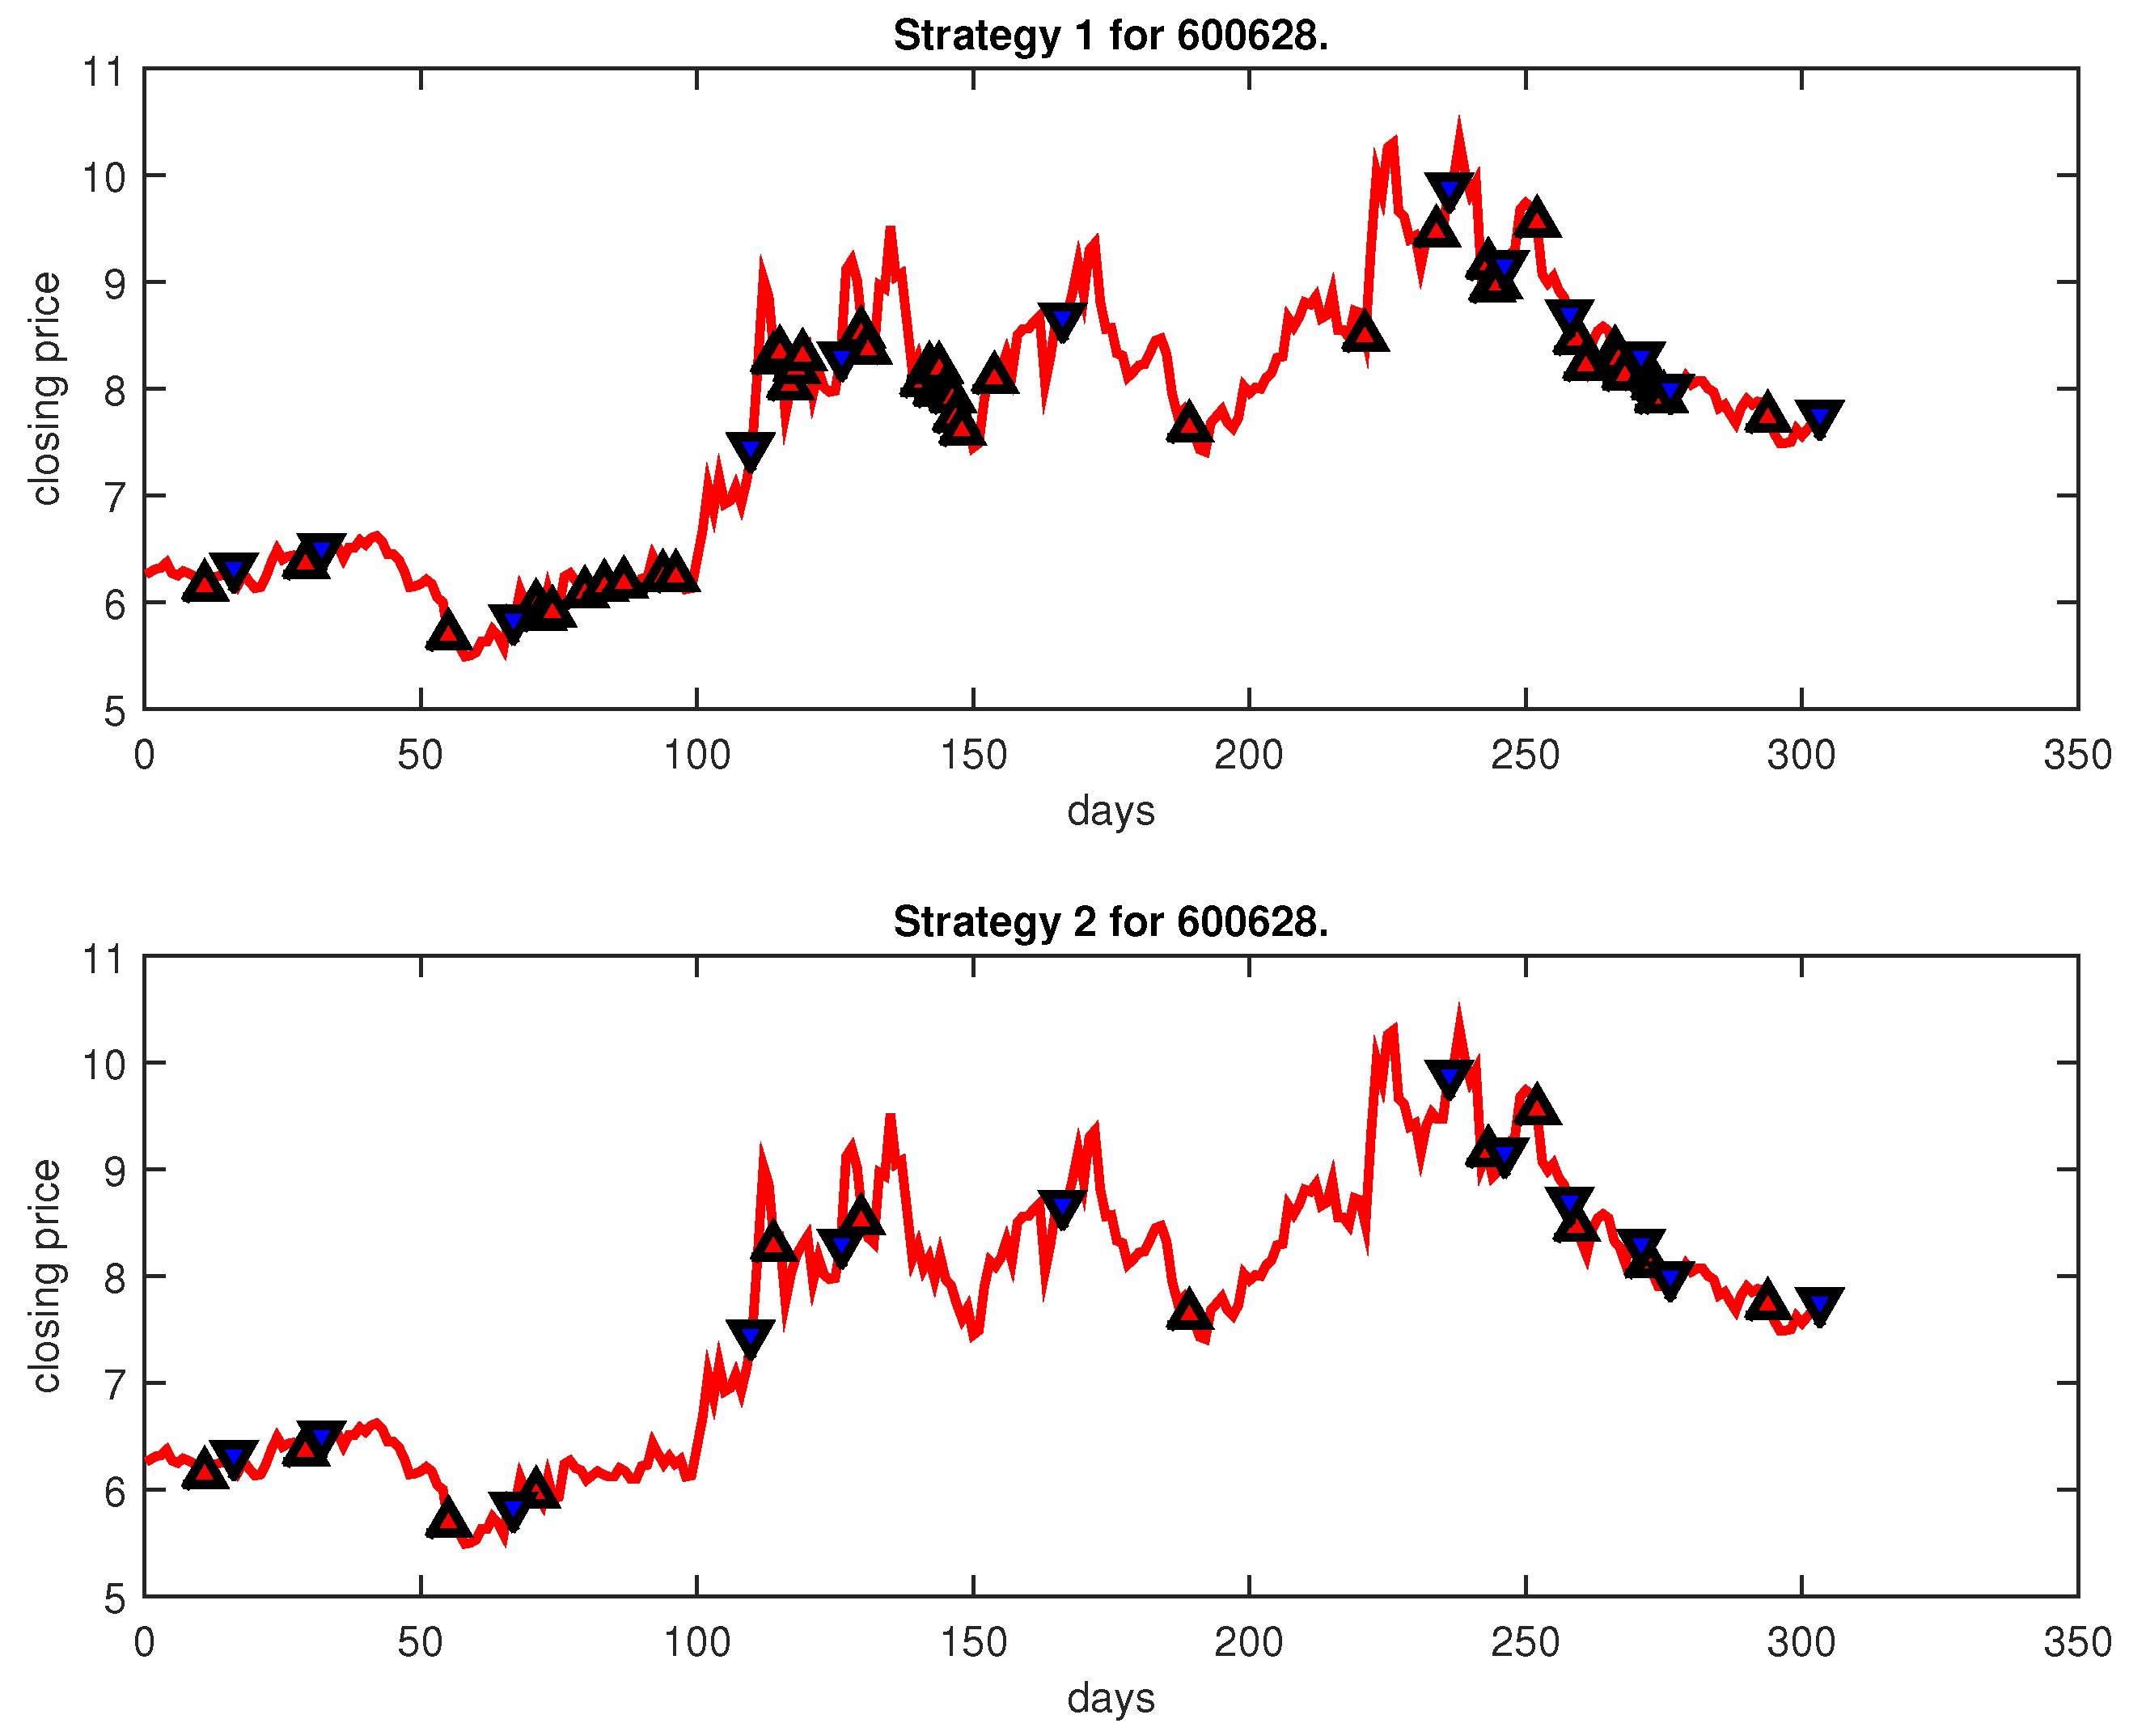
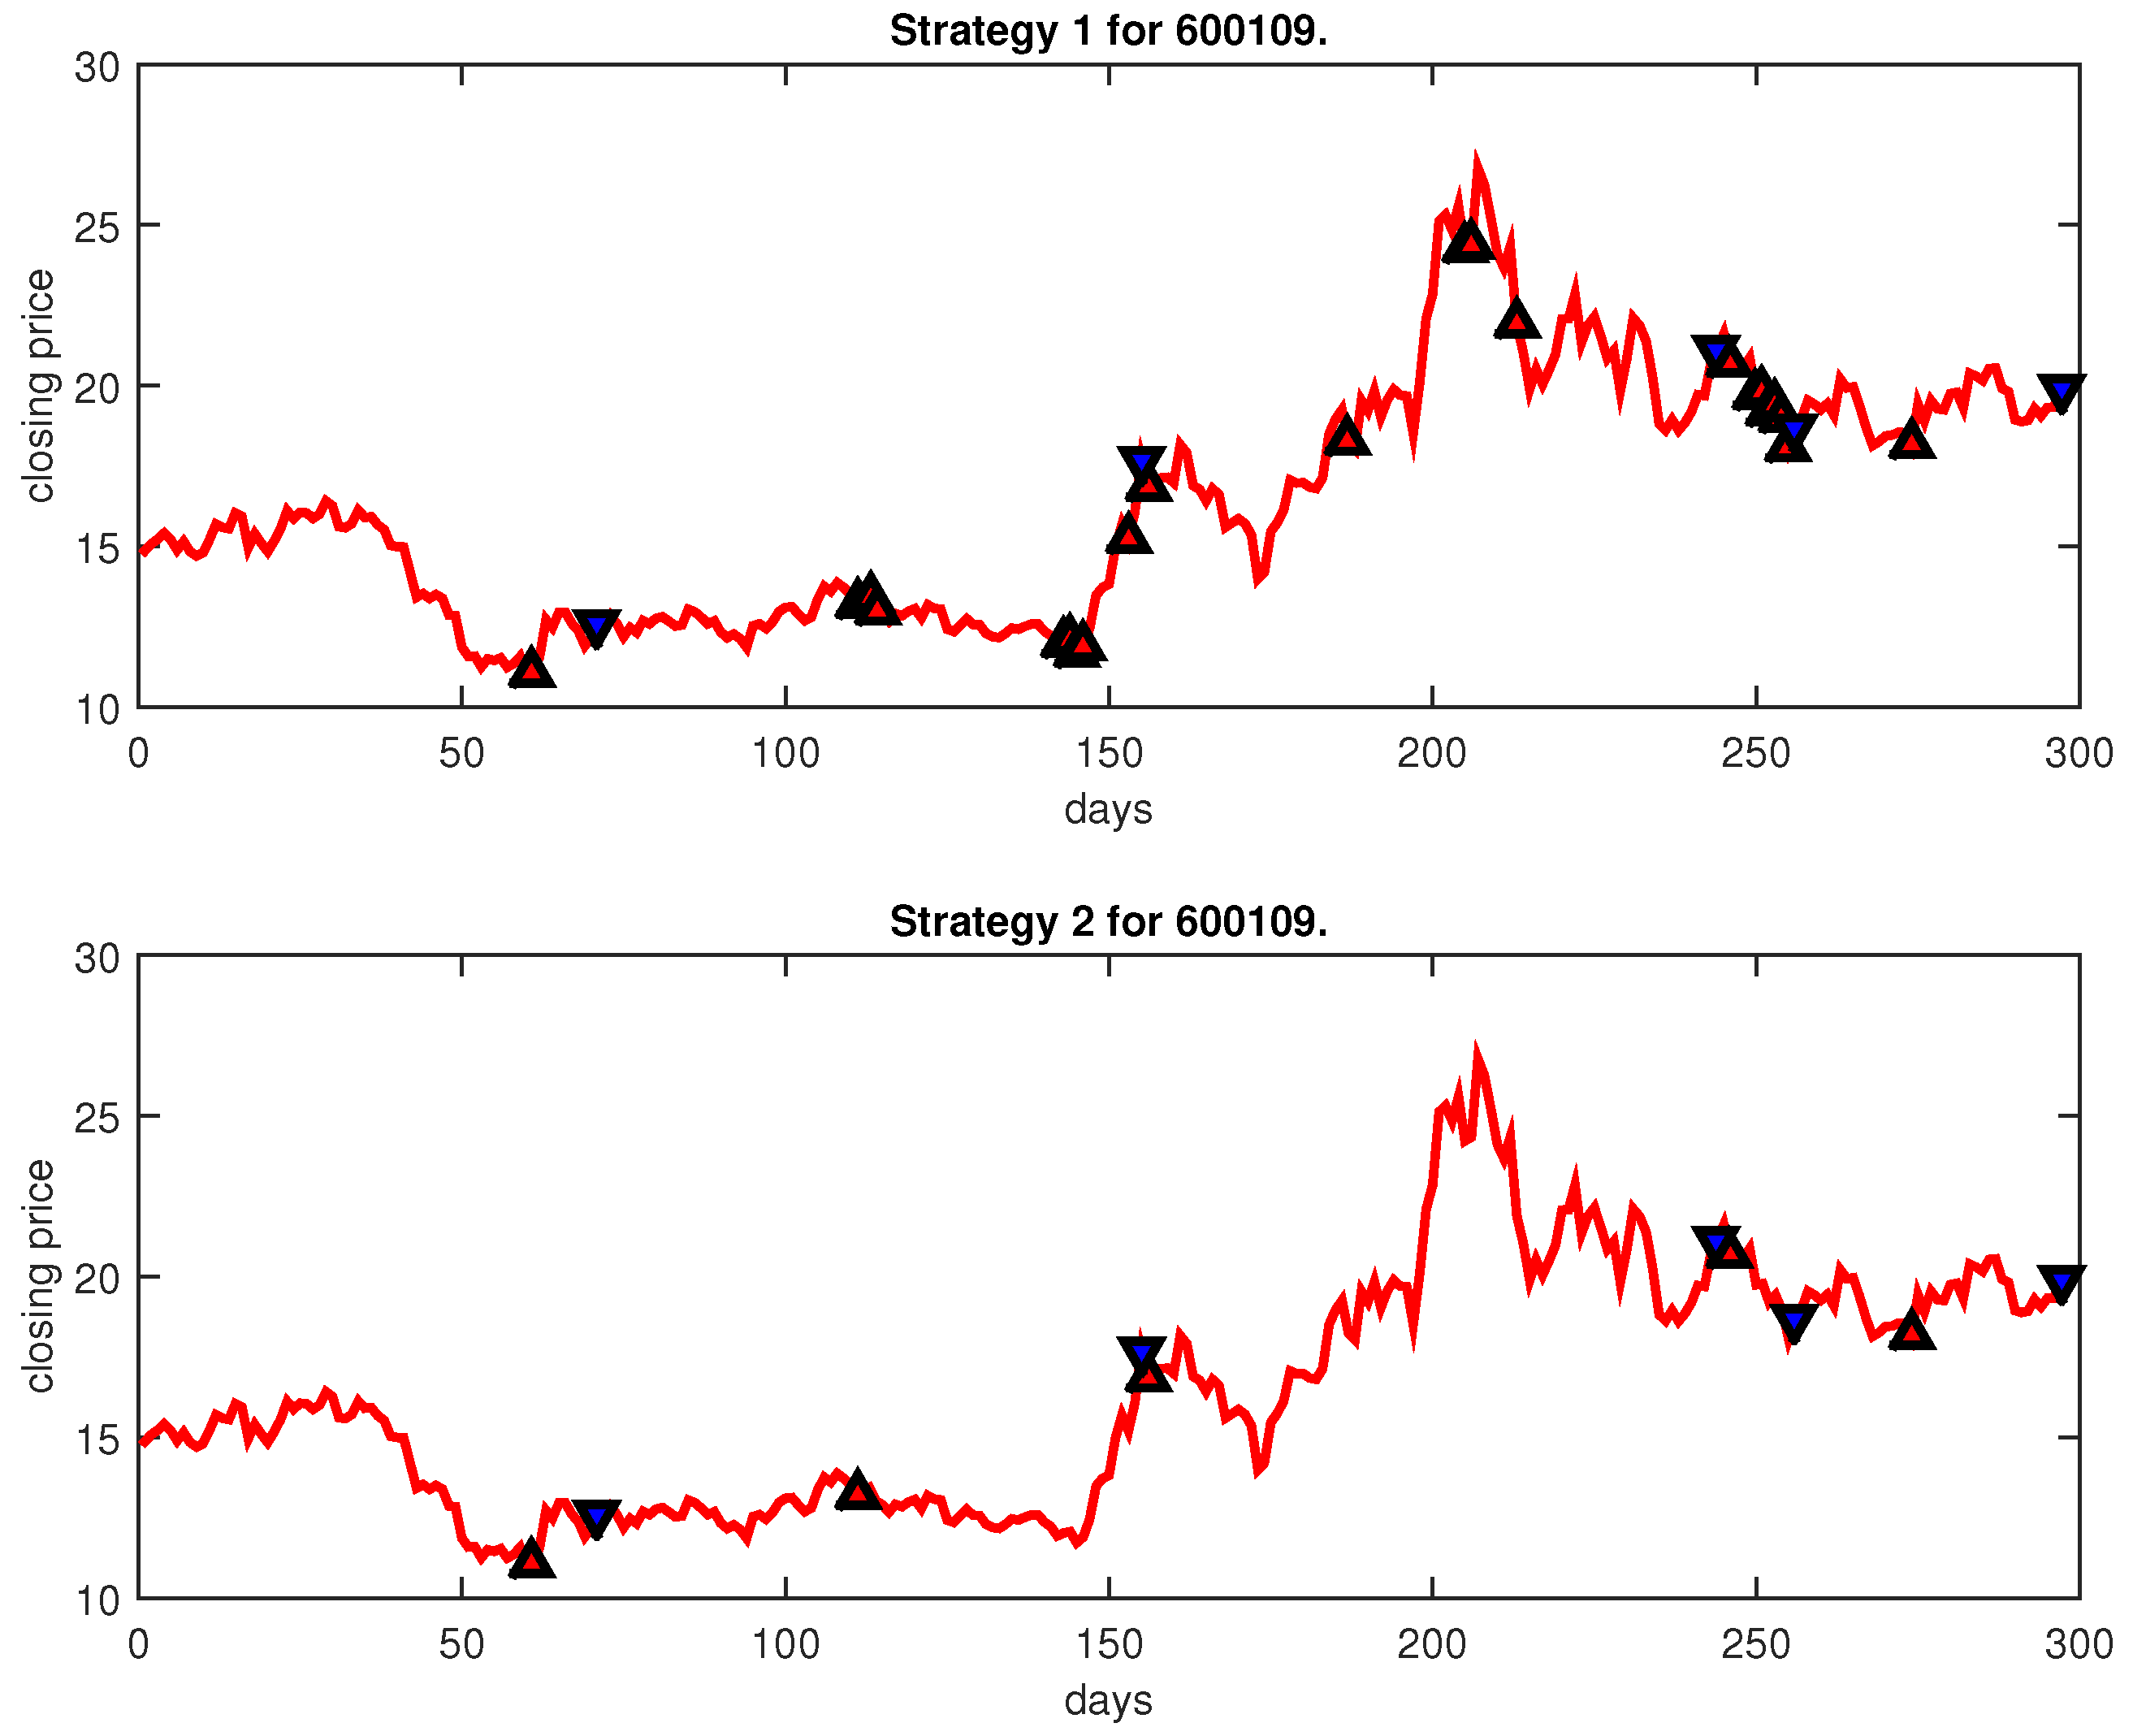
4.2. Experimental Results
5. Conclusions
Author Contributions
Funding
Institutional Review Board Statement
Data Availability Statement
Acknowledgments
Conflicts of Interest
References
- Liu, Y.; Shengdong, M.; Jijian, G.; Nedjah, N. Intelligent prediction of customer churn with a fused attentional deep learning model. Mathematics 2022, 10, 4733. [Google Scholar] [CrossRef]
- Cosma, O.; Pop, P.; Sabo, C.; Cosma, L. Forecasting the number of bugs and vulnerabilities in software components using neural network models. In Computational Intelligence in Security for Information Systems Conference, International Conference on European Transnational Education; Springer: Berlin/Heidelberg, Germany, 2023; pp. 159–168. [Google Scholar]
- Chavarnakul, T.; Enke, D. A hybrid stock trading system for intelligent technical analysis-based equivolume charting. Neurocomputing 2009, 72, 3517–3528. [Google Scholar] [CrossRef]
- Bagheri, A.; Peyhani, H.M.; Akbari, M. Financial forecasting using anfis networks with quantum-behaved particle swarm optimization. Expert Syst. Appl. 2014, 41, 6235–6250. [Google Scholar] [CrossRef]
- Samaras, G.D.; Matsatsinis, N.F.; Zopounidis, C. A multicriteria dss for stock evaluation using fundamental analysis. Eur. J. Oper. Res. 2008, 187, 1380–1401. [Google Scholar] [CrossRef]
- Chen, Y.-J.; Chen, Y.-M.; Lu, C.L. Enhancement of stock market forecasting using an improved fundamental analysis-based approach. Soft Comput. 2017, 21, 3735–3757. [Google Scholar] [CrossRef]
- Huang, Y.; Capretz, L.F.; Ho, D. Machine learning for stock prediction based on fundamental analysis. In Proceedings of the 2021 IEEE Symposium Series on Computational Intelligence (SSCI), Orlando, FL, USA, 5–7 December 2021; pp. 1–10. [Google Scholar]
- Shynkevich, Y.; McGinnity, T.; Coleman, S.; Belatreche, A.; Li, Y. Forecasting price movements using technical indicators: Investigating the impact of varying input window length. Neurocomputing 2017, 264, 71–88. [Google Scholar] [CrossRef]
- Detzel, A.; Liu, H.; Strauss, J.; Zhou, G.; Zhu, Y. Learning and predictability via technical analysis: Evidence from bitcoin and stocks with hard-to-value fundamentals. Financ. Manag. 2021, 50, 107–137. [Google Scholar] [CrossRef]
- Yao, Y.; Cai, S.; Wang, H. Are technical indicators helpful to investors in china’s stock market? a study based on some distribution forecast models and their combinations. Econ. Res.-Ekon. Istraž. 2022, 35, 2668–2692. [Google Scholar] [CrossRef]
- Guegan, D. Chaos in economics and finance. Annu. Rev. Control 2009, 33, 89–93. [Google Scholar] [CrossRef]
- Xue, G.; Zhong, M.; Li, J.; Chen, J.; Zhai, C.; Kong, R. Dynamic network embedding survey. Neurocomputing 2022, 472, 212–223. [Google Scholar] [CrossRef]
- Aras, S.; Kocakoç, İ.D. A new model selection strategy in time series forecasting with artificial neural networks: Ihts. Neurocomputing 2016, 174, 974–987. [Google Scholar] [CrossRef]
- Shahvaroughi Farahani, M.; Razavi Hajiagha, S.H. Forecasting stock price using integrated artificial neural network and metaheuristic algorithms compared to time series models. Soft Comput. 2021, 25, 8483–8513. [Google Scholar] [CrossRef] [PubMed]
- Sharma, D.K.; Hota, H.; Brown, K.; Handa, R. Integration of genetic algorithm with artificial neural network for stock market forecasting. Int. J. Syst. Assur. Eng. Manag. 2022, 13, 828–841. [Google Scholar] [CrossRef]
- Chen, Y.; Hao, Y. Integrating principle component analysis and weighted support vector machine for stock trading signals prediction. Neurocomputing 2018, 321, 381–402. [Google Scholar] [CrossRef]
- Hao, P.-Y.; Kung, C.-F.; Chang, C.-Y.; Ou, J.-B. Predicting stock price trends based on financial news articles and using a novel twin support vector machine with fuzzy hyperplane. Appl. Soft Comput. 2021, 98, 106806. [Google Scholar] [CrossRef]
- Nayak, R.K.; Tripathy, R.; Mishra, D.; Burugari, V.K.; Selvaraj, P.; Sethy, A.; Jena, B. Indian stock market prediction based on rough set and support vector machine approach. In Intelligent and Cloud Computing; Springer: Berlin/Heidelberg, Germany, 2021; pp. 345–355. [Google Scholar]
- Dash, R.K.; Nguyen, T.N.; Cengiz, K.; Sharma, A. Fine-tuned support vector regression model for stock predictions. Neural Comput. Appl. 2021, 1–15. [Google Scholar] [CrossRef]
- Tang, G.; Chiclana, F.; Liu, P. A decision-theoretic rough set model with q-rung orthopair fuzzy information and its application in stock investment evaluation. Appl. Soft Comput. 2020, 91, 106212. [Google Scholar] [CrossRef]
- Podsiadlo, M.; Rybinski, H. Financial time series forecasting using rough sets with time-weighted rule voting. Expert Syst. Appl. 2016, 66, 219–233. [Google Scholar] [CrossRef]
- Jiang, H.; Hu, B.Q. A decision-theoretic fuzzy rough set in hesitant fuzzy information systems and its application in multi-attribute decision-making. Inf. Sci. 2021, 579, 103–127. [Google Scholar] [CrossRef]
- Cao, B.; Zhao, J.; Liu, X.; Arabas, J.; Tanveer, M.; Singh, A.K.; Lv, Z. Multiobjective evolution of the explainable fuzzy rough neural network with gene expression programming. IEEE Trans. Fuzzy Syst. 2022, 30, 4190–4200. [Google Scholar] [CrossRef]
- Miao, J.; Wang, P.; Xu, Z. A bayesian dynamic stochastic general equilibrium model of stock market bubbles and business cycles. Quant. Econ. 2015, 6, 599–635. [Google Scholar] [CrossRef]
- Gong, X.; Si, Y.-W.; Fong, S.; Biuk-Aghai, R.P. Financial time series pattern matching with extended ucr suite and support vector machine. Expert Syst. Appl. 2016, 55, 284–296. [Google Scholar] [CrossRef]
- Chandra, R.; He, Y. Bayesian neural networks for stock price forecasting before and during COVID-19 pandemic. PLoS ONE 2021, 16, e0253217. [Google Scholar] [CrossRef]
- Vo-Van, T.; Che-Ngoc, H.; Le-Dai, N.; Nguyen-Trang, T. A new strategy for short-term stock investment using bayesian approach. Comput. Econ. 2022, 59, 887–911. [Google Scholar] [CrossRef]
- Rout, A.K.; Dash, P.K.; Dash, R.; Bisoi, R. Forecasting financial time series using a low complexity recurrent neural network and evolutionary learning approach. J. King Saud Univ.-Comput. Inf. Sci. 2017, 29, 536–552. [Google Scholar] [CrossRef]
- Sheng, W.; Shan, P.; Chen, S.; Liu, Y.; Alsaadi, F.E. A niching evolutionary algorithm with adaptive negative correlation learning for neural network ensemble. Neurocomputing 2017, 247, 173–182. [Google Scholar] [CrossRef]
- Kumar, G.; Jain, S.; Singh, U.P. Stock market forecasting using computational intelligence: A survey. Arch. Comput. Methods Eng. 2021, 28, 1069–1101. [Google Scholar] [CrossRef]
- Kumar, G.; Singh, U.P.; Jain, S. Hybrid evolutionary intelligent system and hybrid time series econometric model for stock price forecasting. Int. J. Intell. Syst. 2021, 36, 4902–4935. [Google Scholar] [CrossRef]
- Chiang, W.-C.; Enke, D.; Wu, T.; Wang, R. An adaptive stock index trading decision support system. Expert Syst. Appl. 2016, 59, 195–207. [Google Scholar] [CrossRef]
- Vapnik, V.N.; Vapnik, V. Statistical Learning Theory; Wiley: New York, NY, USA, 1998; Volume 1. [Google Scholar]
- Luo, L.; You, S.; Xu, Y.; Peng, H. Improving the integration of piece wise linear representation and weighted support vector machine for stock trading signal prediction. Appl. Soft Comput. 2017, 56, 199–216. [Google Scholar] [CrossRef]
- Chen, Y.; Hao, Y. A novel framework for stock trading signals forecasting. Soft Comput. 2020, 24, 12111–12130. [Google Scholar] [CrossRef]
- Huang, L.; Wu, K.; Huang, W.; Dong, Y.; Ma, H.; Liu, Y.; Liu, L. Detection of fusarium head blight in wheat ears using continuous wavelet analysis and pso-svm. Agriculture 2021, 11, 998. [Google Scholar] [CrossRef]
- Raj, S.; Ray, K.C. Ecg signal analysis using dct-based dost and pso optimized svm. IEEE Trans. Instrum. Meas. 2017, 66, 470–478. [Google Scholar] [CrossRef]
- Huang, L.; Zhang, H.; Ruan, C.; Huang, W.; Hu, T.; Zhao, J. Detection of scab in wheat ears using in situ hyperspectral data and support vector machine optimized by genetic algorithm. Int. J. Agric. Biol. Eng. 2020, 13, 182–188. [Google Scholar] [CrossRef]
- Liang, Y.; Zhang, H. Ship track prediction based on ais data and pso optimized lstm network. Int. Core J. Eng. 2020, 6, 23–33. [Google Scholar]
- Chatterjee, A.; Siarry, P. Nonlinear inertia weight variation for dynamic adaptation in particle swarm optimization. Comput. Oper. Res. 2006, 33, 859–871. [Google Scholar] [CrossRef]
- Nickabadi, A.; Ebadzadeh, M.M.; Safabakhsh, R. A novel particle swarm optimization algorithm with adaptive inertia weight. Appl. Soft Comput. 2011, 11, 3658–3670. [Google Scholar] [CrossRef]
- Pant, M.; Radha, T.; Singh, V. Particle swarm optimization using gaussian inertia weight. In Proceedings of the International Conference on Computational Intelligence and Multimedia Applications (ICCIMA 2007), Sivakasi, India, 13–15 December 2007; Volume 1, pp. 97–102. [Google Scholar]
- Yue-lin, G.; Yu-hong, D. A new particle swarm optimization algorithm with random inertia weight and evolution strategy. In Proceedings of the 2007 International Conference on Computational Intelligence and Security Workshops (CISW 2007), Harbin, China, 15–19 December 2007; pp. 199–203. [Google Scholar]
- Shi, Y.; Eberhart, R. A modified particle swarm optimizer. In Proceedings of the 1998 IEEE International Conference on Evolutionary Computation Proceedings. IEEE World Congress on Computational Intelligence (Cat. No. 98TH8360), Anchorage, AK, USA, 4–9 May 1998; pp. 69–73. [Google Scholar]
- Ratnaweera, A.; Halgamuge, S.K.; Watson, H.C. Self-organizing hierarchical particle swarm optimizer with time-varying acceleration coefficients. IEEE Trans. Evol. Comput. 2004, 8, 240–255. [Google Scholar] [CrossRef]
- Neely, C.J.; Rapach, D.E.; Tu, J.; Zhou, G. Forecasting the equity risk premium: The role of technical indicators. Manag. Sci. 2014, 60, 1772–1791. [Google Scholar] [CrossRef]
- Panigrahi, S.; Behera, H. A hybrid ETS-ANN model for time series forecasting. Eng. Appl. Artif. Intell. 2017, 66, 49–59. [Google Scholar] [CrossRef]
- Yeh, I.-C.; Lien, C.-H.; Tsai, Y.-C. Evaluation approach to stock trading system using evolutionary computation. Expert Syst. Appl. 2011, 38, 794–803. [Google Scholar] [CrossRef]
- Żbikowski, K. Using volume weighted support vector machines with walk forward testing and feature selection for the purpose of creating stock trading strategy. Expert Syst. Appl. 2015, 42, 1797–1805. [Google Scholar] [CrossRef]
- Chang, C.-C.; Lin, C.-J. Libsvm: A library for support vector machines. ACM Trans. Intell. Syst. Technol. 2011, 2, 27. [Google Scholar] [CrossRef]


| Technical Indicator | Formulae |
|---|---|
| 1. Simple Moving Average (SMA) | |
| 2. Exponential Moving Average (EMA) | |
| 3. Moving Average Convergence /Divergence (MACD) | |
| 4. Average Transaction Price (ATP) | indicates the transaction money in one day |
| 5. Relative Strength Index (RSI) | is upward change, and is downward change |
| 6. Average True Range (ATR) | denotes the absolute value, and n is the input window length |
| 7. William’s %R Oscillator | |
| 8. Stochastic %K %D | and are the mean high and low prices in the last n days, respectively |
| 9. Average Directional Movement Index (ADX) |
| Trend | Stock Code in Shanghai and Shenzhen Markets | Data Range |
|---|---|---|
| uptrend | 600220, 600628, 600109, 600327, 000606 | from 1 June 2012 to 30 June 2014 |
| steady trend | 600283, 600360, 600509, 600791, 600895 601099, 000514, 000949, 002083, 002161 | from 1 June 2012 to 30 June 2014 |
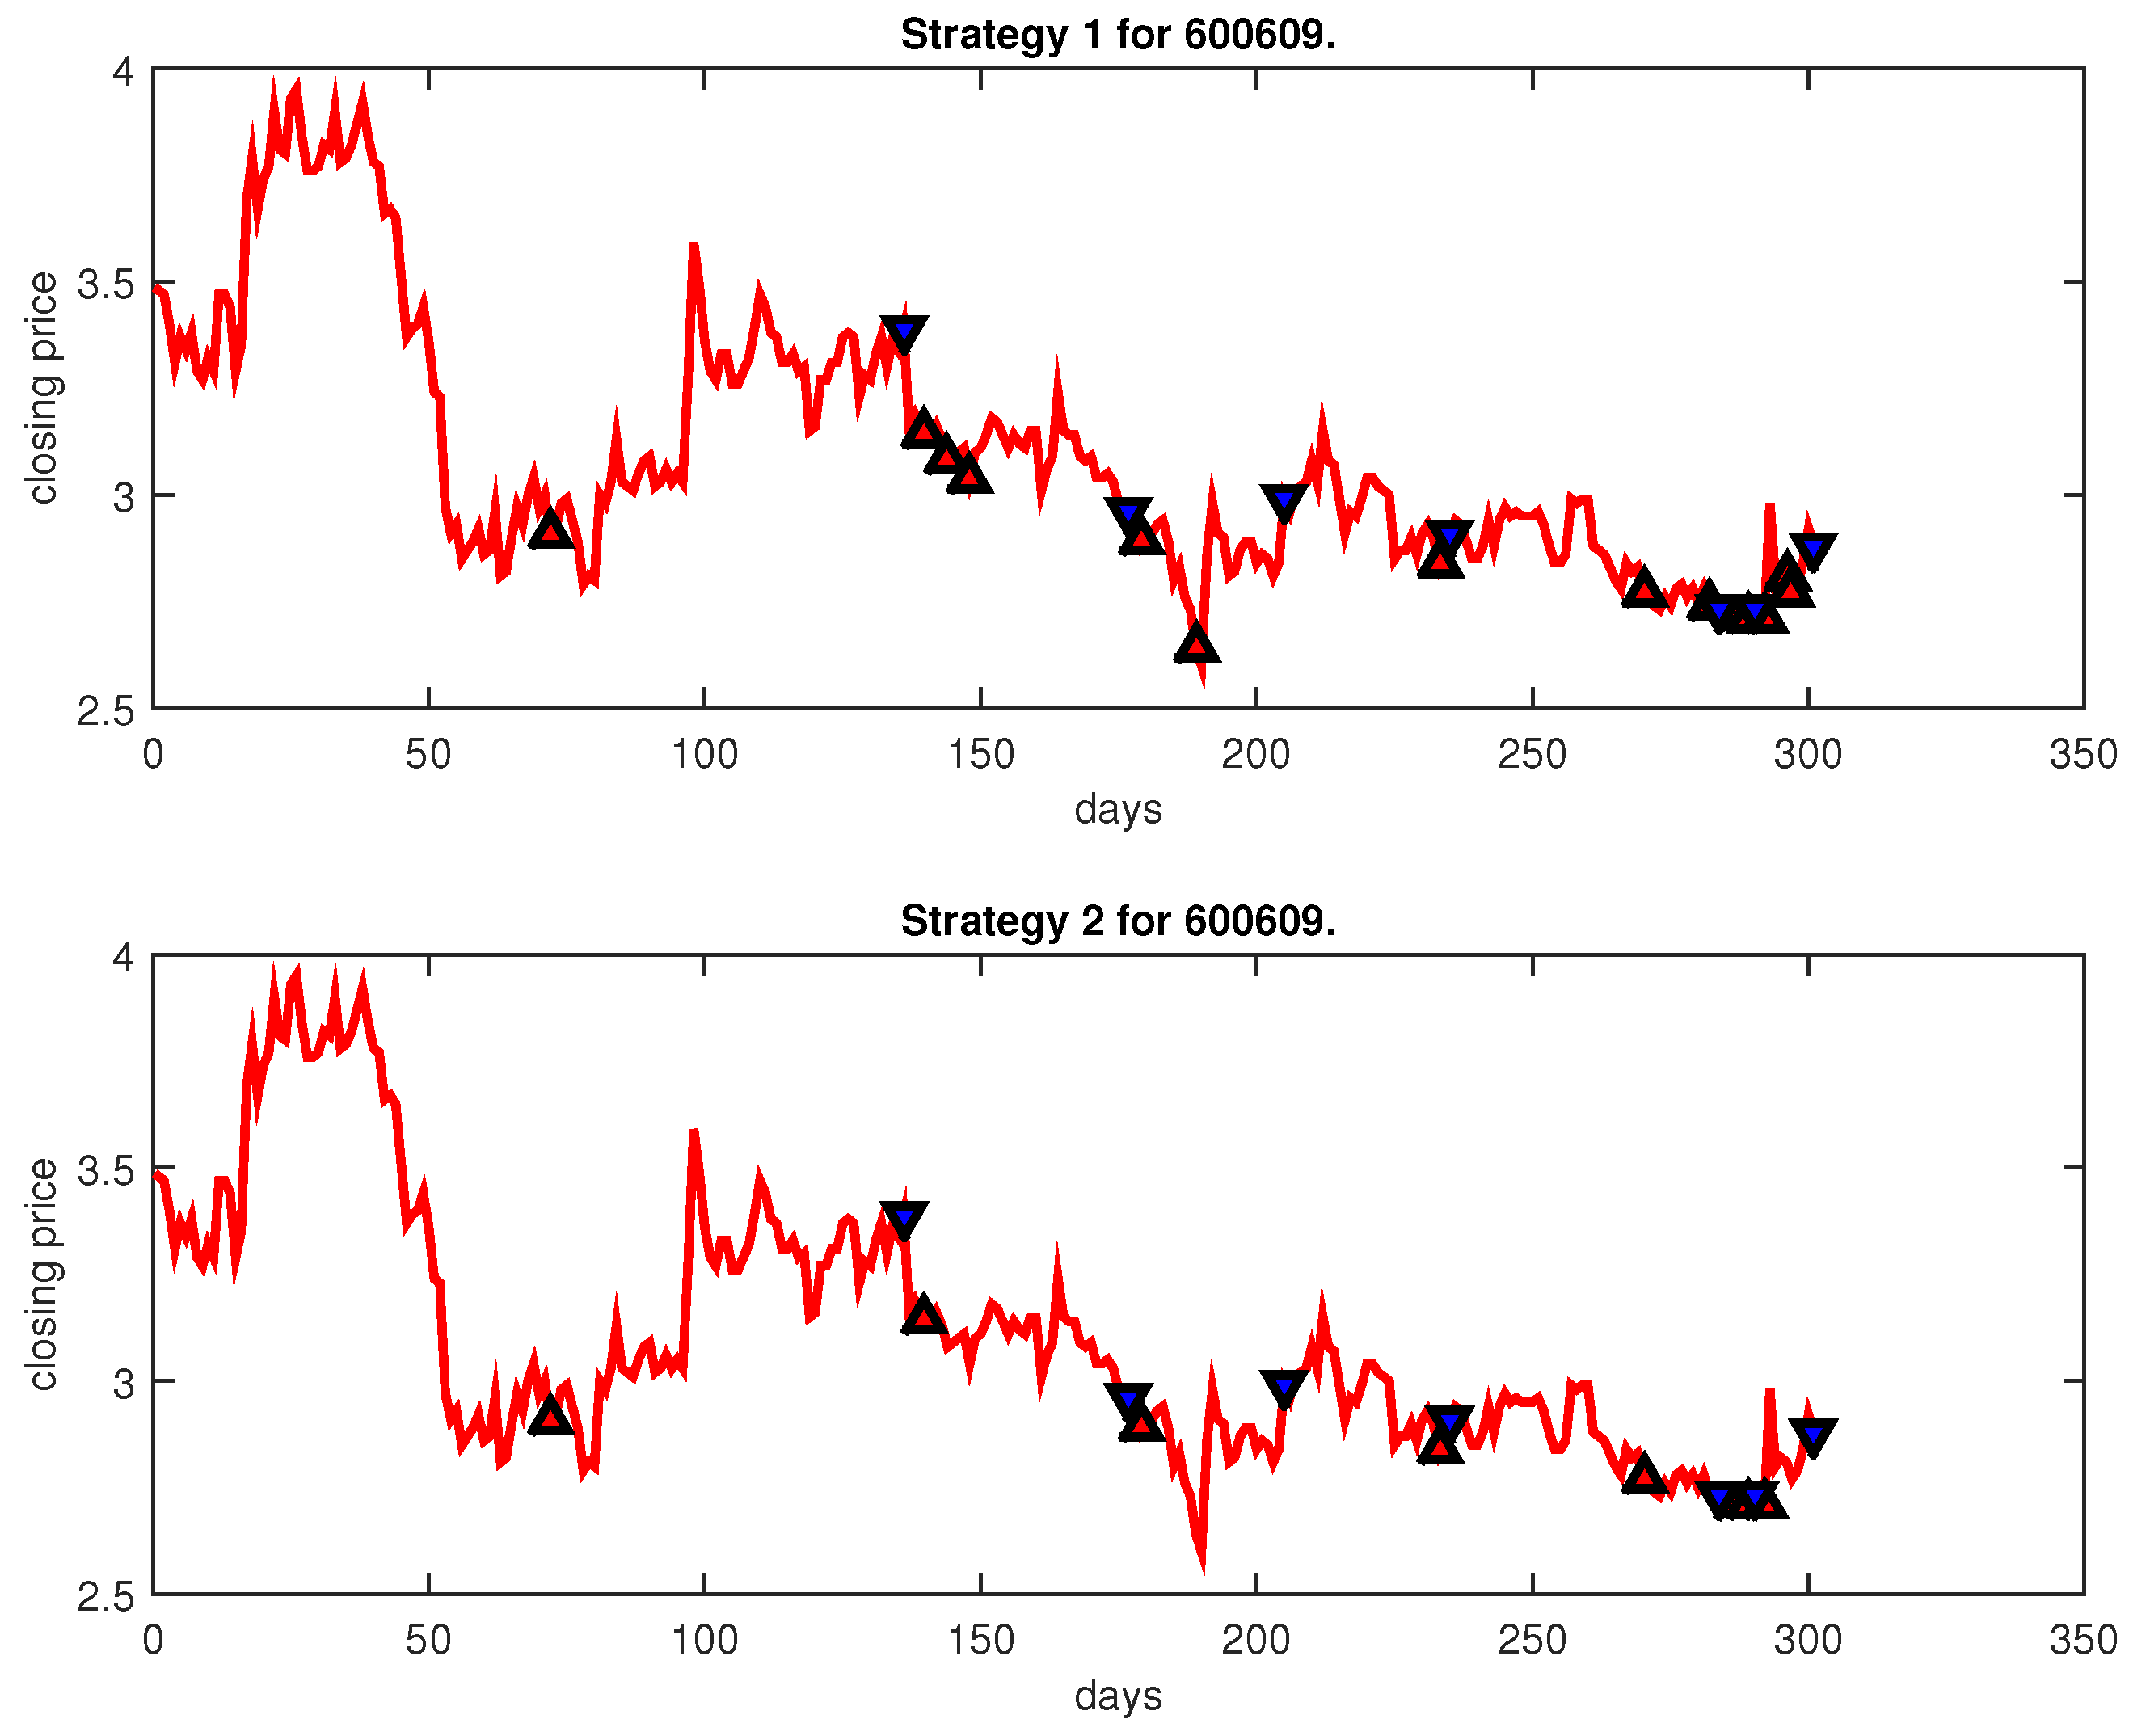
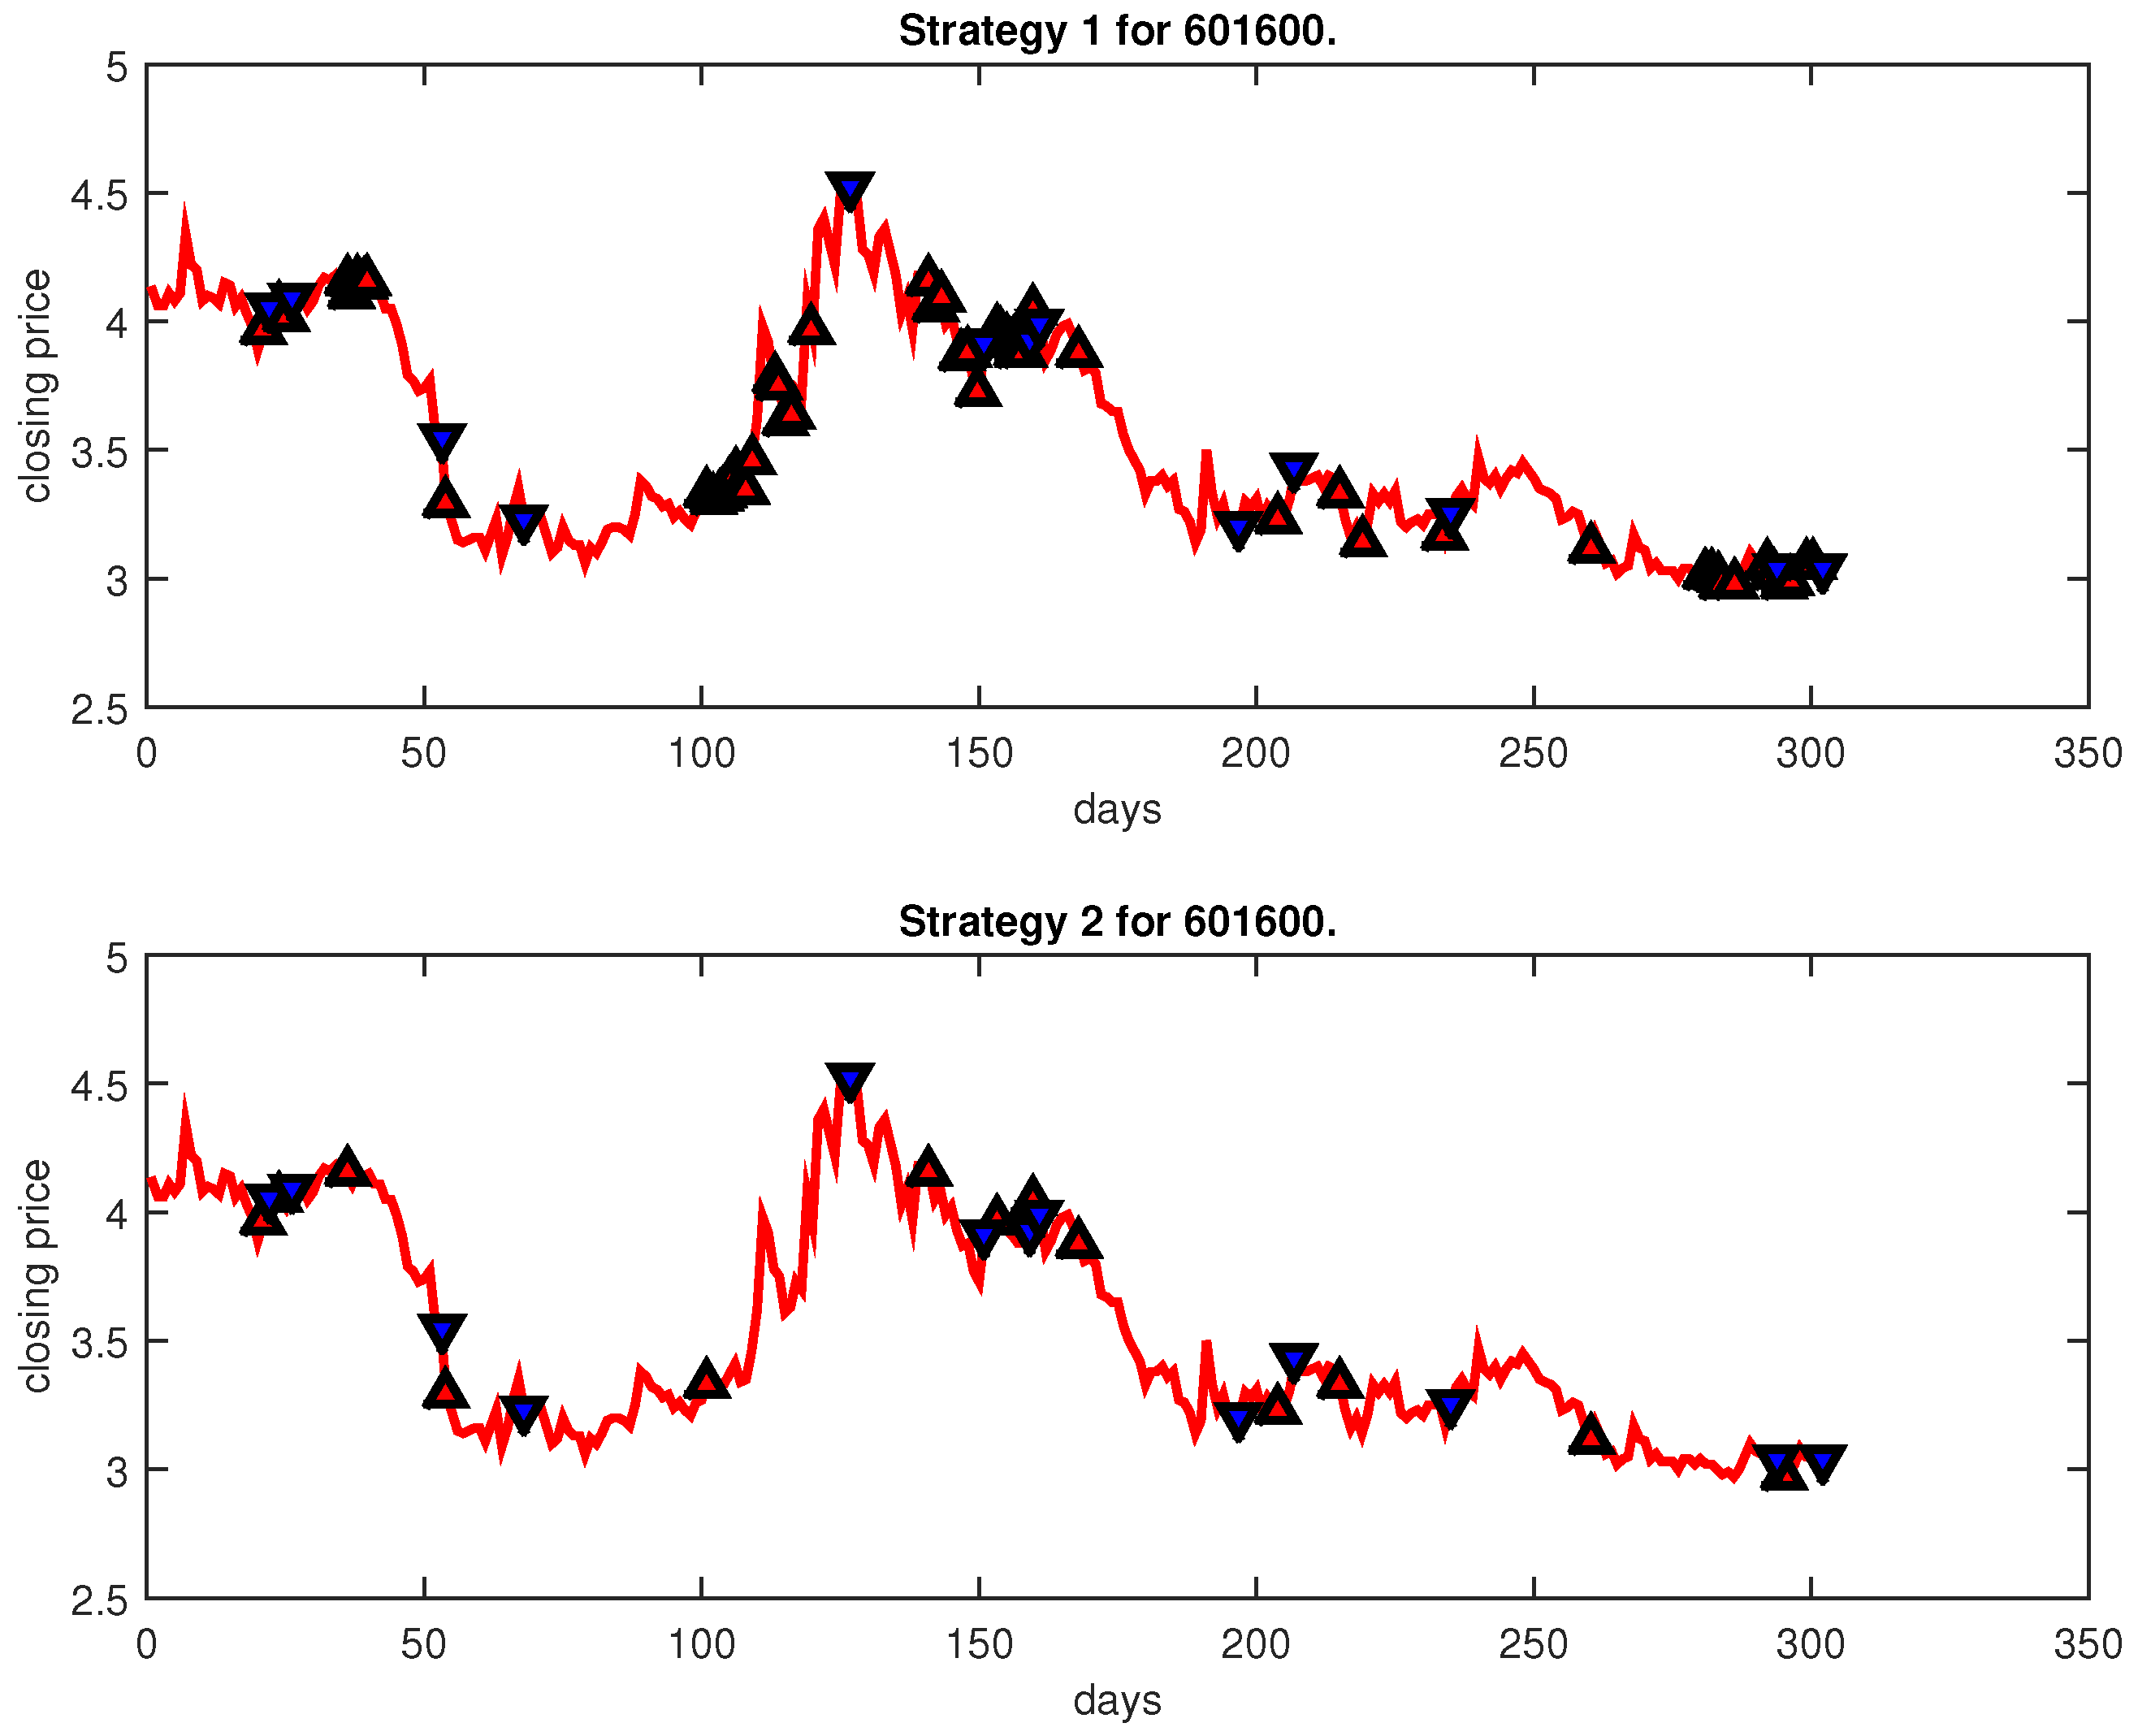
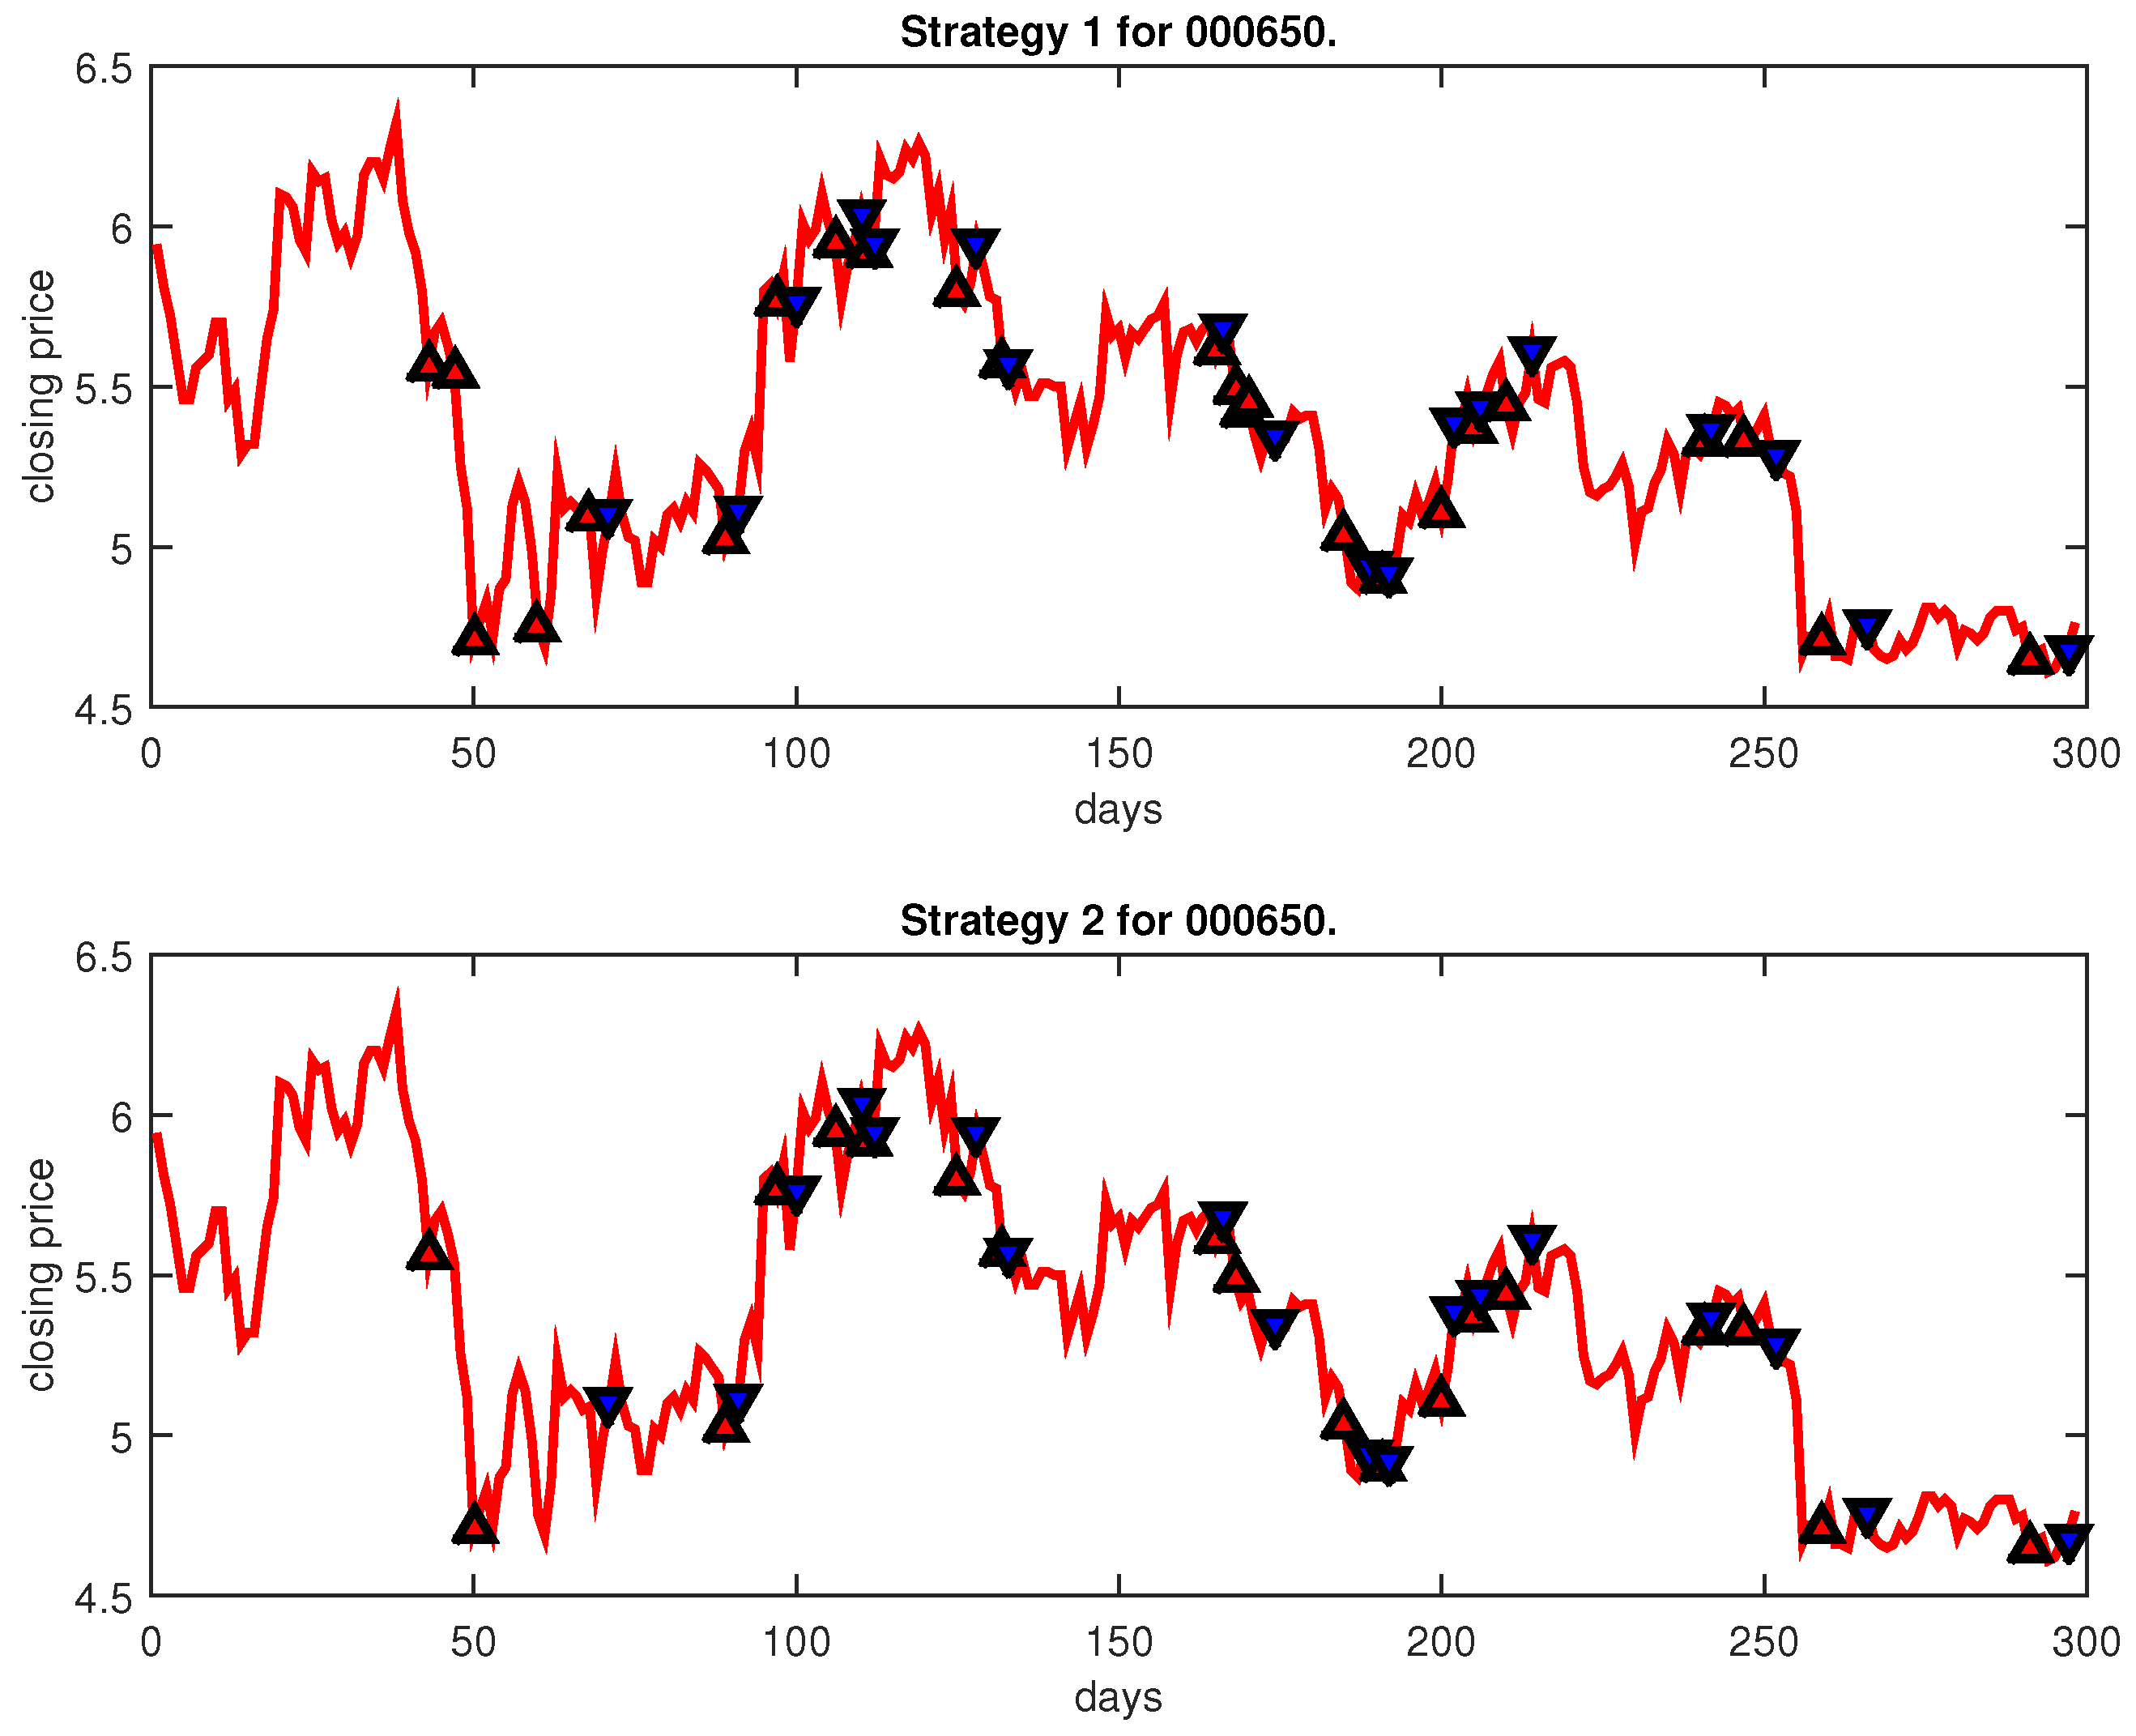
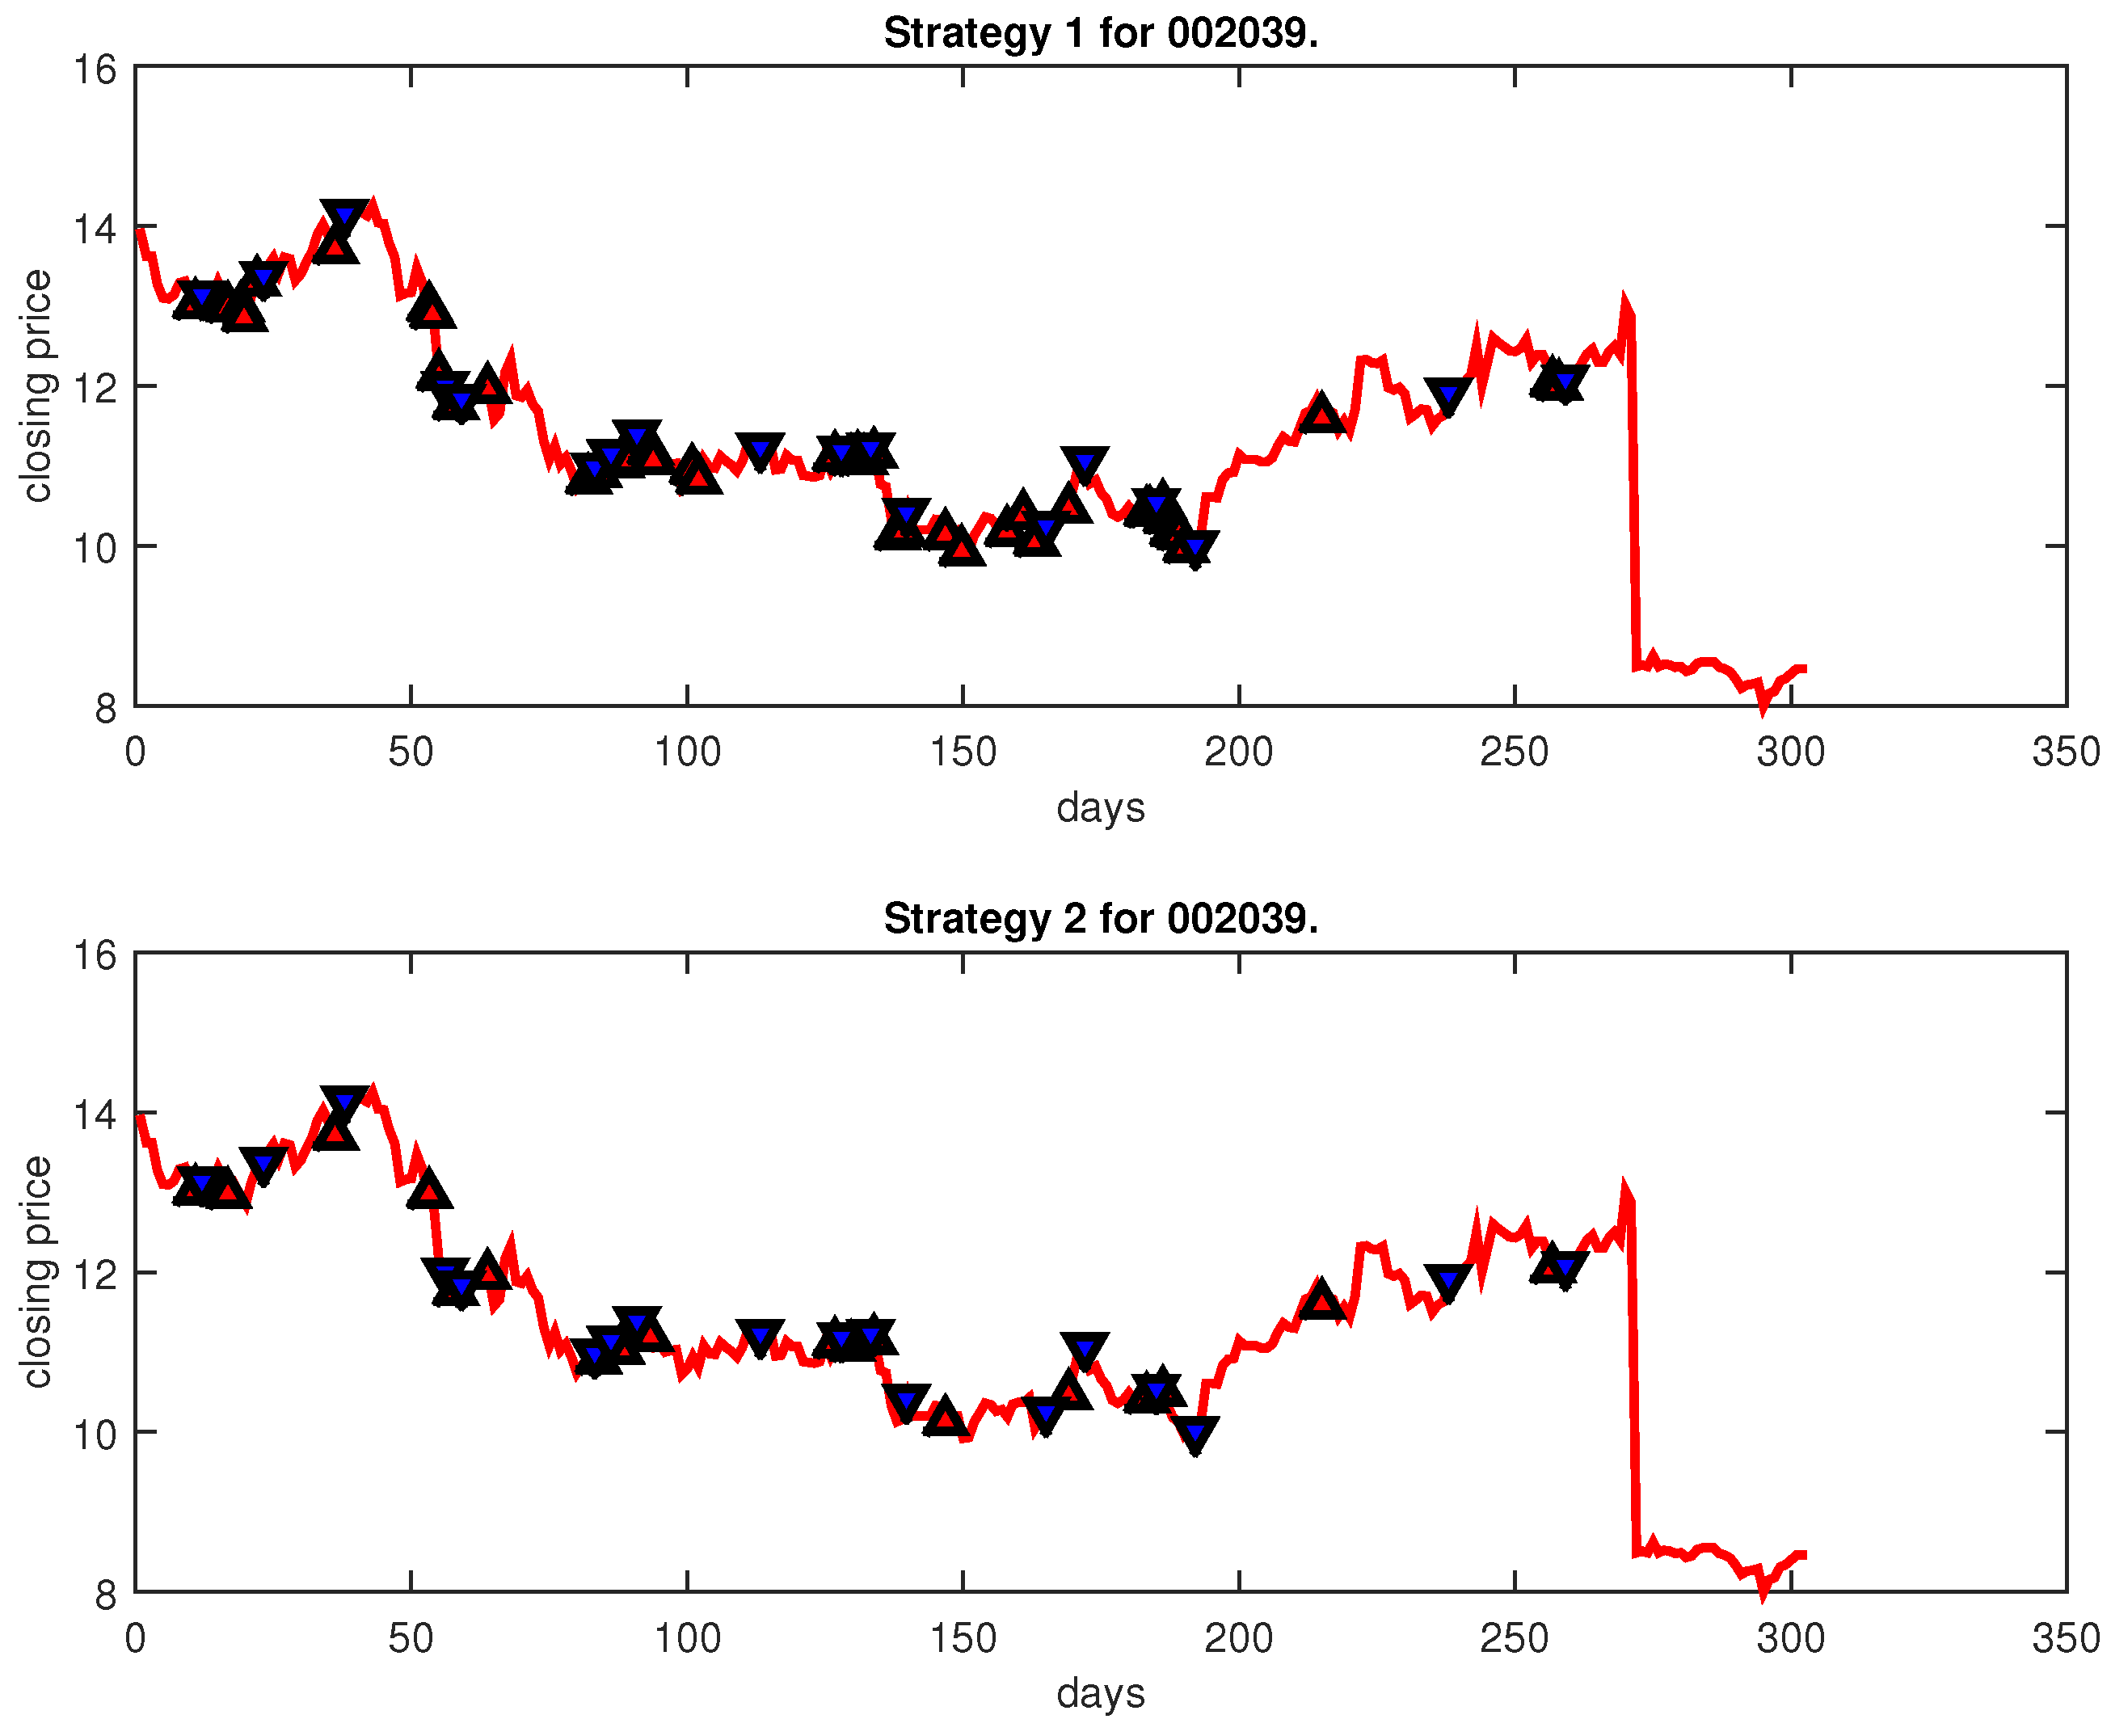
| downtrend | 600036, 600162, 600558, 600609, 600875 601600, 000650, 002039, 002061, 002140 | from 1 June 2012 to 30 June 2014 |
| 220 | 20 |
| n | |||||||
|---|---|---|---|---|---|---|---|
| 10 | 100 |
| No. | TI. | No. | TI. | No. | TI. | No. | TI. | No. | TI. | No. | TI. | No. | TI. |
|---|---|---|---|---|---|---|---|---|---|---|---|---|---|
| 1 | ATP | 2 | 9K | 3 | 9DIF | 4 | 9DEA | 5 | 14RSI | 6 | 12ROC | 7 | Williams |
| 8 | 5MA | 9 | 10MA | 10 | 5EMA | 11 | 9D | 12 | 9K | 13 | 14ATR | 14 | 14ADX |
| Stock Code | Method | Accuracy | Strategy 1 | Strategy 2 | ||||||
|---|---|---|---|---|---|---|---|---|---|---|
| Profit (%) | Profit (%) | |||||||||
| 600220 | IPSO-FW-WSVM | 40 | 16 | 10,000 | 16 | 16 | ||||
| PLR-ANN | 68 | 15 | 10,000 | 16 | 15 | |||||
| 600628 | IPSO-FW-WSVM | 44 | 12 | 10,000 | 12 | 12 | ||||
| PLR-ANN | 45,344.00 | 133 | 4 | 10,000 | 5 | 4 | ||||
| 600109 | IPSO-FW-WSVM | 10,108.92 | 22 | 5 | 10,000 | 5 | 5 | |||
| PLR-ANN | 29,094.58 | 99 | 13 | 10,000 | 14 | 13 | ||||
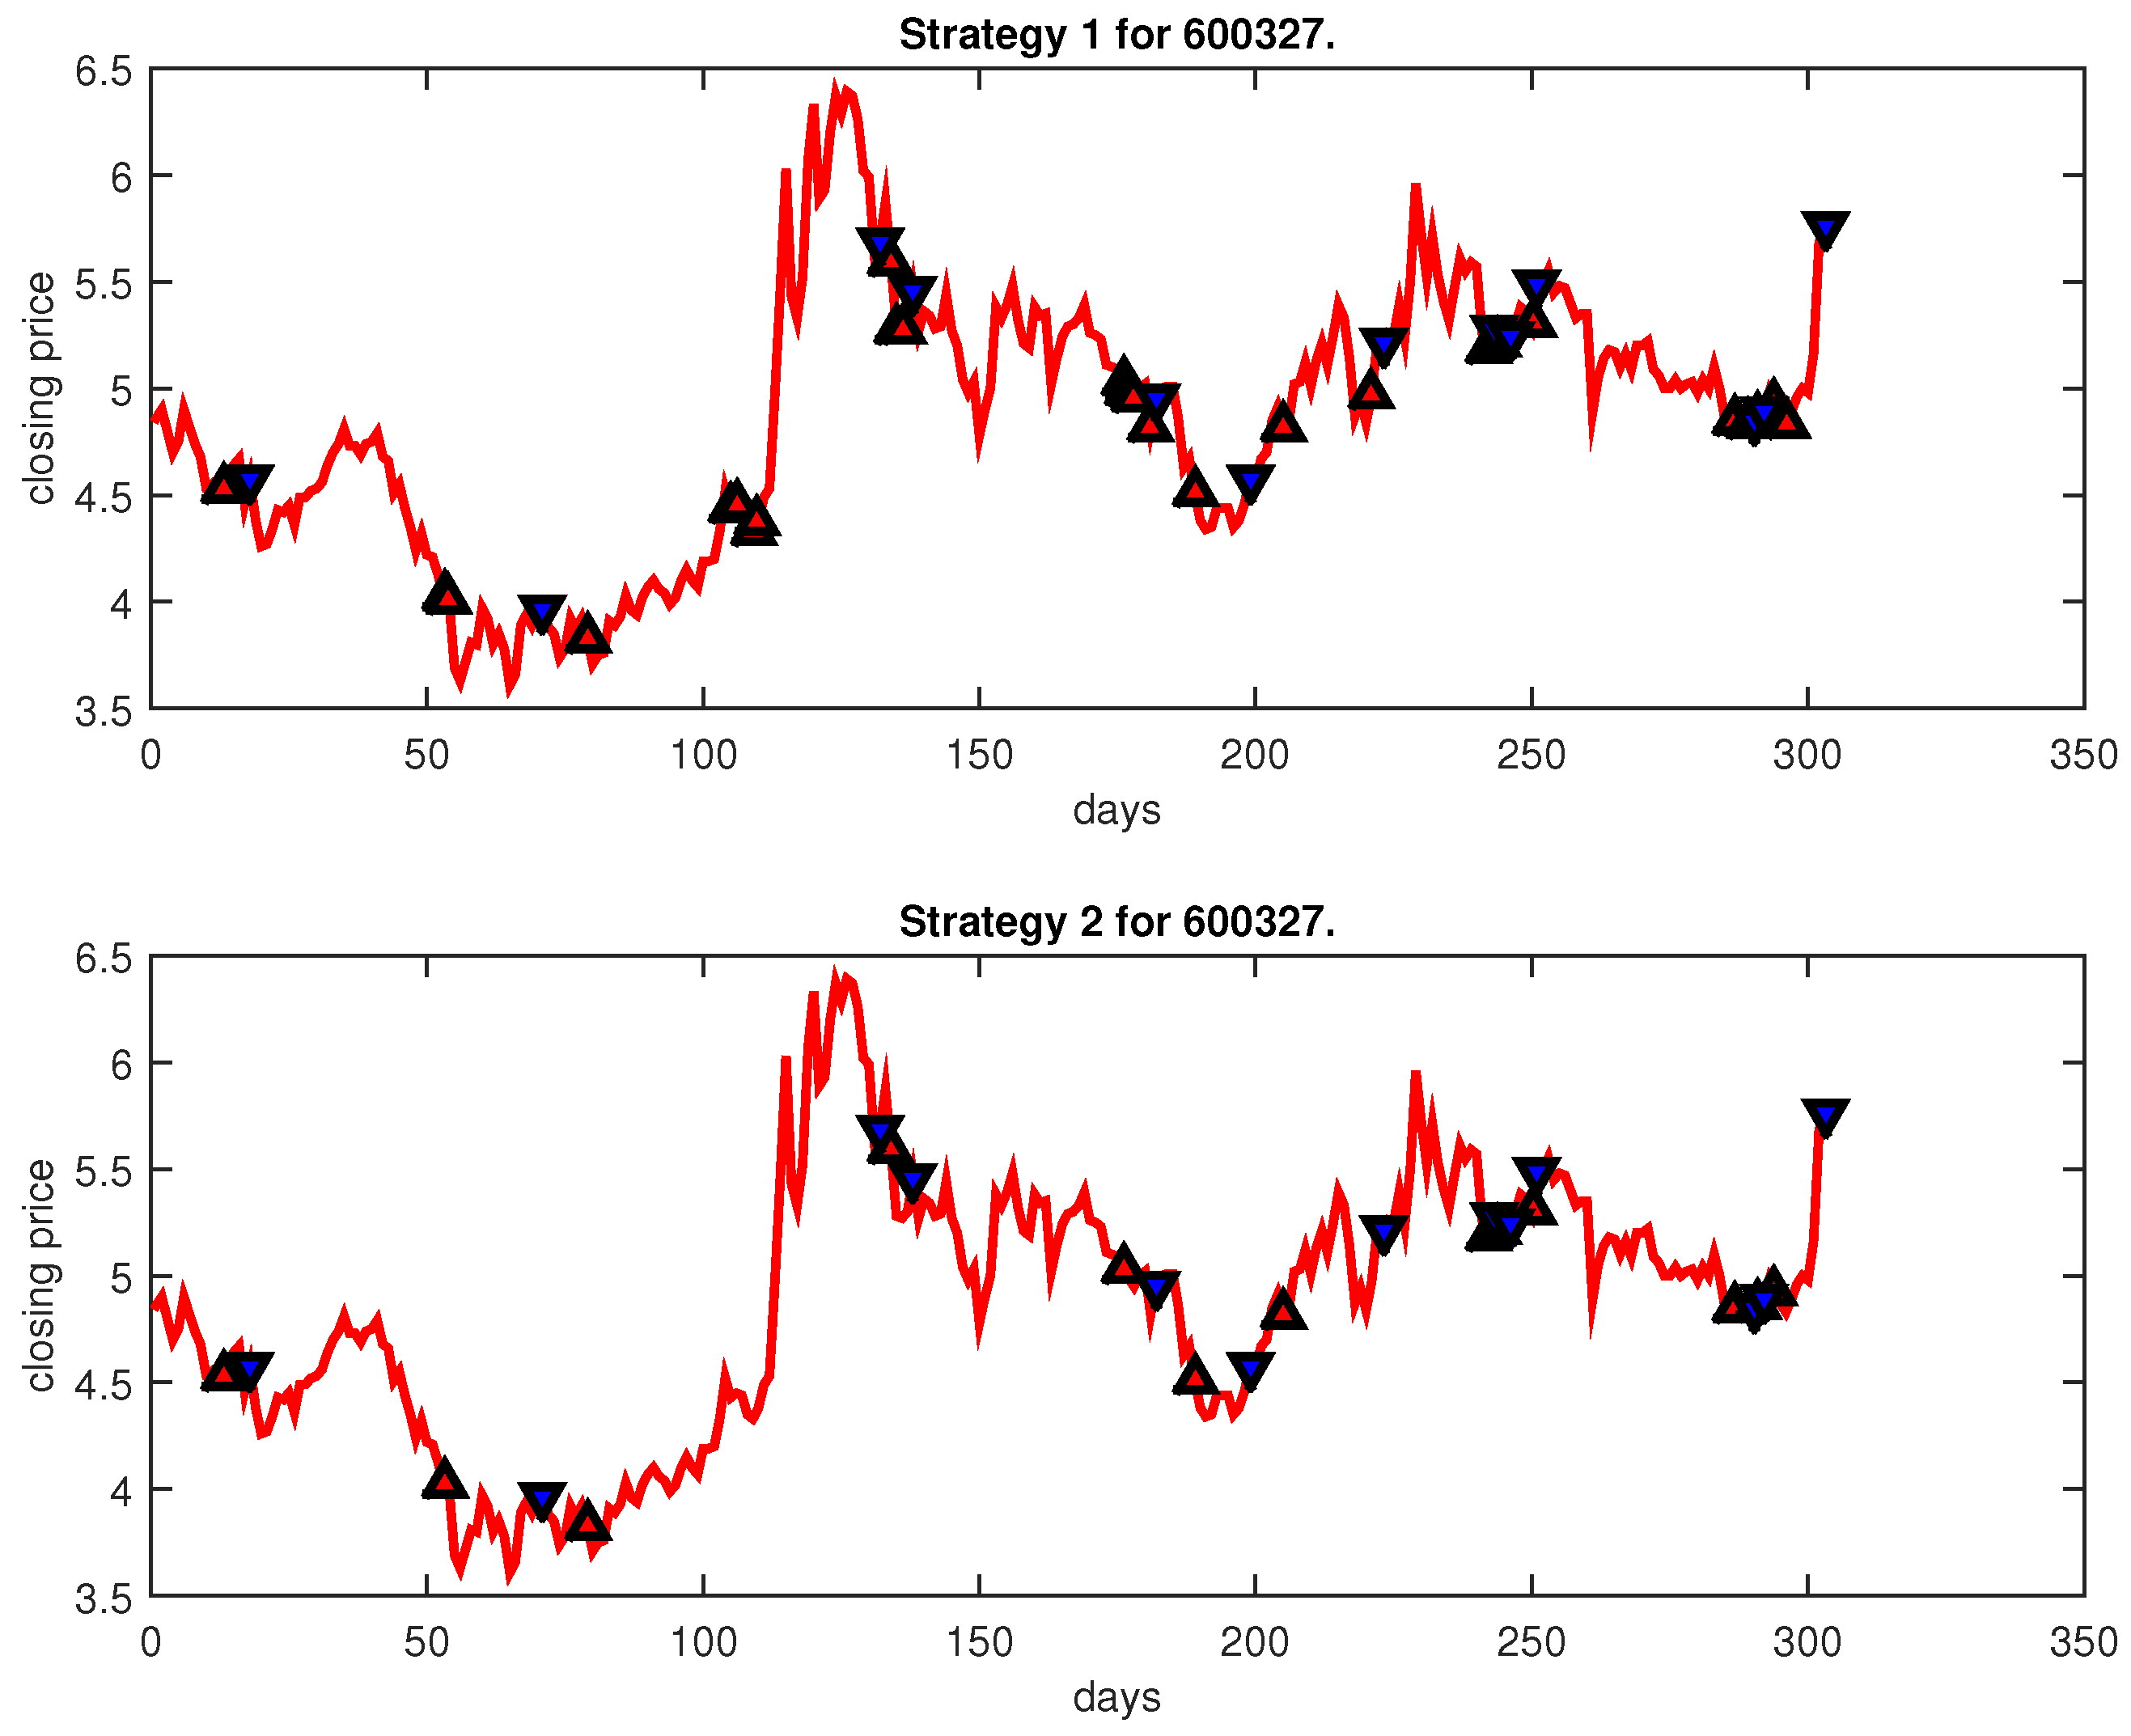
| 600327 | IPSO-FW-WSVM | 27 | 13 | 10,000 | 13 | 13 | ||||
| PLR-ANN | 35,816.77 | 107 | 5 | 10,000 | 5 | 5 | ||||
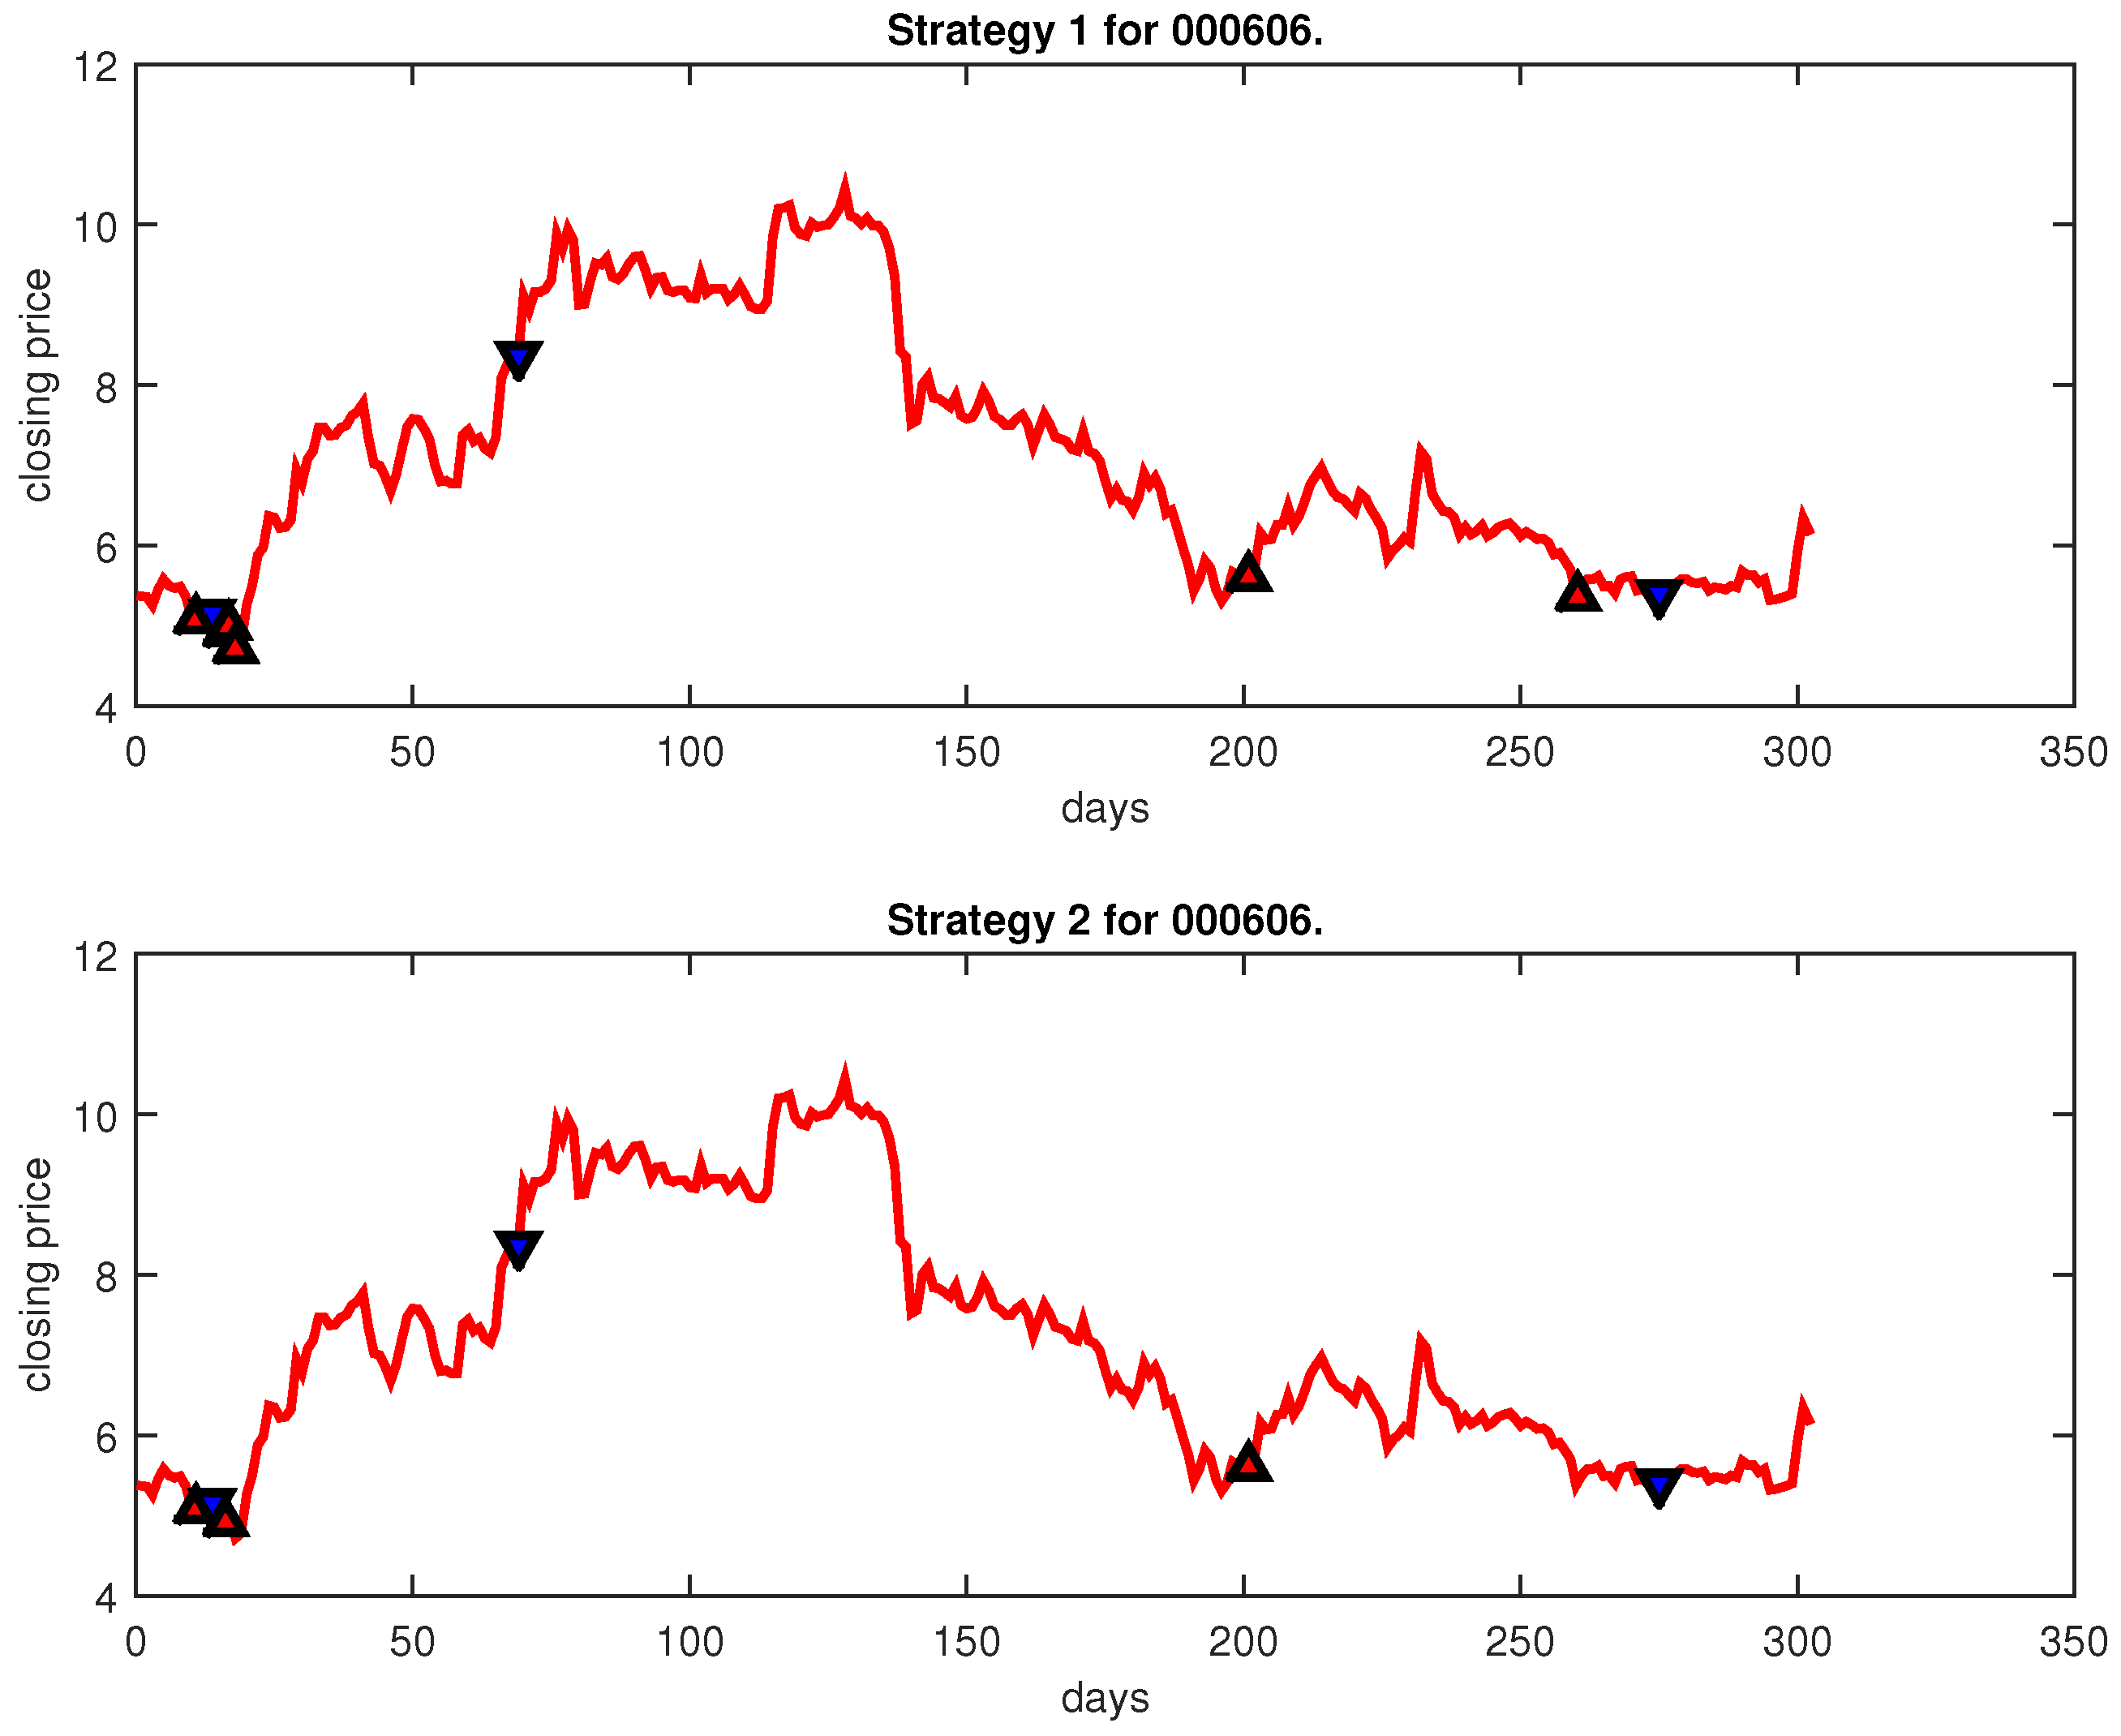
| 000606 | IPSO-FW-WSVM | 6 | 3 | 10,000 | 3 | 3 | ||||
| PLR-ANN | 20,000.81 | 82 | 10 | 10,000 | 11 | 10 | ||||
| Average | IPSO-FW-WSVM | 10,000 | ||||||||
| PLR-ANN | 26,752.39 | 10,000 | ||||||||
| Stock Code | Method | Accuracy | Strategy 1 | Strategy 2 | ||||||
|---|---|---|---|---|---|---|---|---|---|---|
| Profit (%) | Profit (%) | |||||||||
| 600283 | IPSO-FW-WSVM | 26 | 14 | 10,000 | 16 | 14 | ||||
| PLR-ANN | 21,431.51 | 95 | 7 | 10,000 | 7 | 7 | ||||
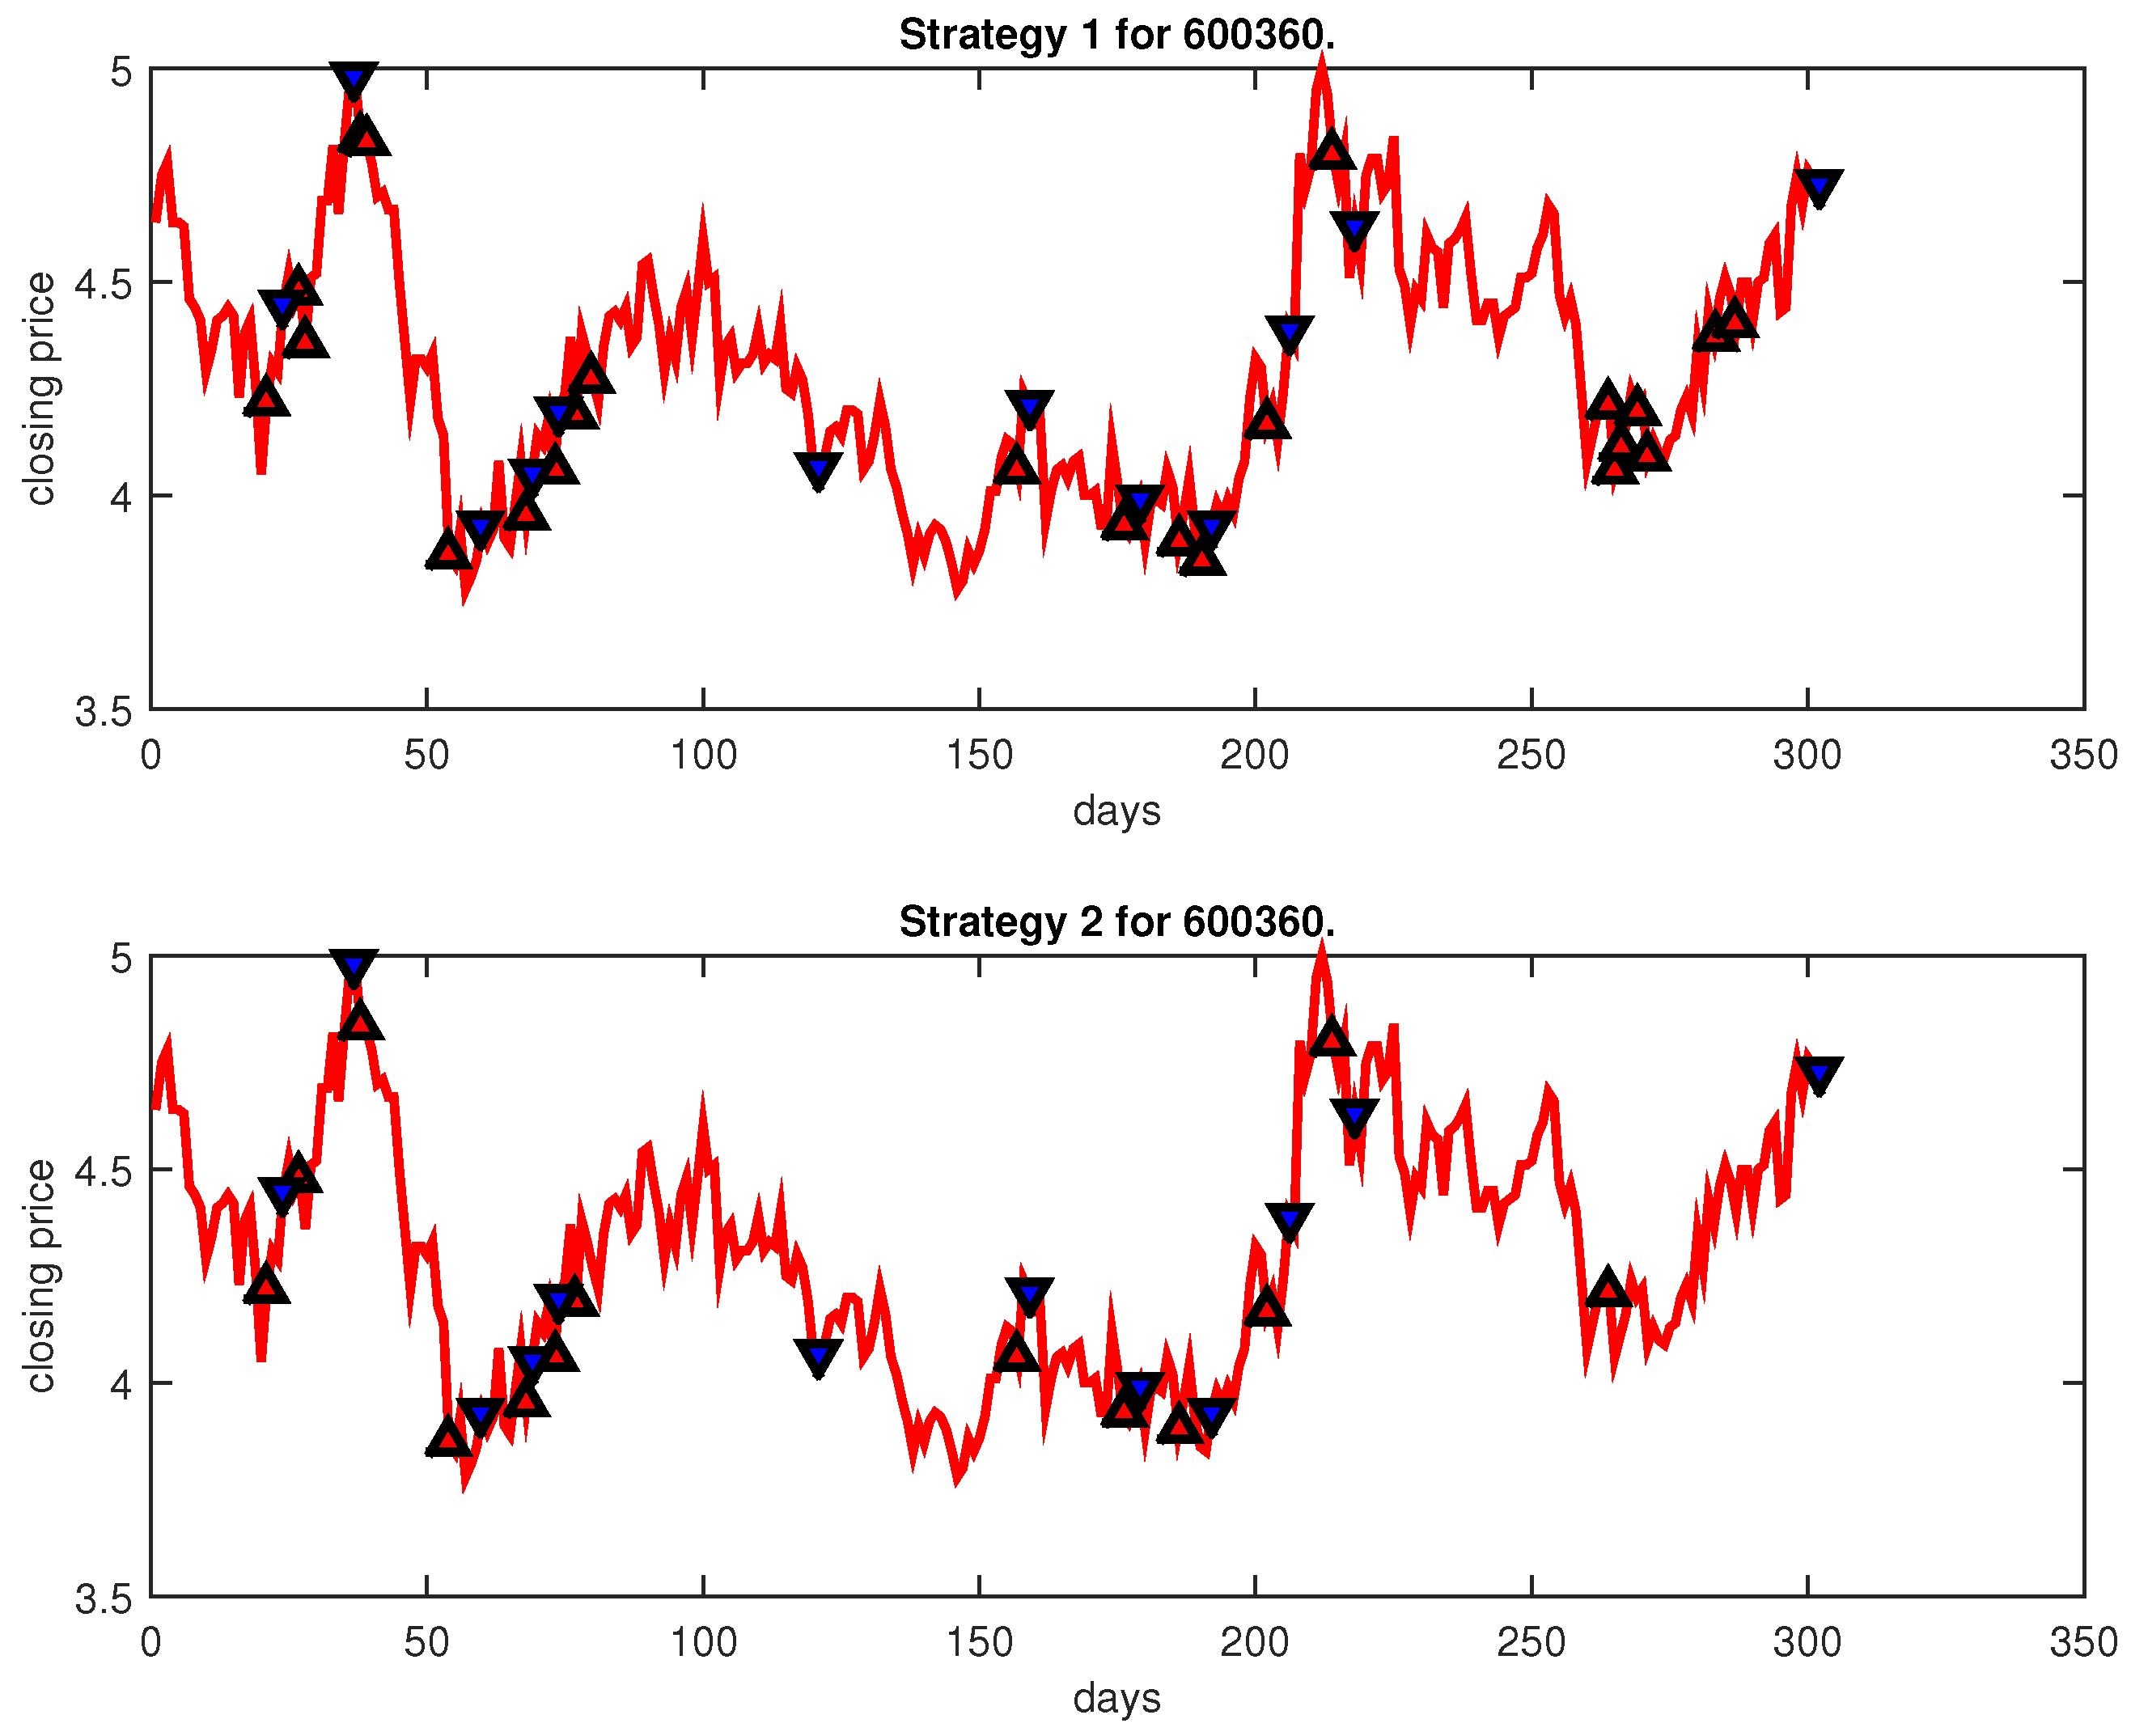
| 600360 | IPSO-FW-WSVM | 23 | 12 | 10,000 | 13 | 12 | ||||
| PLR-ANN | 16,218.29 | 59 | 5 | 10,000 | 5 | 5 | ||||
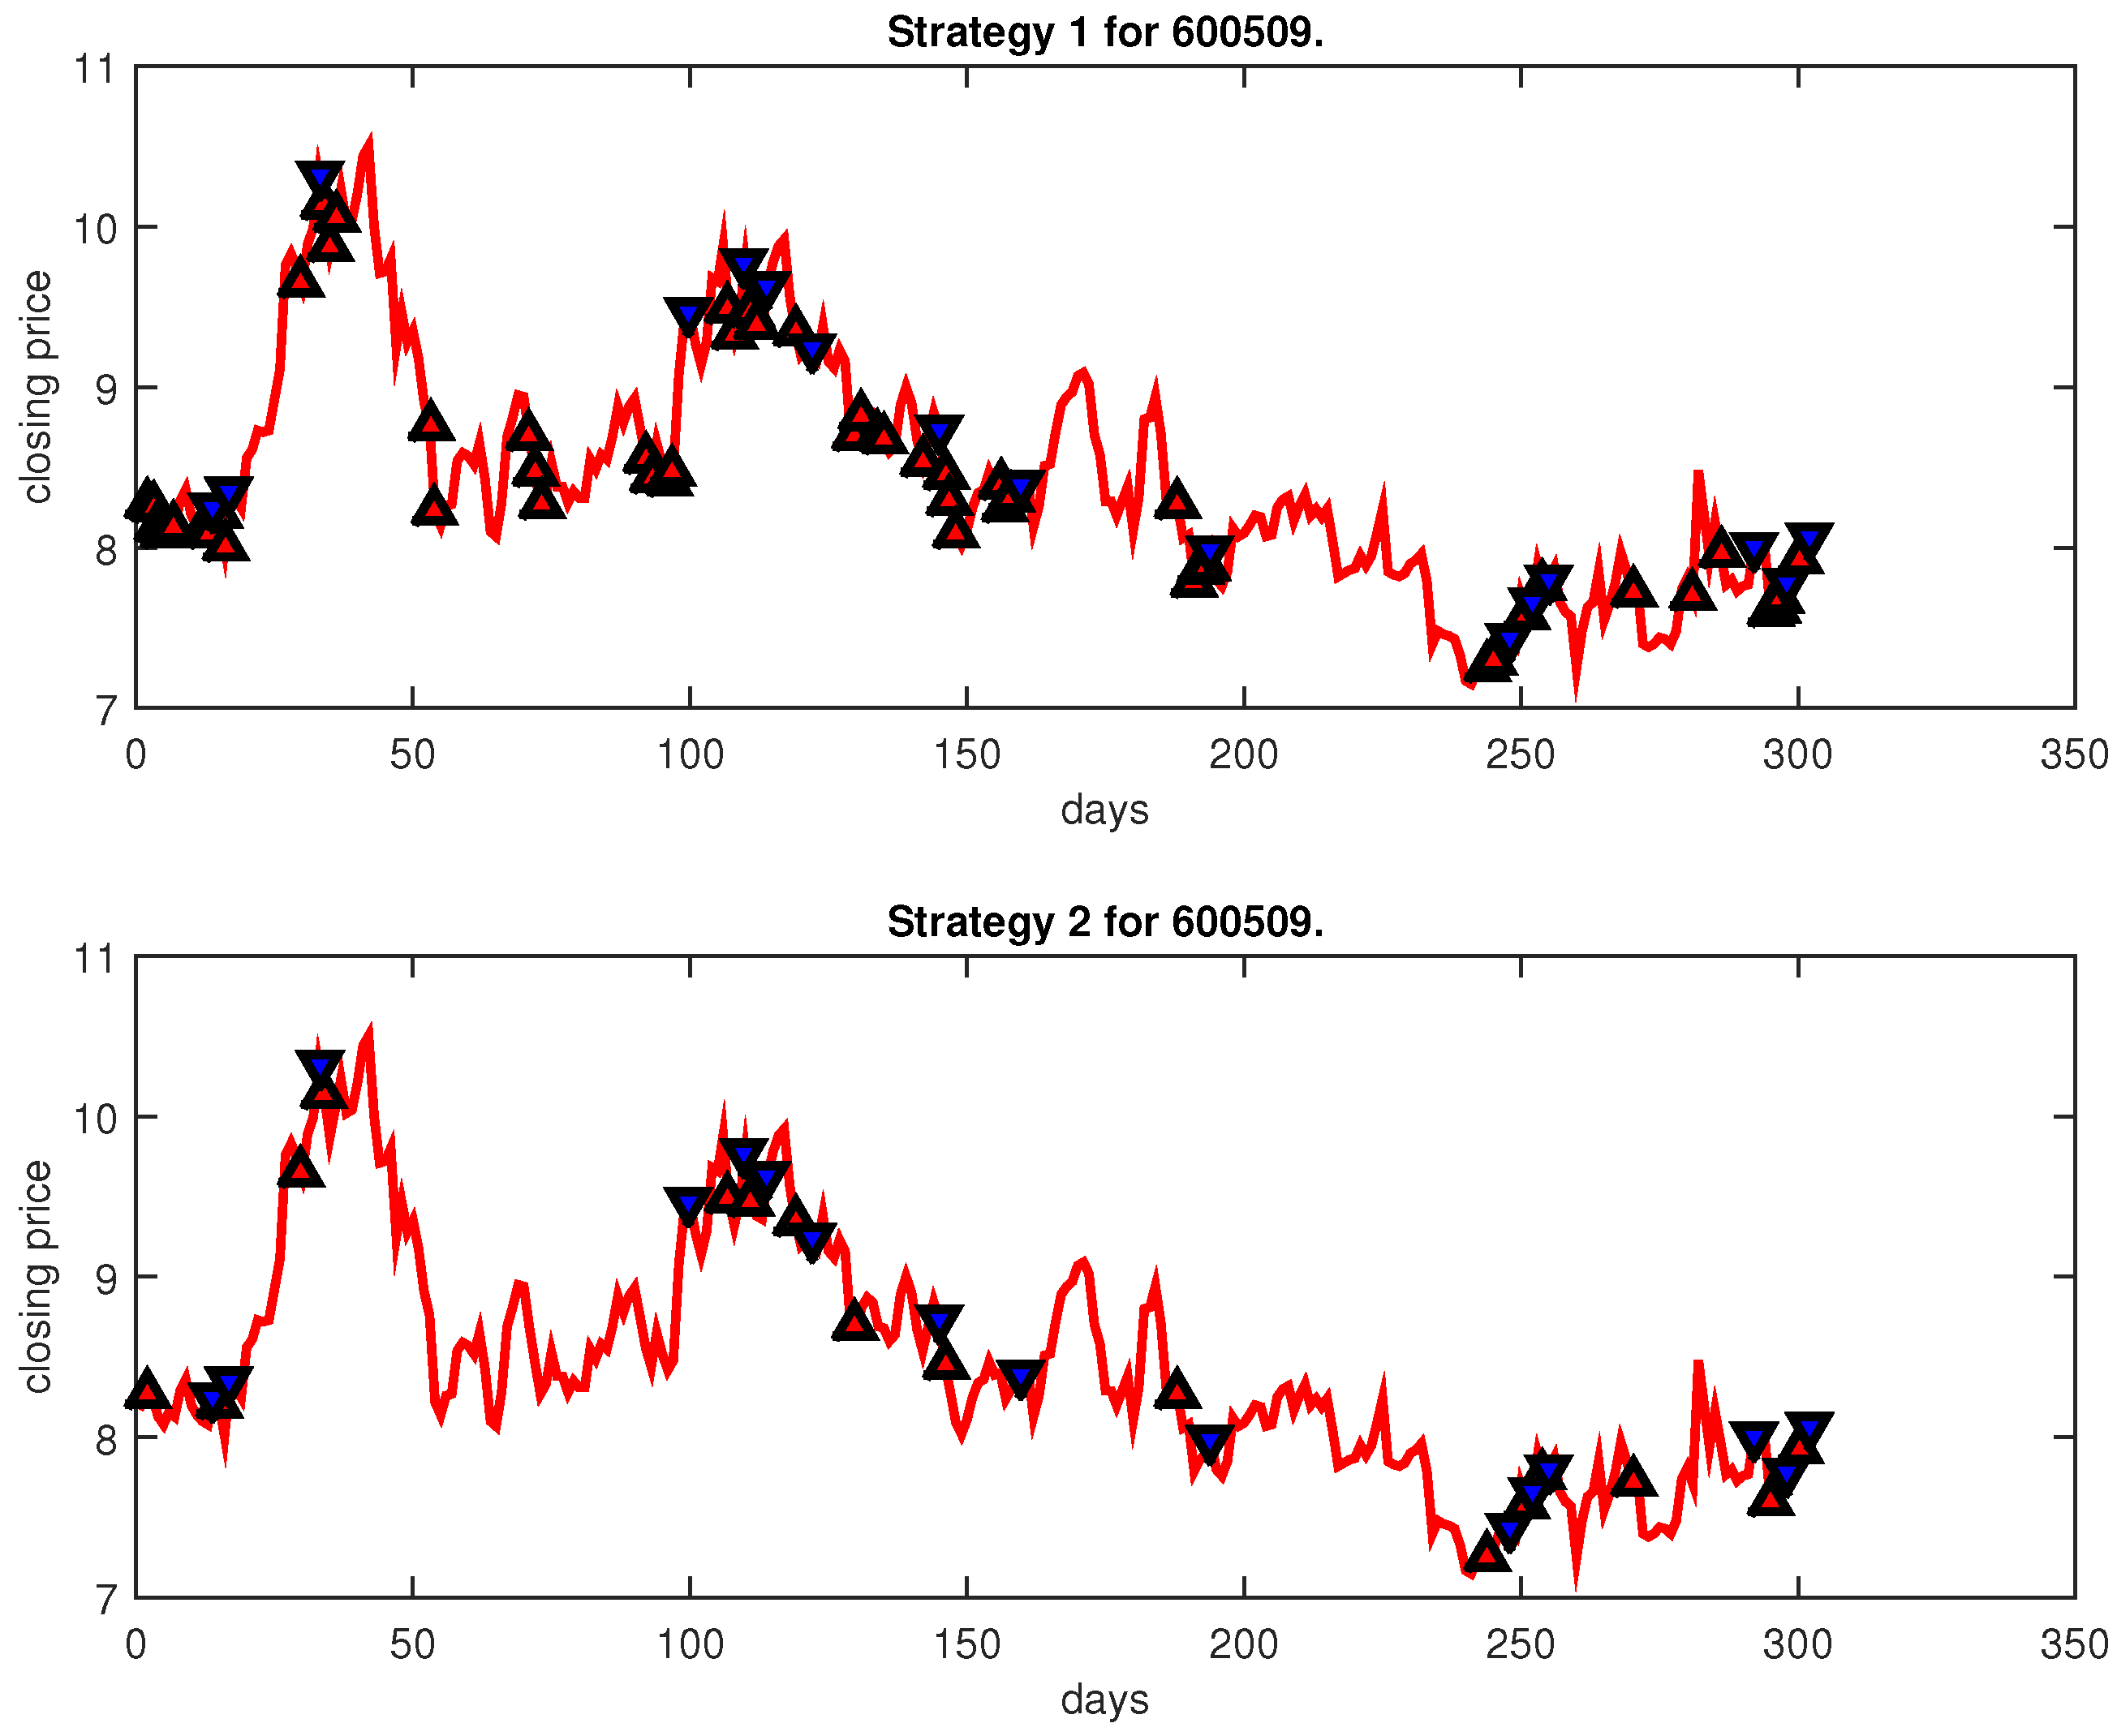
| 600509 | IPSO-FW-WSVM | 53 | 16 | 10,000 | 16 | 16 | ||||
| PLR-ANN | 39,822.34 | 98 | 4 | 10,000 | 4 | 4 | ||||
| 600791 | IPSO-FW-WSVM | 24 | 11 | 10,000 | 11 | 11 | ||||
| PLR-ANN | 23,834.09 | 94 | 5 | 10,000 | 6 | 5 | ||||
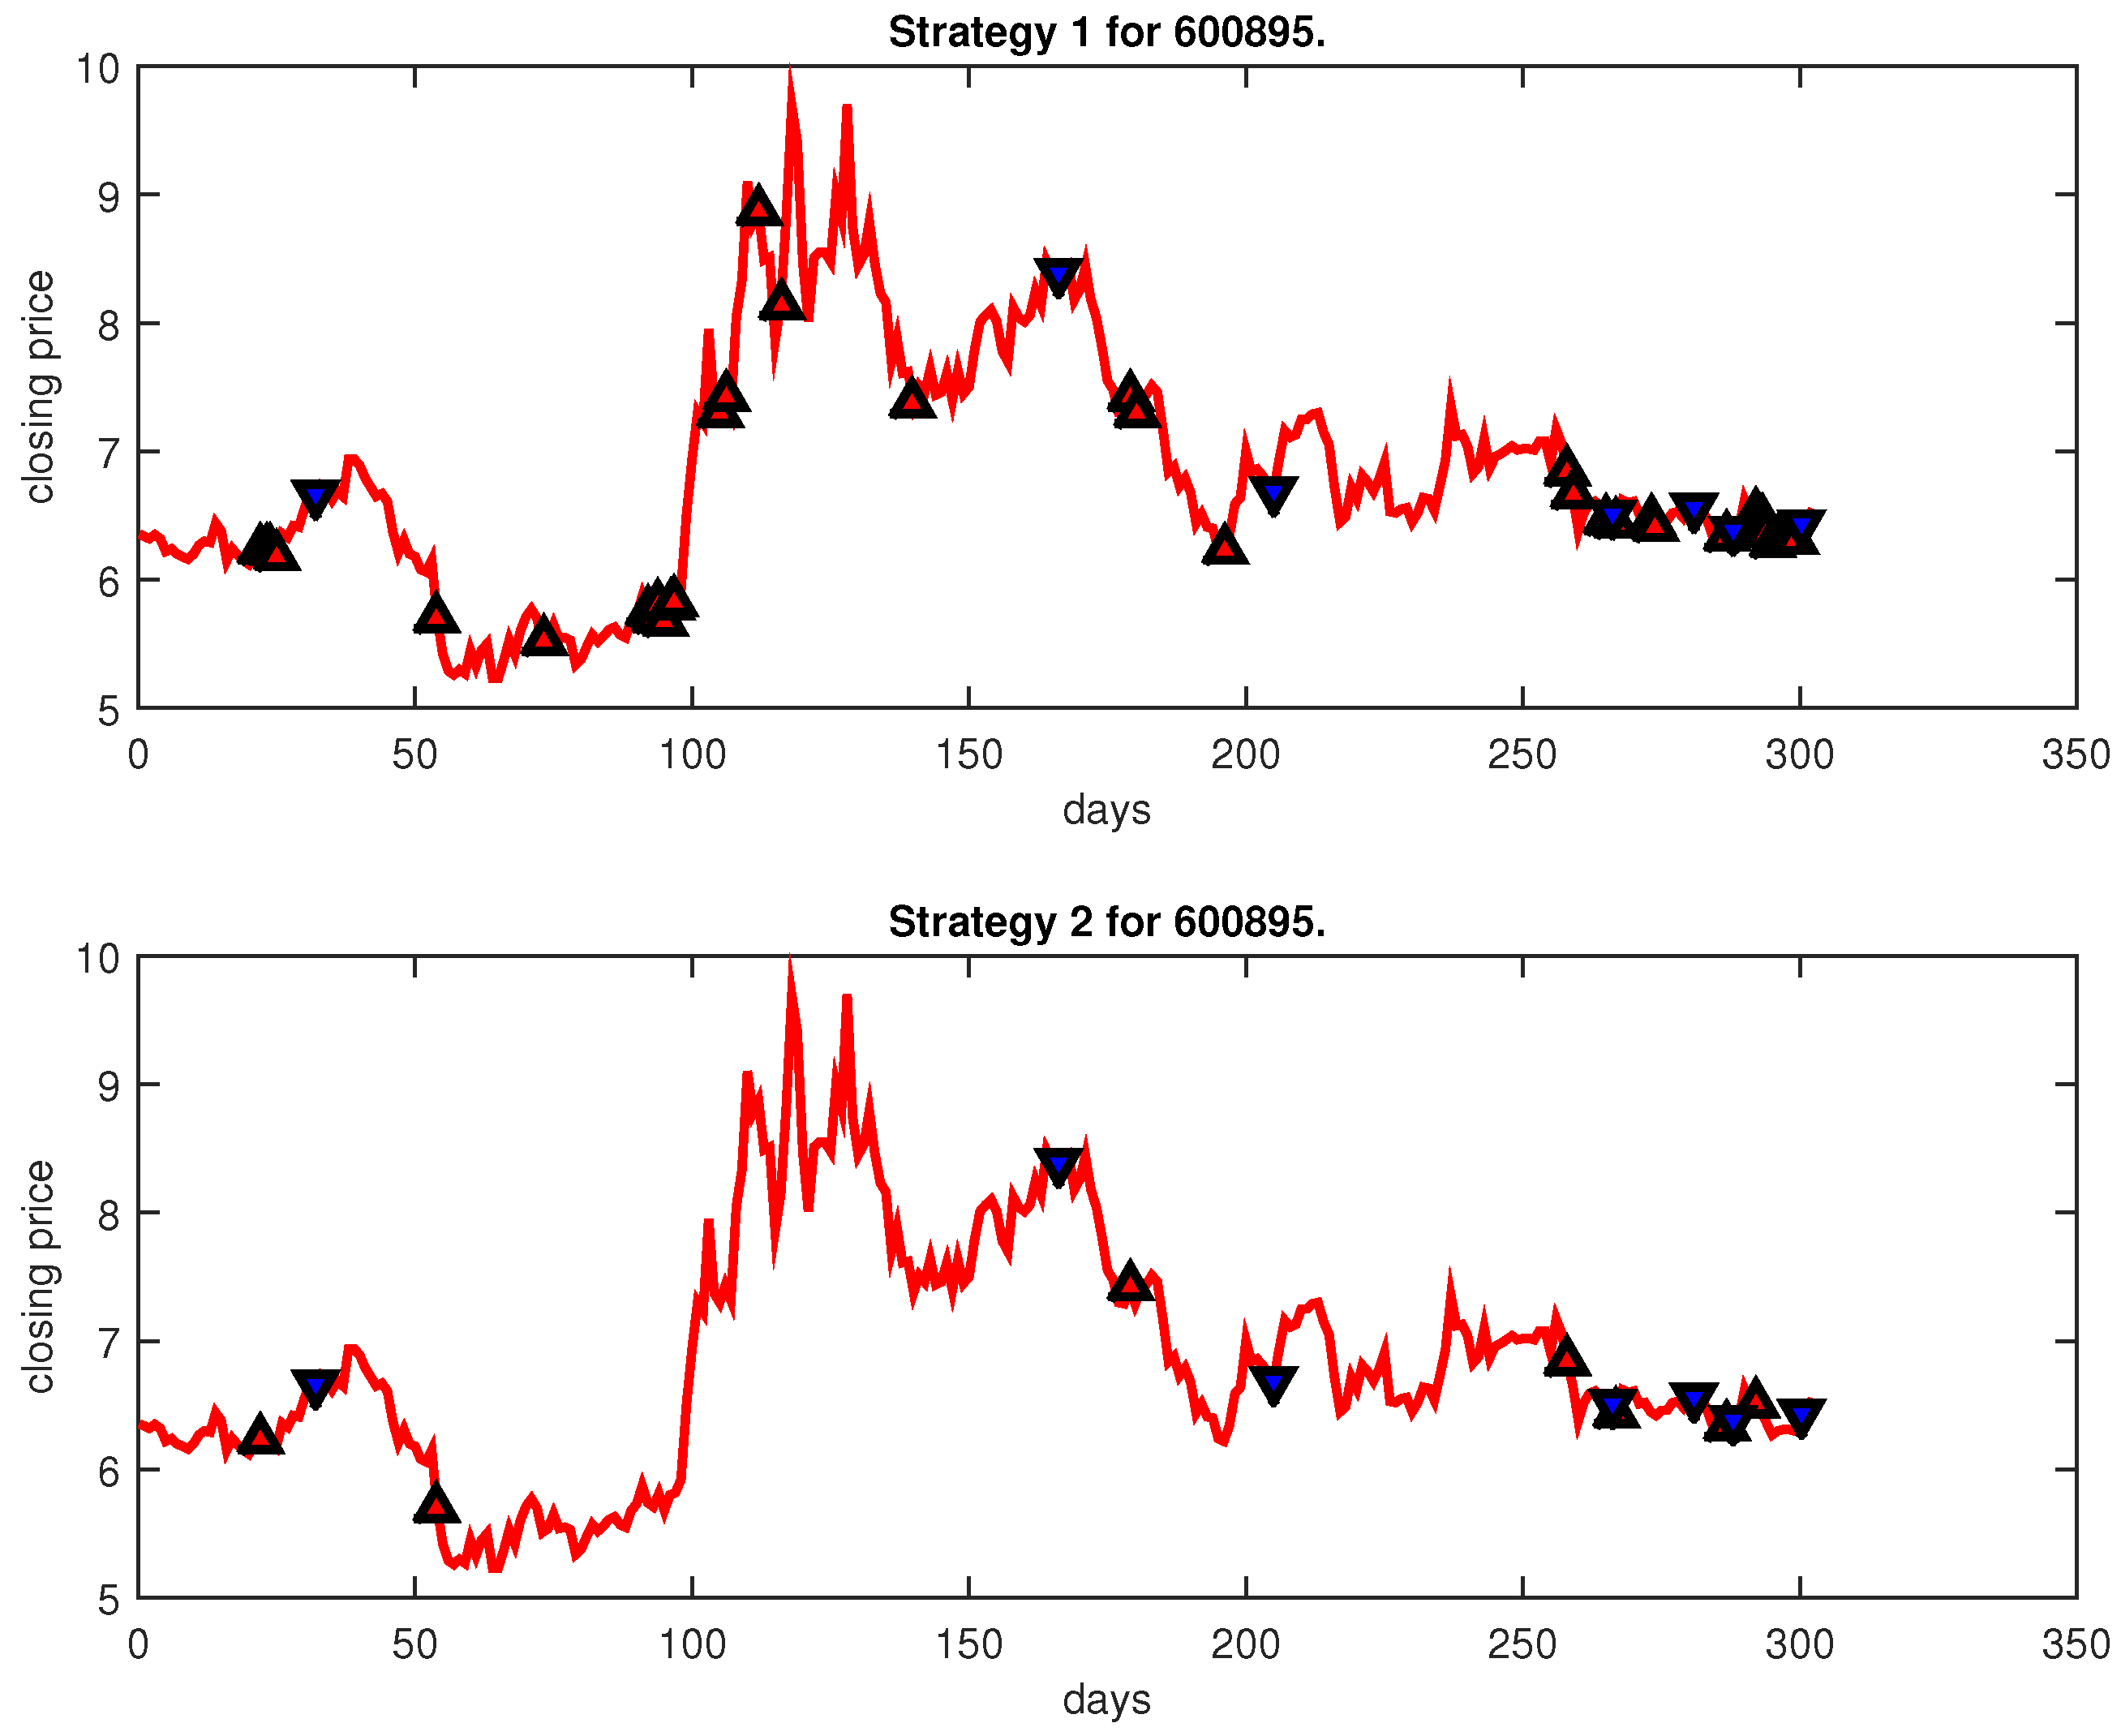
| 600895 | IPSO-FW-WSVM | 35 | 7 | 10,000 | 7 | 7 | ||||
| PLR-ANN | 46,109.99 | 113 | 14 | 10,000 | 16 | 14 | ||||
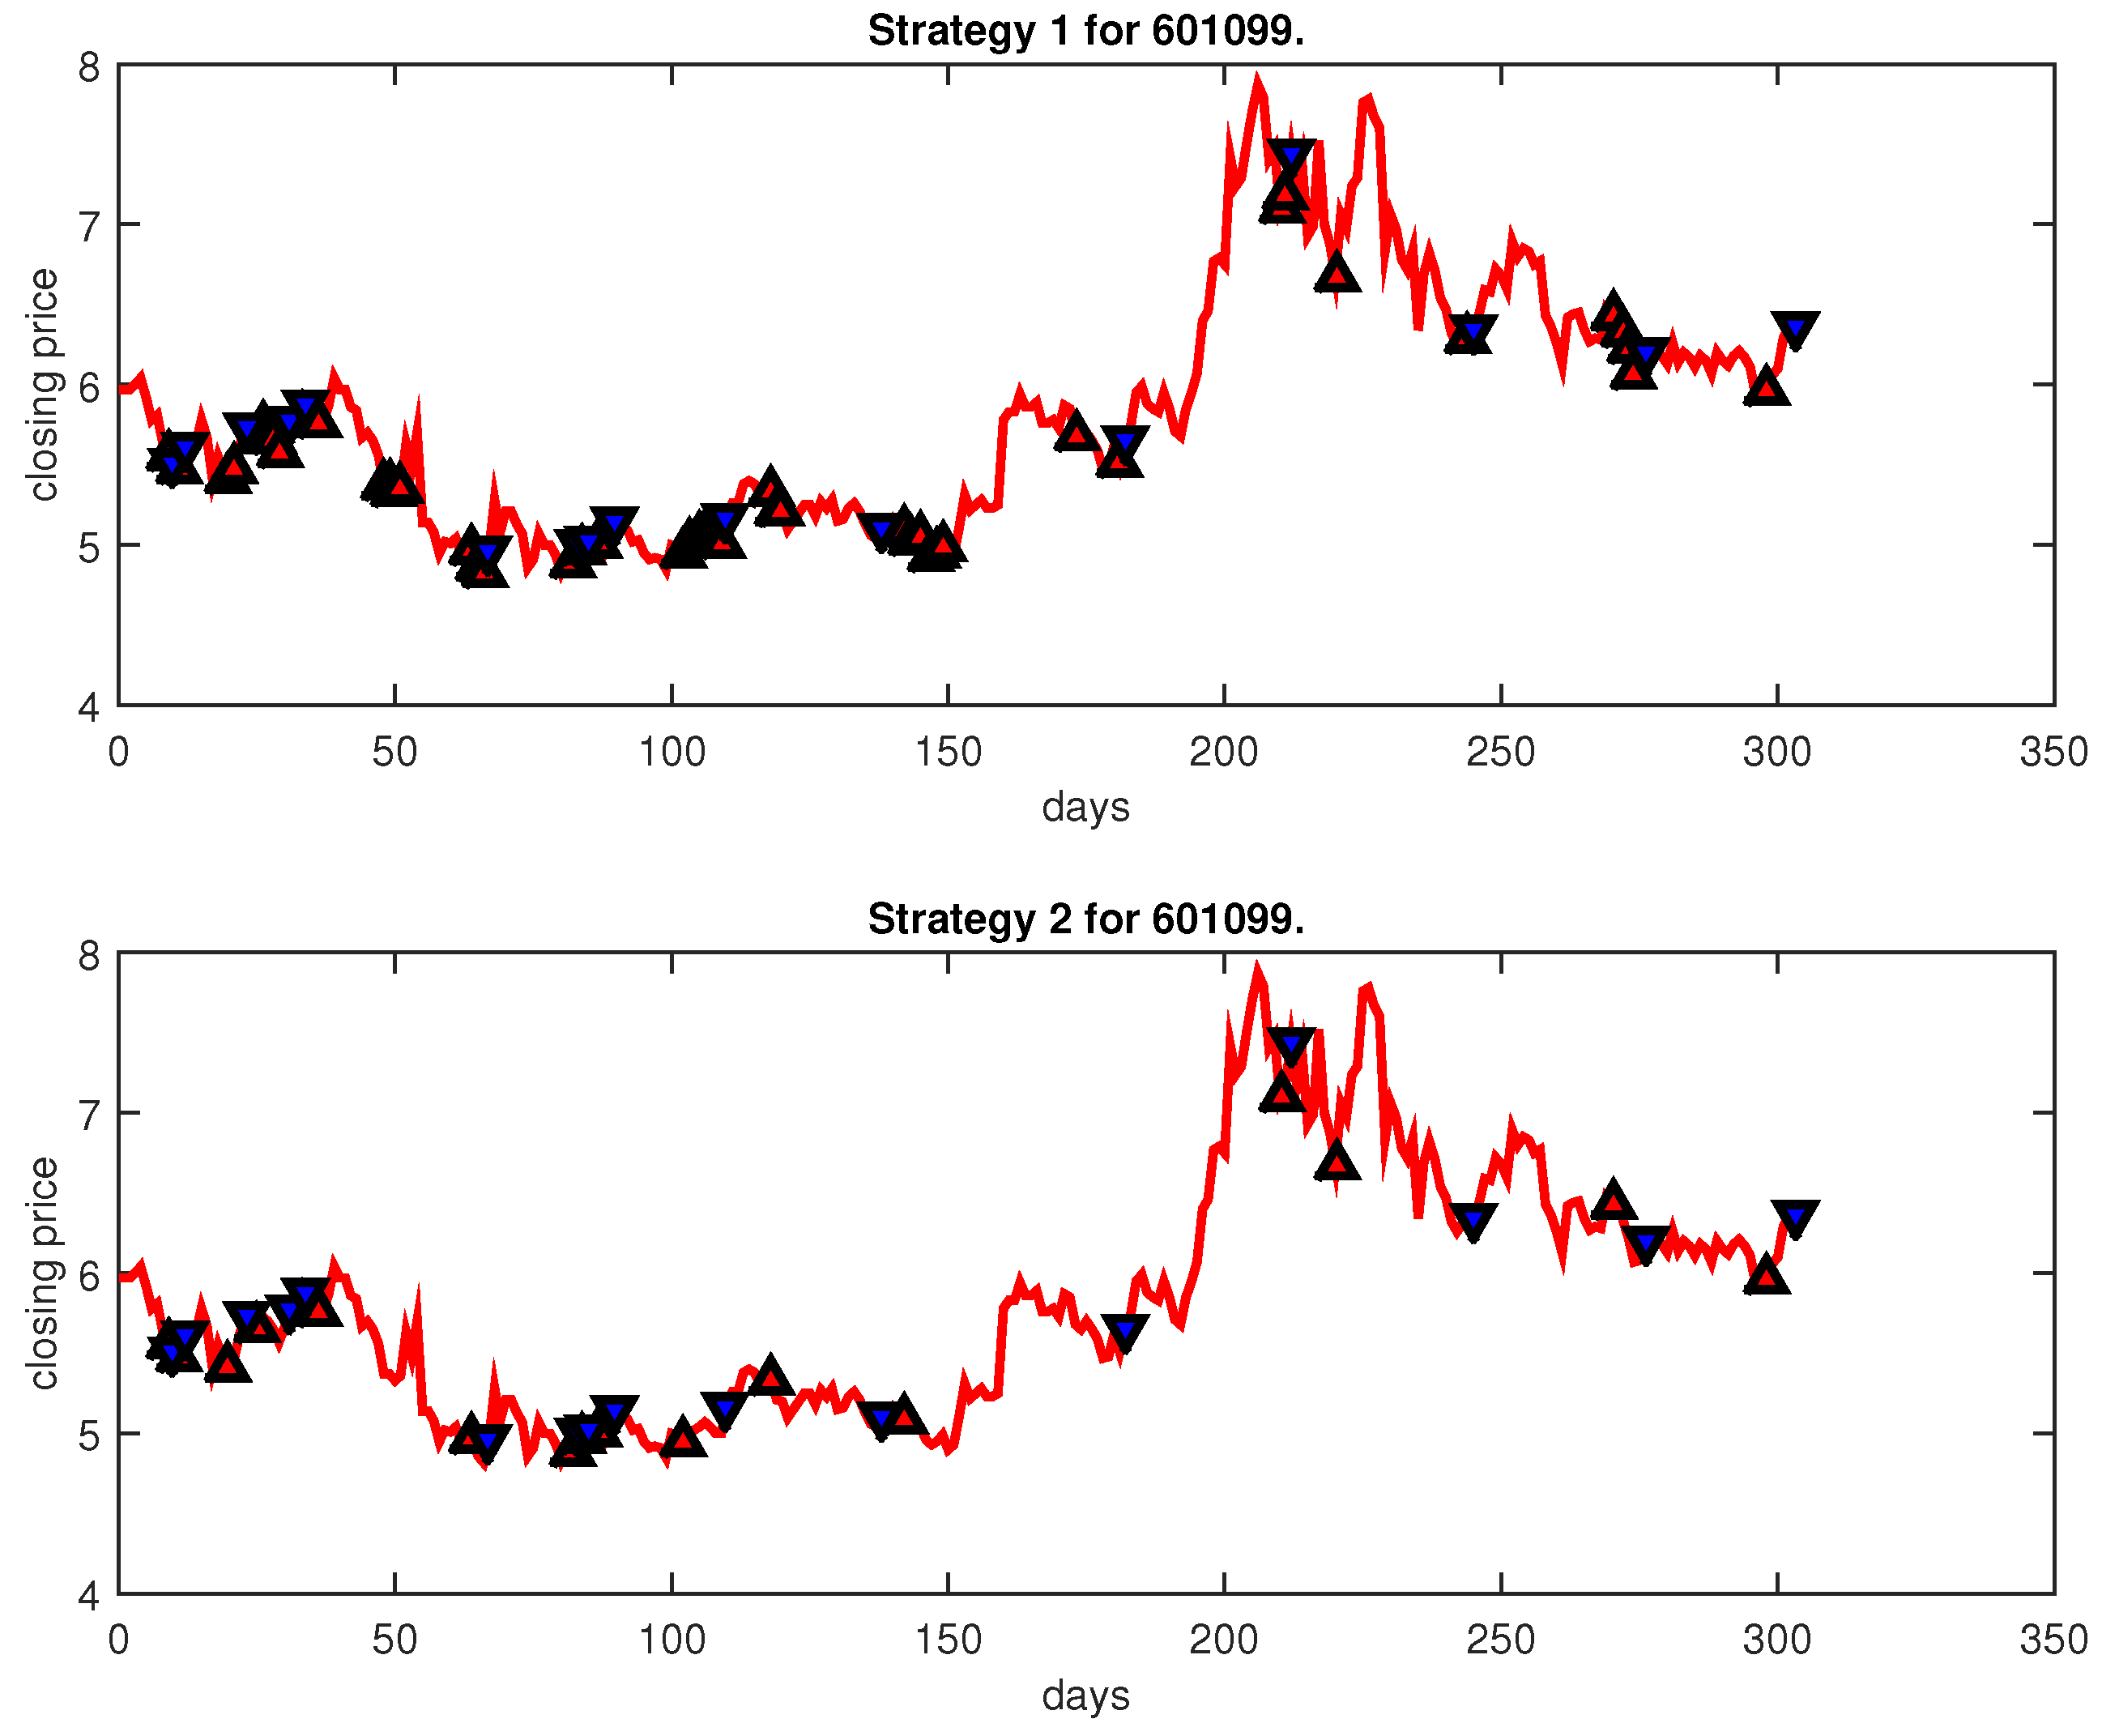
| 601099 | IPSO-FW-WSVM | 48 | 16 | 10,000 | 17 | 16 | ||||
| PLR-ANN | 16,495.44 | 85 | 12 | 10,000 | 12 | 12 | ||||
| 000514 | IPSO-FW-WSVM | 36 | 10 | 10,000 | 10 | 10 | ||||
| PLR-ANN | 95 | 12 | 10,000 | 12 | 12 | |||||
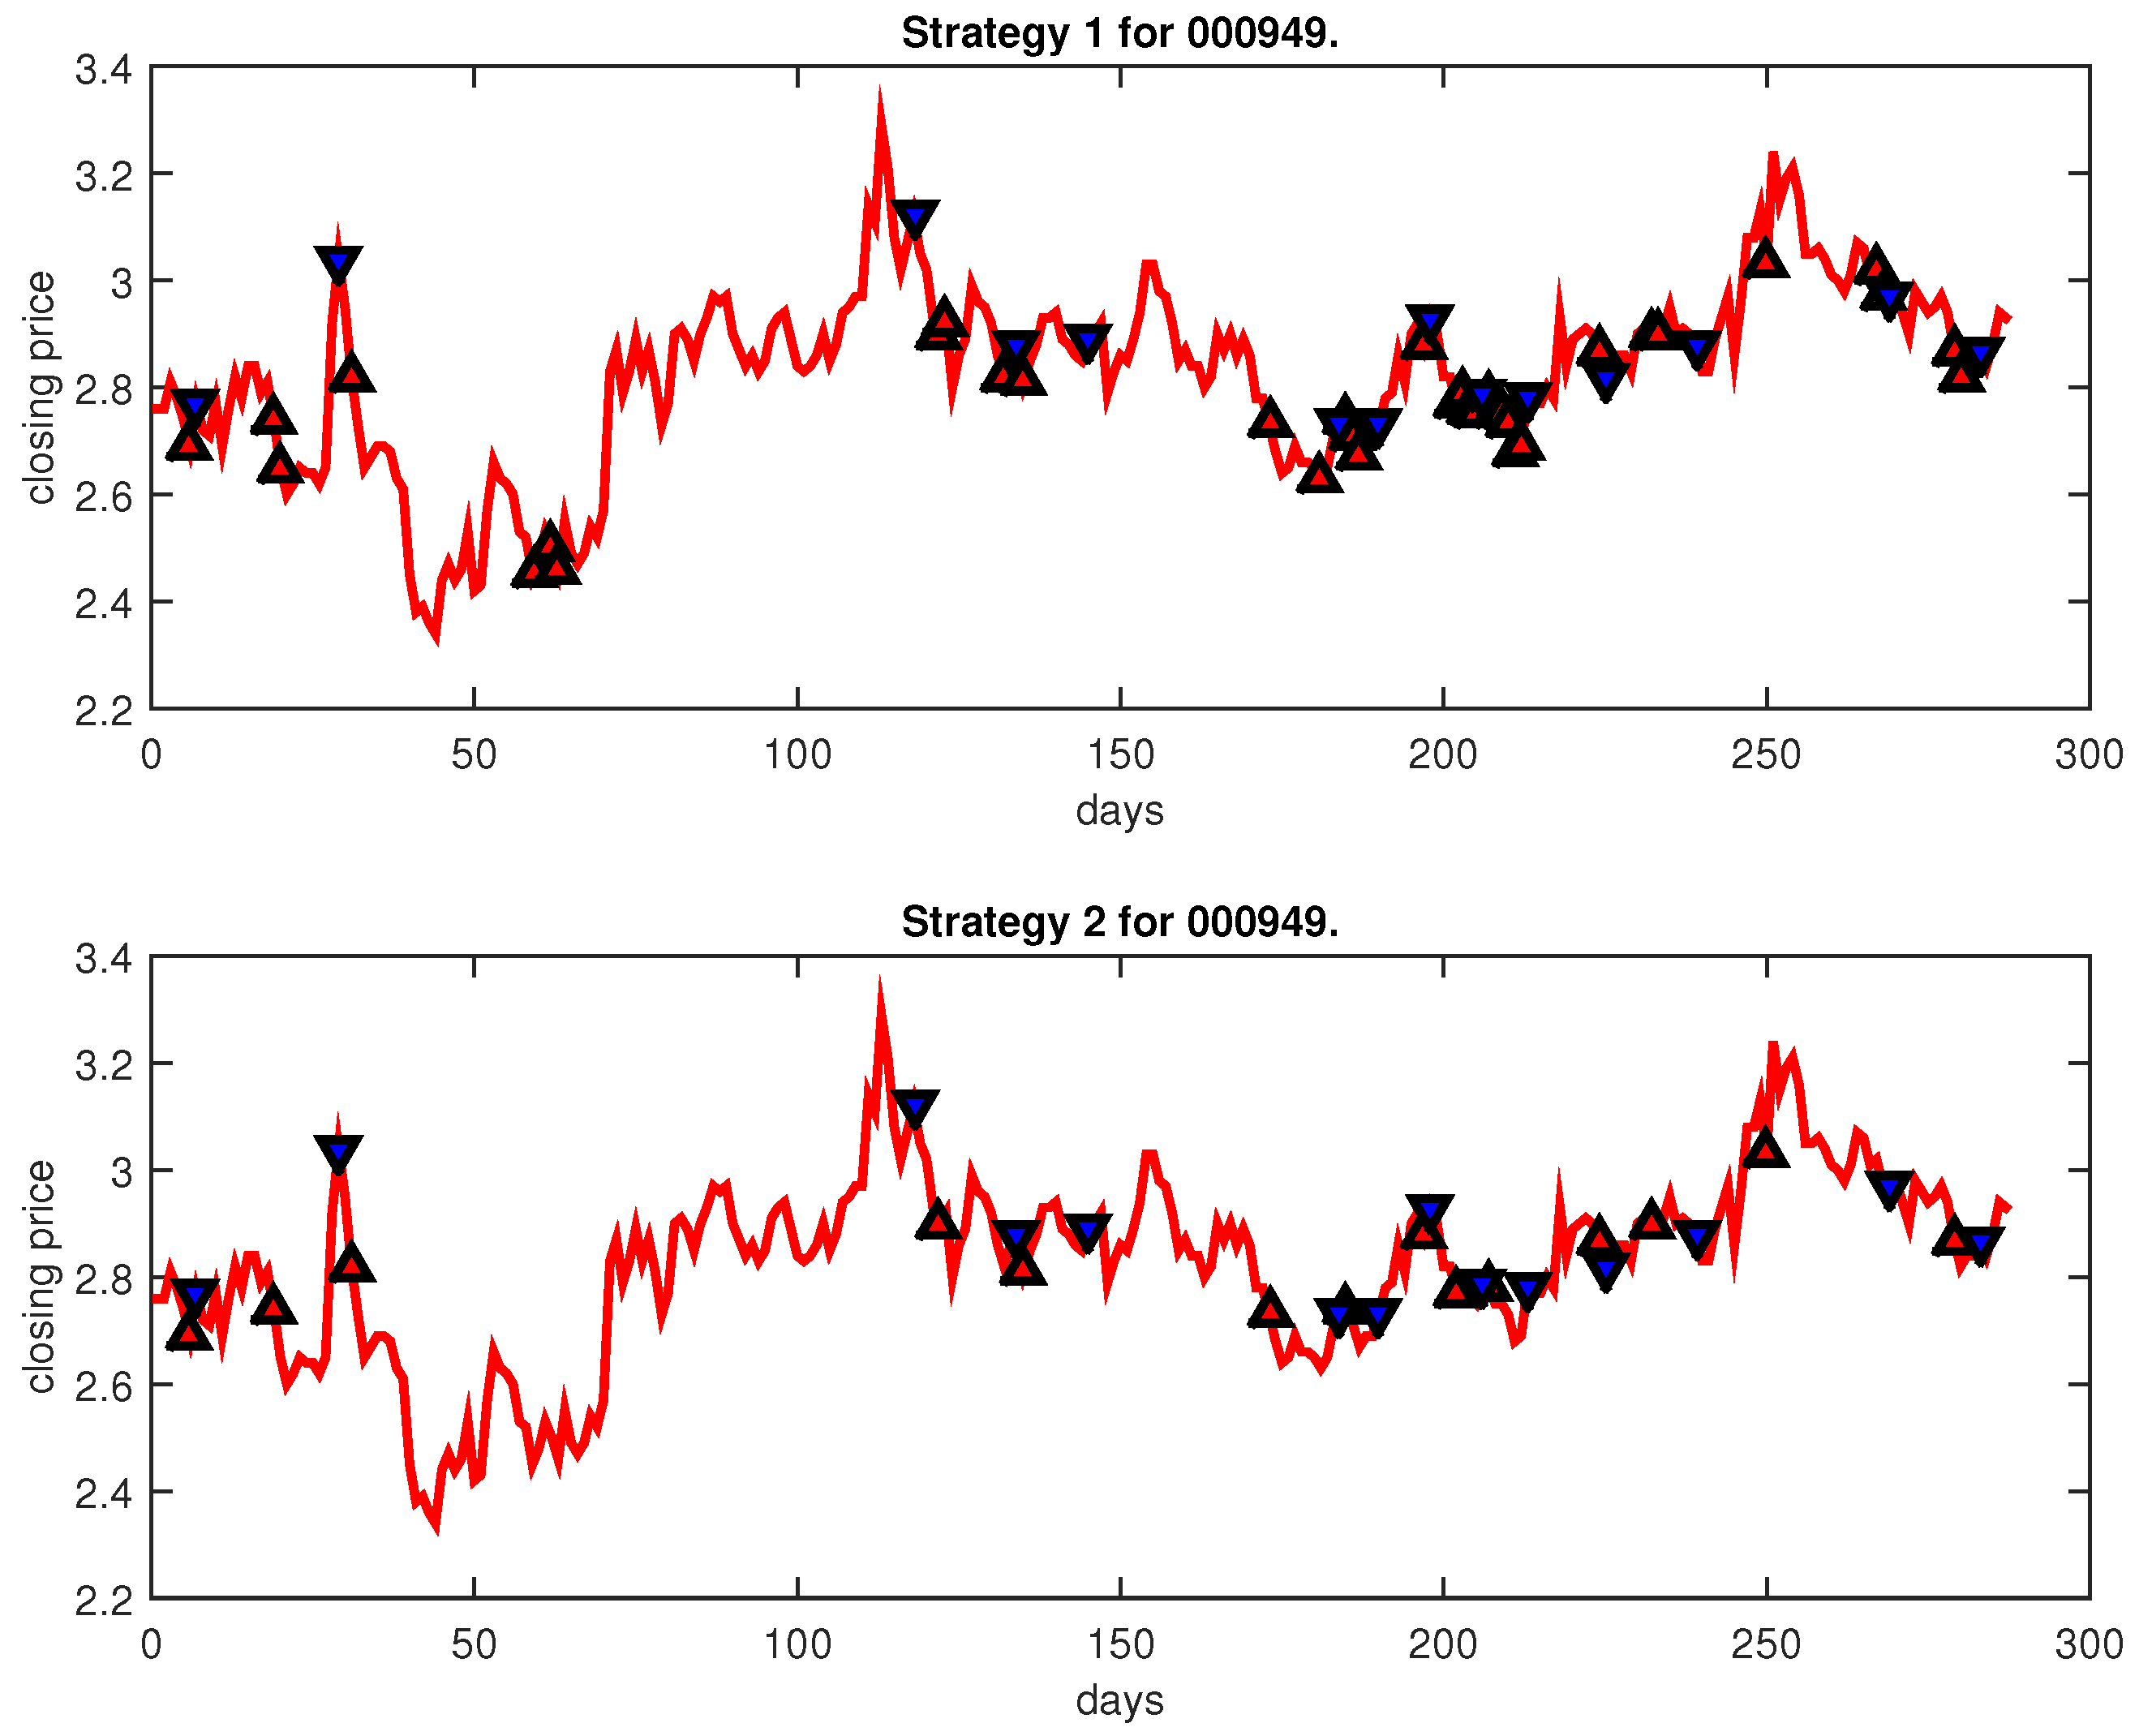
| 000949 | IPSO-FW-WSVM | 35 | 14 | 10,000 | 14 | 14 | ||||
| PLR-ANN | 86 | 8 | 10,000 | 8 | 8 | |||||
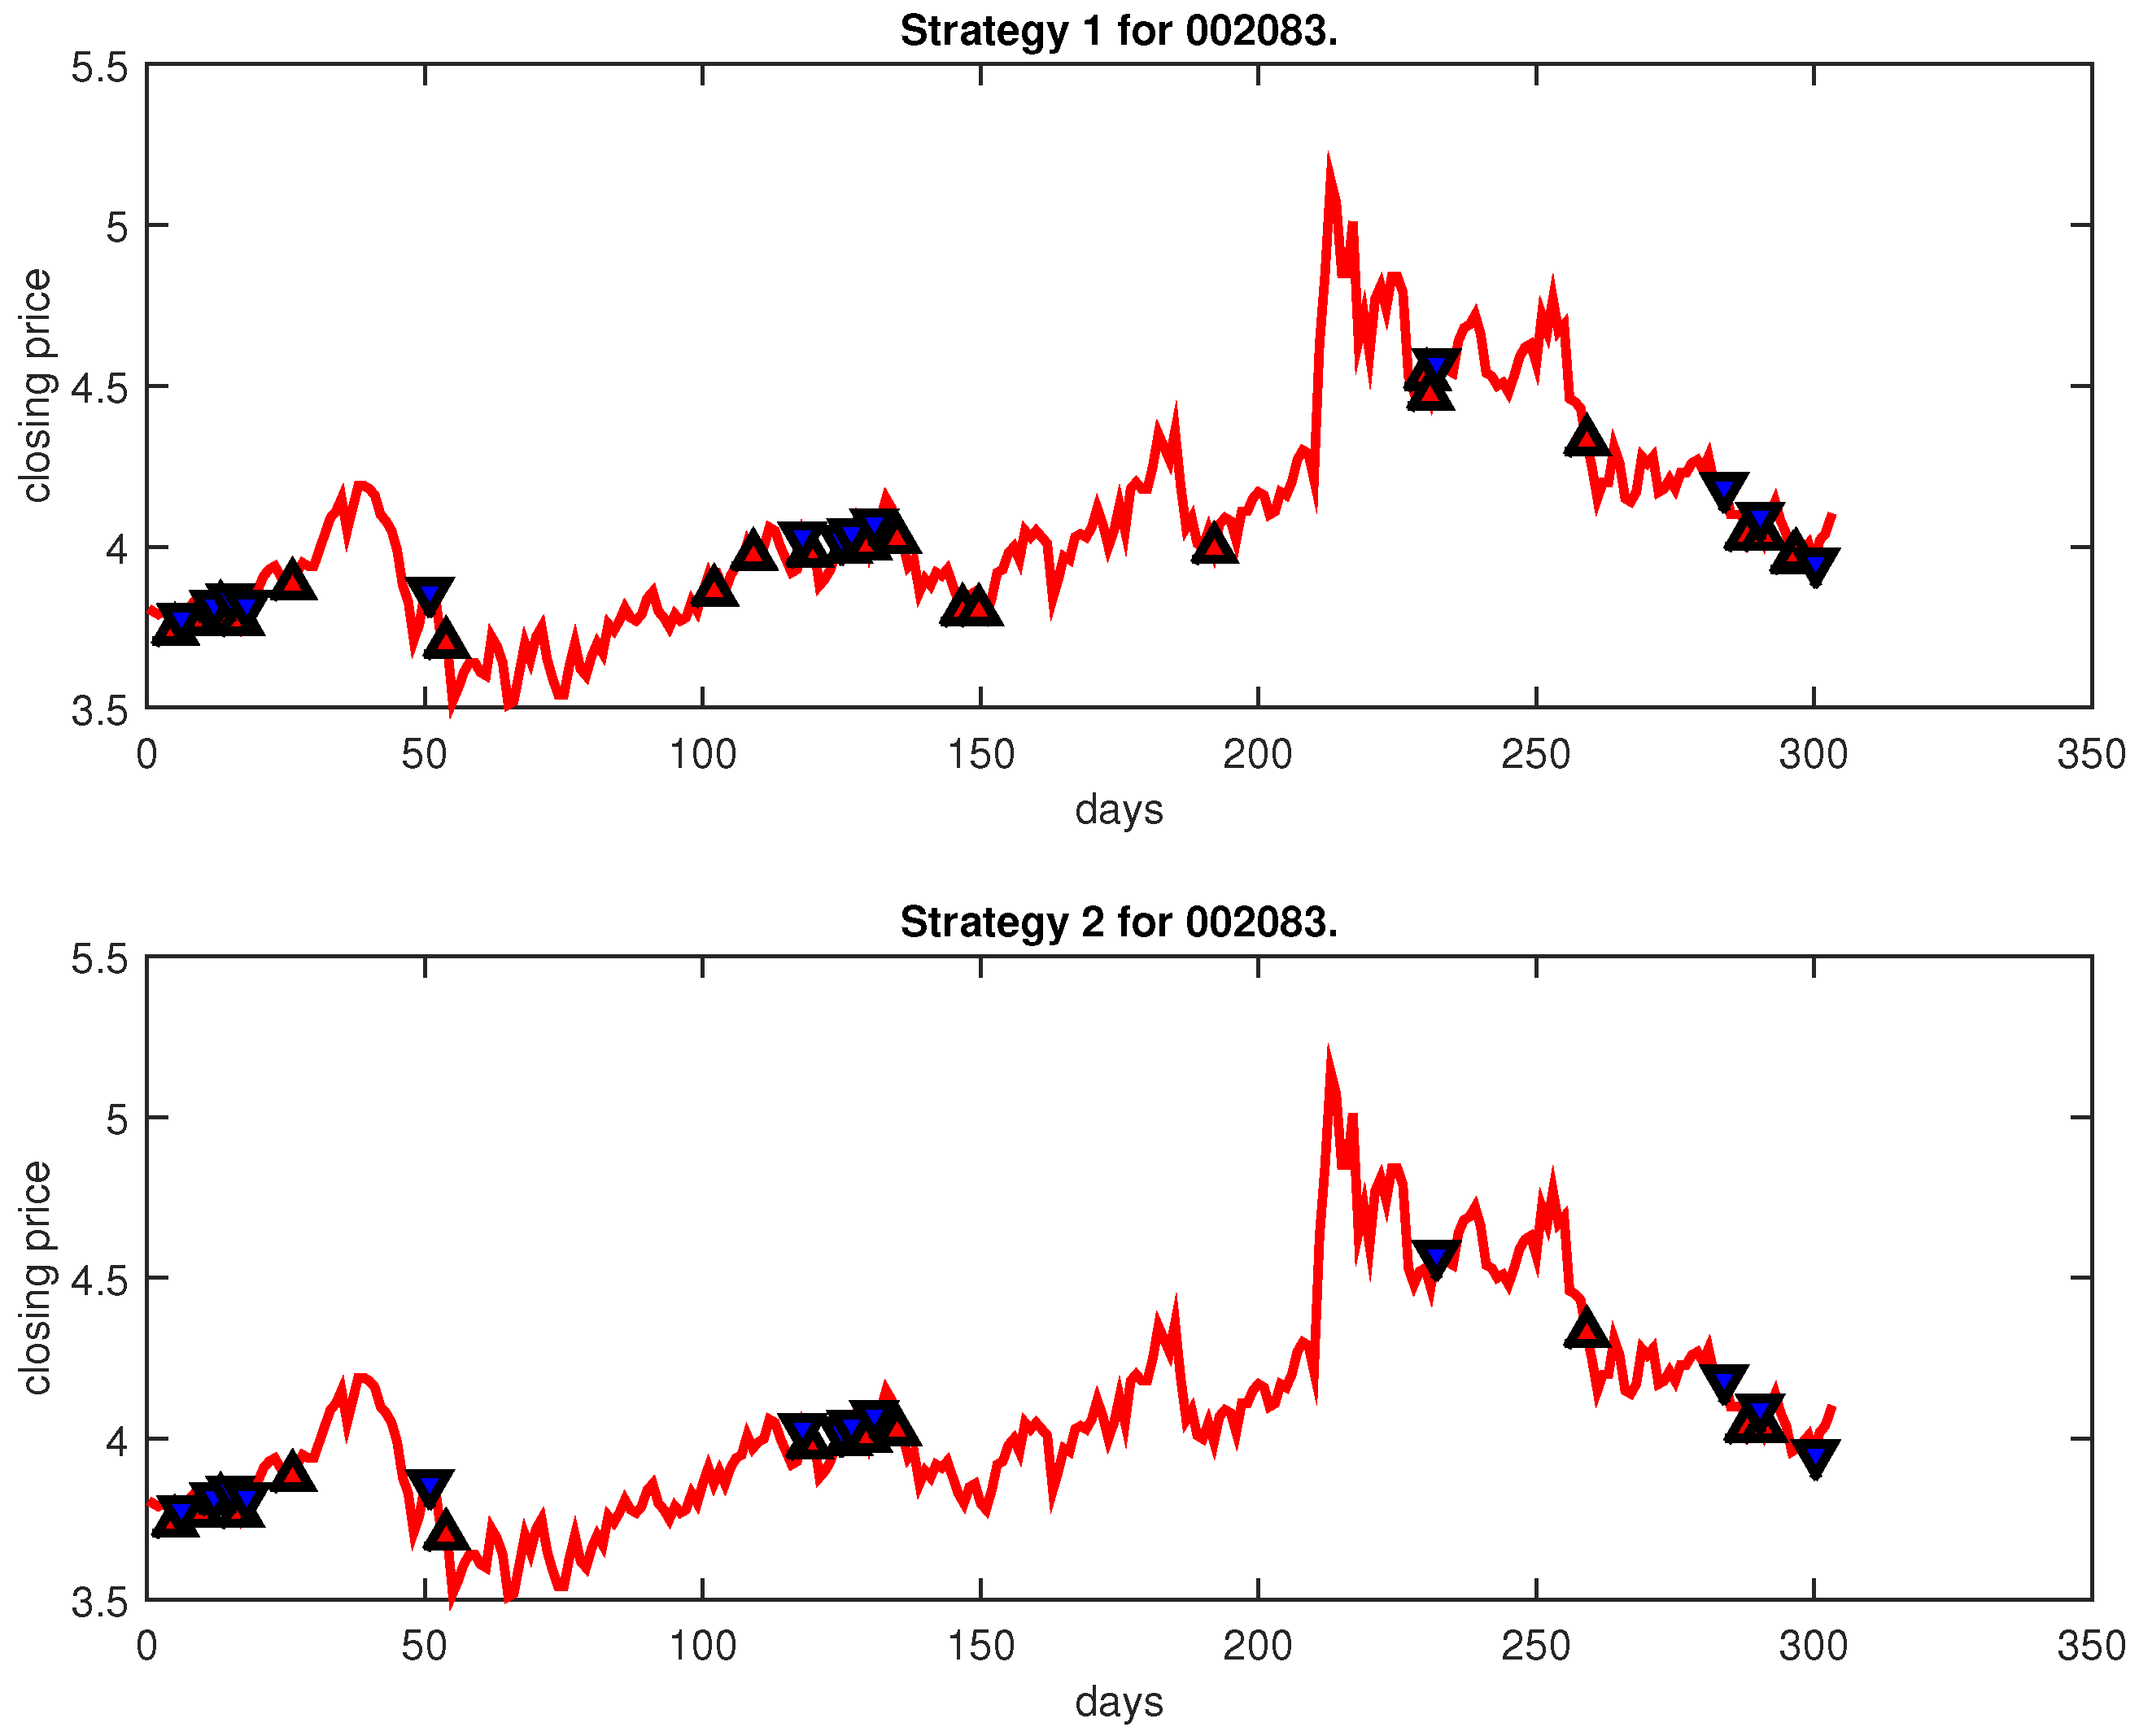
| 002083 | IPSO-FW-WSVM | 23 | 13 | 10,000 | 13 | 13 | ||||
| PLR-ANN | 12,855.85 | 74 | 6 | 10,000 | 6 | 6 | ||||
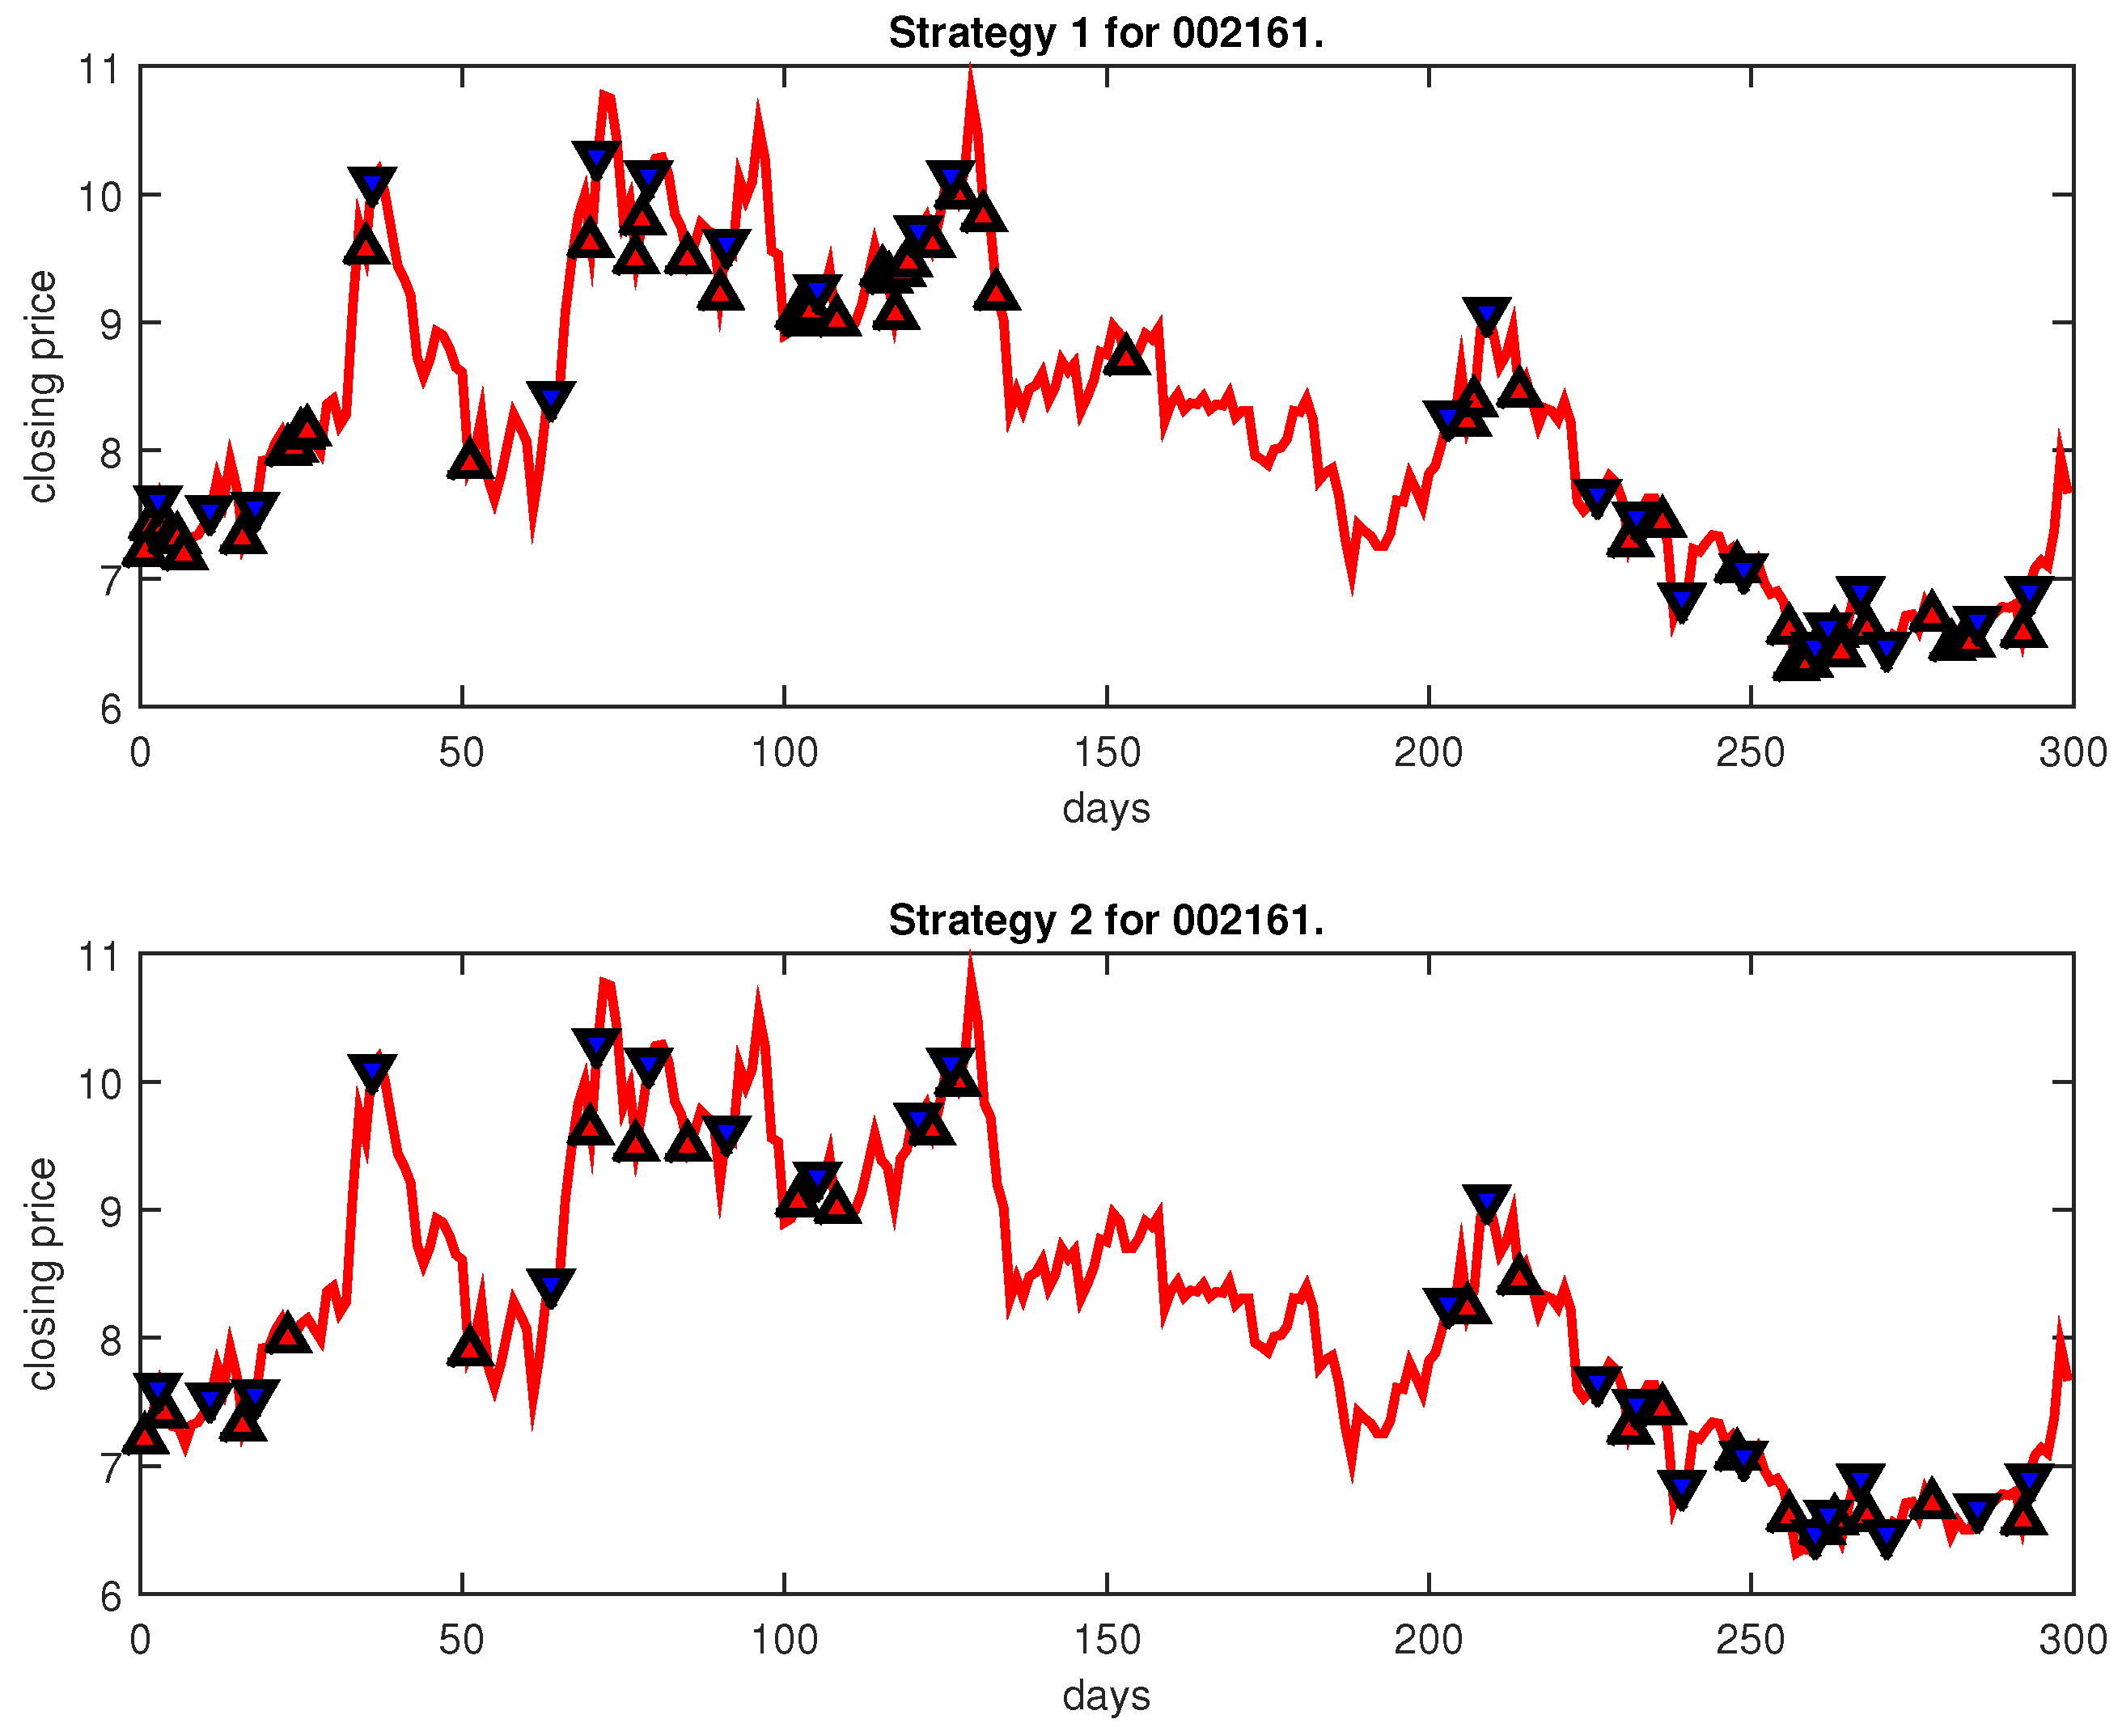
| 002161 | IPSO-FW-WSVM | 50 | 23 | 10,000 | 23 | 23 | ||||
| PLR-ANN | 37,128.73 | 86 | 4 | 10,000 | 4 | 4 | ||||
| Average | IPSO-FW-WSVM | 10,000 | ||||||||
| PLR-ANN | 23,155.58 | 10,000 | ||||||||
| Stock Code | Method | Accuracy | Strategy 1 | Strategy 2 | ||||||
|---|---|---|---|---|---|---|---|---|---|---|
| Profit (%) | Profit (%) | |||||||||
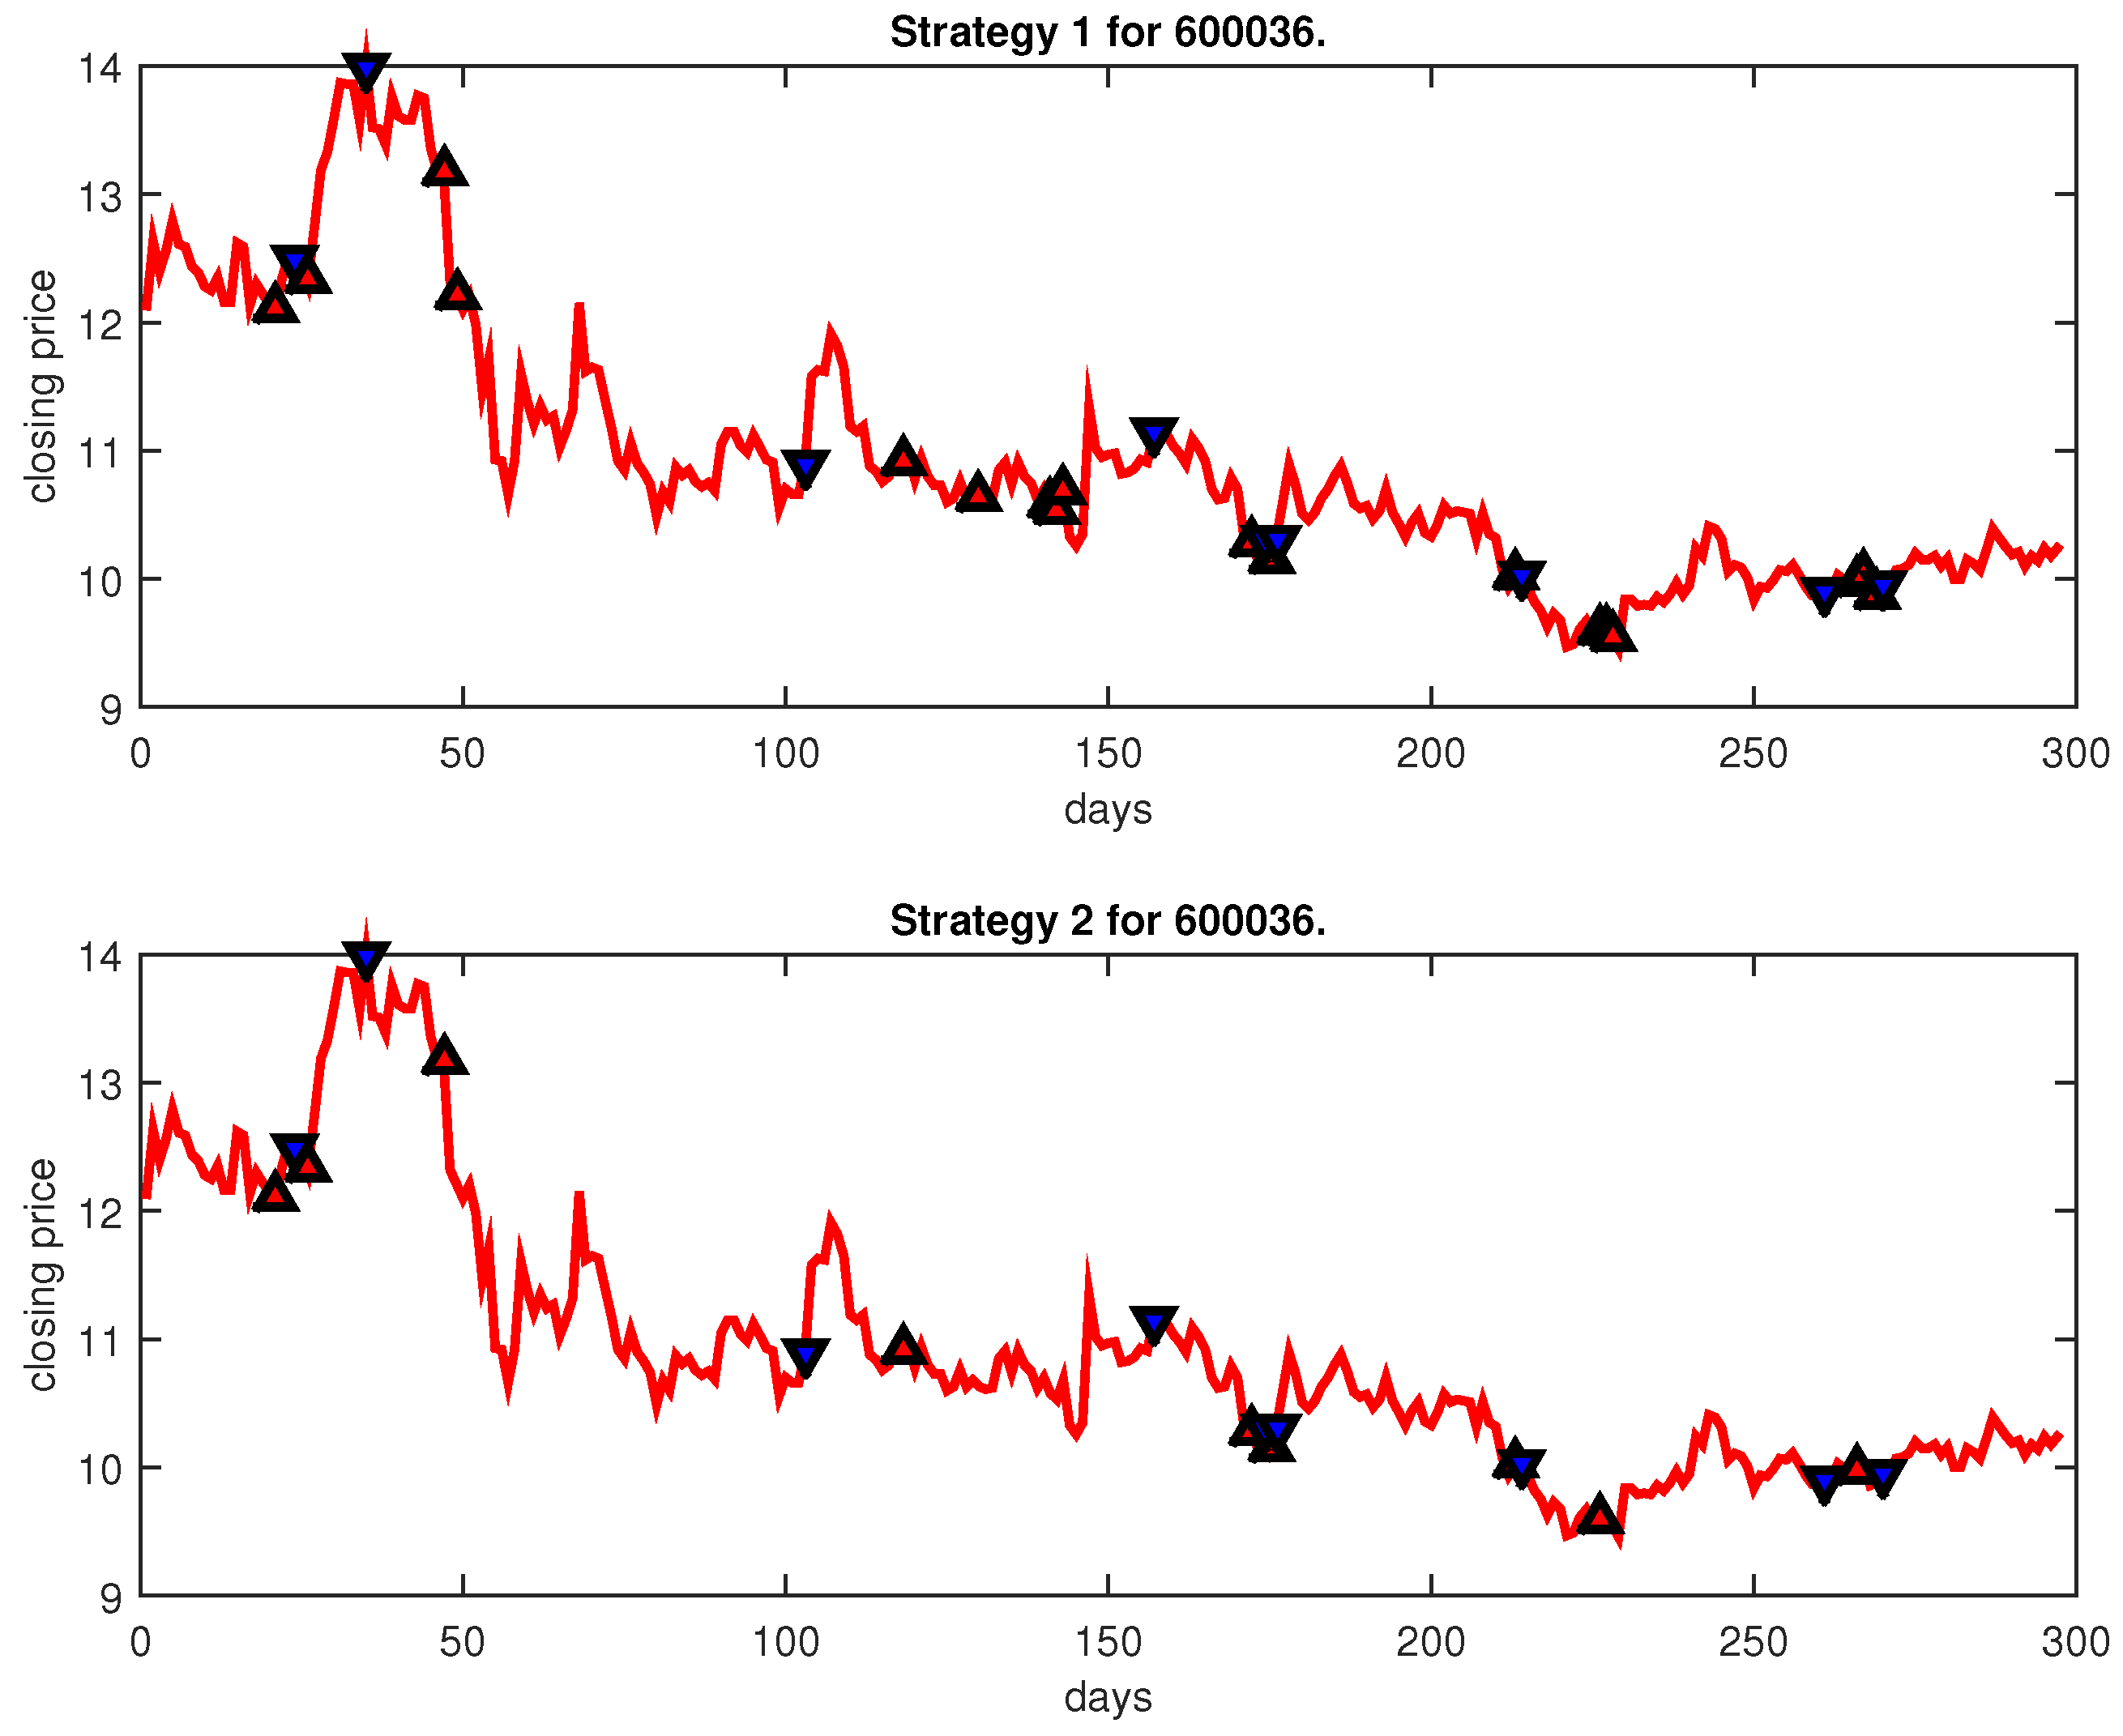
| 600036 | IPSO-FW-WSVM | 18 | 9 | 10,000 | 9 | 9 | ||||
| PLR-ANN | 37,849.97 | 79 | 6 | 10,000 | 6 | 6 | ||||
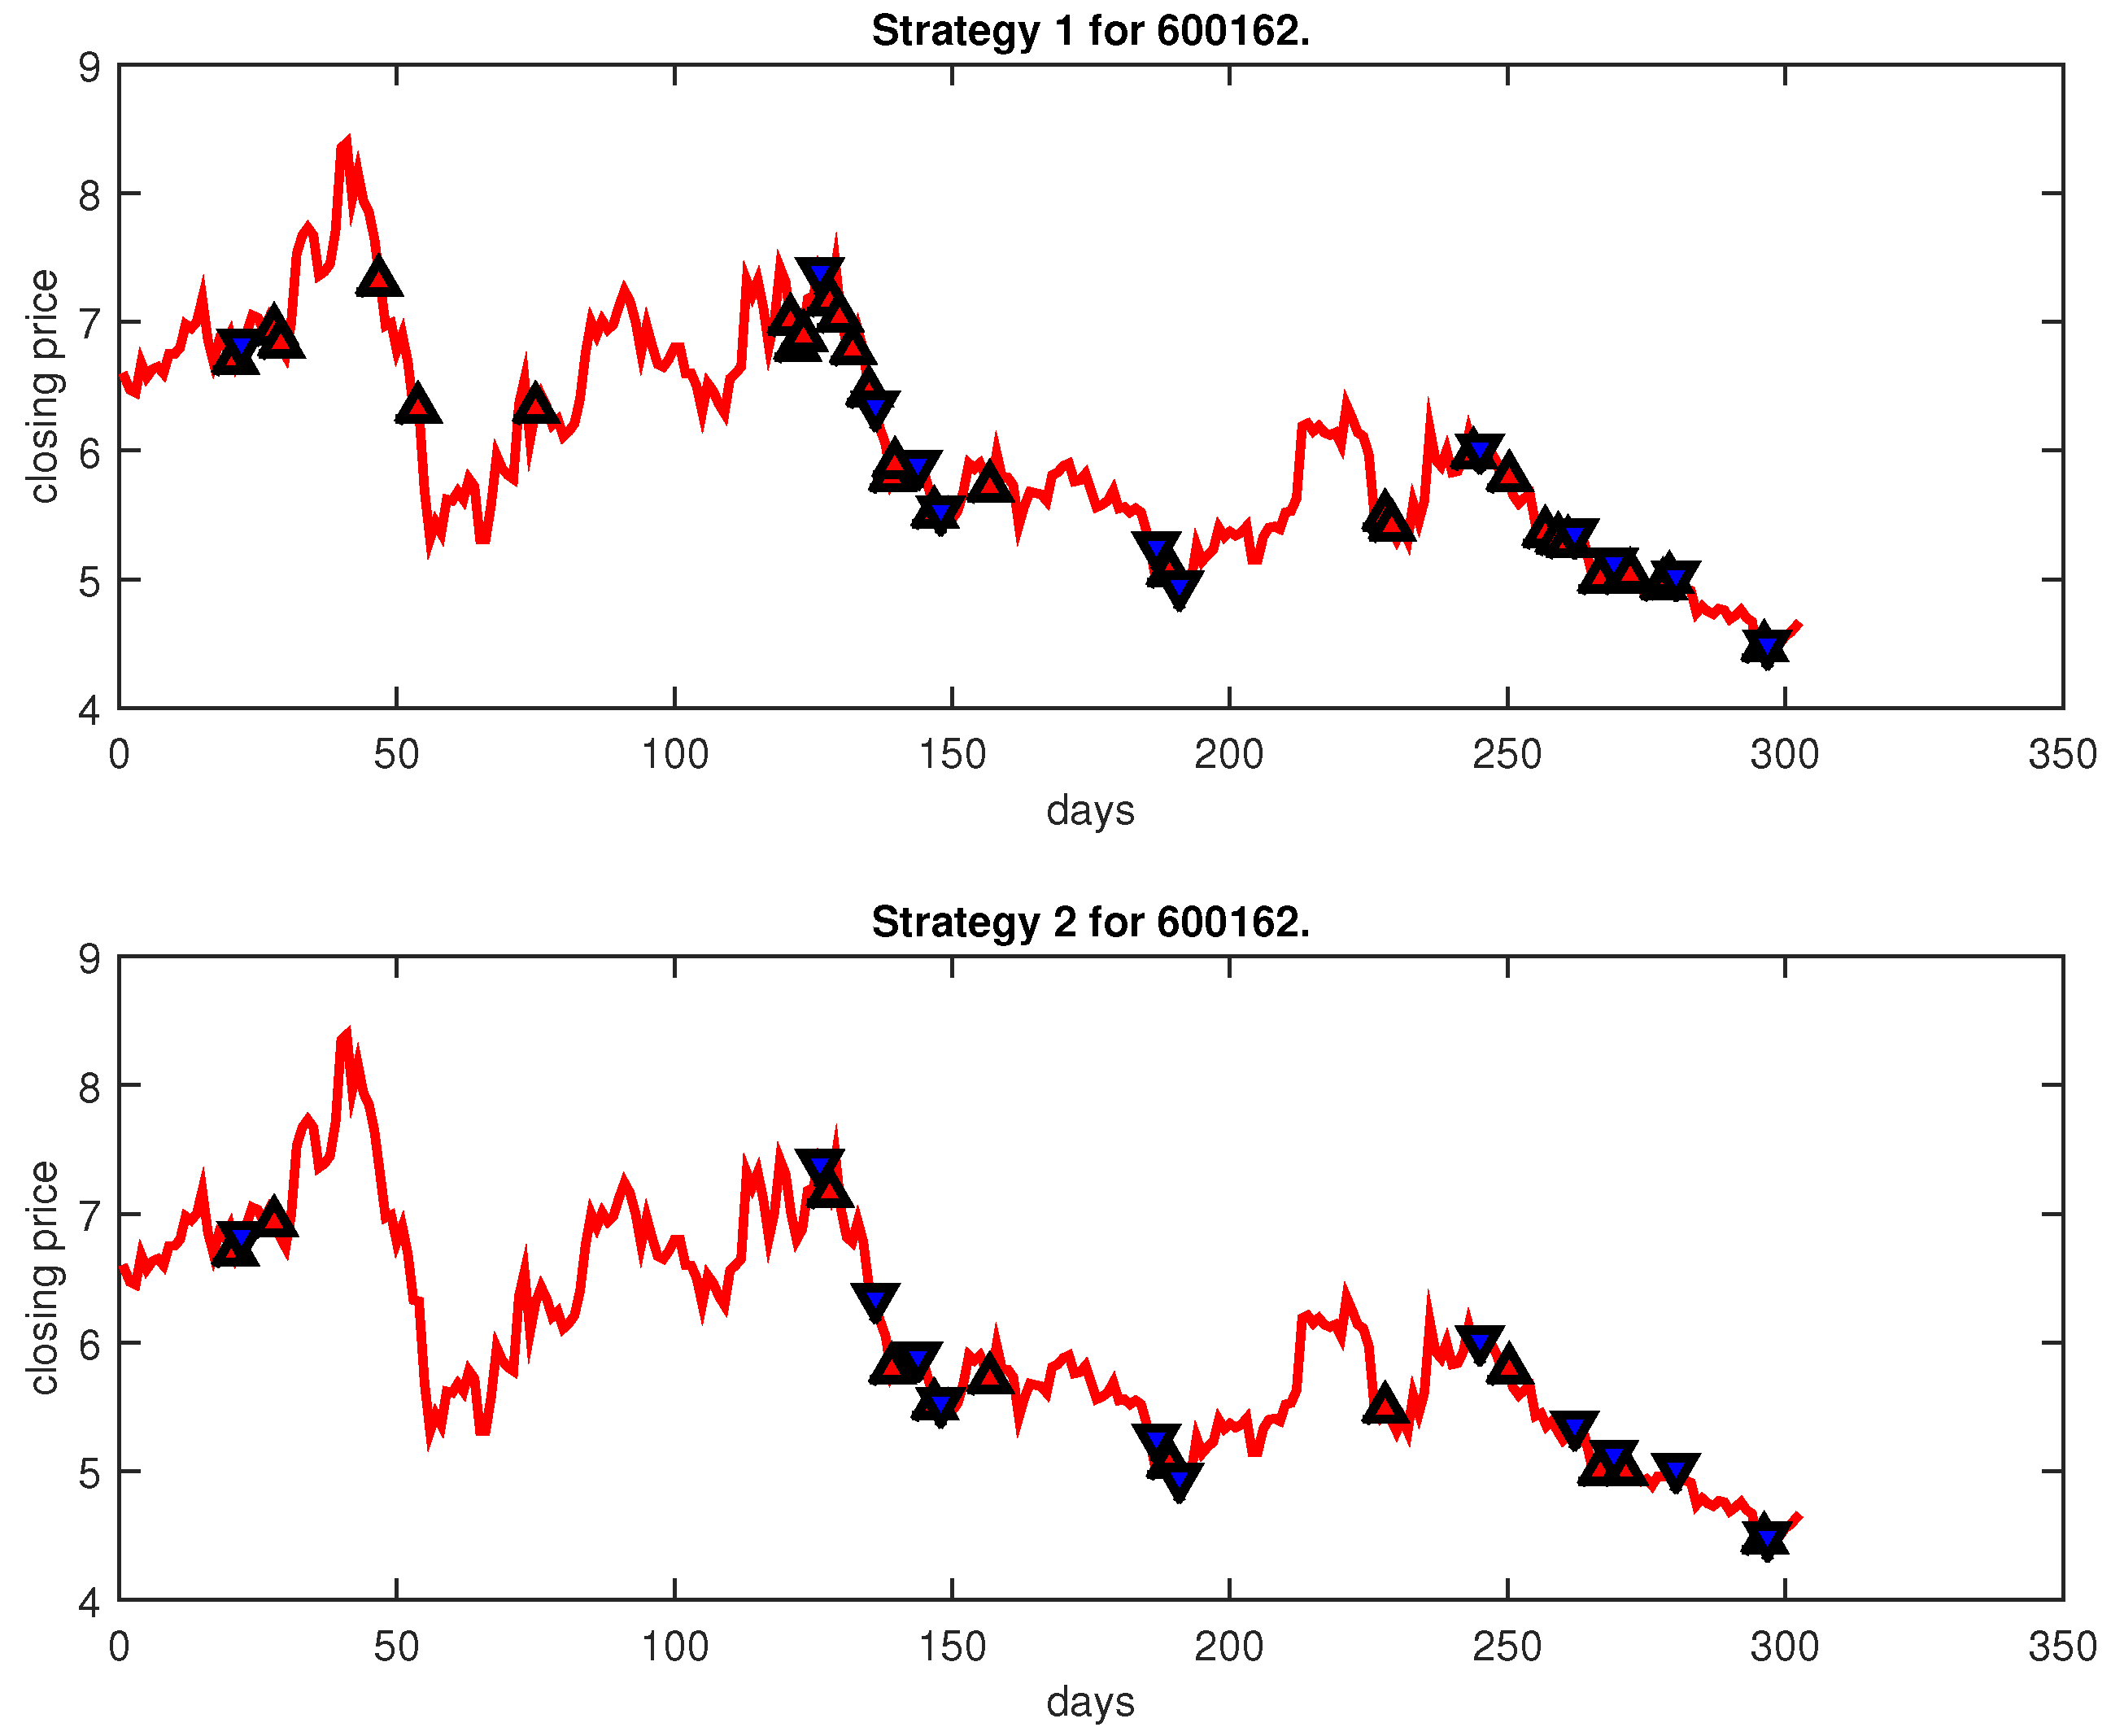
| 600162 | IPSO-FW-WSVM | 31 | 12 | 10,000 | 12 | 12 | ||||
| PLR-ANN | 40,799.91 | 93 | 10 | 10,000 | 11 | 10 | ||||
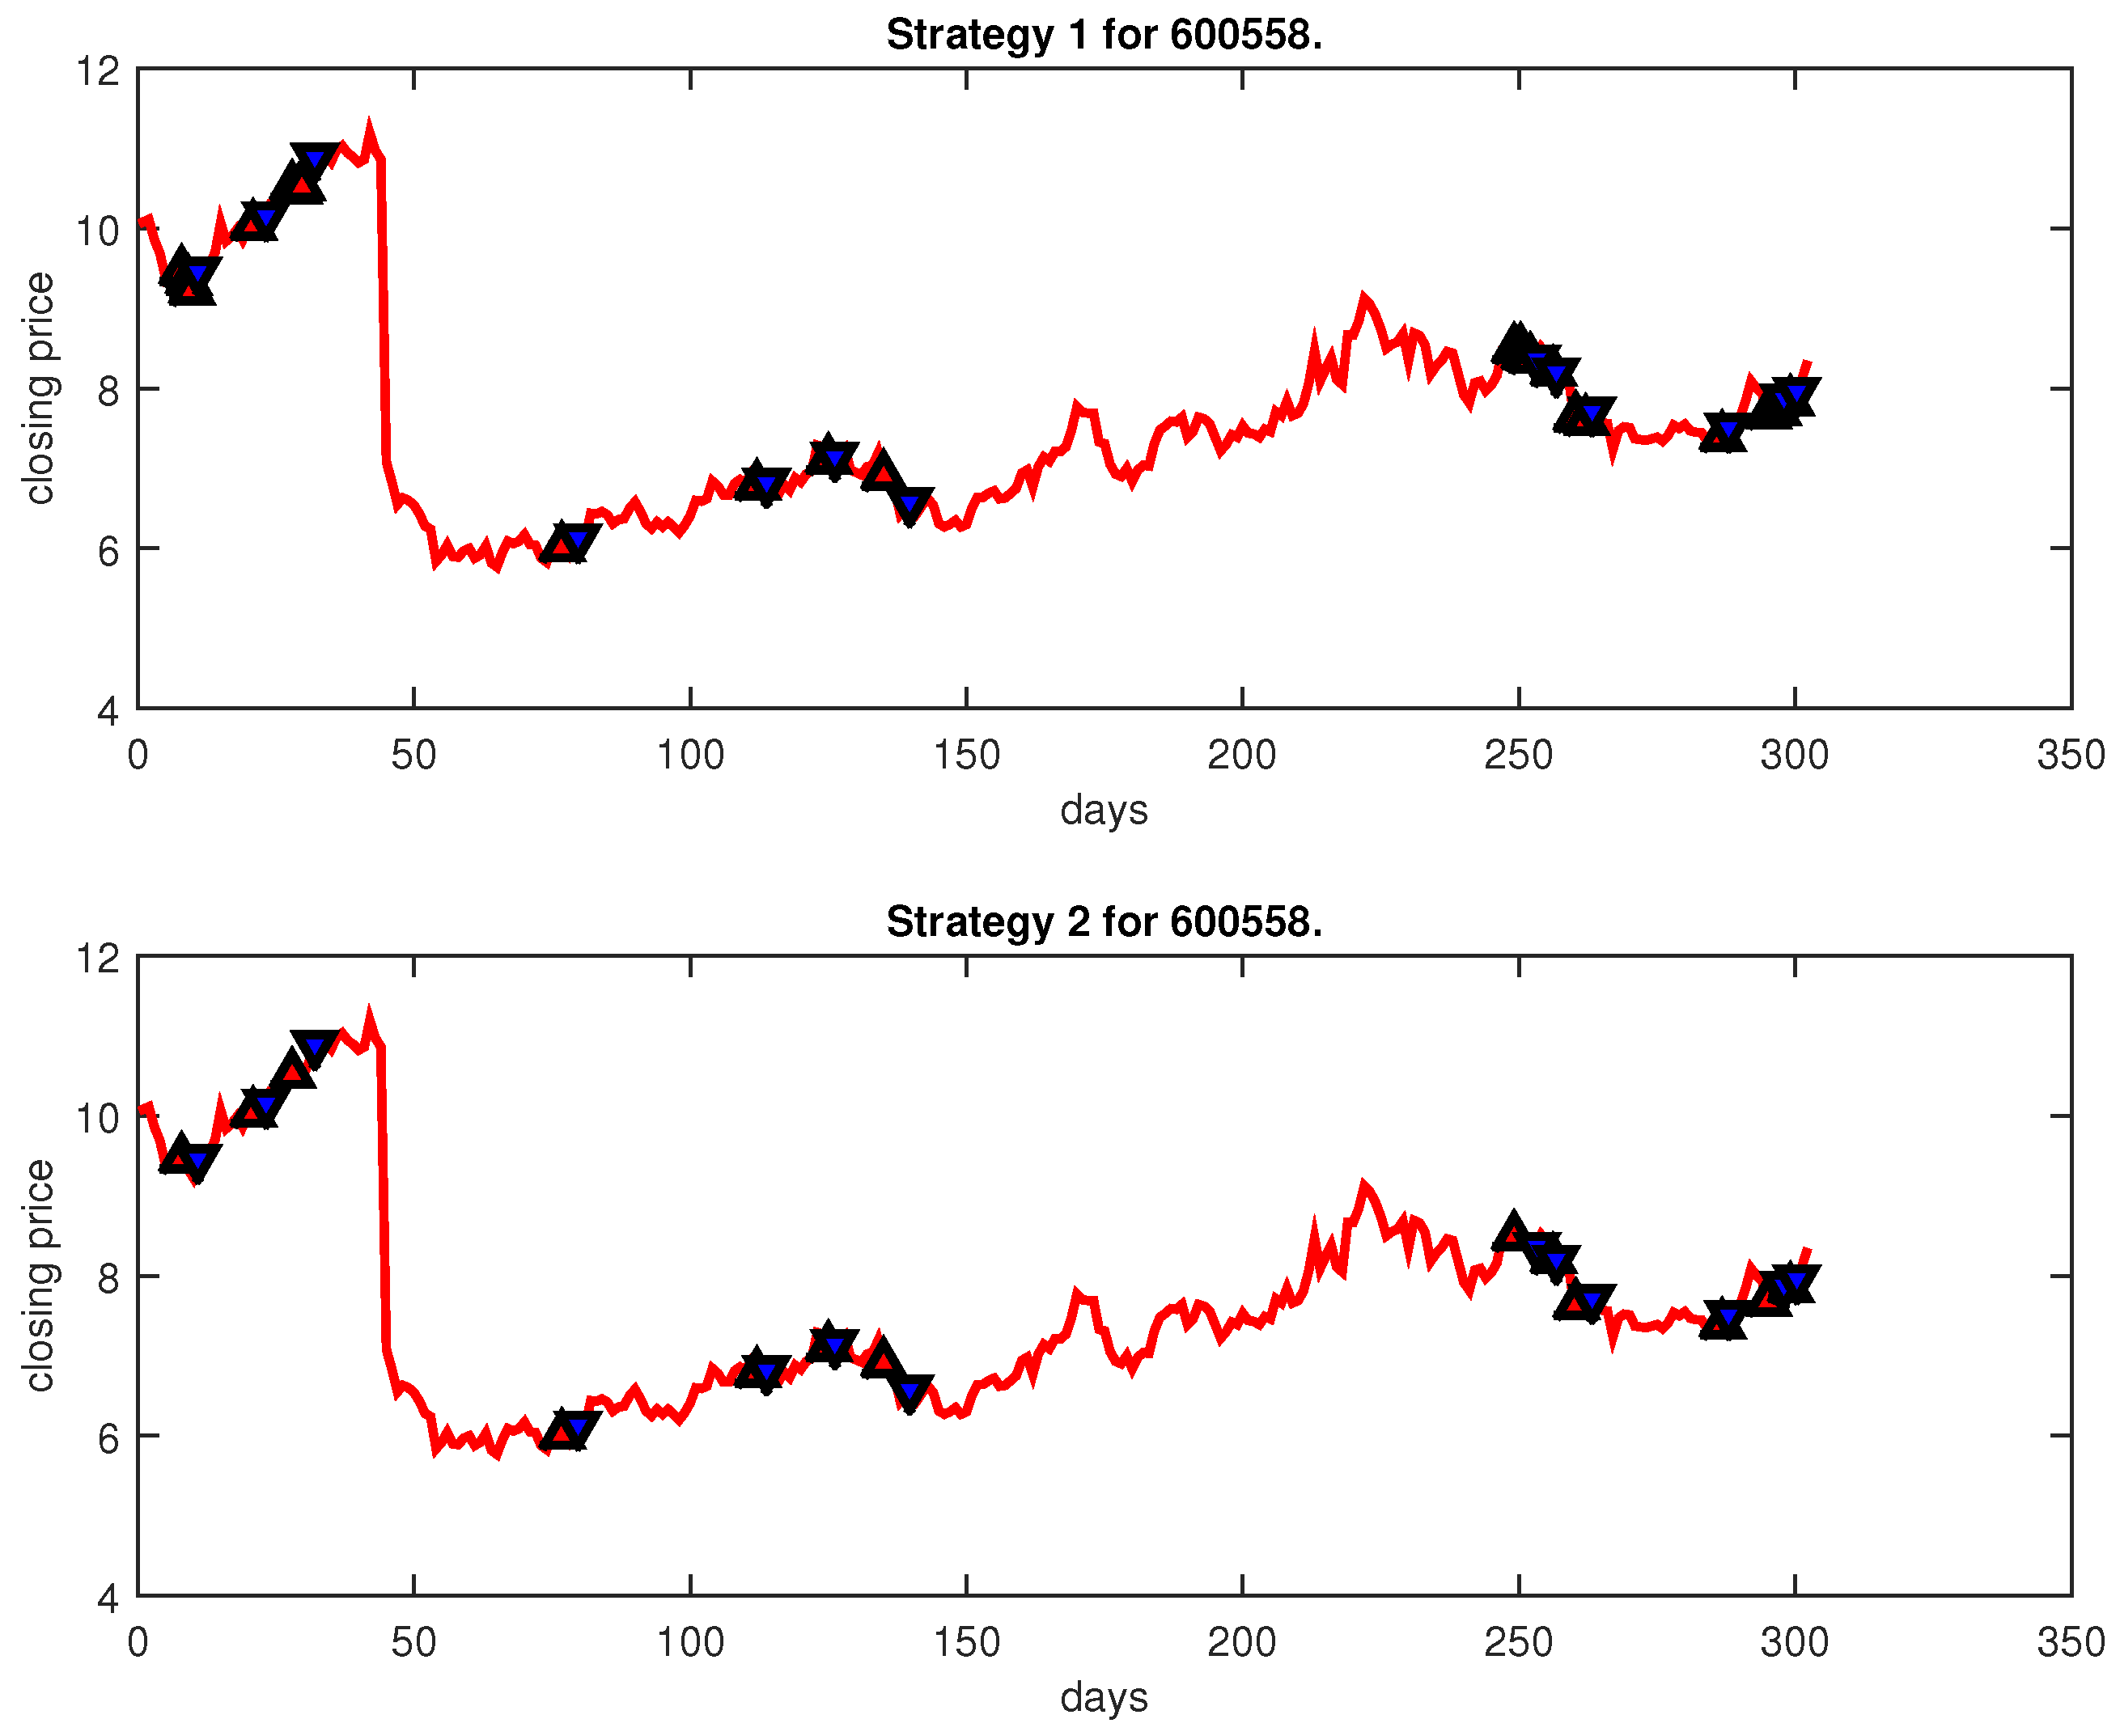
| 600558 | IPSO-FW-WSVM | 22 | 13 | 10,000 | 13 | 13 | ||||
| PLR-ANN | 33,107.92 | 102 | 8 | 10,000 | 9 | 8 | ||||
| 600609 | IPSO-FW-WSVM | 13 | 7 | 10,000 | 7 | 7 | ||||
| PLR-ANN | 14,745.39 | 67 | 4 | 10,000 | 4 | 4 | ||||
| 600875 | IPSO-FW-WSVM | 30 | 15 | 10,000 | 15 | 15 | ||||
| PLR-ANN | 42,984.28 | 98 | 10 | 10,000 | 10 | 10 | ||||
| 601600 | IPSO-FW-WSVM | 53 | 13 | 10,000 | 13 | 13 | ||||
| PLR-ANN | 11,981.77 | 143 | 11 | 10,000 | 11 | 11 | ||||
| 000650 | IPSO-FW-WSVM | 24 | 18 | 10,000 | 19 | 18 | ||||
| PLR-ANN | 33,281.13 | 87 | 3 | 10,000 | 3 | 3 | ||||
| 002039 | IPSO-FW-WSVM | 42 | 18 | 10,000 | 18 | 18 | ||||
| PLR-ANN | 25,229.79 | 69 | 9 | 10,000 | 9 | 9 | ||||
| 002061 | IPSO-FW-WSVM | 12 | 8 | 10,000 | 8 | 8 | ||||
| PLR-ANN | 23,466.05 | 87 | 5 | 10,000 | 6 | 5 | ||||
| 002140 | IPSO-FW-WSVM | 12,493.64 | 38 | 16 | 10,000 | 16 | 16 | |||
| PLR-ANN | 104,549.51 | 127 | 10 | 10,000 | 10 | 10 | ||||
| Average | IPSO-FW-WSVM | 10,000 | ||||||||
| PLR-ANN | 36,799.57 | 10,000 | ||||||||
Disclaimer/Publisher’s Note: The statements, opinions and data contained in all publications are solely those of the individual author(s) and contributor(s) and not of MDPI and/or the editor(s). MDPI and/or the editor(s) disclaim responsibility for any injury to people or property resulting from any ideas, methods, instructions or products referred to in the content. |
© 2023 by the authors. Licensee MDPI, Basel, Switzerland. This article is an open access article distributed under the terms and conditions of the Creative Commons Attribution (CC BY) license (https://creativecommons.org/licenses/by/4.0/).
Share and Cite
Chen, Y.; Zhu, Z. An IPSO-FW-WSVM Method for Stock Trading Signal Forecasting. Entropy 2023, 25, 279. https://doi.org/10.3390/e25020279
Chen Y, Zhu Z. An IPSO-FW-WSVM Method for Stock Trading Signal Forecasting. Entropy. 2023; 25(2):279. https://doi.org/10.3390/e25020279
Chicago/Turabian StyleChen, Yingjun, and Zhigang Zhu. 2023. "An IPSO-FW-WSVM Method for Stock Trading Signal Forecasting" Entropy 25, no. 2: 279. https://doi.org/10.3390/e25020279
APA StyleChen, Y., & Zhu, Z. (2023). An IPSO-FW-WSVM Method for Stock Trading Signal Forecasting. Entropy, 25(2), 279. https://doi.org/10.3390/e25020279