
Damage Detection of Regular Civil Buildings Using Modified Multi-Scale Symbolic Dynamic Entropy


Abstract
:1. Introduction
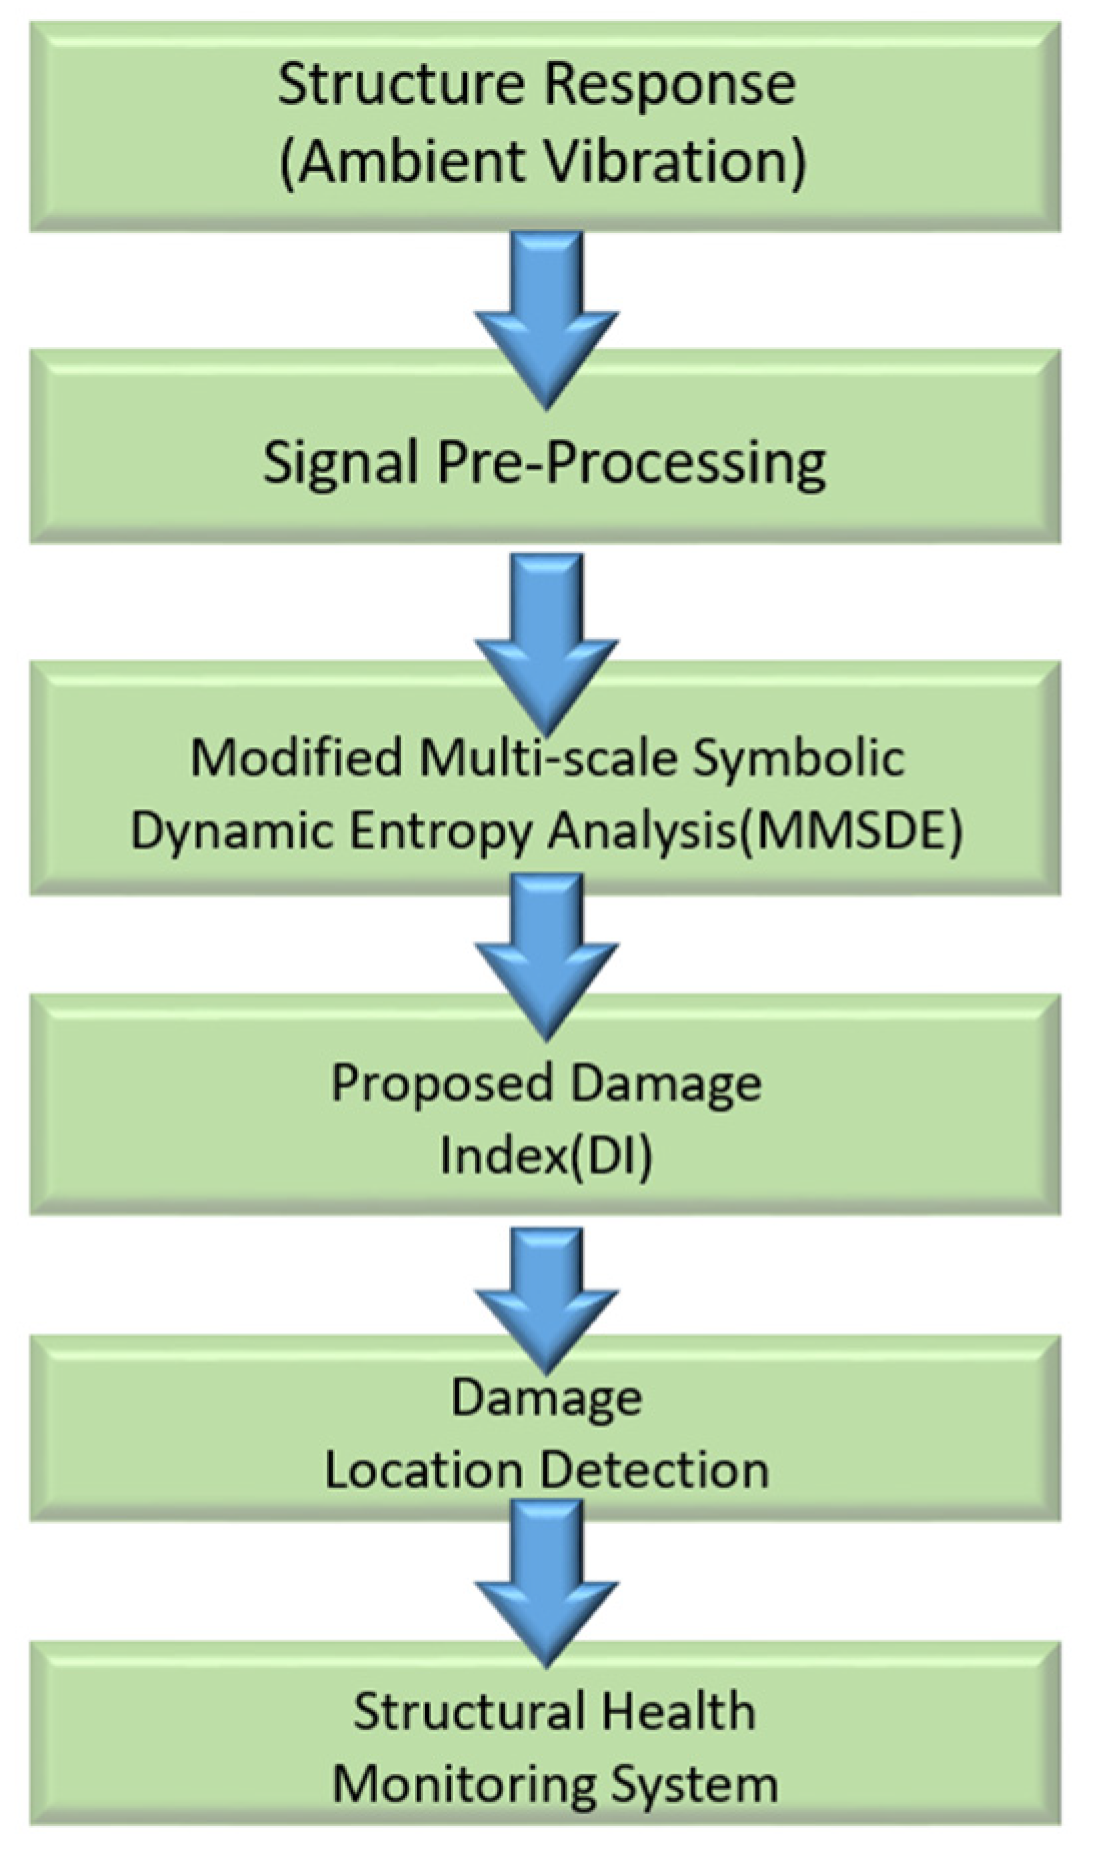
2. Methodology
2.1. Symbolic Dynamic Entropy (SDE)
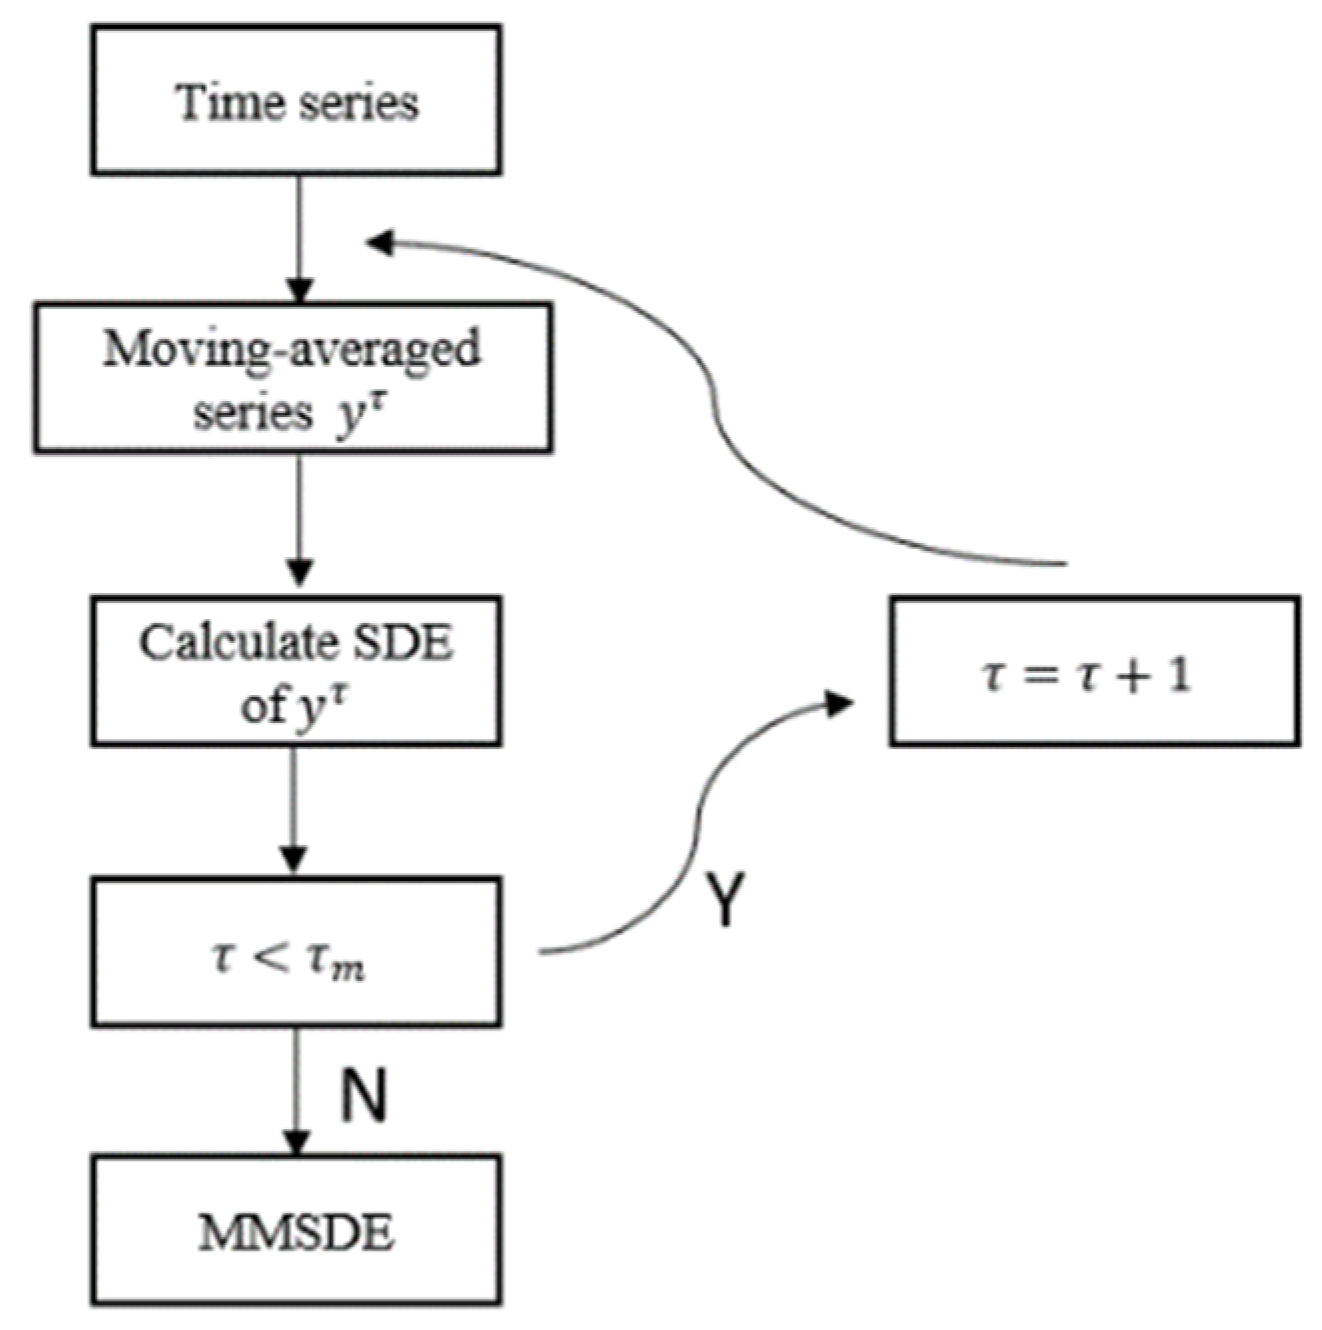
2.2. Modified Multi-Scale Symbolic Dynamic Entropy (MMSDE)
2.3. Damage Index
3. Numerical simulation
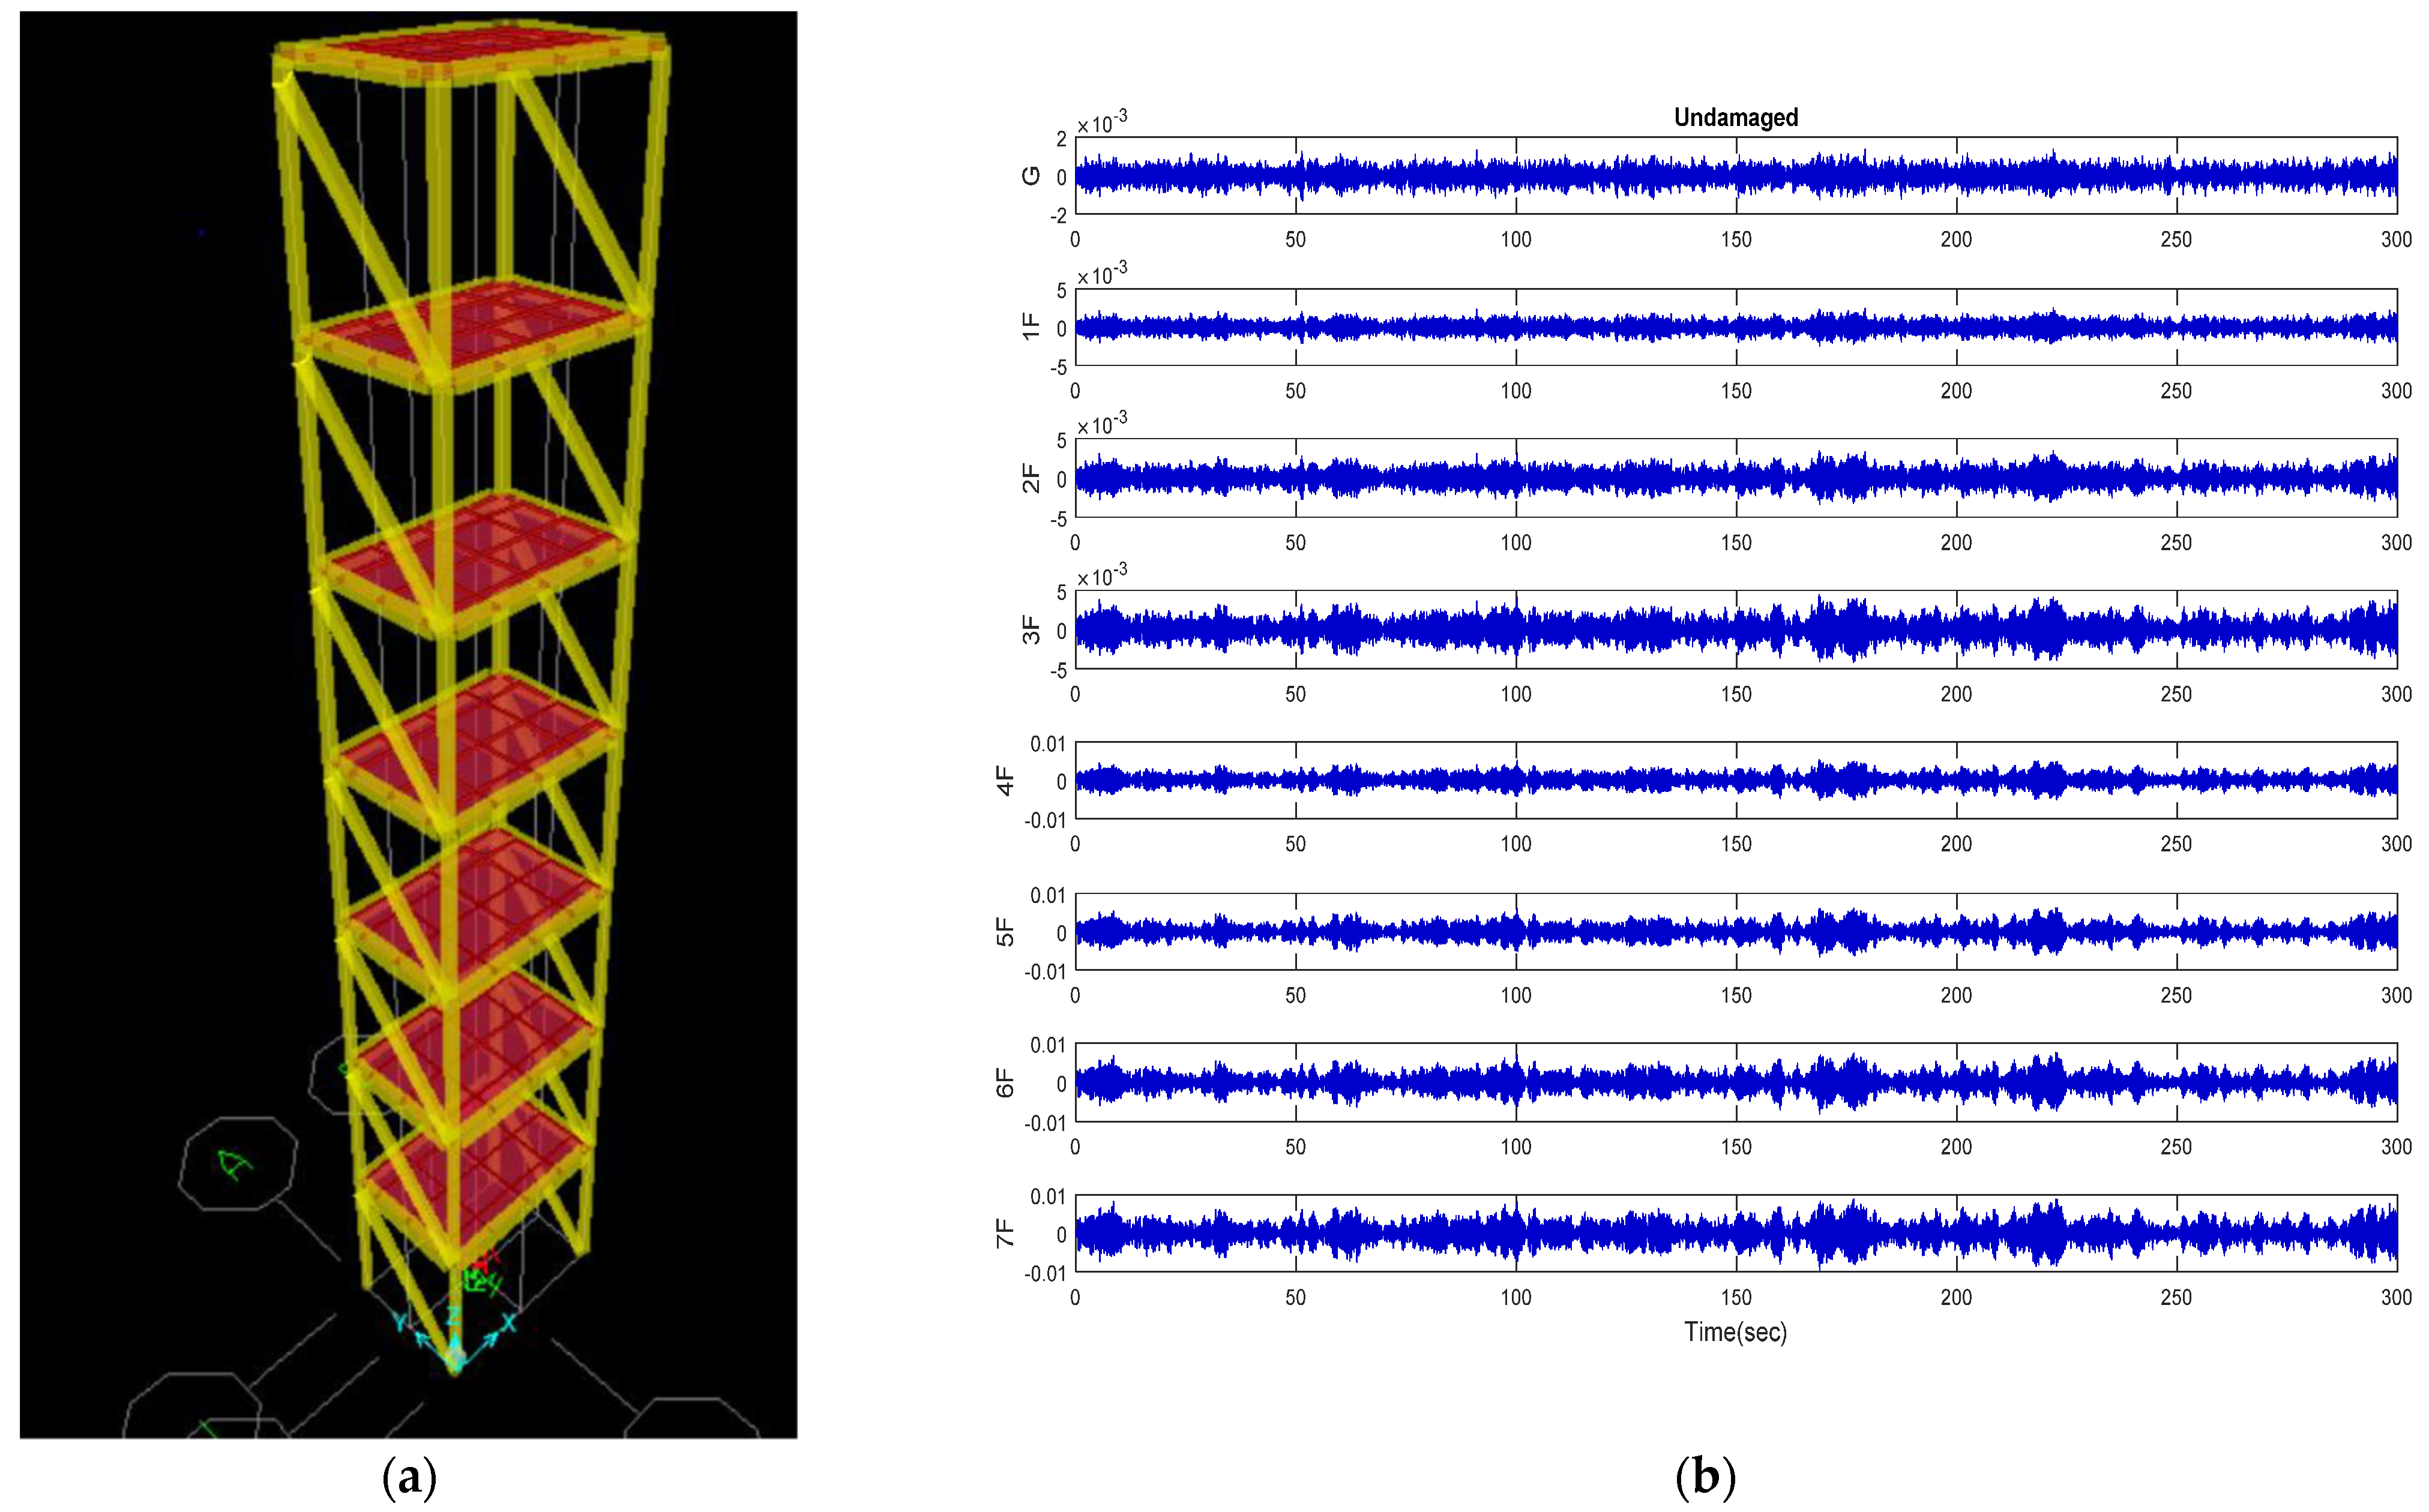
3.1. Database of Numerical Simulation
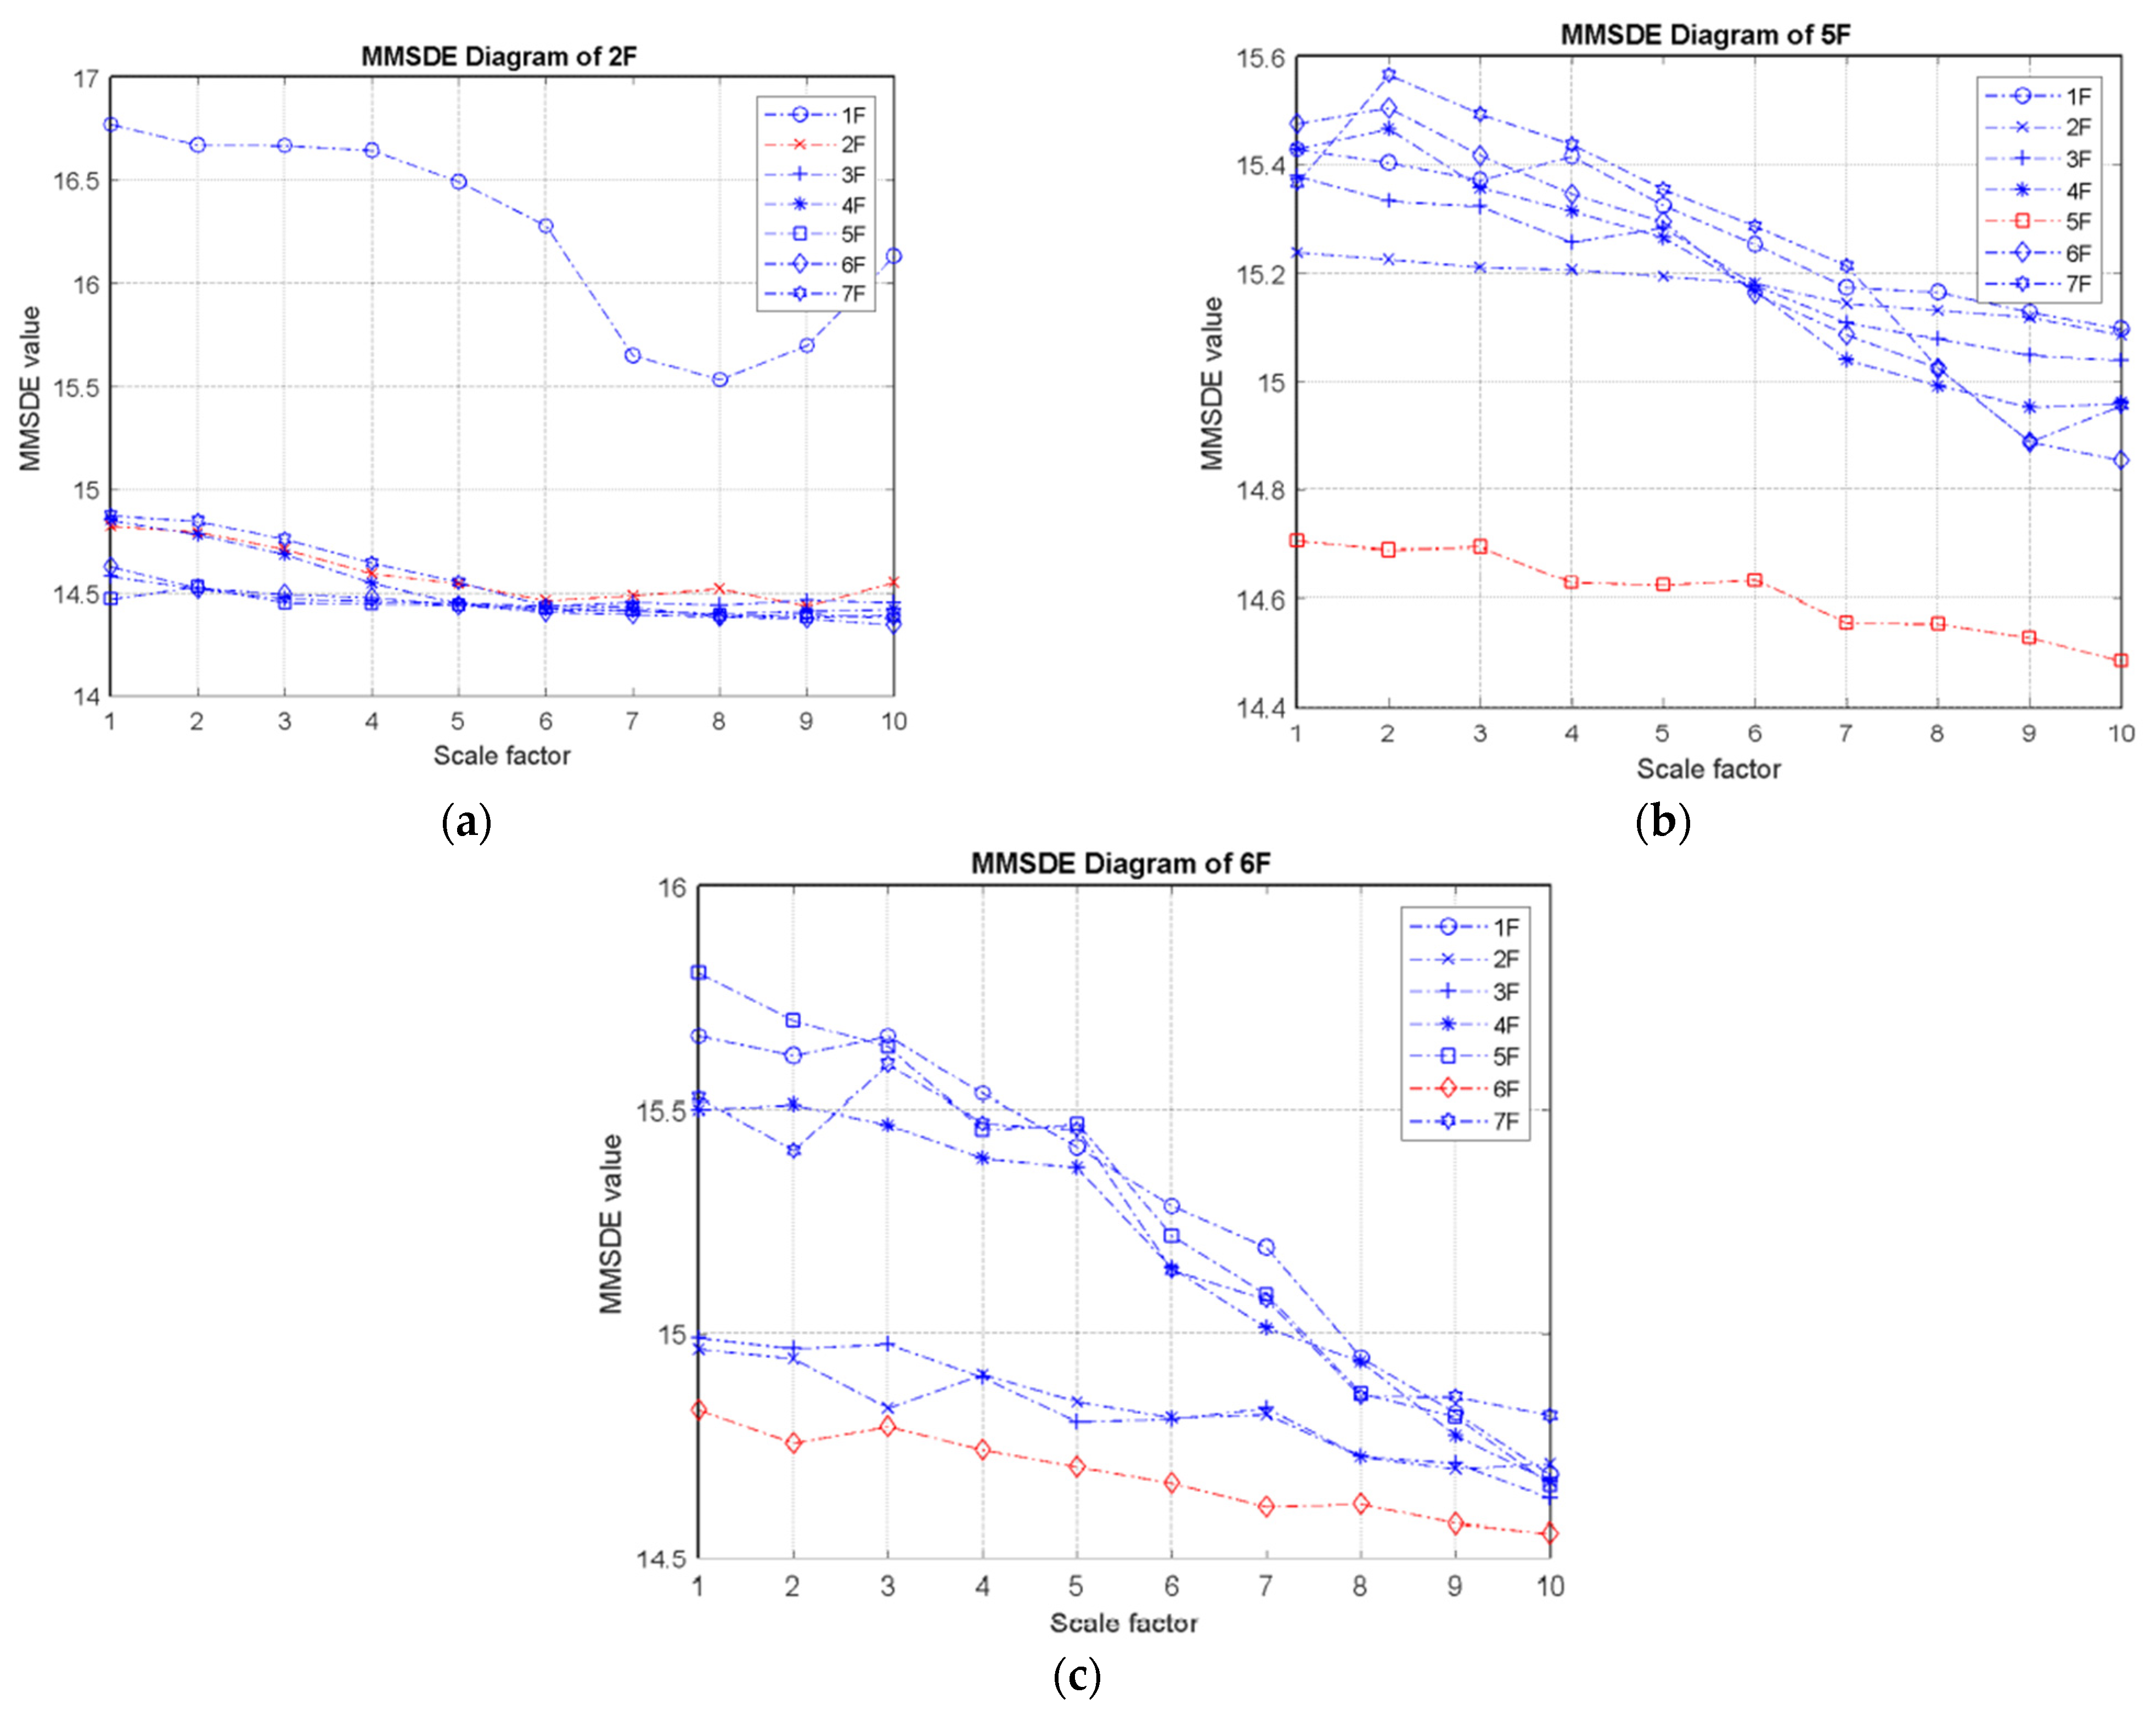
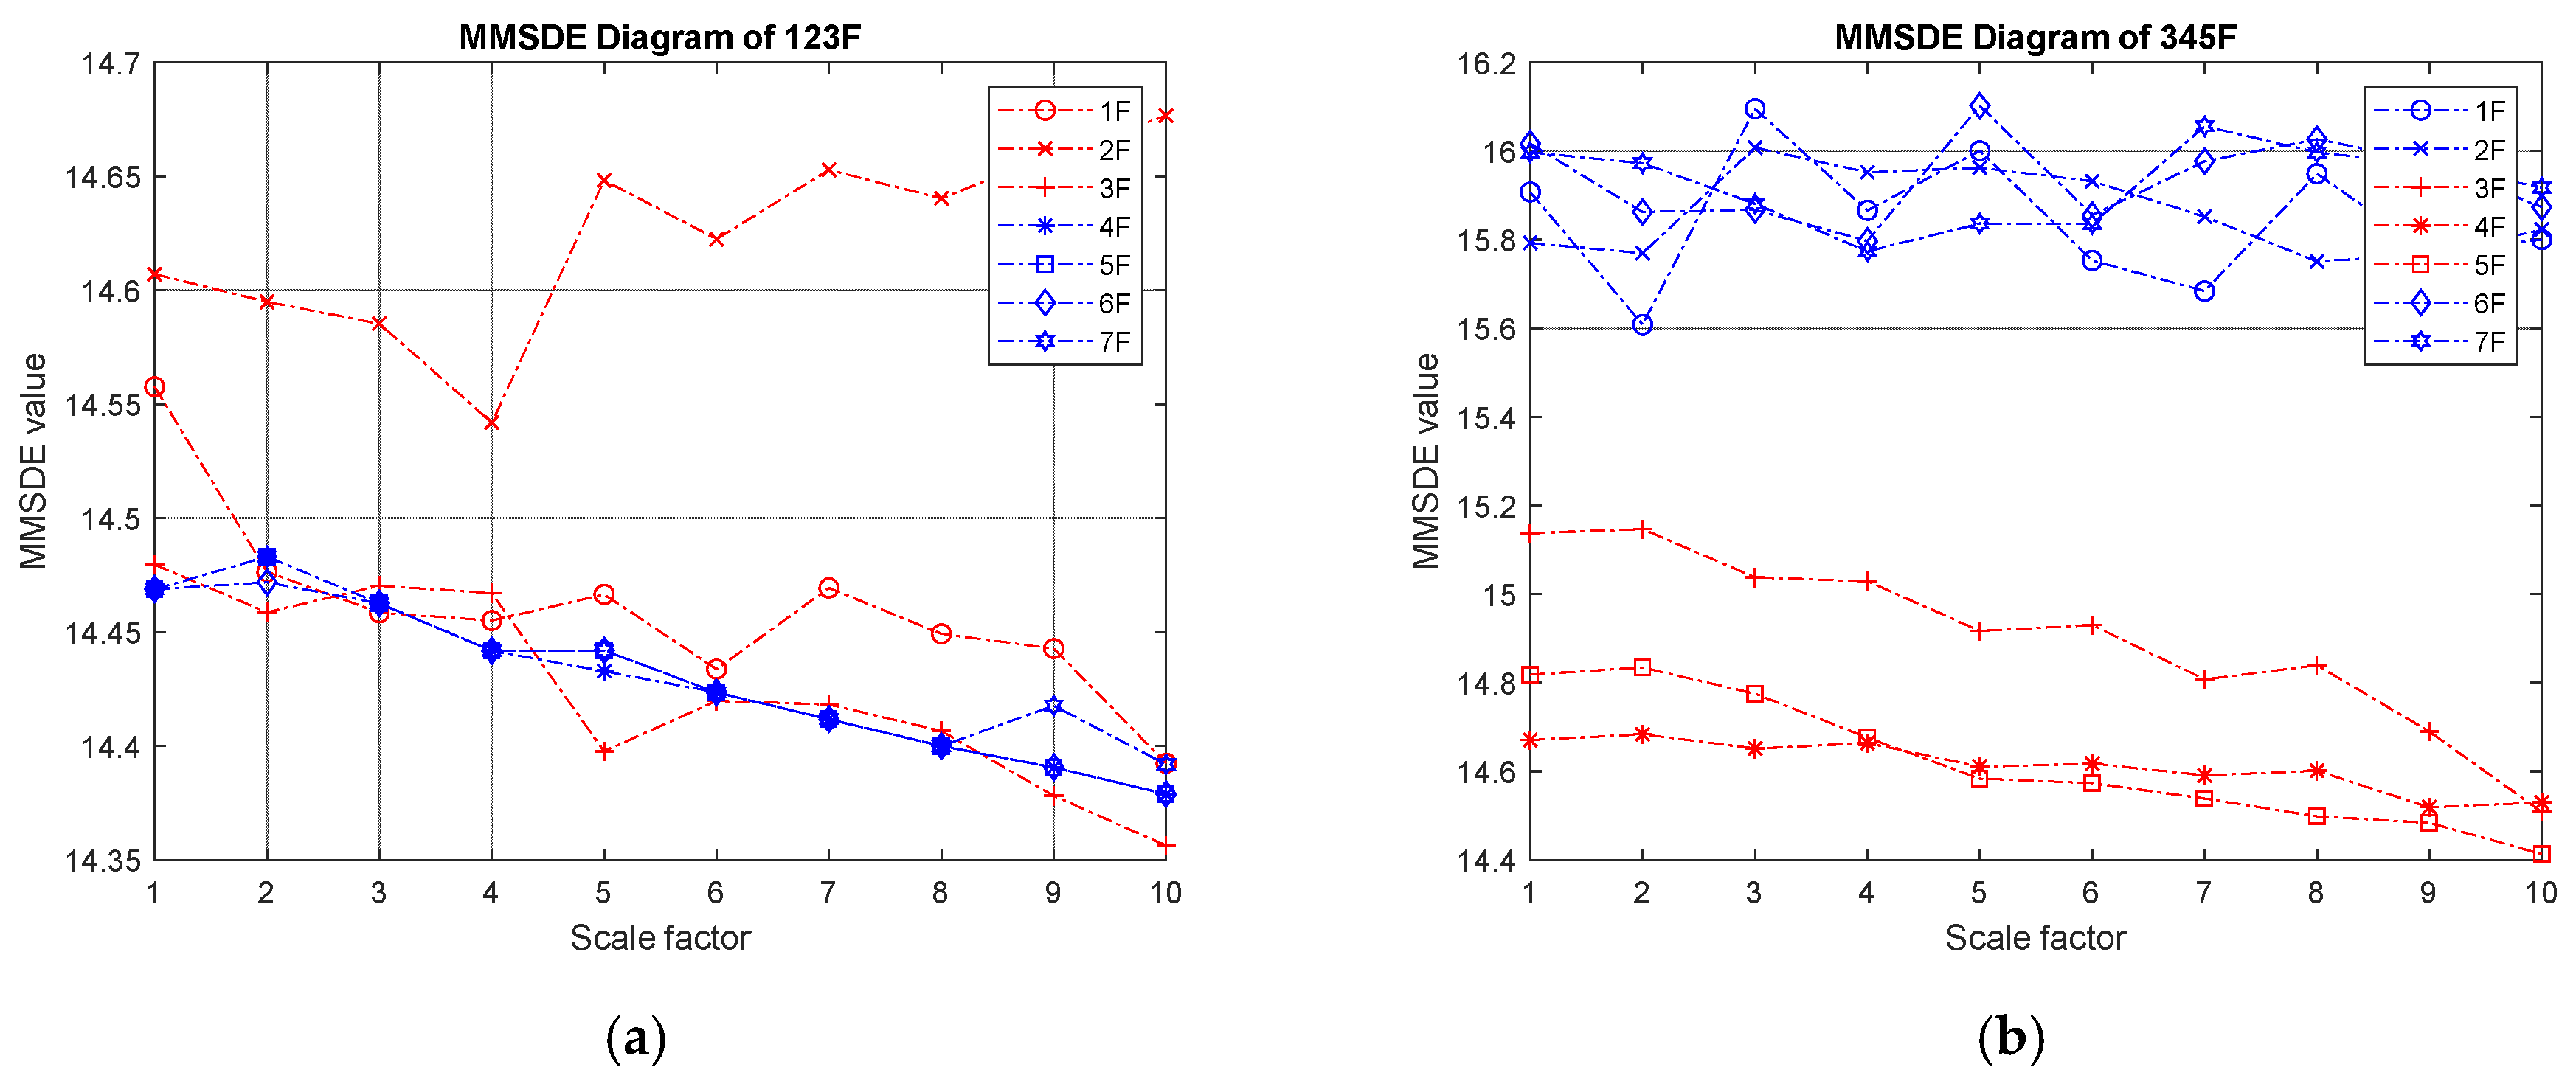
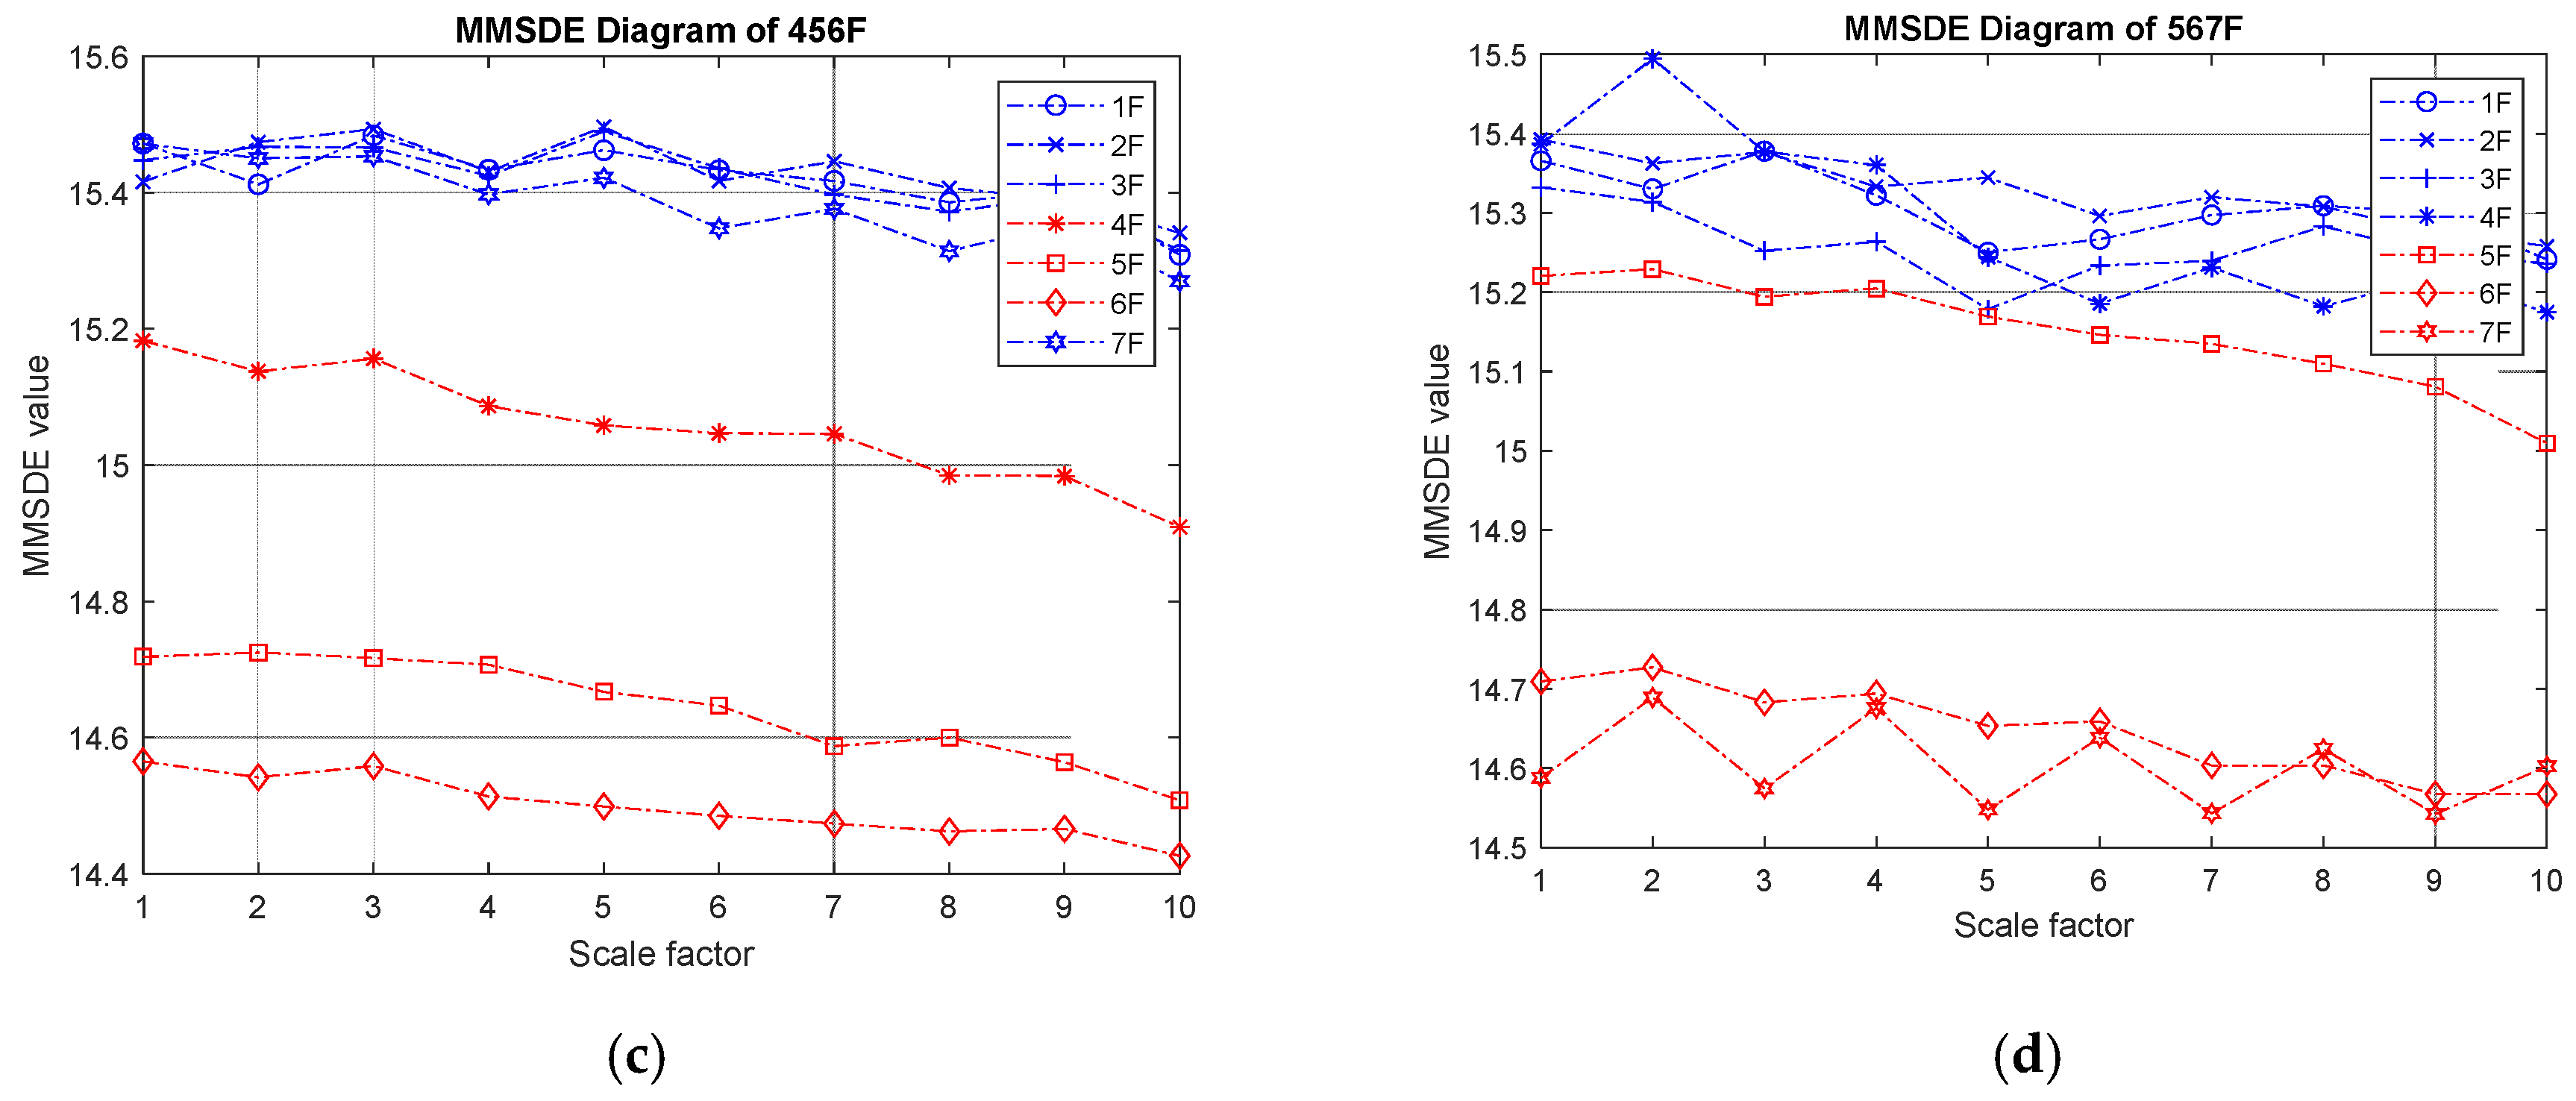
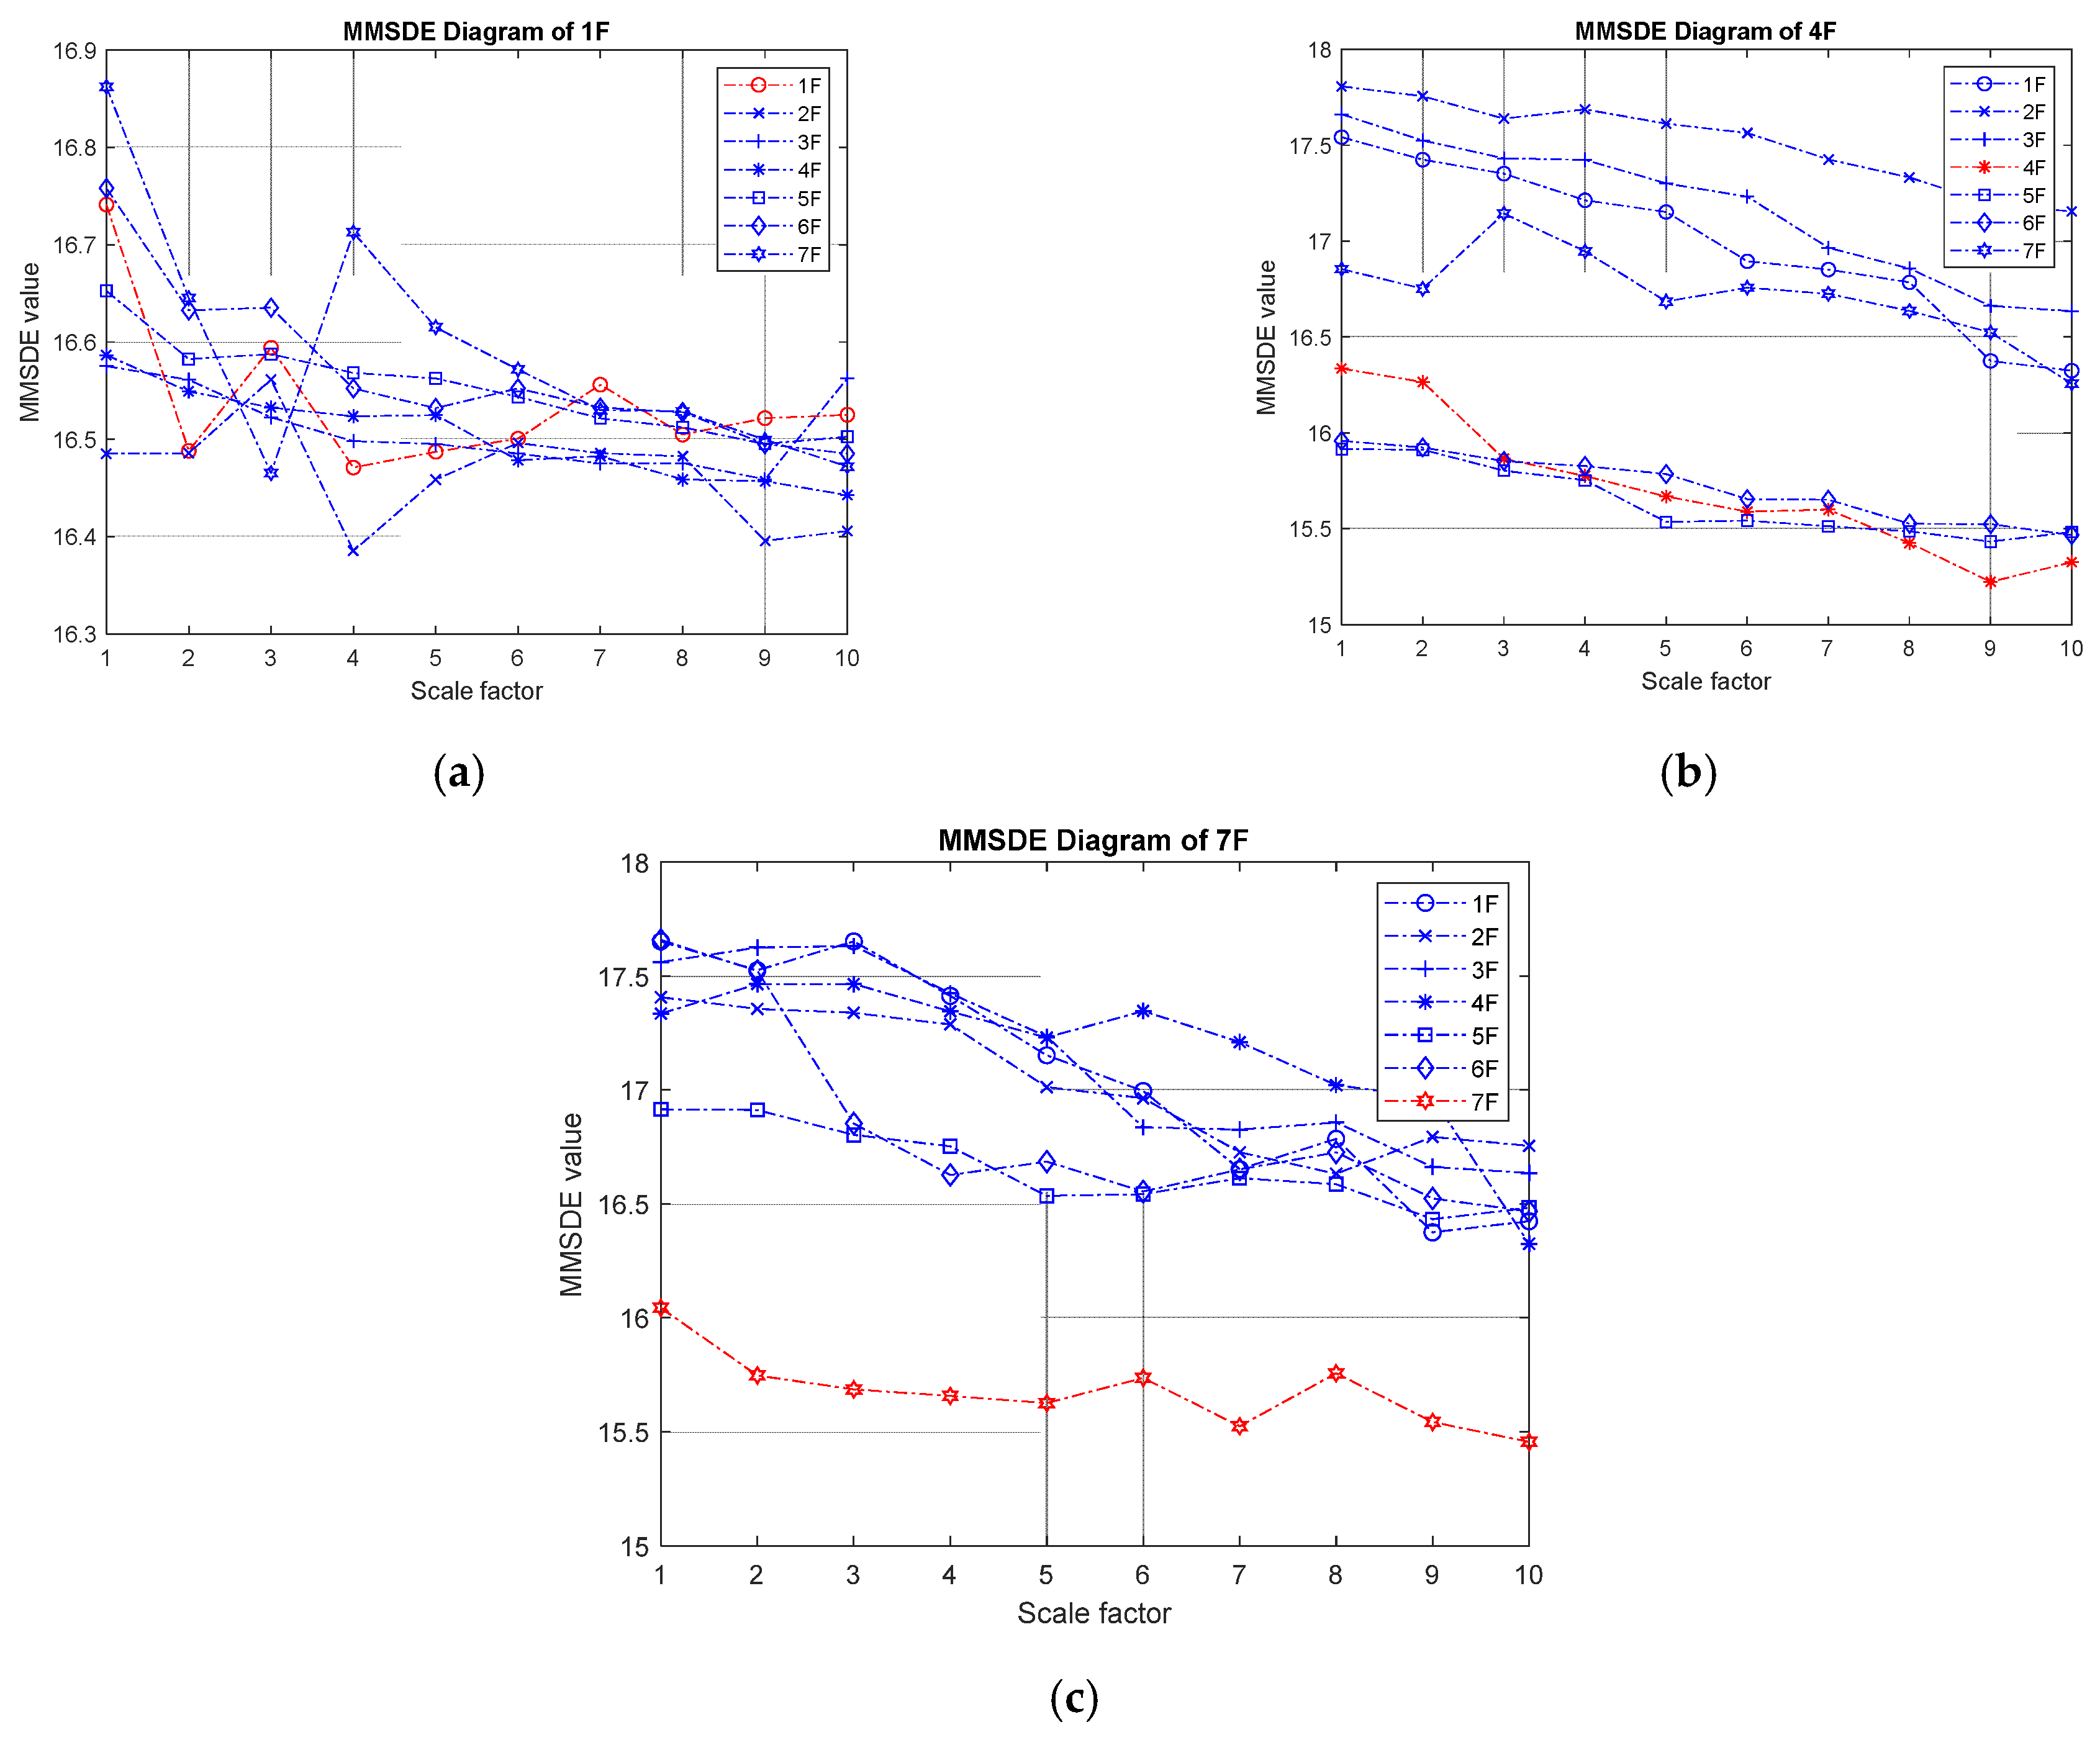
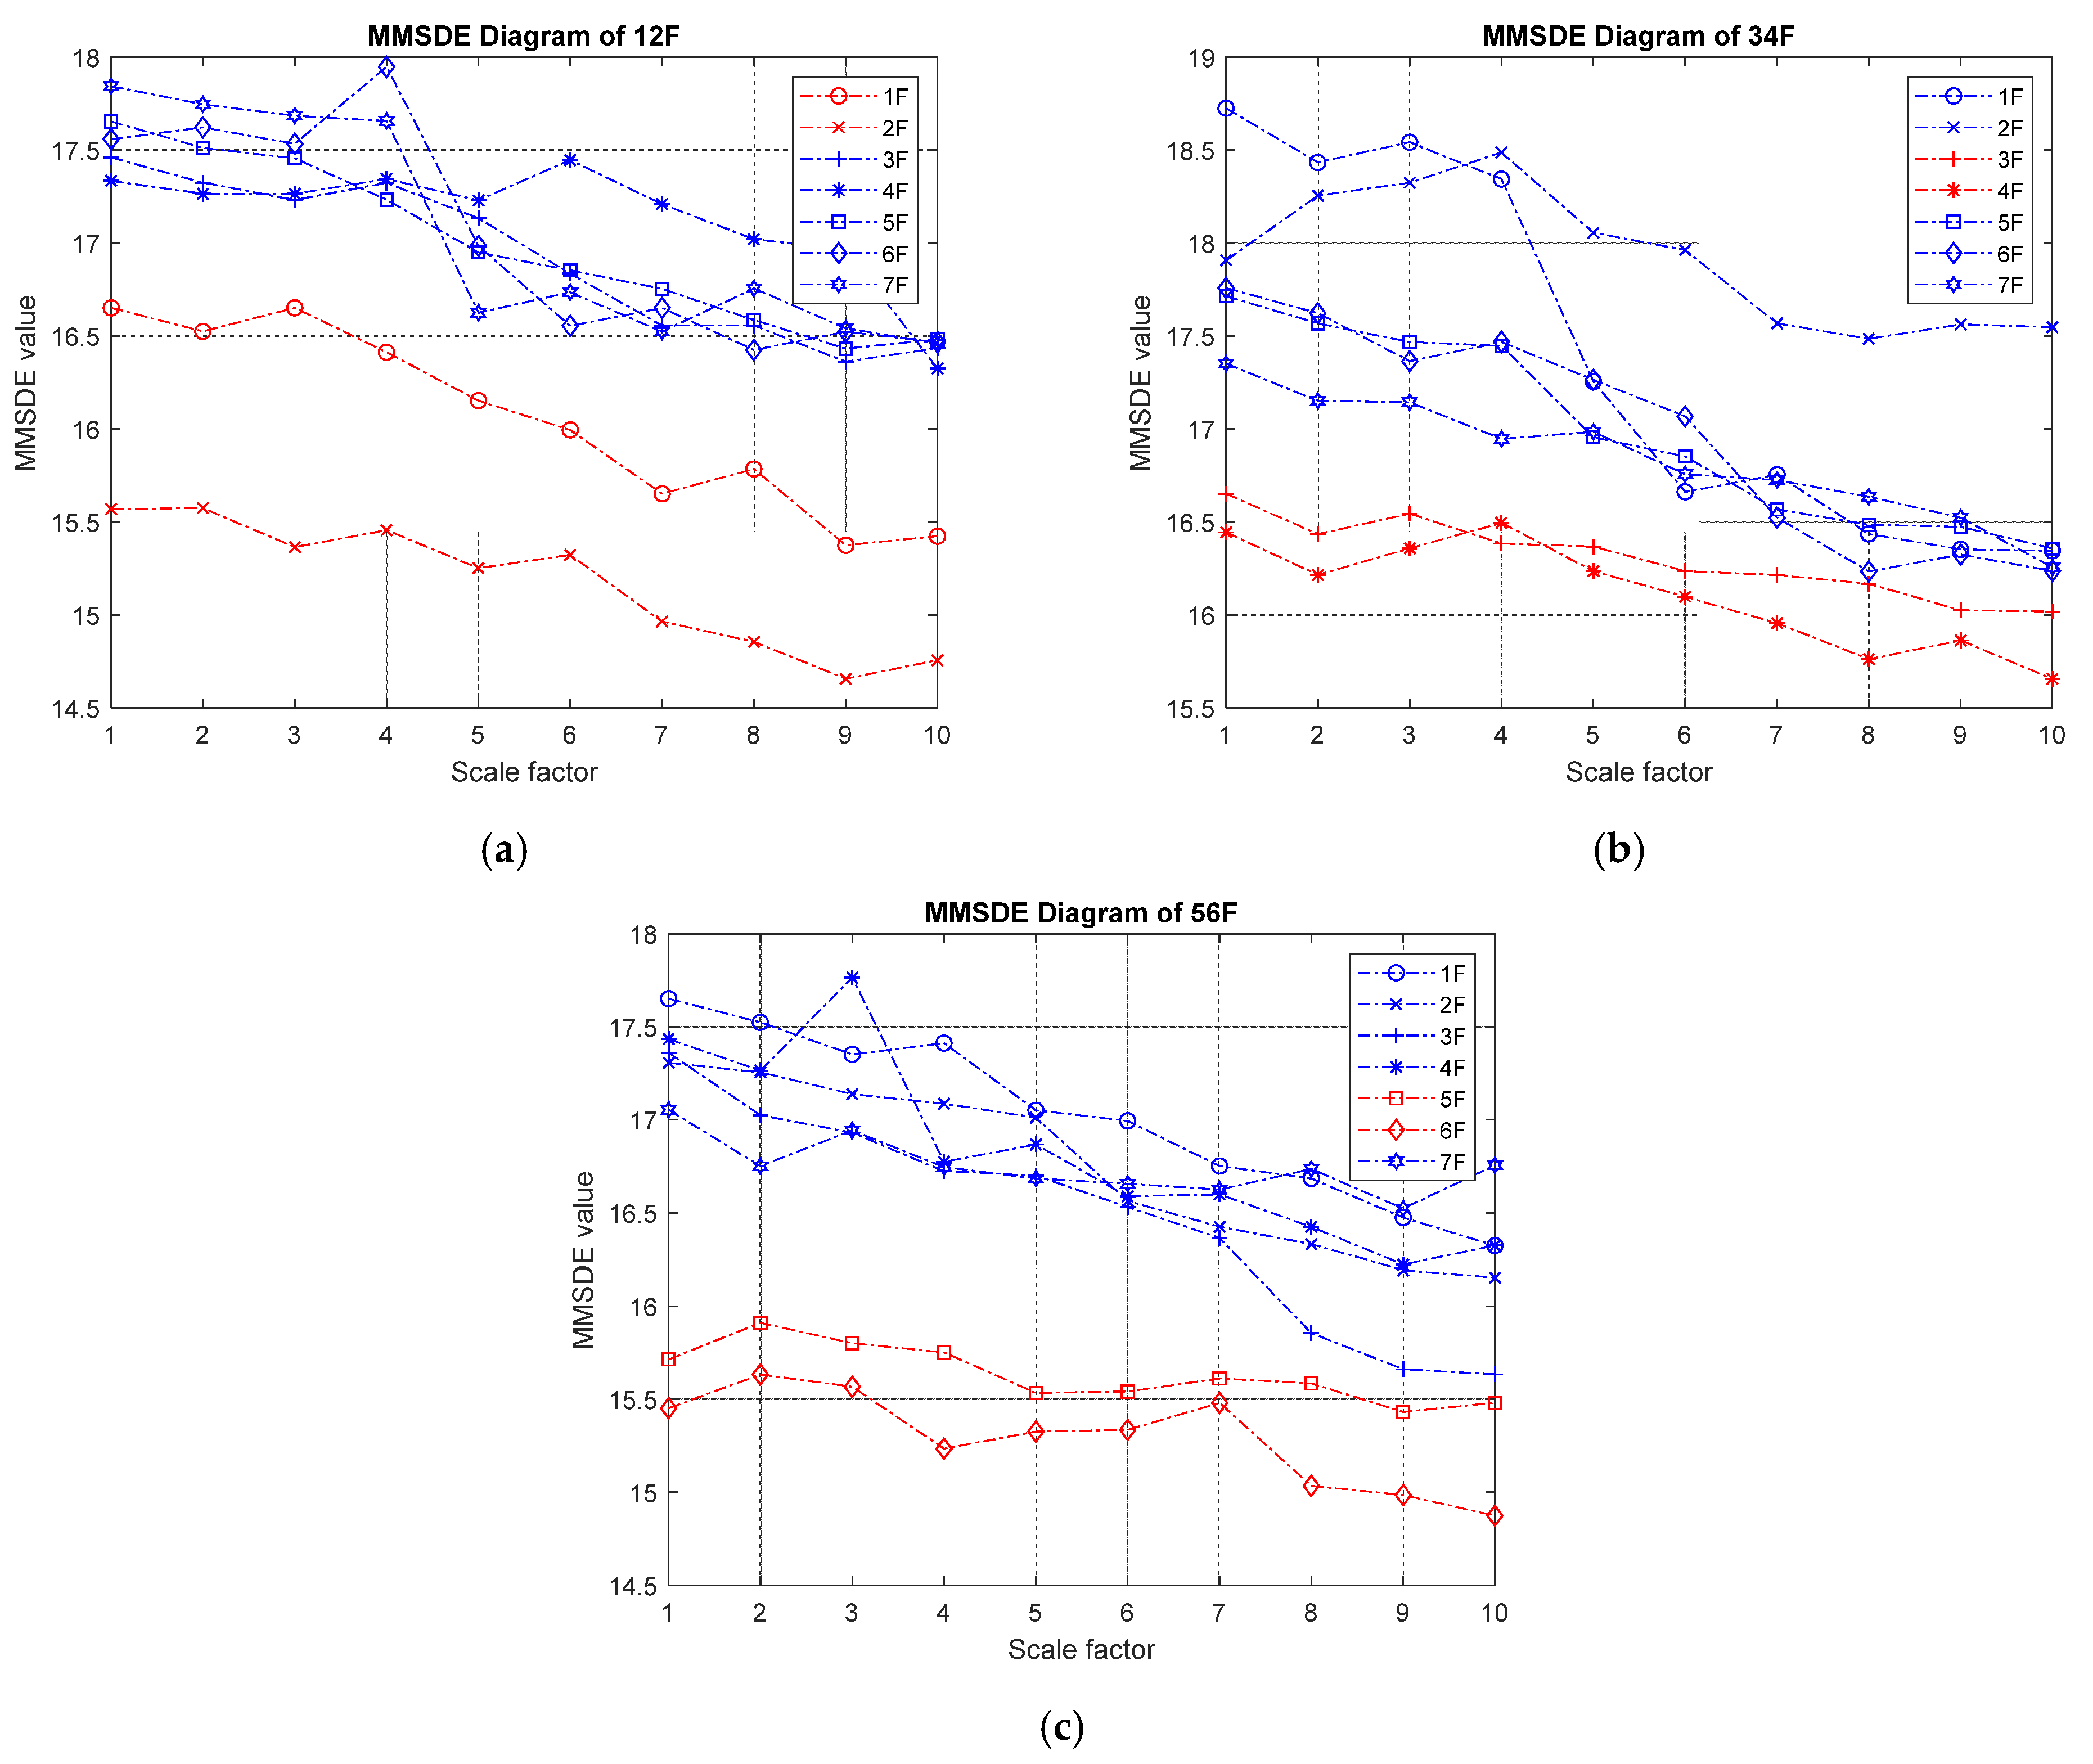
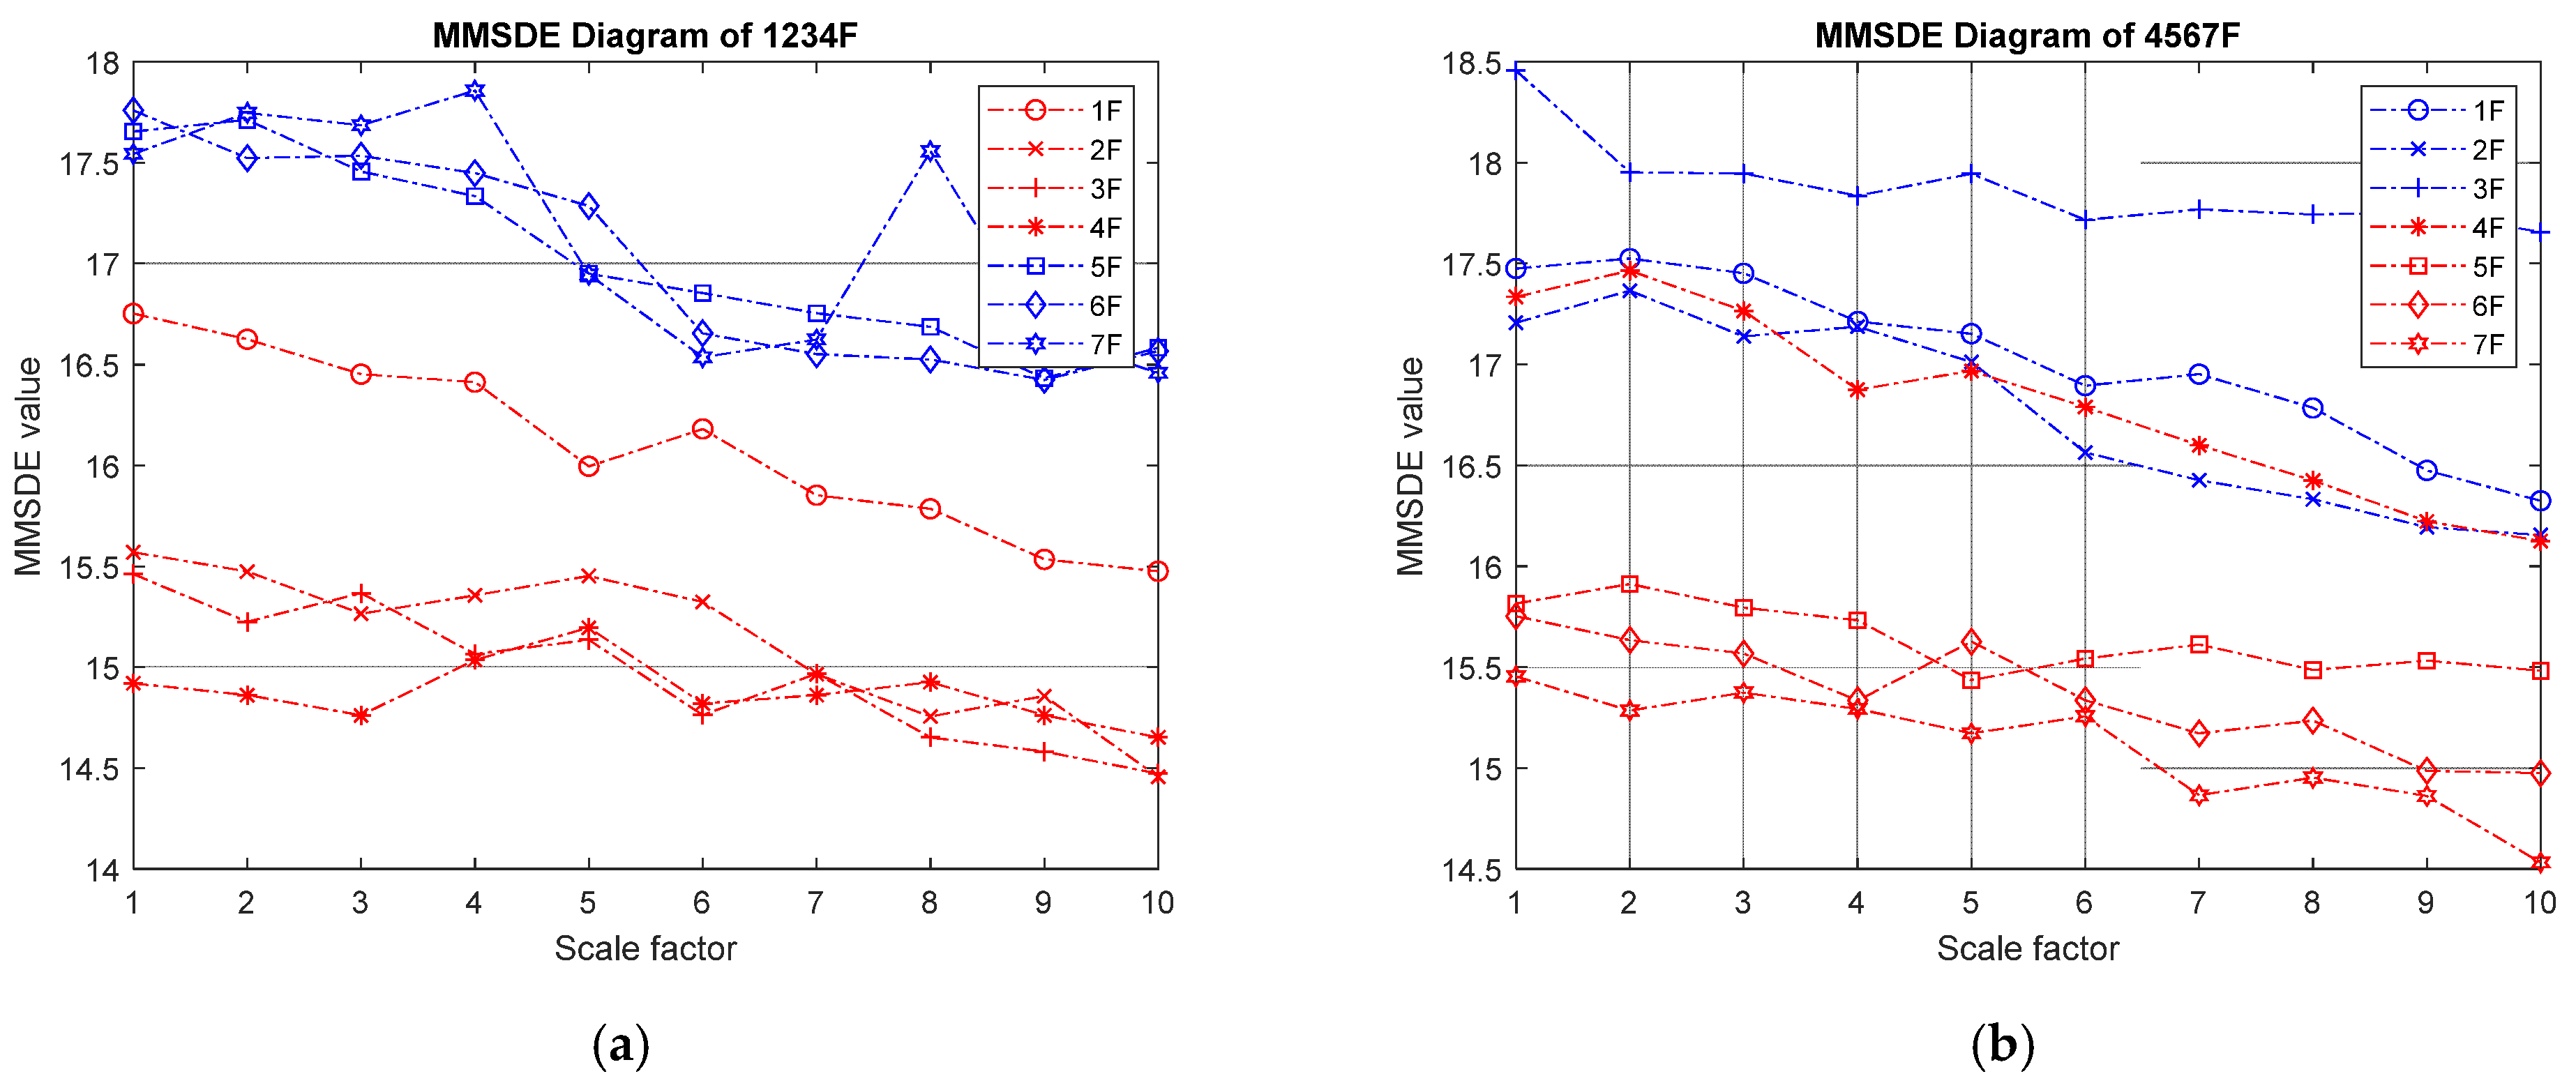
3.2. MMSDE of Numerical Simulation
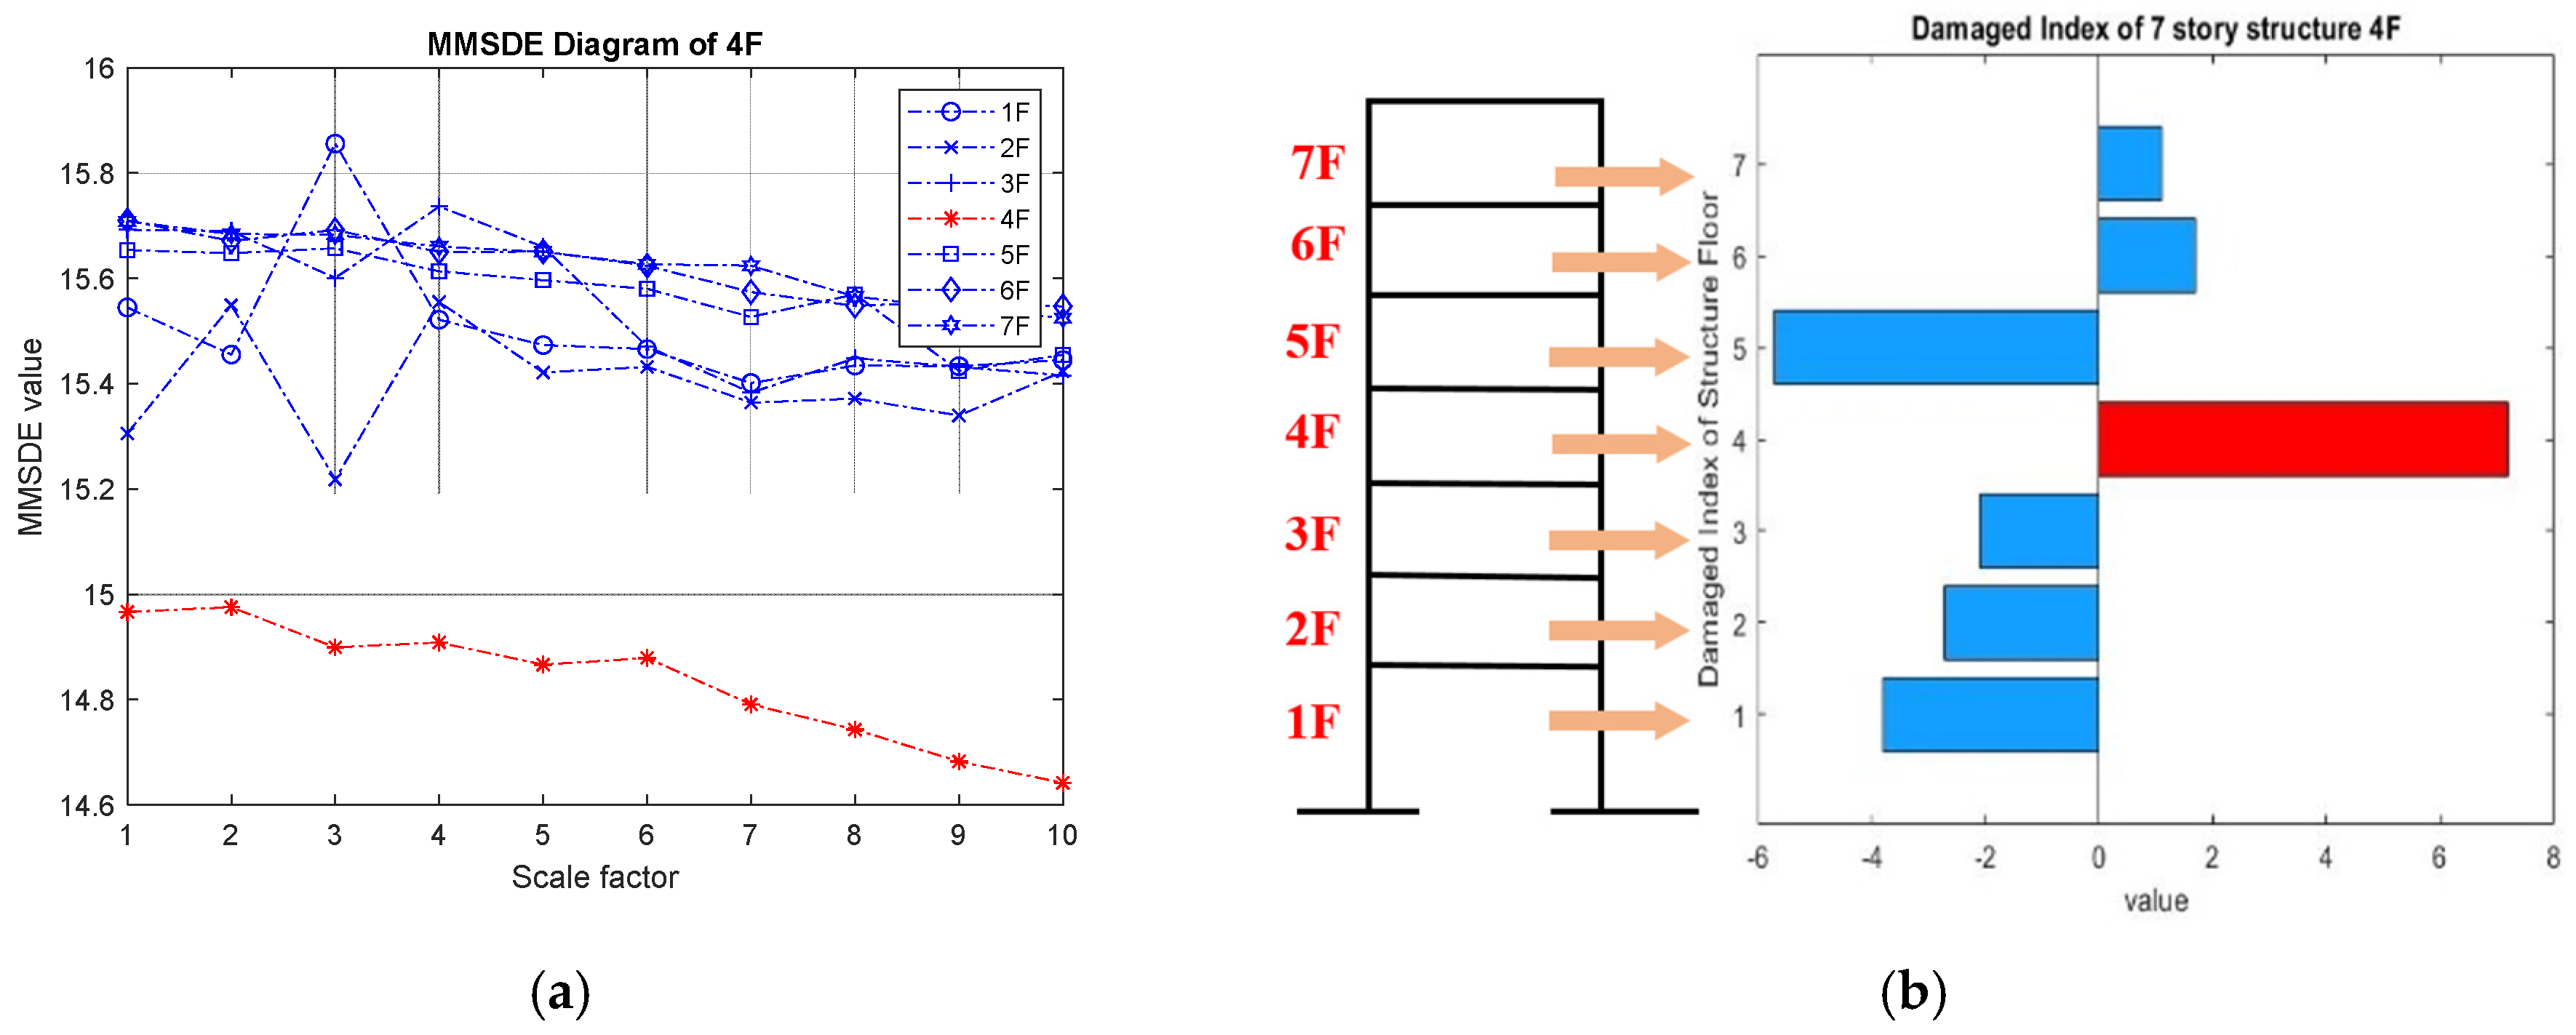
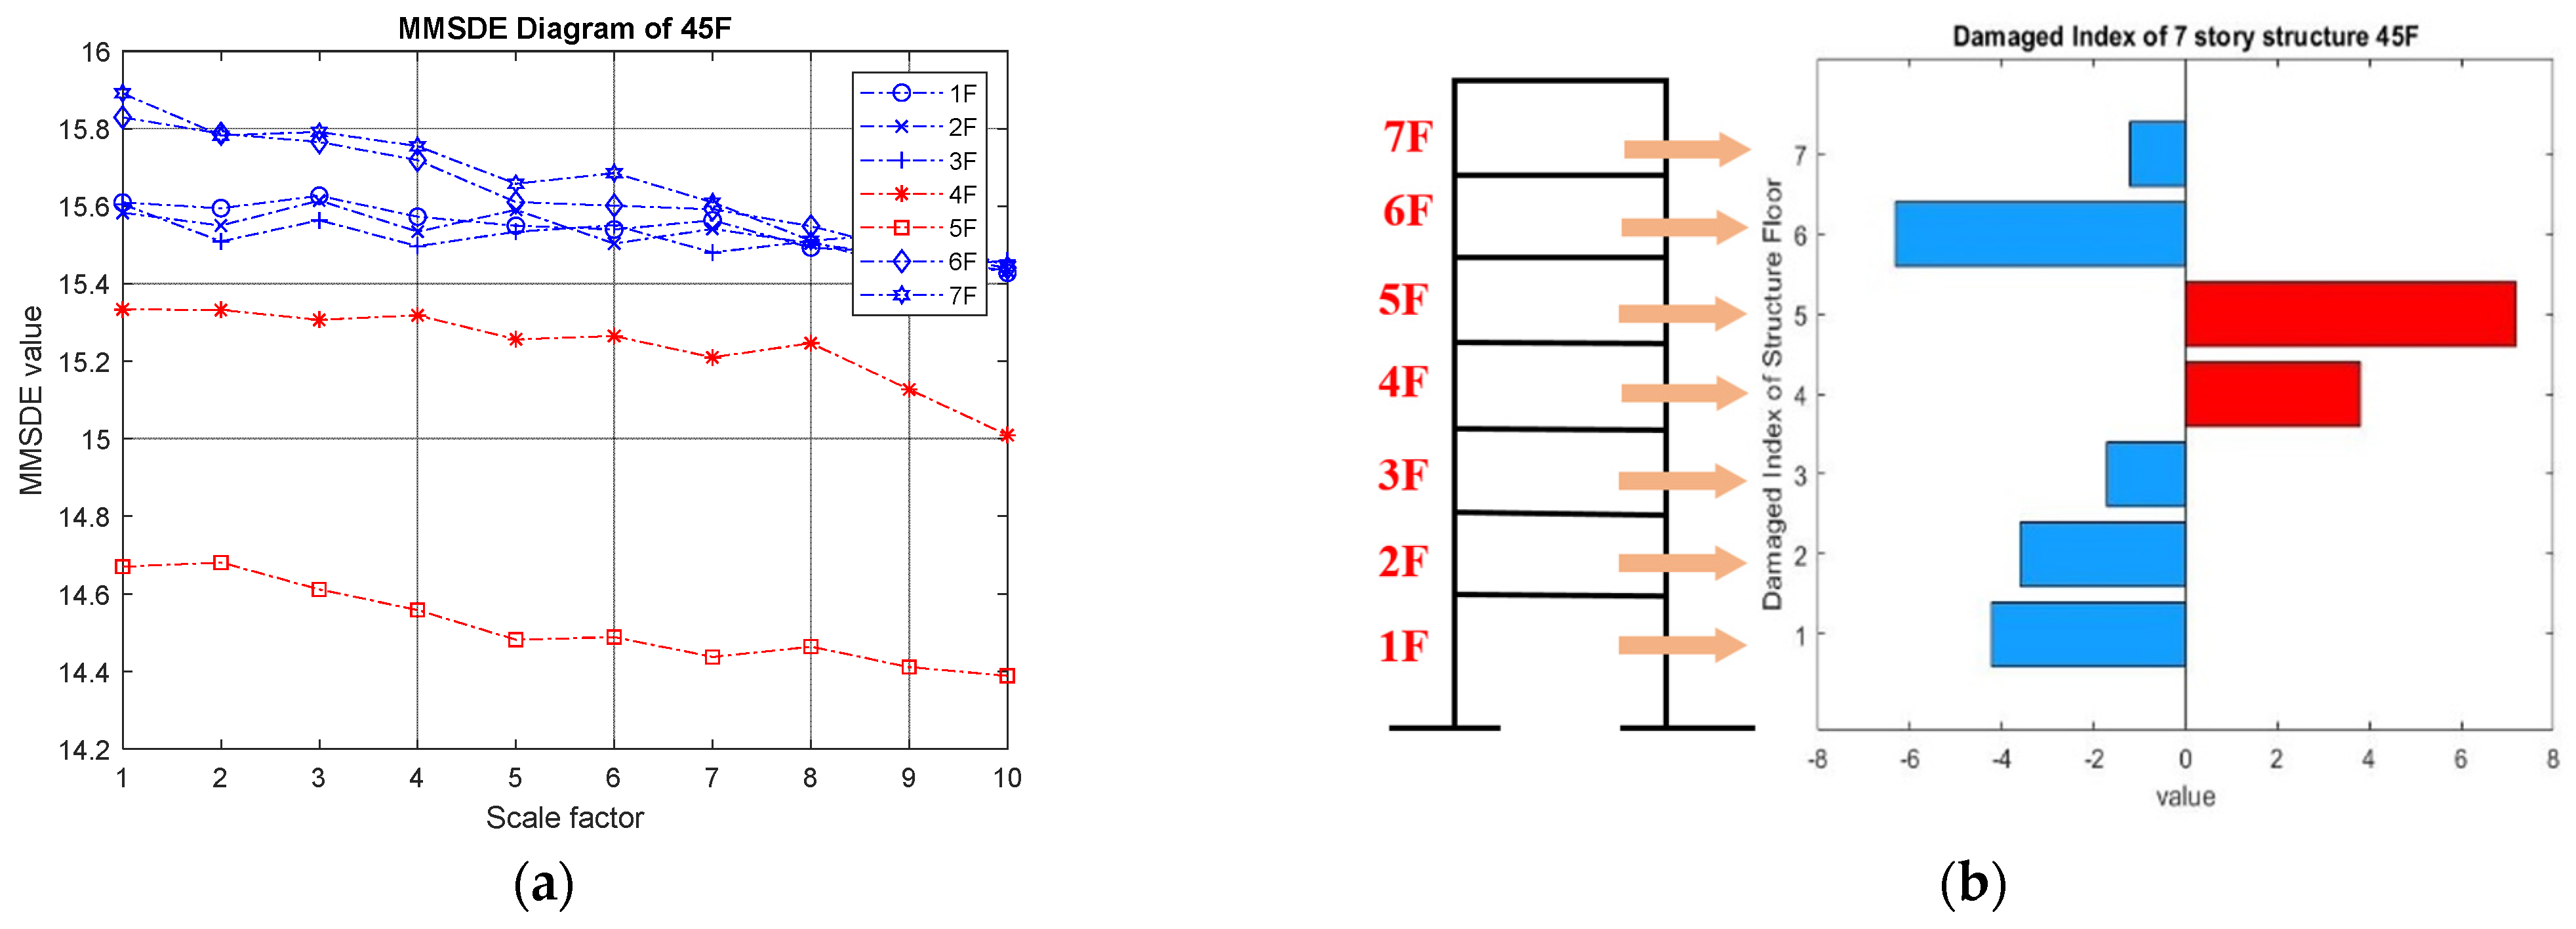
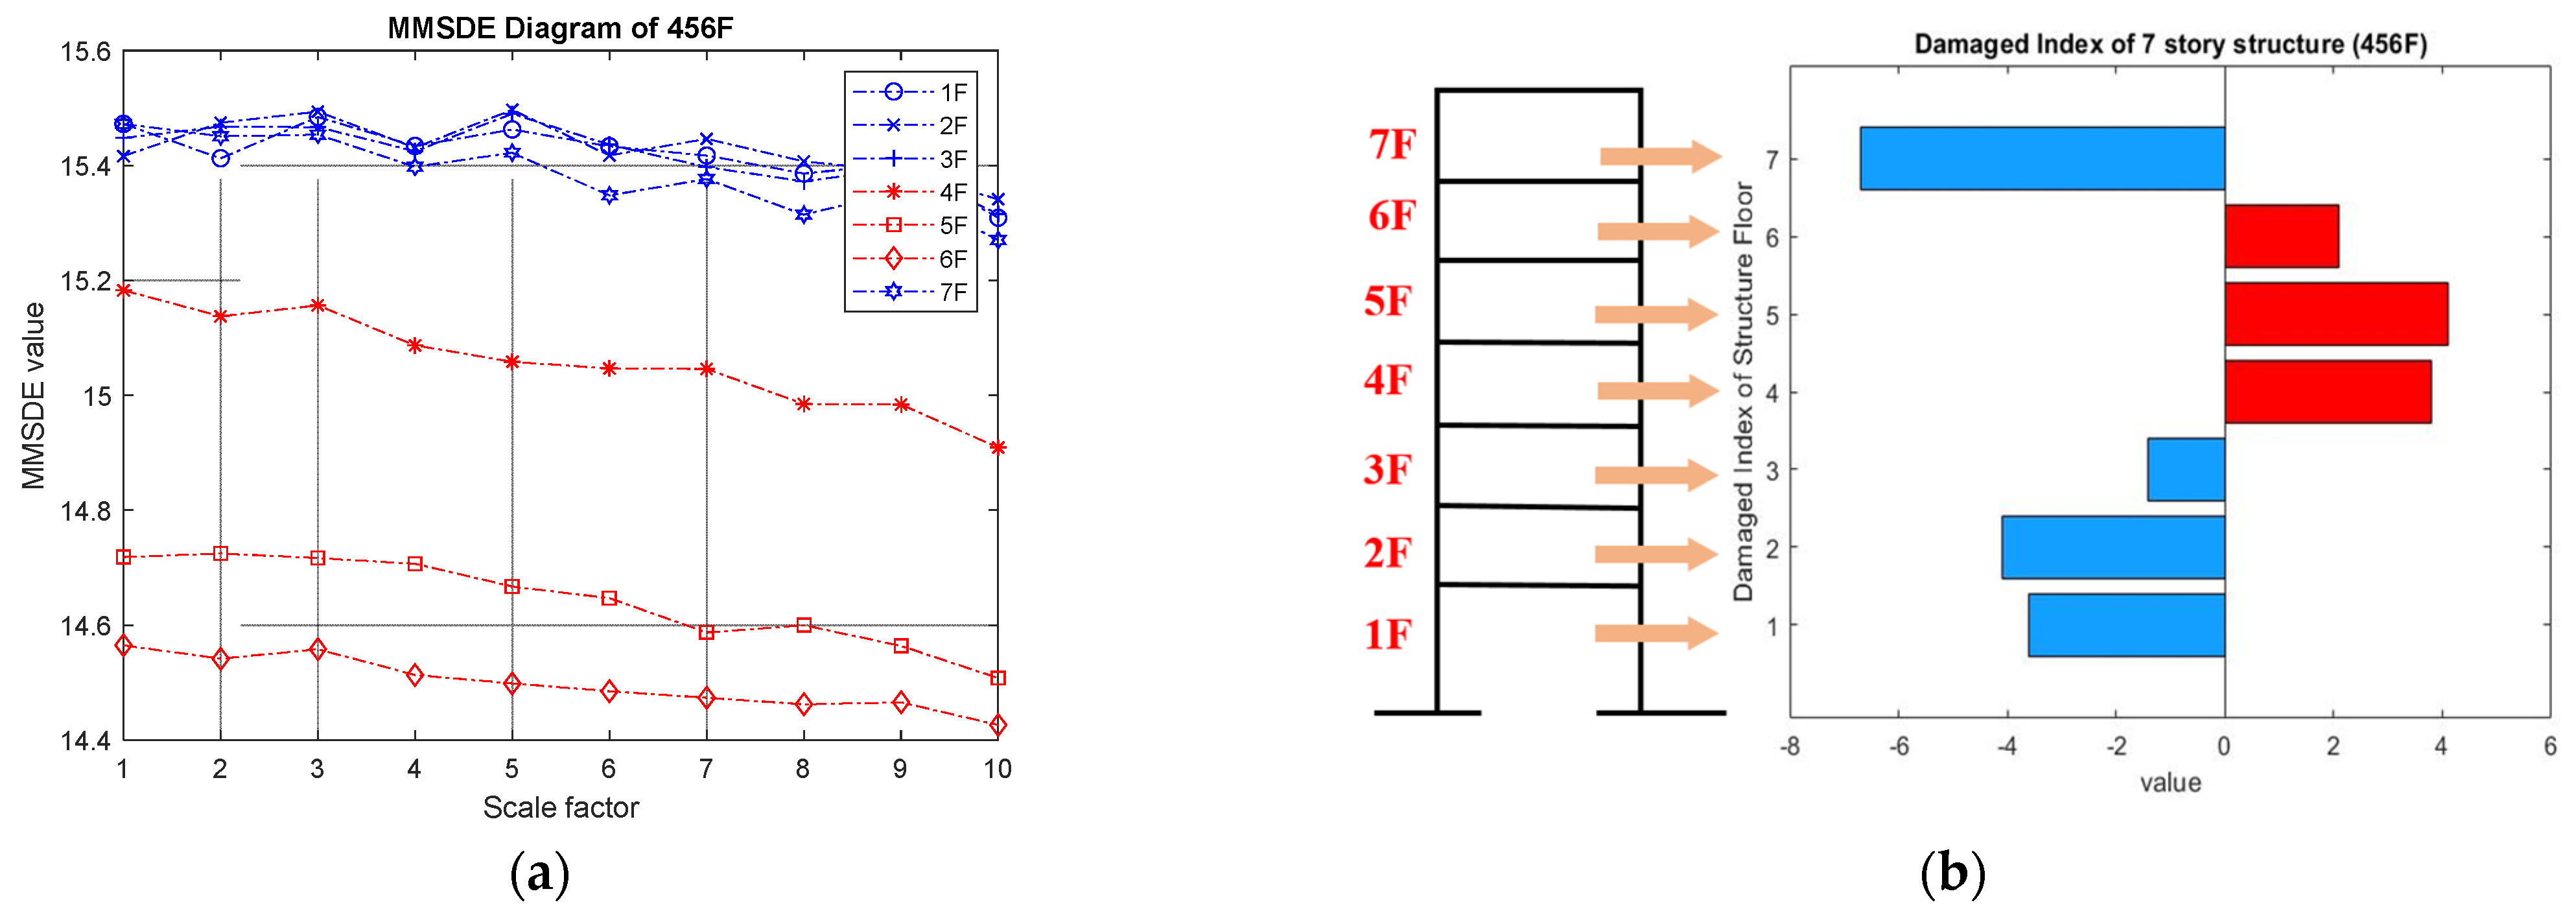
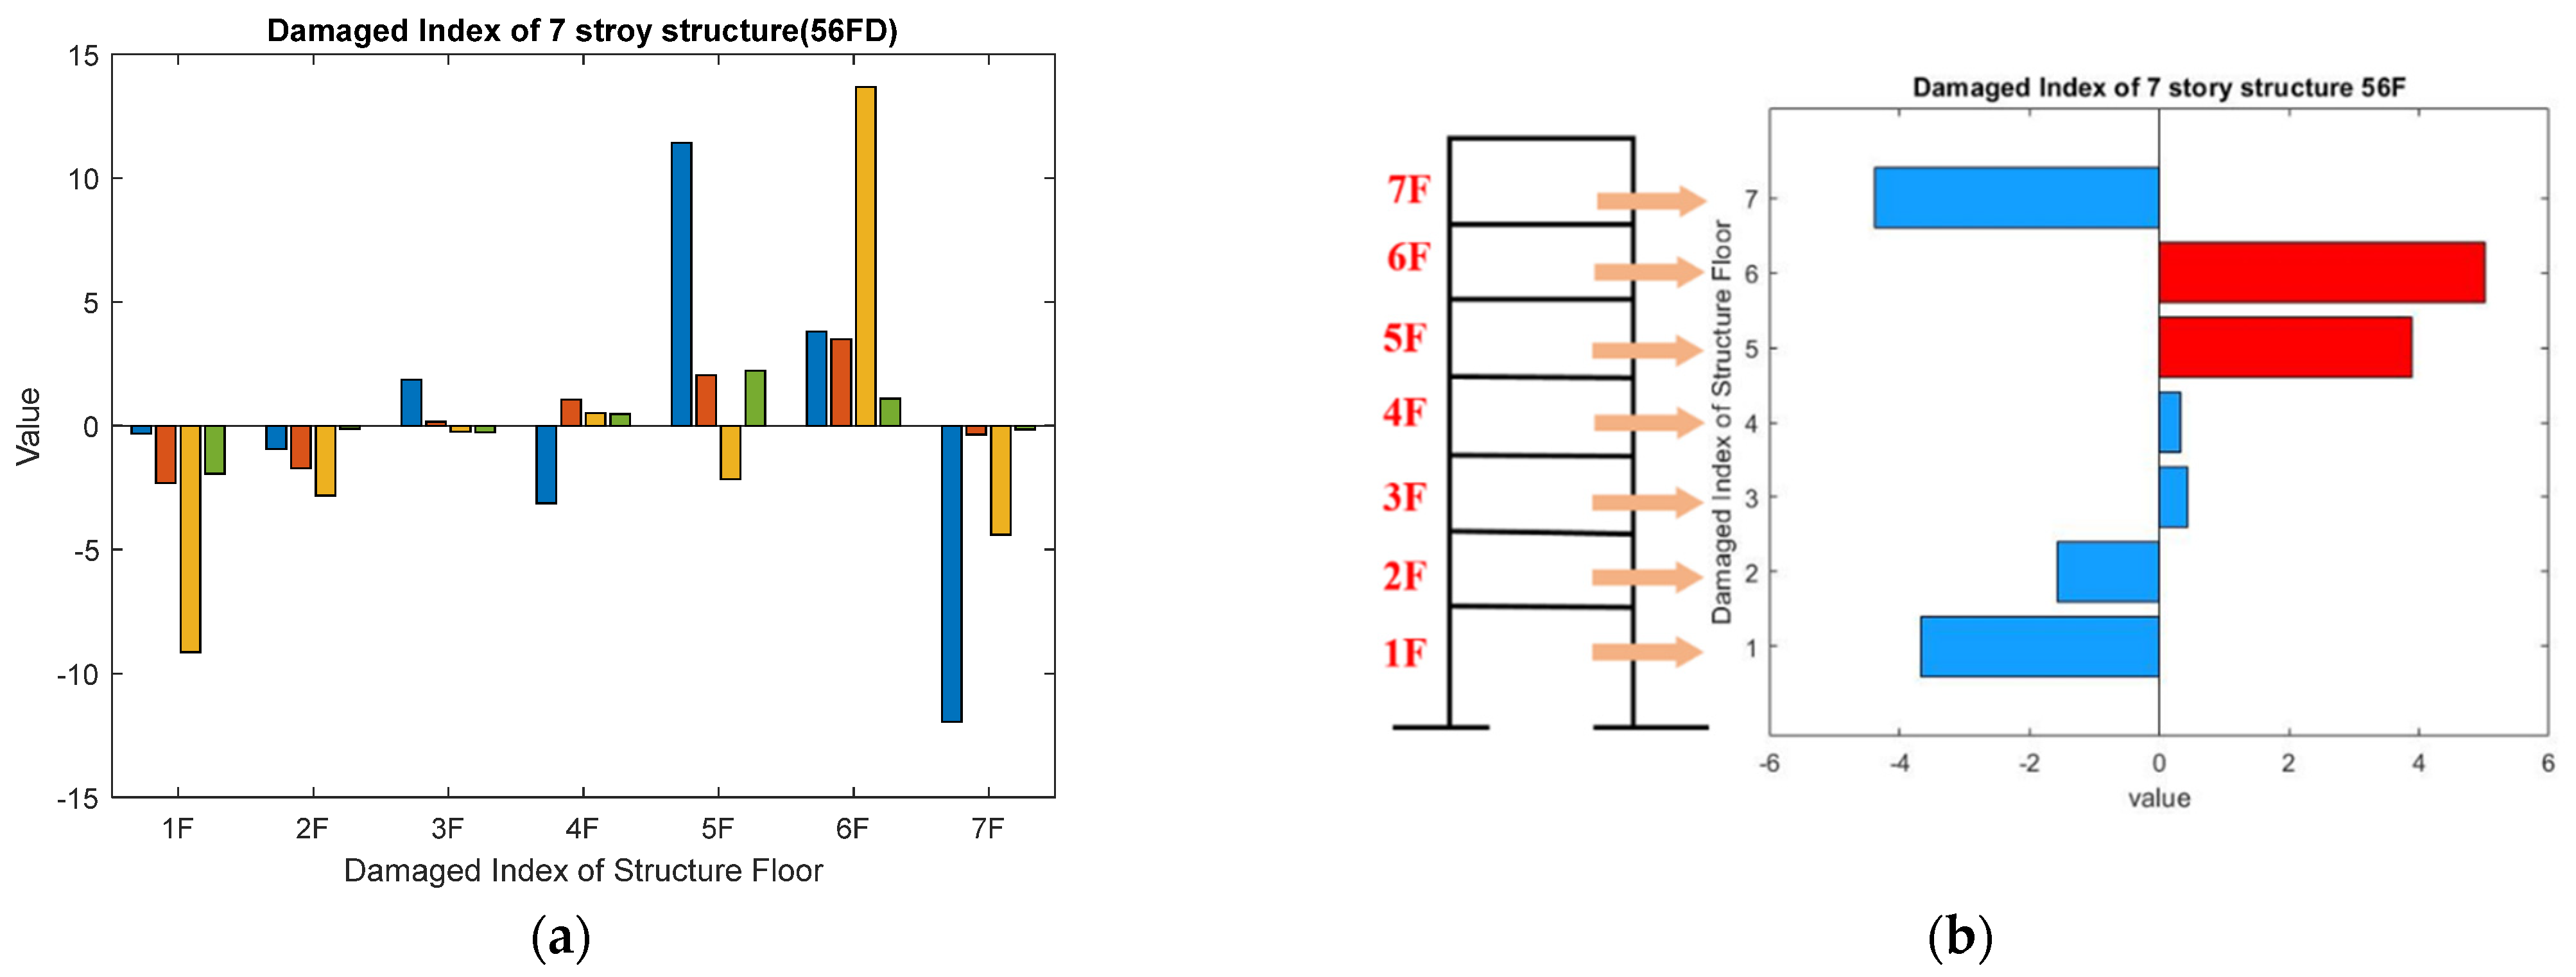
3.3. Damage Index
3.4. Confusion Matrix Verification
4. Experimental Verification
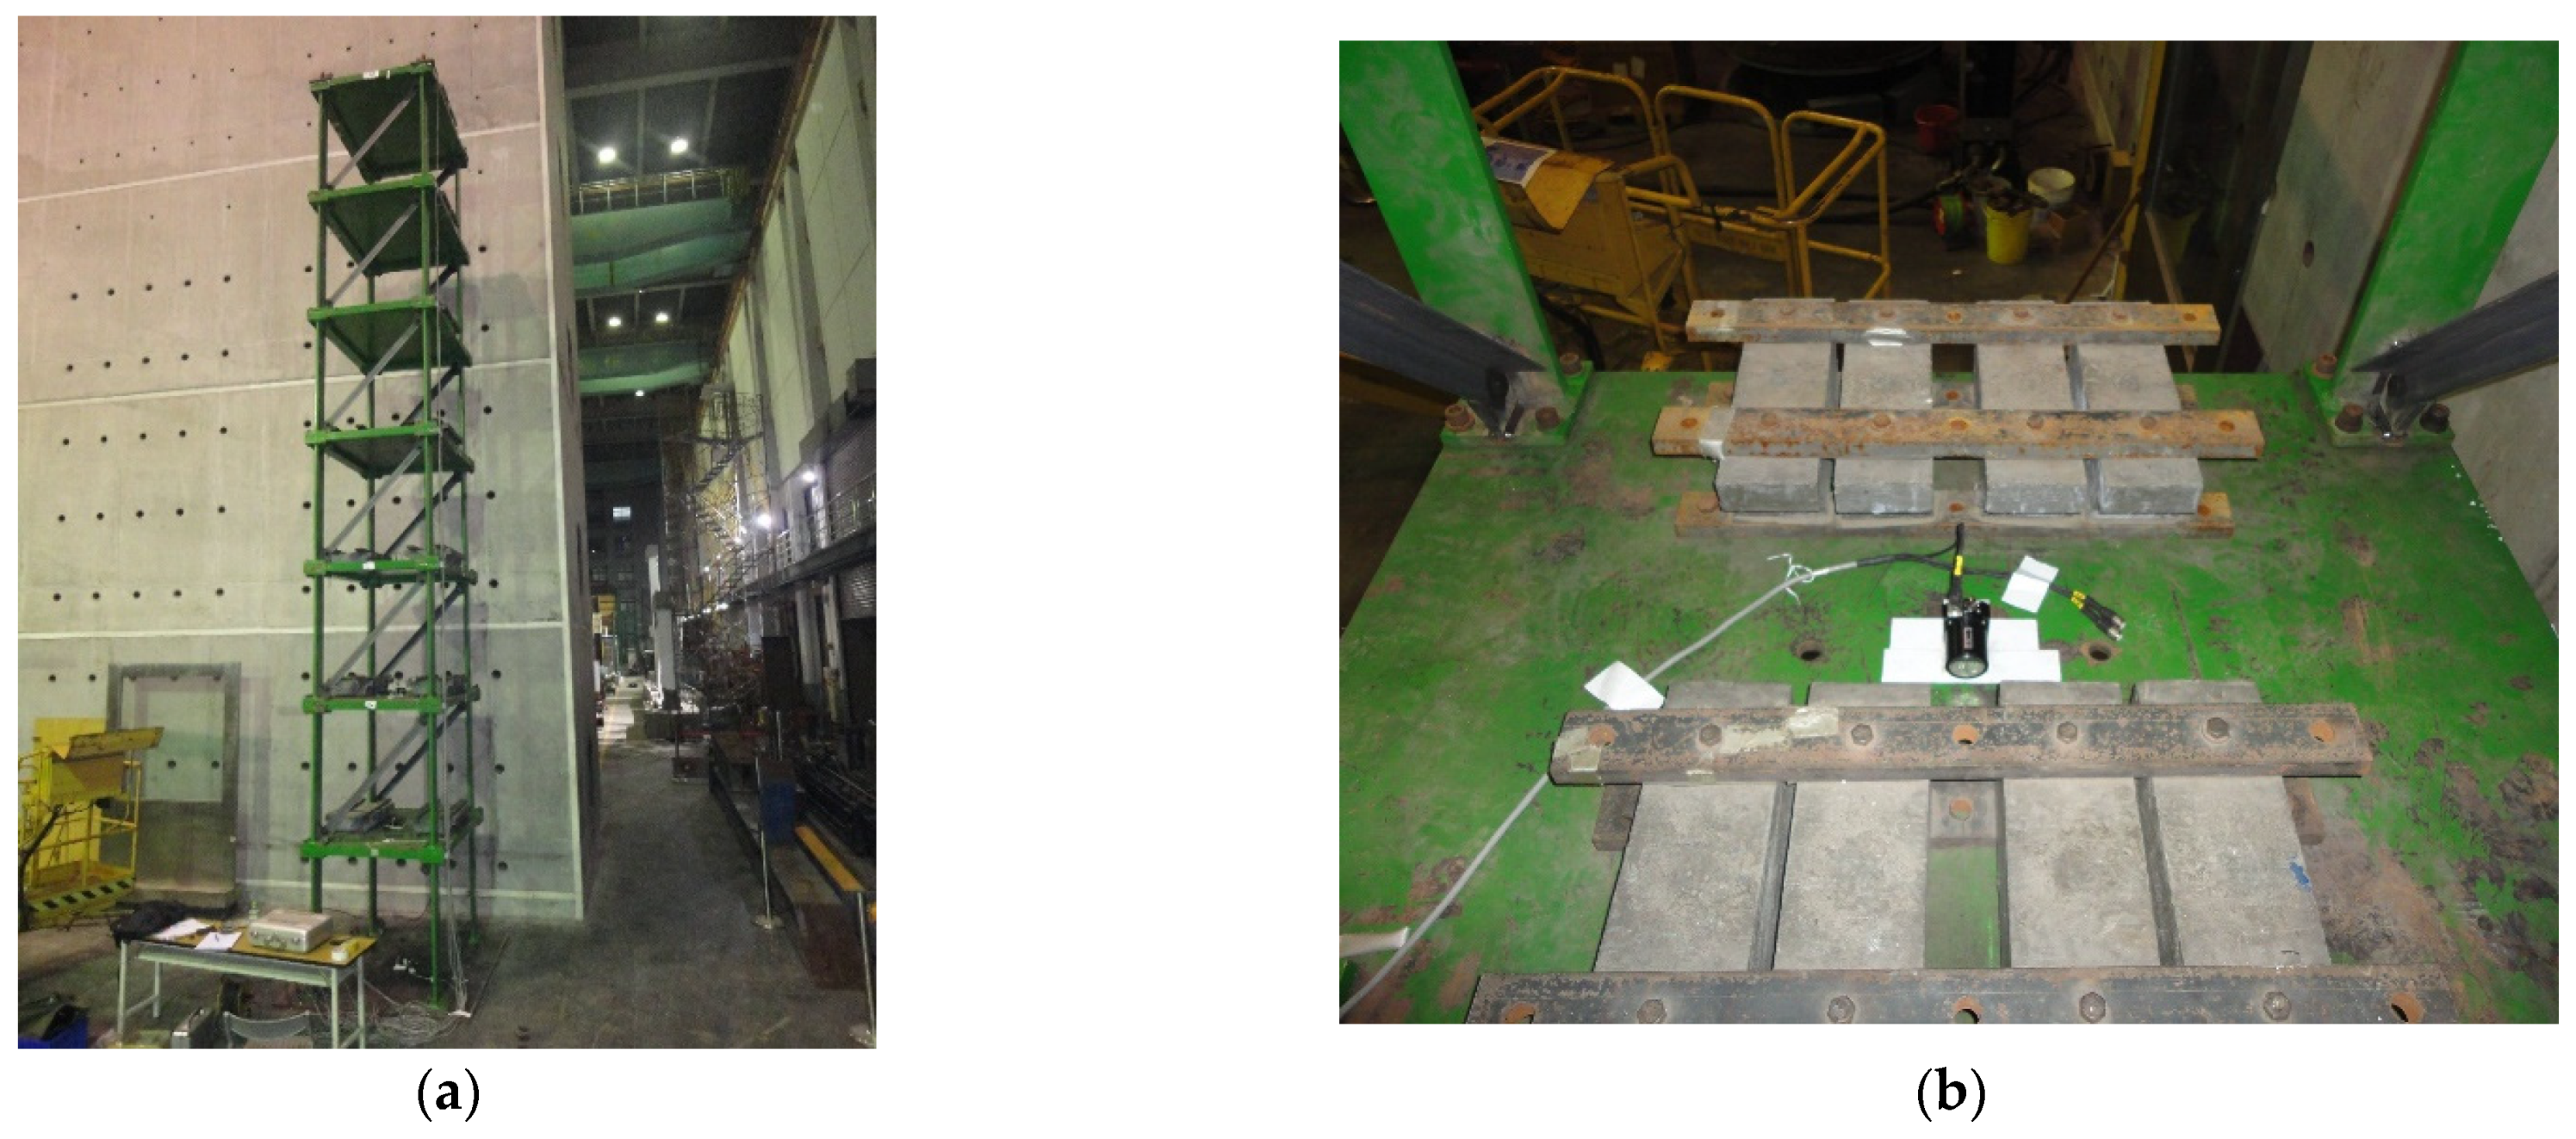
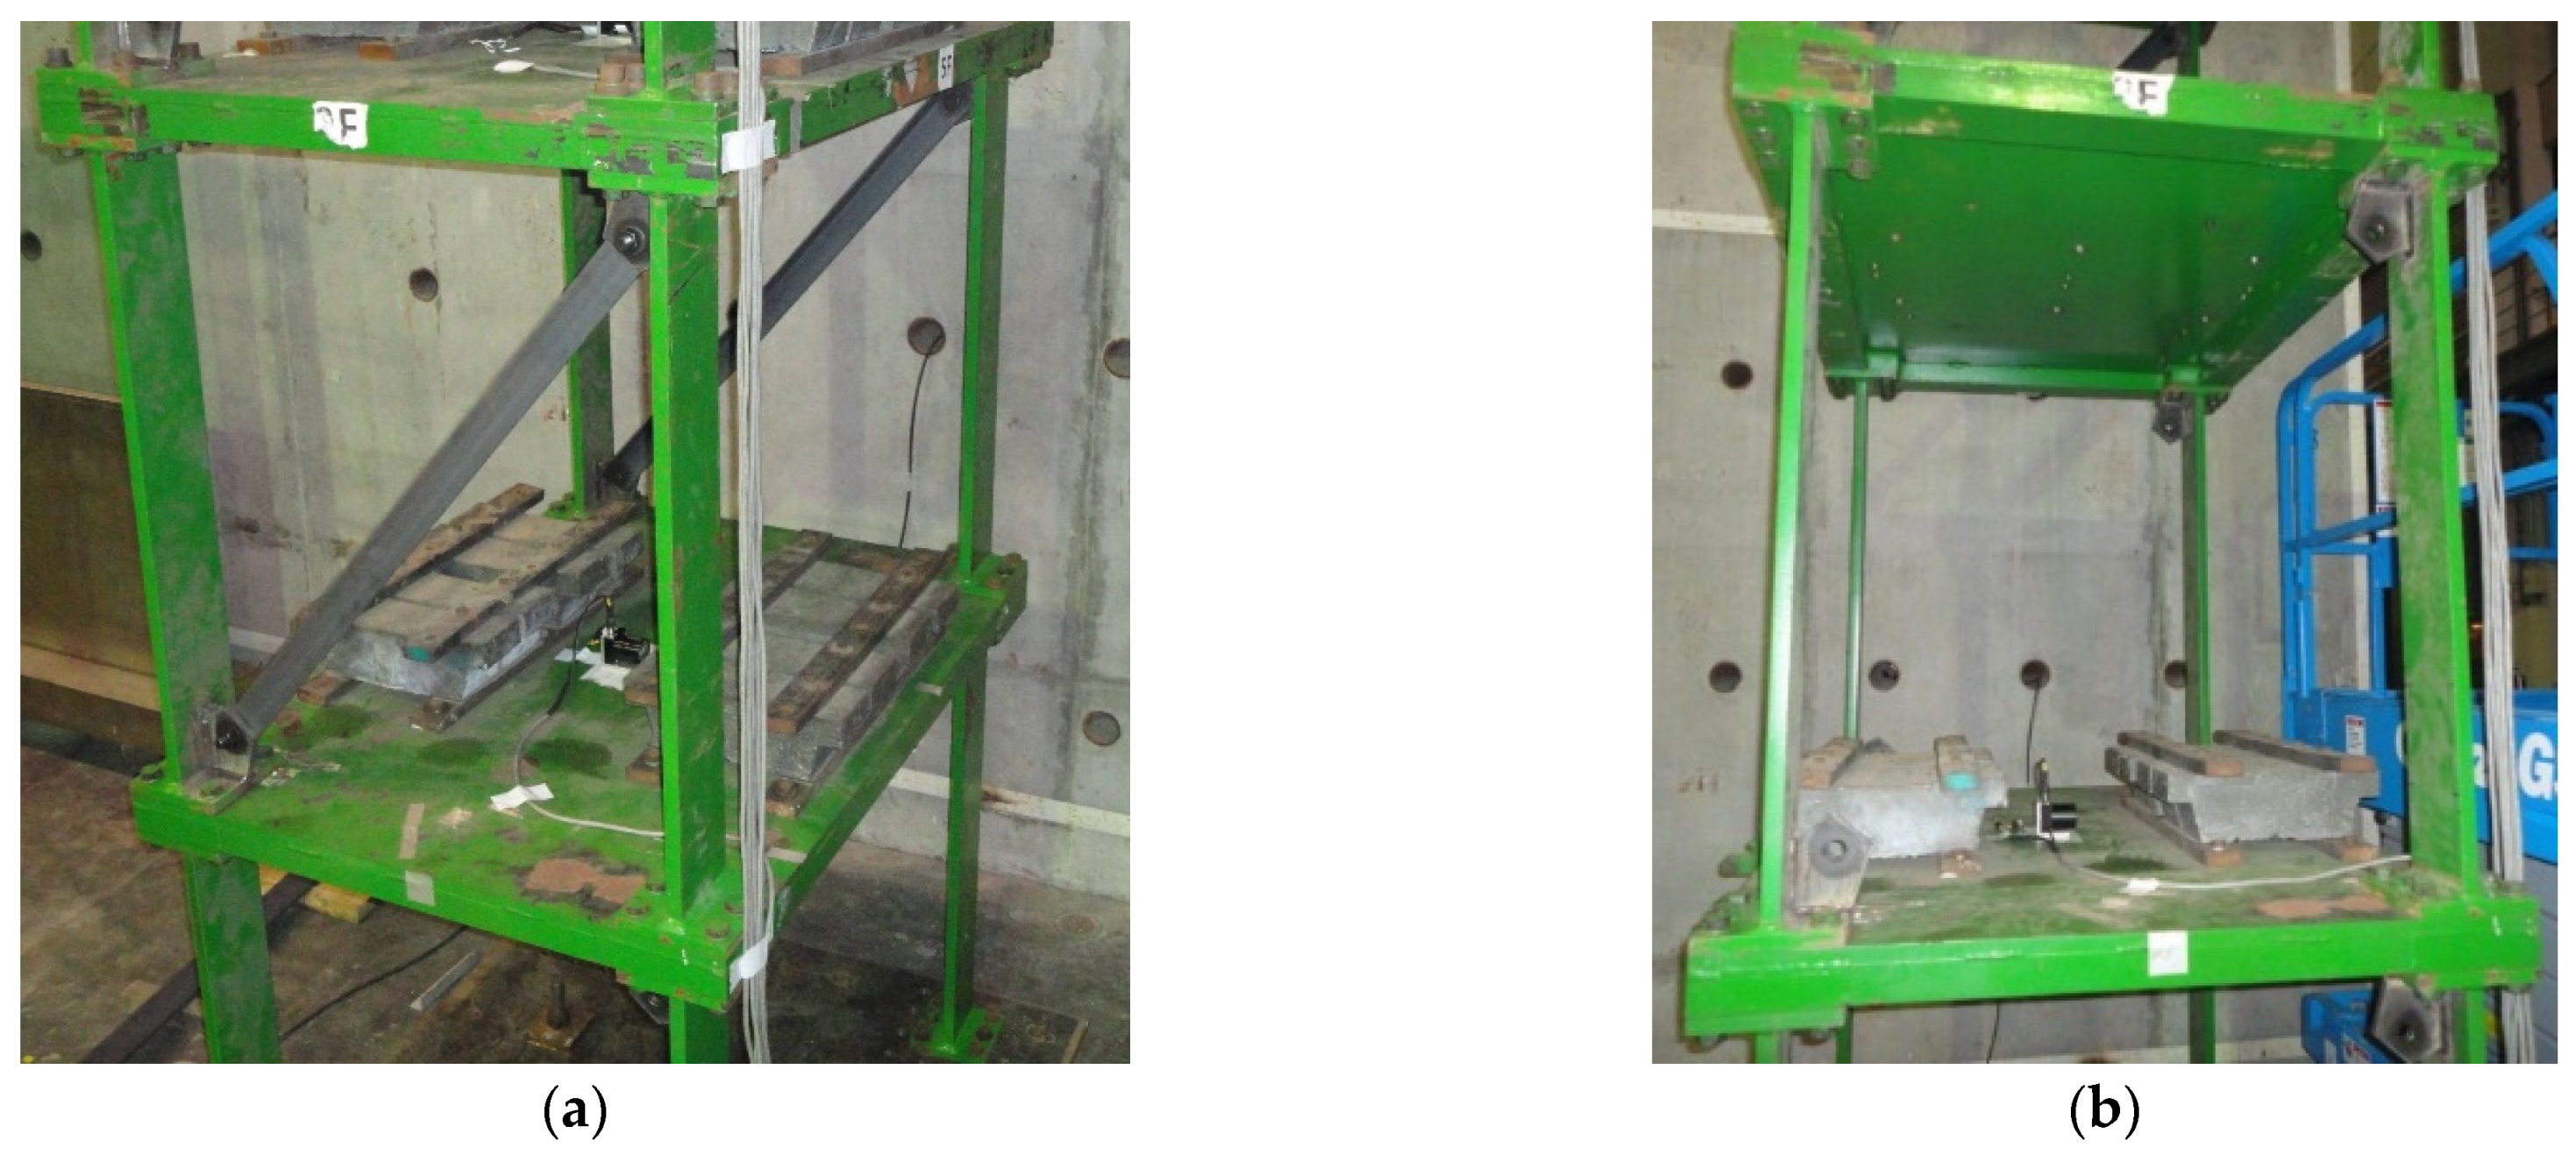
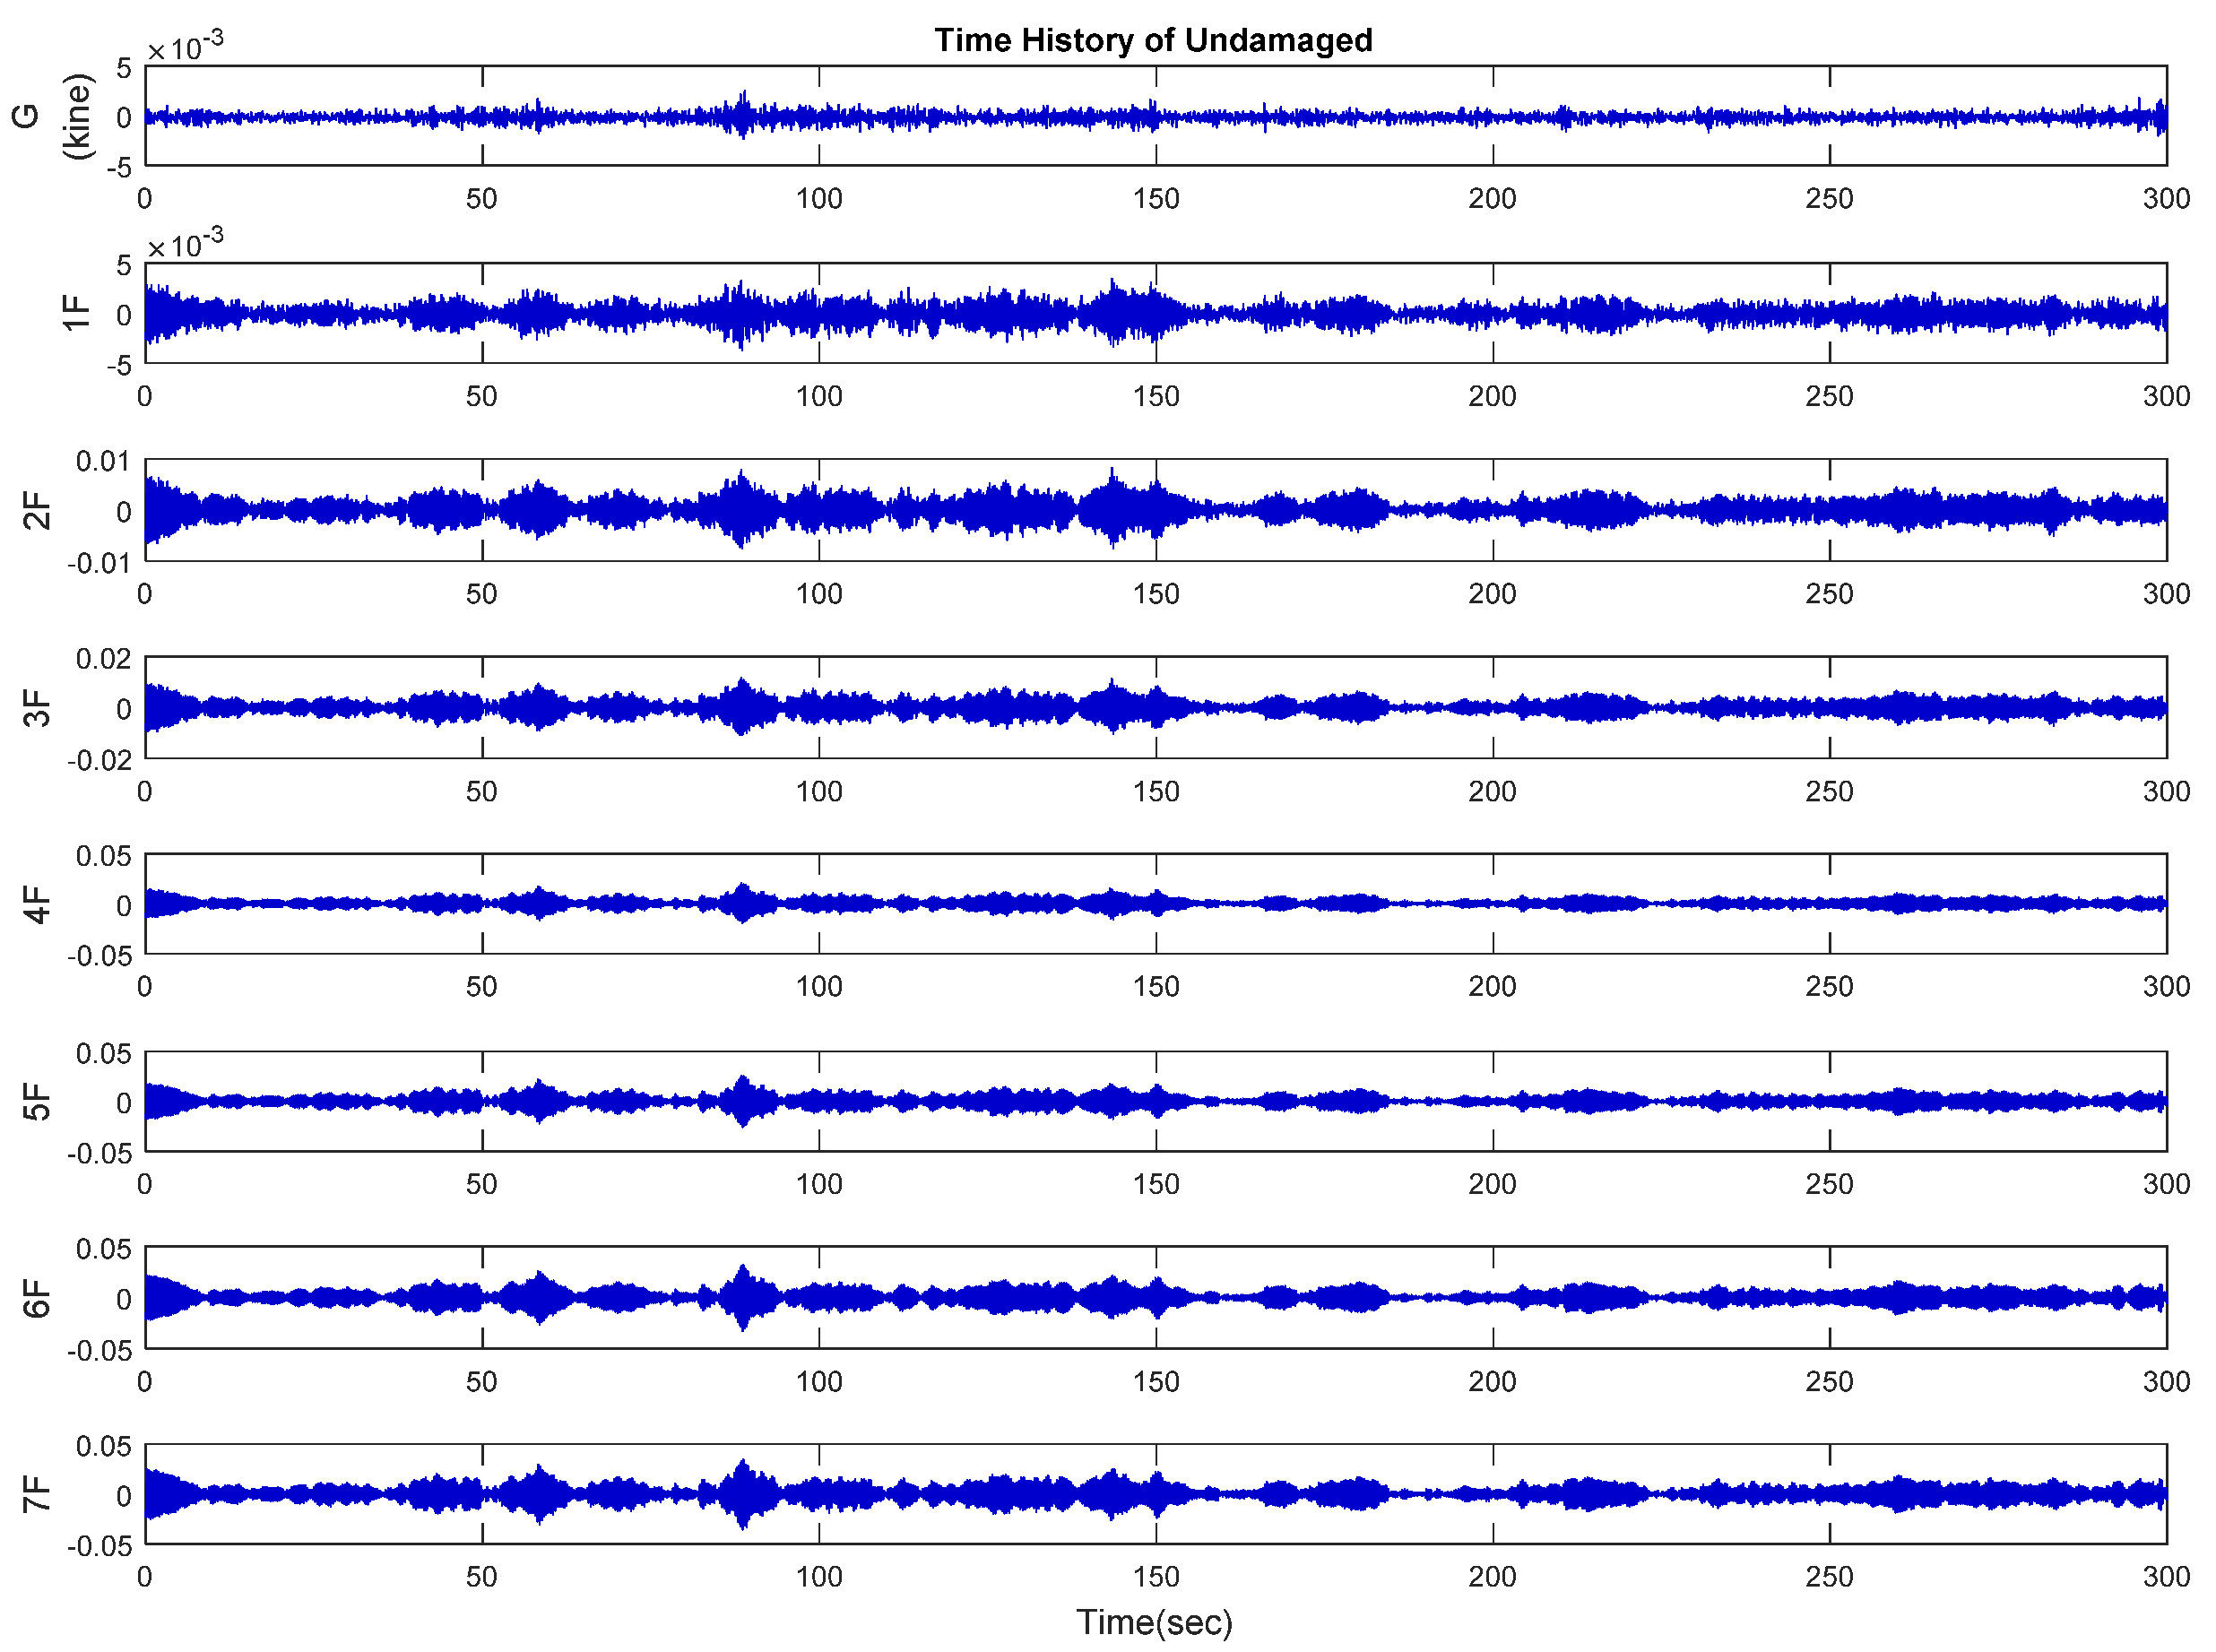
4.1. Experimental Database
4.2. Results of Experimental Verification
- (I)
- One-story damage
- (II)
- Two-story damage
- (III)
- Three-story damage
4.3. Damage Index
4.4. Confusion Matrix Verification
4.5. Comparison between Numerical Simulation and Experiment
5. Conclusions
Author Contributions
Funding
Conflicts of Interest
References
- NSF 95-52; Civil Infrastructures Systems Program Announcement and Guidelines. National Science Foundation: Arlington, VA, USA, 1995.
- Chong, K.P. Health monitoring of civil structures. J. Intell. Mater. Syst. Struct. 1998, 9, 892–898. [Google Scholar] [CrossRef]
- Entezami, A.; Sarmadi, H.; De Michele, C. Probabilistic damage localization by empirical data analysis and symmetric information measure. Measurement 2022, 198, 111359. [Google Scholar] [CrossRef]
- Entezami, A.; Shariatmadar, H.; Karamodin, A. Data-driven damage diagnosis under environmental and operational variability by novel statistical pattern recognition methods. Struct. Health Monit. 2018, 18, 1416–1443. [Google Scholar] [CrossRef]
- Ayres, J.W.; Lalande, F.; Chaudhry, Z.; Rogers, C.A. Qualitative impedance-based health monitoring of civil infrastructures. Smart Mater. Struct. 1998, 7, 599–605. [Google Scholar] [CrossRef]
- Cantero-Chinchilla, S.; Chiachío, J.; Chiachío, M.; Chronopoulos, D.; Jones, A. Optimal sensor configuration for ultrasonic guided-wave inspection based on value of in-formation. Mech. Syst. Signal Process. 2020, 135, 106377. [Google Scholar] [CrossRef]
- Yan, W.-J.; Chronopoulos, D.; Cantero-Chinchilla, S.; Yuen, K.-V.; Papadimitriou, C. A fast Bayesian inference scheme for identification of local structural properties of layered composites based on wave and finite element-assisted metamodeling strategy and ultrasound measurements. Mech. Syst. Signal Process. 2020, 143, 106802. [Google Scholar] [CrossRef]
- Sarmadi, H.; Yuen, K.-V. Structural health monitoring by a novel probabilistic machine learning method based on extreme value theory and mixture quantile modeling. Mech. Syst. Signal Process. 2022, 173, 109049. [Google Scholar] [CrossRef]
- Giglioni, V.; García-Macías, E.; Venanzi, I.; Ierimonti, L.; Ubertini, F. The use of receiver operating characteristic curves and precision-versus-recall curves as performance metrics in unsupervised structural damage classification under changing environment. Eng. Struct. 2021, 246, 113029. [Google Scholar] [CrossRef]
- Daneshvar, M.H.; Sarmadi, H. Unsupervised learning-based damage assessment of full-scale civil structures under long-term and short-term monitoring. Eng. Struct. 2022, 256, 114059. [Google Scholar] [CrossRef]
- Cantero-Chinchilla, S.; Aranguren, G.; Royo, J.M.; Chiachío, M.; Etxaniz, J.; Calvo-Echenique, A. Structural Health Monitoring Using Ultrasonic Guided-Waves and the Degree of Health Index. Sensors 2021, 21, 993. [Google Scholar] [CrossRef]
- Shannon, C.E. A Mathematical Theory of Communication. Bell Syst. Tech. J. 1948, 27, 379–423. [Google Scholar] [CrossRef] [Green Version]
- Pincus, S.M.; Gladstone, I.M.; Ehrenkranz, R.A. A regularity statistic for medical data analysis. Int. J. Clin. Monit. Comput. 1991, 7, 335–345. [Google Scholar] [CrossRef] [PubMed]
- Richman, J.S.; Moorman, J.R. Physiological time-series analysis using approximate entropy and sample entropy. Am. J. Physiol. Heart Circ. Physiol. 2000, 278, H2039–H2049. [Google Scholar] [CrossRef] [PubMed] [Green Version]
- Lake, D.E.; Richman, J.S.; Griffin, M.P.; Moorman, J.R. Sample entropy analysis of neonatal heart rate variability. Am. J. Physiol.-Regul. Integr. Comp. Physiol. 2002, 283, R789–R797. [Google Scholar] [CrossRef] [PubMed] [Green Version]
- Costa, M.; Goldberger, A.L.; Peng, C.K. Multi scale entropy analysis of complex physiologic time series. Phys. Rev. Lett. 2002, 89, 068102. [Google Scholar] [CrossRef] [PubMed] [Green Version]
- Costa, M.; Goldberger, A.L.; Peng, C.K. Multi scale entropy analysis of biological signals. Phys. Rev. E 2005, 71, 021906. [Google Scholar] [CrossRef] [Green Version]
- Rojas, E.; Baltazar, A. Structural health monitoring method based on the entropy of an ultrasonic sensor network for a plate like structure. AIP Conf. Proc. 2015, 1650, 1667–1676. [Google Scholar]
- Wimarshana, B.; Wu, N.; Wu, C. Crack identification with parametric optimization of entropy & wavelet transformation. Struct. Monit. Maint. 2017, 4, 33–52. [Google Scholar] [CrossRef]
- Guan, X.; Wang, Y.; He, J. A Probabilistic Damage Identification Method for Shear Structure Components Based on Cross-Entropy Optimizations. Entropy 2017, 19, 27. [Google Scholar] [CrossRef] [Green Version]
- Feng, Z.; Lin, X.; Zuo, M.J. Joint amplitude and frequency demodulation analysis based on intrinsic time-scale decomposition for planetary gearbox fault diagnosis. Mech. Syst. Signal Process. 2016, 72–73, 223–240. [Google Scholar] [CrossRef]
- Lei, Y.; Han, D.; Lin, J.; He, Z. Planetary gearbox fault diagnosis using an adaptive stochastic resonance method. Mech. Syst. Signal Process. 2013, 38, 113–124. [Google Scholar] [CrossRef]
- Li, Y.; Yang, Y.; Li, G.; Xu, M.; Huang, W. A fault diagnosis scheme for planetary gearboxes using modified mul-ti-scale symbolic dynamic entropy and mRMR feature selection. Mech. Syst. Signal Process. 2017, 91, 295–312. [Google Scholar] [CrossRef]
- Yang, C.; Jia, M. Health condition identification for rolling bearing based on hierarchical multiscale symbolic dy-namic entropy and least squares support tensor machine–based binary tree. Struct. Health Monit. 2020, 20, 151–172. [Google Scholar] [CrossRef]
- Li, Y.; Liang, X.; Wei, Y.; Wang, X. A method based on refined composite multi-scale symbolic dynamic entropy and ISVM-BT for rotating machinery fault diagnosis. Neurocomputing 2018, 315, 246–260. [Google Scholar] [CrossRef]
- Wu, S.-D.; Wu, C.-W.; Lee, K.-Y.; Lin, S.-G. Modified multiscale entropy for short-term time series analysis. Phys. A Stat. Mech. Its Appl. 2013, 392, 5865–5873. [Google Scholar] [CrossRef]
- Lin, T.-K.; Liang, J.-C. Application of multi-scale (cross-) sample entropy for structural health monitoring. Smart Mater. Struct. 2015, 24, 085003. [Google Scholar] [CrossRef]
- Yang, Y.; Zheng, H.; Yin, J.; Xu, M.; Chen, Y. Refined composite multivariate multiscale symbolic dynamic entropy and its application to fault diagnosis of rotating machine. Measurement 2019, 151, 107233. [Google Scholar] [CrossRef]
- Lin, T.-K.; Huang, T.-H. Damage quantification of 3D-printed structure based on composite multiscale cross-sample entropy. Smart Mater. Struct. 2020, 30, 015015. [Google Scholar] [CrossRef]
- Wang, J.; Li, T.; Xie, R.; Wang, X.-M.; Cao, Y.-Y. Fault Feature Extraction for Multiple Electrical Faults of Aviation Electro-Mechanical Actuator Based on Symbolic Dynamics Entropy. In Proceedings of the 2015 IEEE International Conference on Signal Processing, Communications and Computing (ICSPCC), Ningbo, China, 19–22 September 2015; pp. 1–6. [Google Scholar] [CrossRef]


| Case Number | Damage Group | Damaged Floors |
|---|---|---|
| 0 | Undamaged | None |
| 1 | 1 F | |
| 2 | 2 F | |
| 3 | 3 F | |
| 4 | One-story damage | 4 F |
| 5 | 5 F | |
| 6 | 6 F | |
| 7 | 7 F | |
| 8 | 1 F and 2 F | |
| 9 | 2 F and 3 F | |
| 10 | Two-story damage | 3 F and 4 F |
| 11 | 4 F and 5 F | |
| 12 | 5 F and 6 F | |
| 13 | 6 F and 7 F | |
| 14 | 1 F and 2 F and 3 F | |
| 15 | 2 F and 3 F and 4 F | |
| 16 | Three-story damage | 3 F and 4 F and 5 F |
| 17 | 4 F and 5 F and 6 F | |
| 18 | 5 F and 6 F and 7 F |
| Case | Damage | MMSDE | |||
|---|---|---|---|---|---|
| Number | Floors | TP | FP | TN | FN |
| 1 | 1 F | 1 | 0 | 6 | 0 |
| 2 | 2 F | 1 | 1 | 5 | 0 |
| 3 | 3 F | 1 | 0 | 6 | 0 |
| 4 | 4 F | 1 | 0 | 6 | 0 |
| 5 | 5 F | 1 | 0 | 6 | 0 |
| 6 | 6 F | 1 | 0 | 6 | 0 |
| 7 | 7 F | 1 | 0 | 6 | 0 |
| 8 | 1 F and 2 F | 1 | 0 | 5 | 1 |
| 9 | 2 F and 3 F | 2 | 1 | 4 | 0 |
| 10 | 3 F and 4 F | 2 | 0 | 5 | 0 |
| 11 | 4 F and 5 F | 2 | 0 | 5 | 0 |
| 12 | 5 F and 6 F | 2 | 0 | 5 | 0 |
| 13 | 6 F and 7 F | 1 | 1 | 4 | 1 |
| 14 | 1 F and 2 F and 3 F | 1 | 0 | 4 | 2 |
| 15 | 2 F and 3 F and 4 F | 2 | 0 | 4 | 1 |
| 16 | 3 F and 4 F and 5 F | 2 | 0 | 4 | 1 |
| 17 | 4 F and 5 F and 6 F | 3 | 0 | 4 | 0 |
| 18 | 5 F and 6 F and 7 F | 3 | 0 | 4 | 0 |
| Total | 28 | 3 | 89 | 6 | |
| Accuracy | 92.80% | ||||
| Precision | 90.30% | ||||
| Recall | 82.30% | ||||
| The Number of Case | Damaged Case Group | Damage Floors | Frequency (Hz) |
|---|---|---|---|
| 0 | Undamaged | None | 3.34 |
| 1 | One-story damage | 1 F | 2.08 |
| 2 | 2 F | 2.13 | |
| 3 | 3 F | 2.12 | |
| 4 | 4 F | 2.29 | |
| 5 | 5 F | 2.61 | |
| 6 | 6 F | 2.88 | |
| 7 | 7 F | 3.2 | |
| 8 | Two-story damage | 1F, 2 F | 1.64 |
| 9 | 3 F, 4 F | 1.83 | |
| 10 | 5 F,6 F | 2.32 | |
| 11 | Three-story damage | 1 F, 2 F, 3 F | 1.44 |
| 12 | 4 F, 5 F, 6 F | 1.88 | |
| 13 | Multi-story damage | 1 F, 2 F, 3 F, 4 F | 1.33 |
| 14 | 4 F, 5 F, 6 F, 7 F | 1.86 |
| Case | Damage | MMSDE | |||
|---|---|---|---|---|---|
| Number | Floors | TP | FP | TN | FN |
| 1 | 1 Floor | 1 | 0 | 6 | 0 |
| 2 | 2 Floor | 1 | 0 | 6 | 0 |
| 3 | 3 Floor | 1 | 0 | 6 | 0 |
| 4 | 4 Floor | 1 | 0 | 6 | 0 |
| 5 | 5 Floor | 1 | 0 | 6 | 0 |
| 6 | 6 Floor | 1 | 0 | 5 | 1 |
| 7 | 7 Floor | 1 | 1 | 5 | 0 |
| 8 | 1 F and 2 F | 2 | 0 | 5 | 0 |
| 9 | 3 F and 4 F | 2 | 0 | 5 | 0 |
| 10 | 5 F and 6 F | 2 | 1 | 4 | 0 |
| 11 | 1 F and 2 F and 3 F | 2 | 1 | 3 | 1 |
| 12 | 4 F and 5 F and 6 F | 3 | 0 | 4 | 0 |
| 13 | 1 F and 2 F and 3 F and 4 F | 2 | 0 | 3 | 2 |
| 14 | 4 F and 5 F and 6 F and 7 F | 4 | 0 | 3 | 0 |
| Total | 24 | 3 | 67 | 4 | |
| Accuracy | 93.8% | ||||
| Precision | 88% | ||||
| Recall | 85.7% | ||||
Publisher’s Note: MDPI stays neutral with regard to jurisdictional claims in published maps and institutional affiliations. |
© 2022 by the authors. Licensee MDPI, Basel, Switzerland. This article is an open access article distributed under the terms and conditions of the Creative Commons Attribution (CC BY) license (https://creativecommons.org/licenses/by/4.0/).
Share and Cite
Lin, T.-K.; Lee, D.-Y.; Hsu, Y.-C.; Kuo, K.-W. Damage Detection of Regular Civil Buildings Using Modified Multi-Scale Symbolic Dynamic Entropy. Entropy 2022, 24, 987. https://doi.org/10.3390/e24070987
Lin T-K, Lee D-Y, Hsu Y-C, Kuo K-W. Damage Detection of Regular Civil Buildings Using Modified Multi-Scale Symbolic Dynamic Entropy. Entropy. 2022; 24(7):987. https://doi.org/10.3390/e24070987
Chicago/Turabian StyleLin, Tzu-Kang, Dong-You Lee, Yu-Chung Hsu, and Kai-Wei Kuo. 2022. "Damage Detection of Regular Civil Buildings Using Modified Multi-Scale Symbolic Dynamic Entropy" Entropy 24, no. 7: 987. https://doi.org/10.3390/e24070987
APA StyleLin, T.-K., Lee, D.-Y., Hsu, Y.-C., & Kuo, K.-W. (2022). Damage Detection of Regular Civil Buildings Using Modified Multi-Scale Symbolic Dynamic Entropy. Entropy, 24(7), 987. https://doi.org/10.3390/e24070987