
Image Encryption Using a Spectrally Efficient Halton Logistics Tent (HaLT) Map and DNA Encoding for Secured Image Communication


Abstract
:1. Introduction
- ➢
- A novel random sequence (HaLT map) generator is proposed, which combines a CLT map (Combined Logistic Tent map) and the Halton sequence.
- ➢
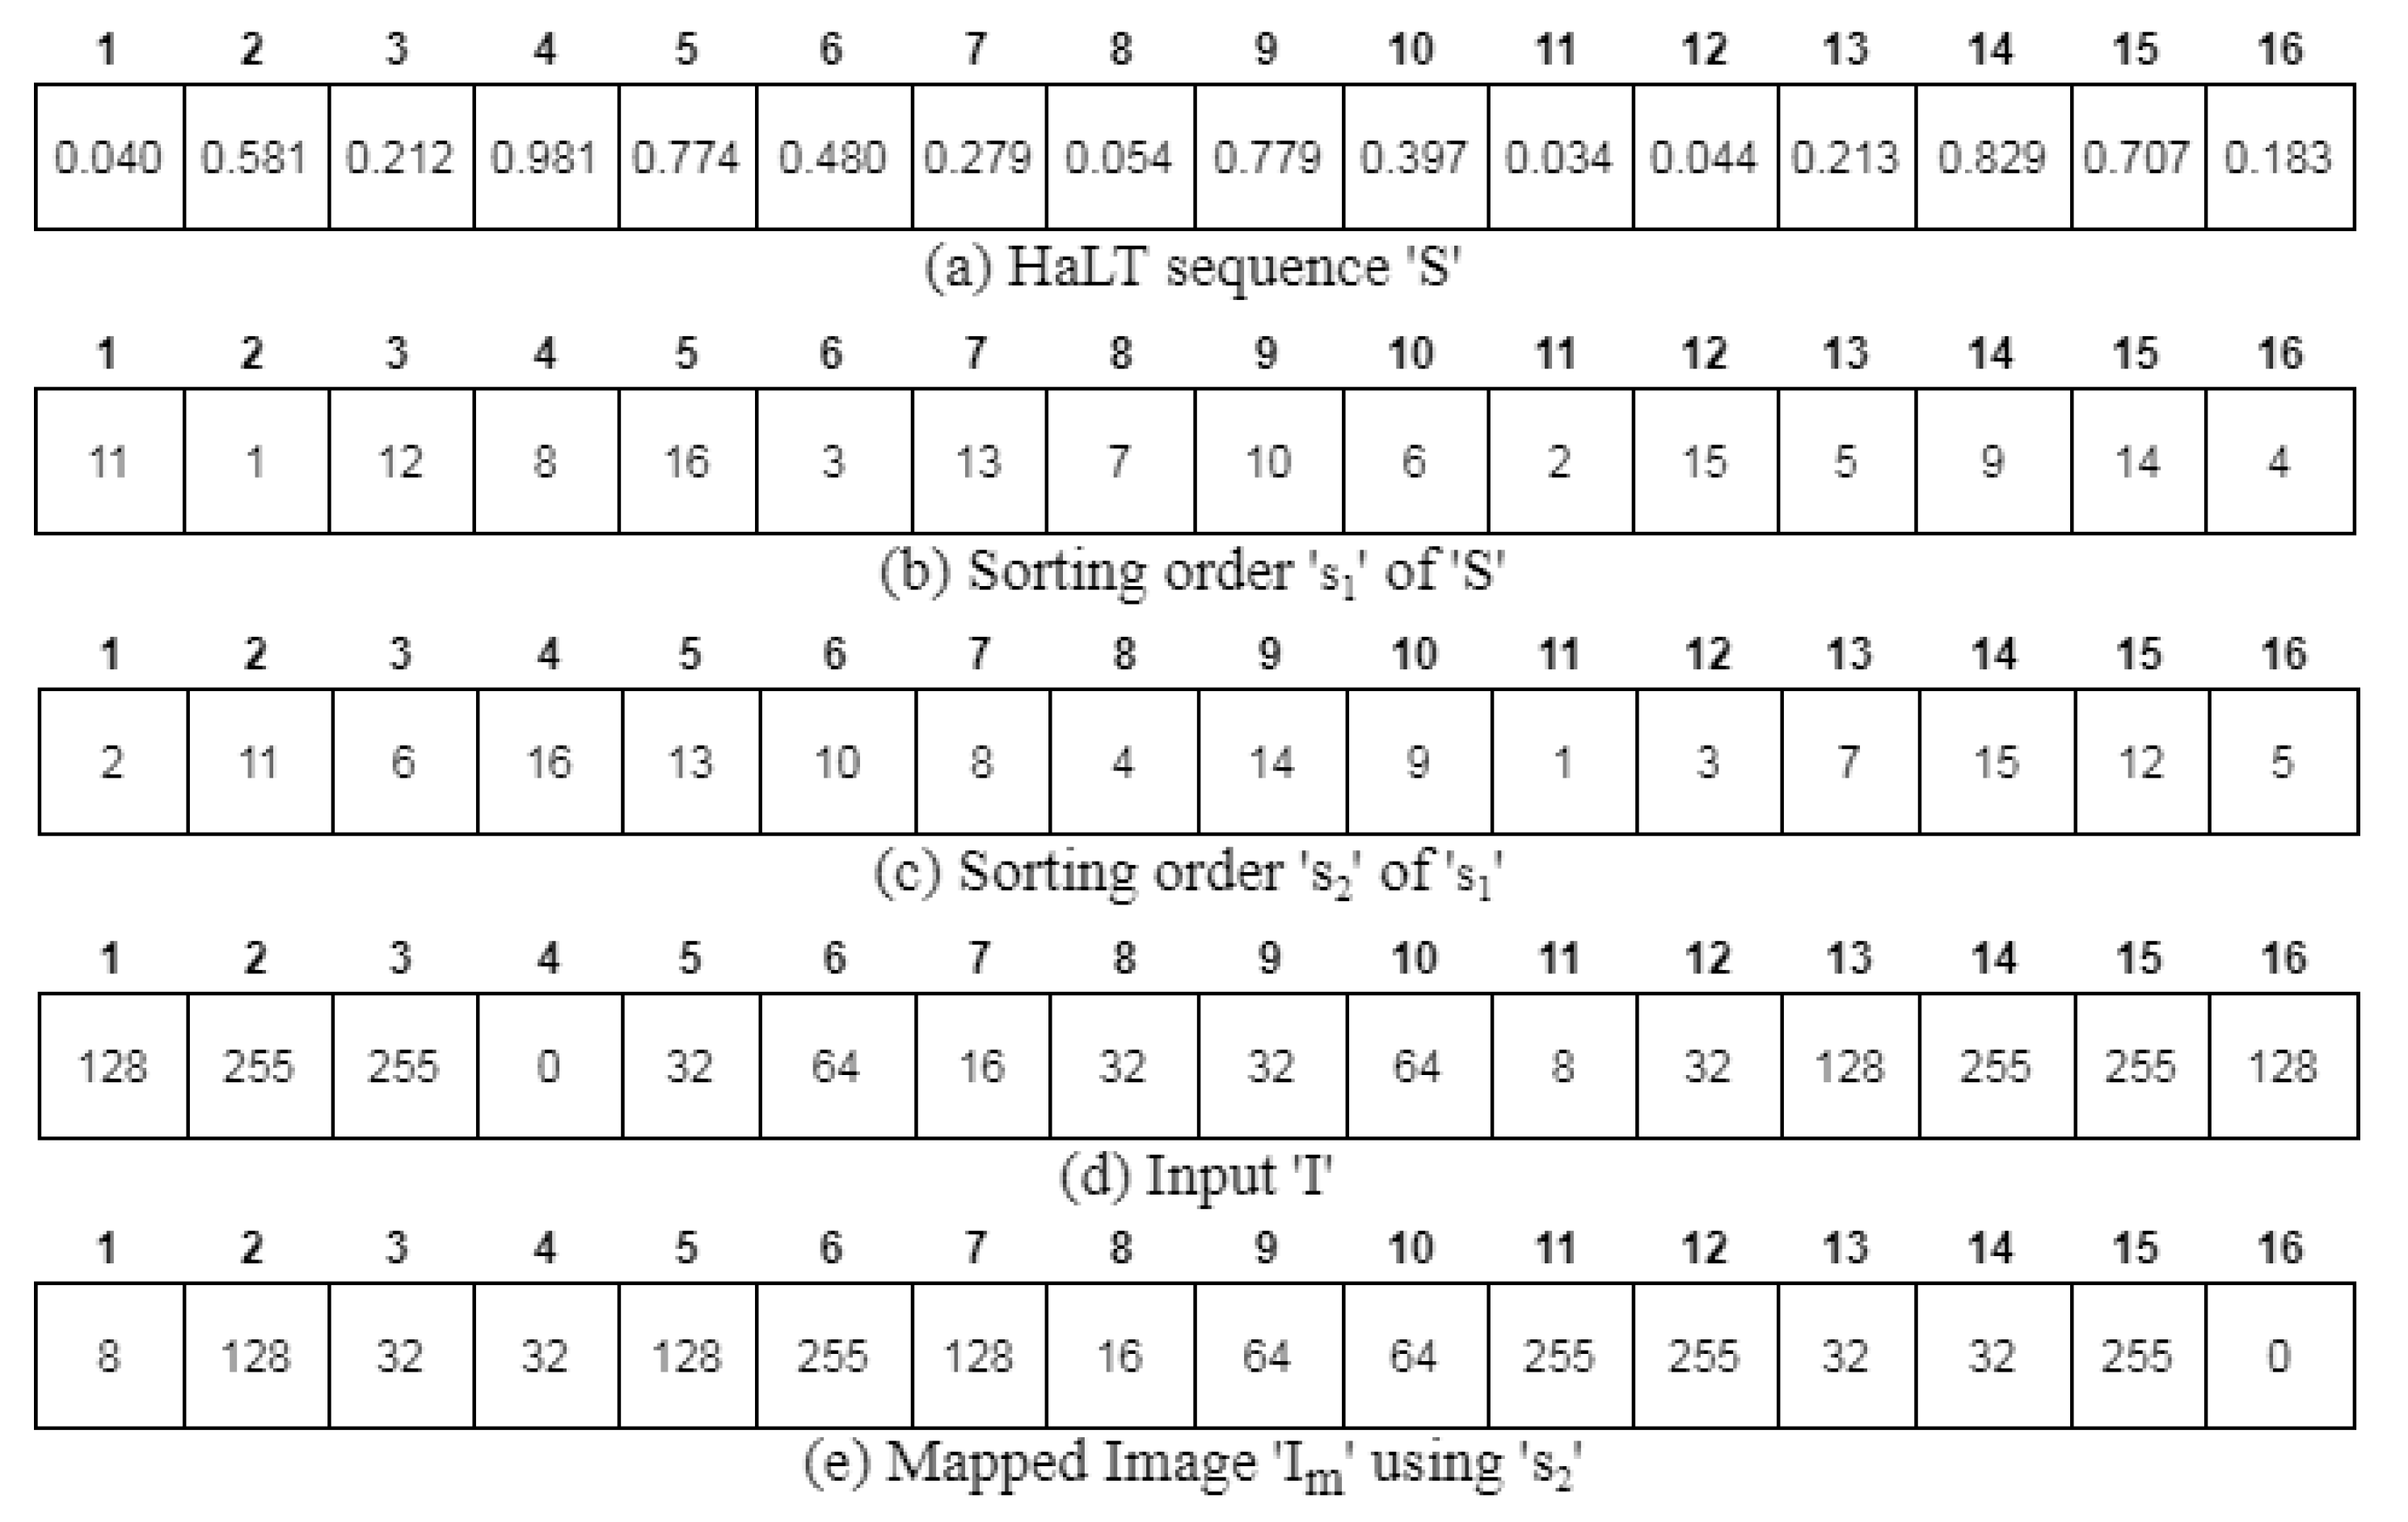
- A modified quantization unit is developed to sort the generated HaLT sequence for first level scrambling.
- ➢
- For second level scrambling, bit-level operations are performed for enhanced security.
- ➢
- MD5 and SHA256 hash functions are obtained from an original and scrambled image, respectively, and they are used to calculate the initial seeds for a 5D hyper-chaotic map.
- ➢
- A five-dimension chaotic map is used for DNA computing in order to provide great confidentiality and high security.
- ➢
- Pixel permutation is performed by double sorting in the quantization unit to efficiently change the pixel position of the matrix.
- ➢
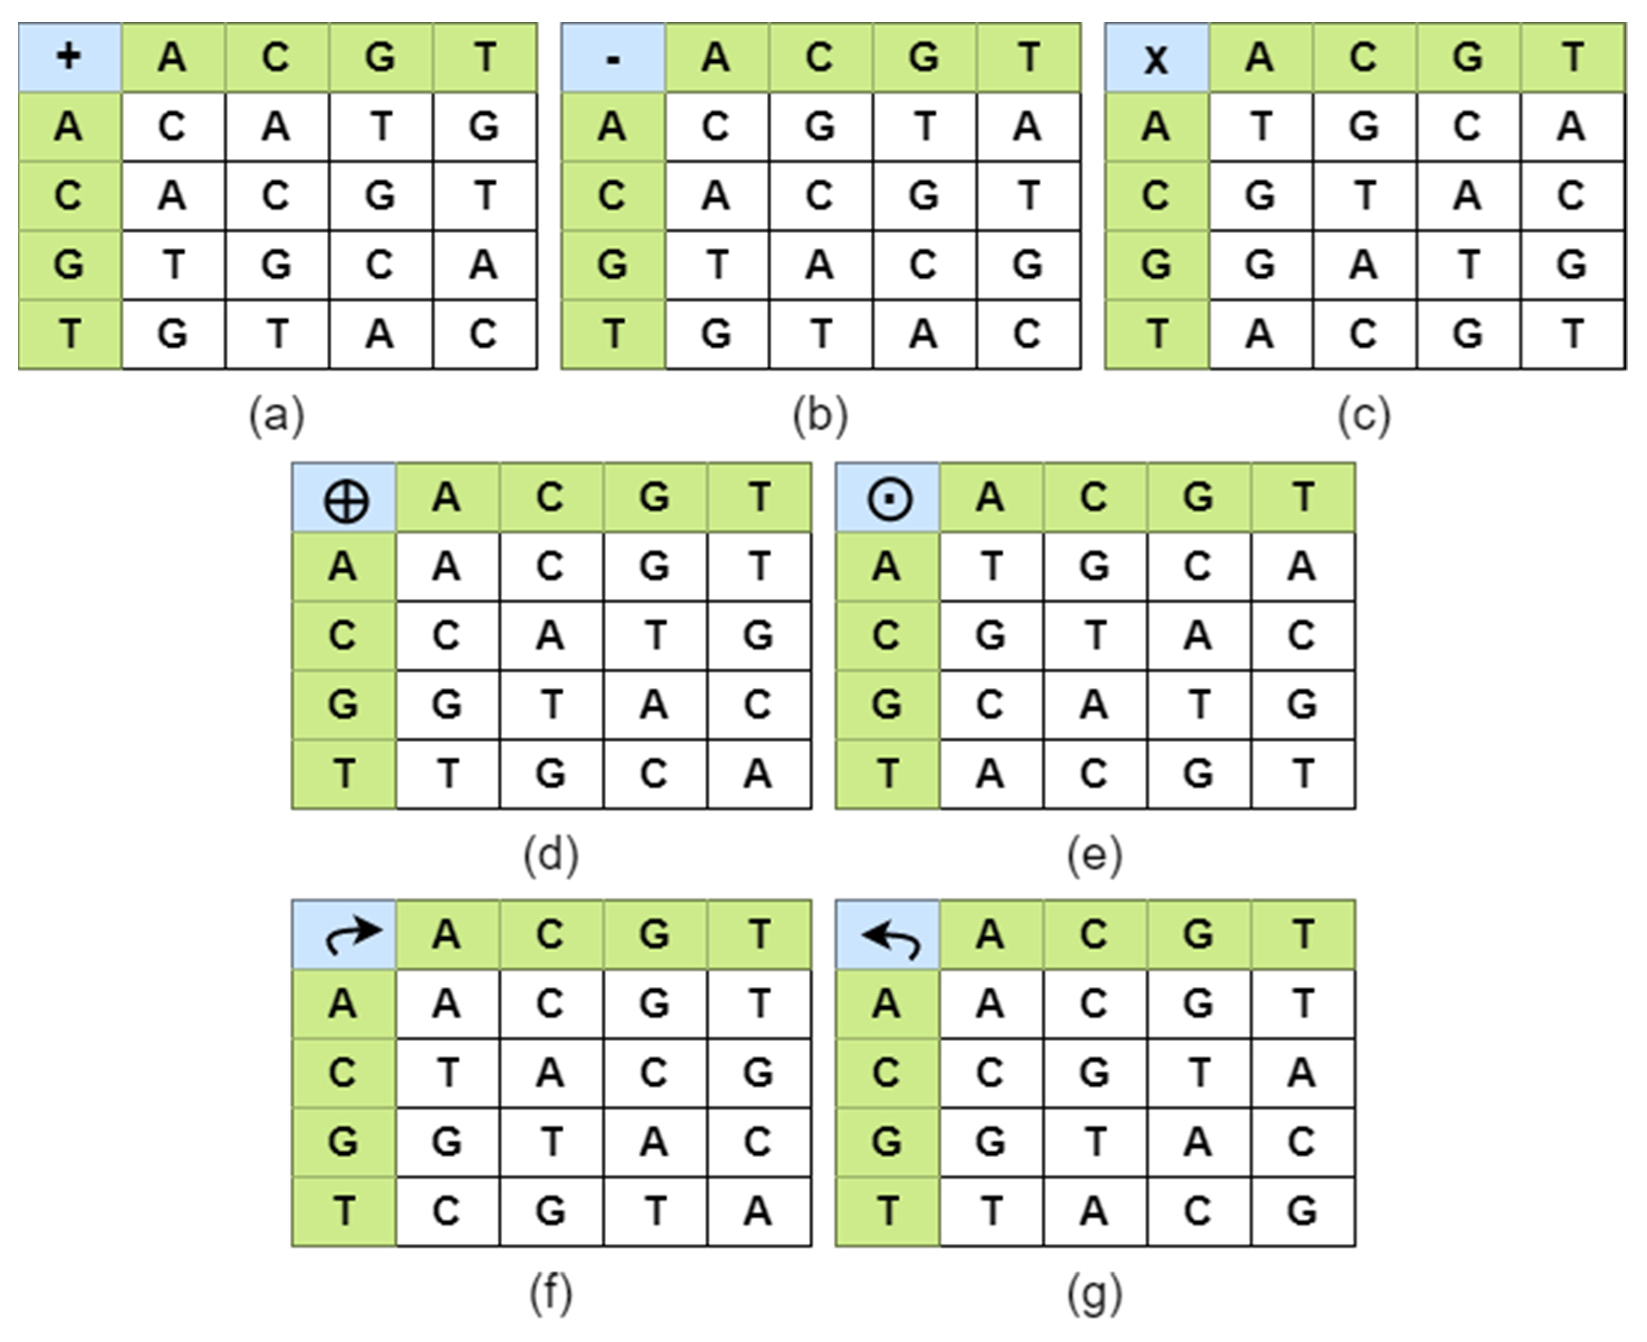
- Seven DNA operations, namely ADD, SUB, MUL, XOR, XNOR, Right-Shift and Left-Shift, are performed to efficiently diffuse the pixels of the permutated image.
- ➢
- The selection of DNA rules and seven operations are carried out using the five chaotic sequences obtained from the 5D hyper-chaotic map.
2. Preliminaries
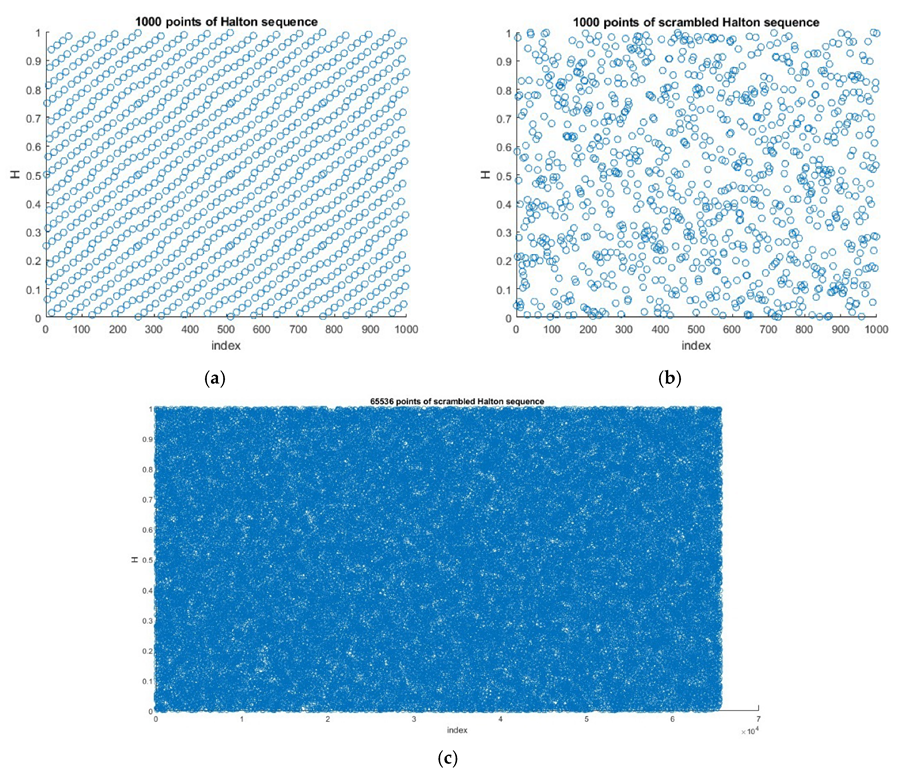
2.1. Halton Sequence
2.2. Cryptographic Hashing
2.2.1. MD5
2.2.2. SHA256
2.3. Chaotic Maps
2.3.1. Logistic Map
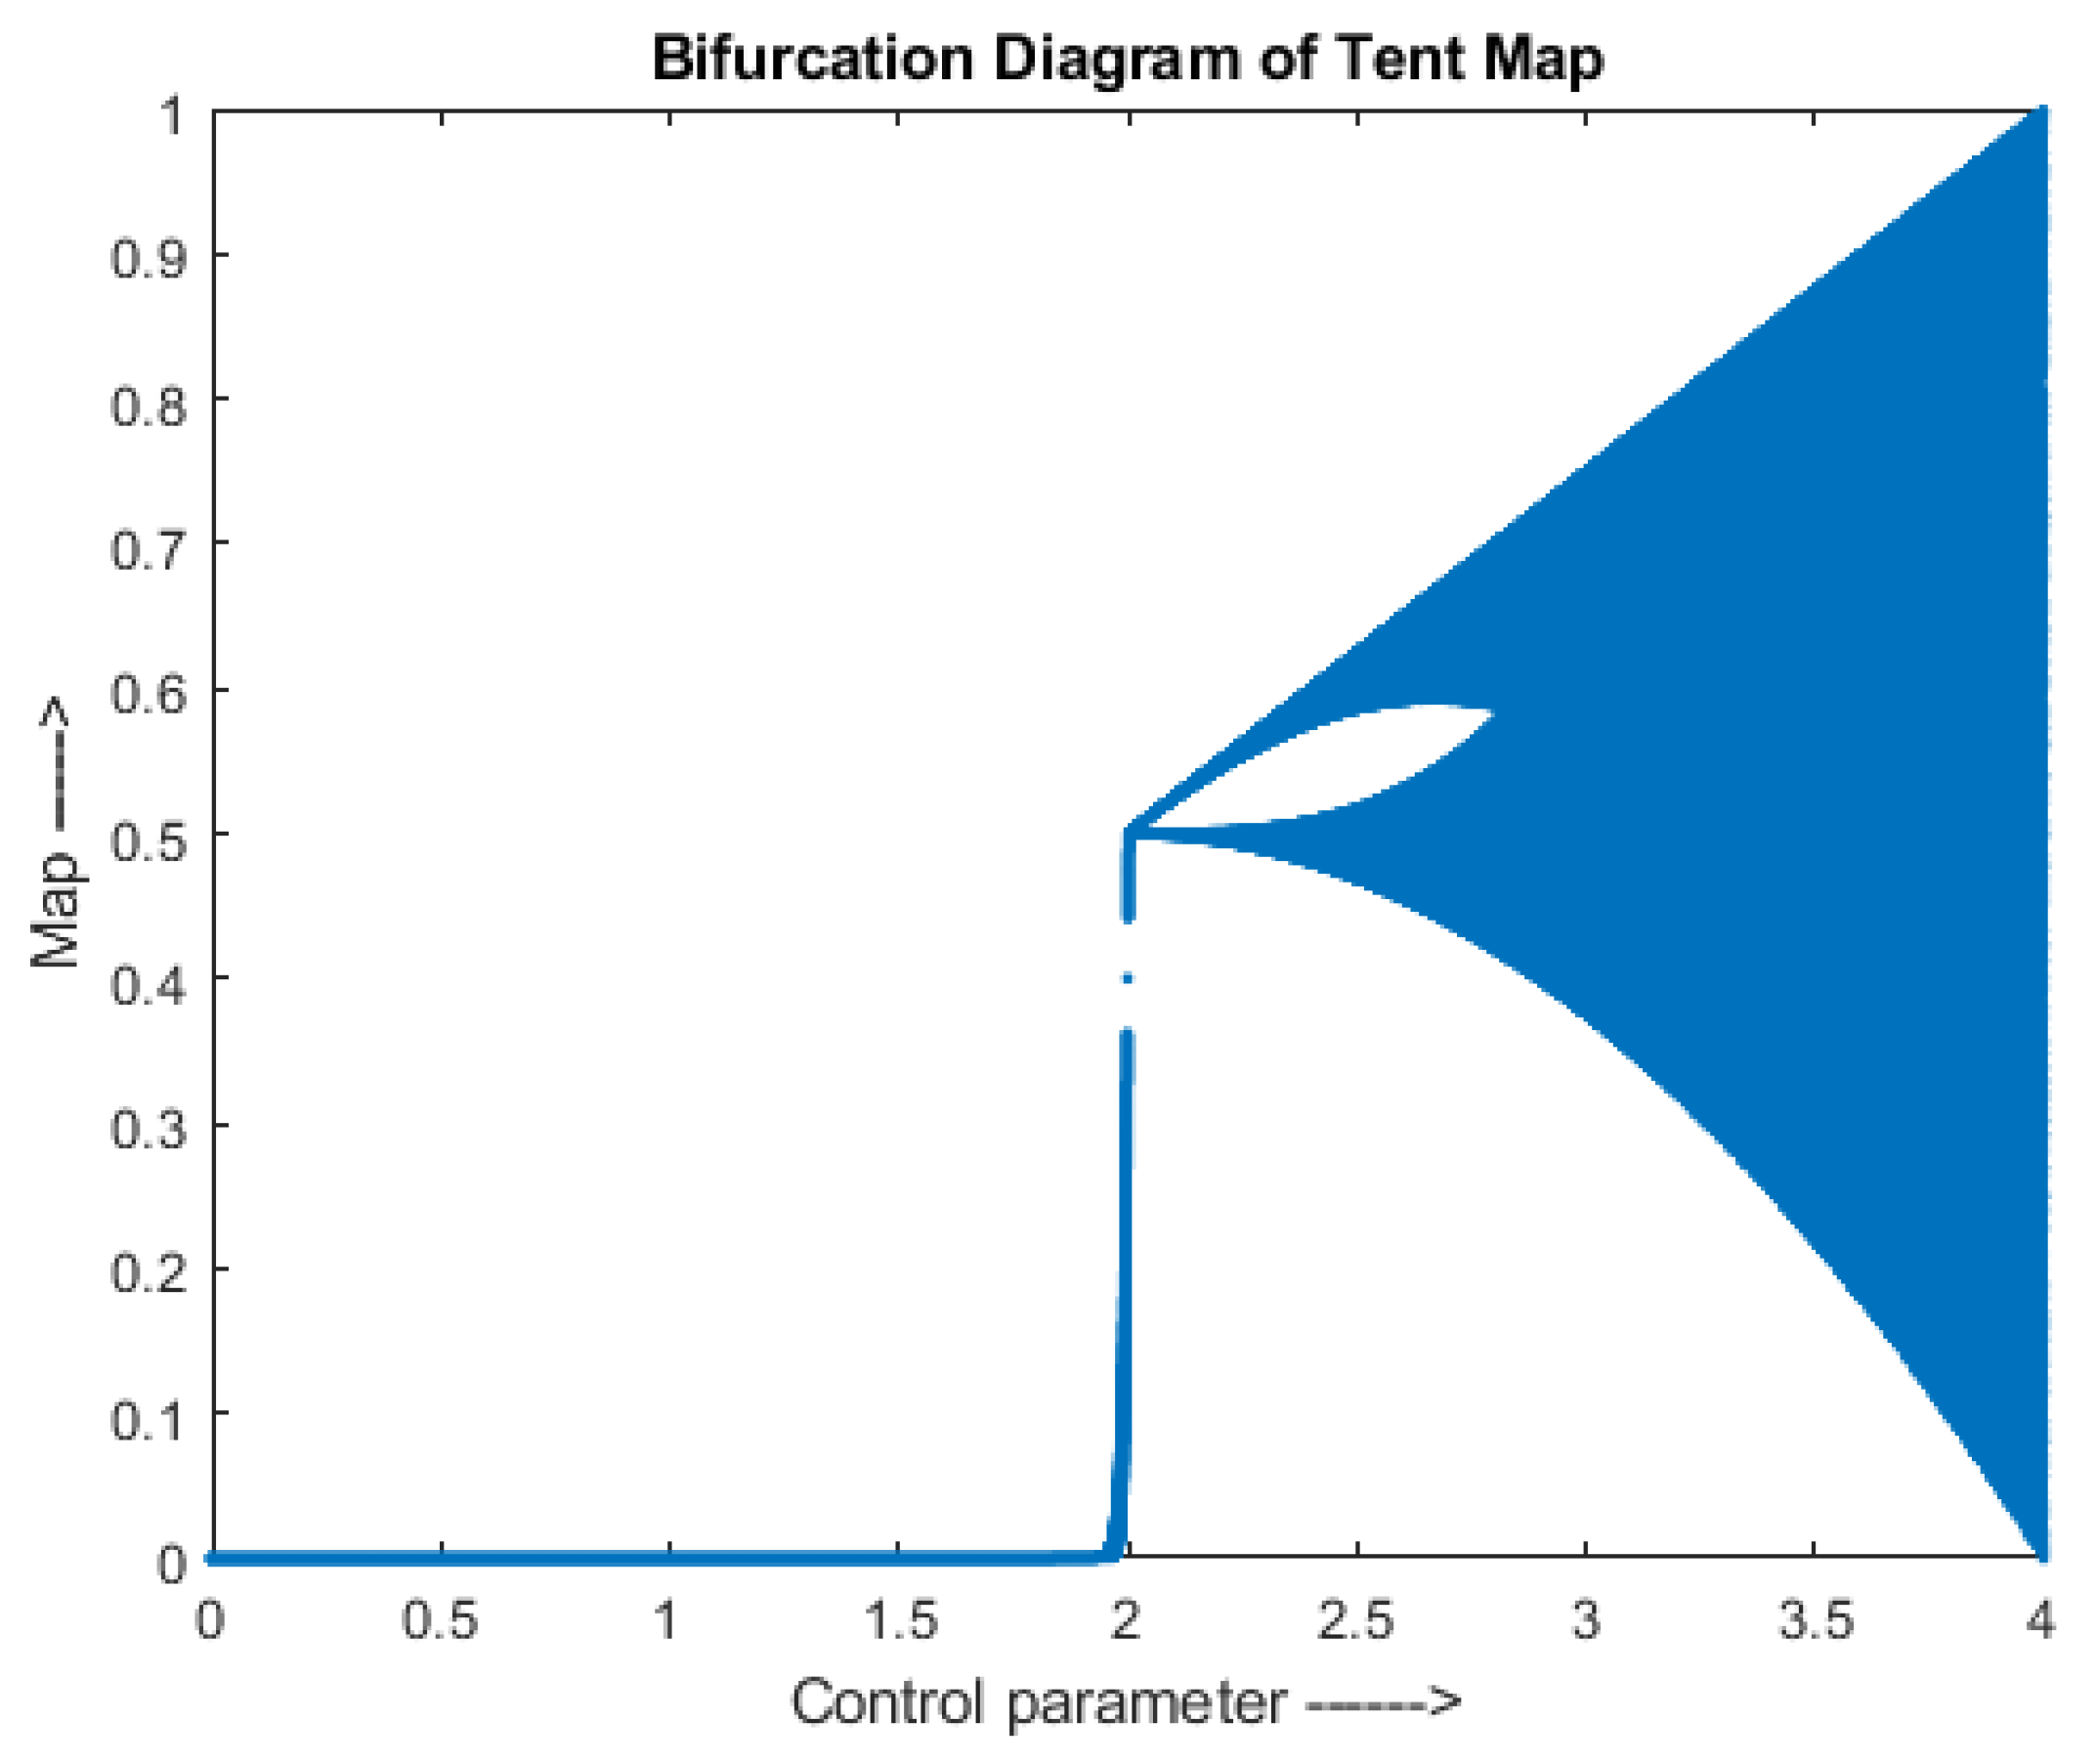
2.3.2. Tent Map
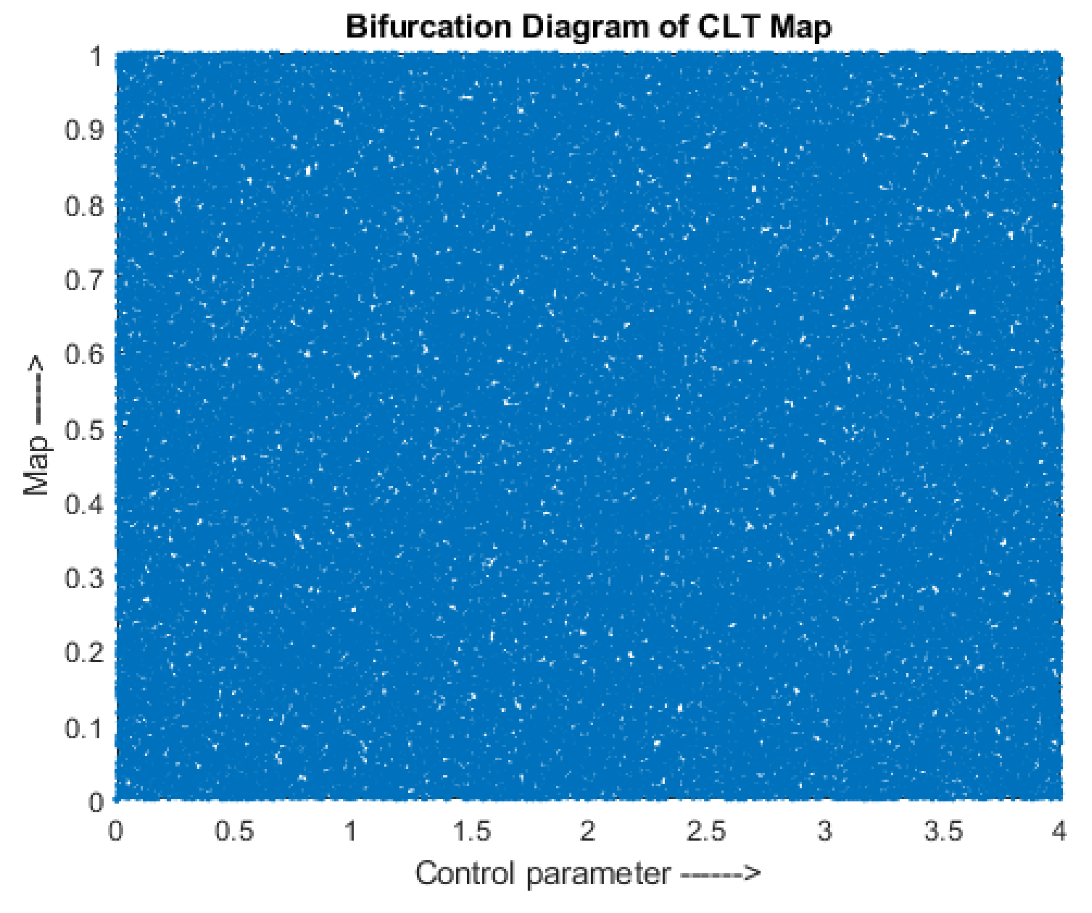
2.3.3. Combined Chaotic Map: Combined Logistic-Tent (CLT) Map
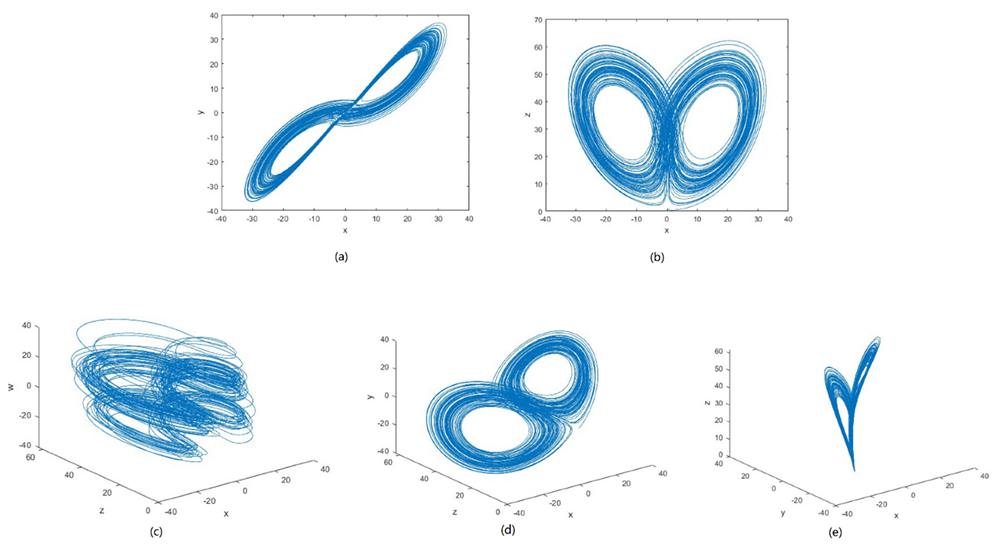
2.3.4. Hyper-Chaos System: 5D Hyper-Chaotic Map
2.4. DNA Computing for Cryptography
3. Proposed Image Encryption Methodology
3.1. Phase 1
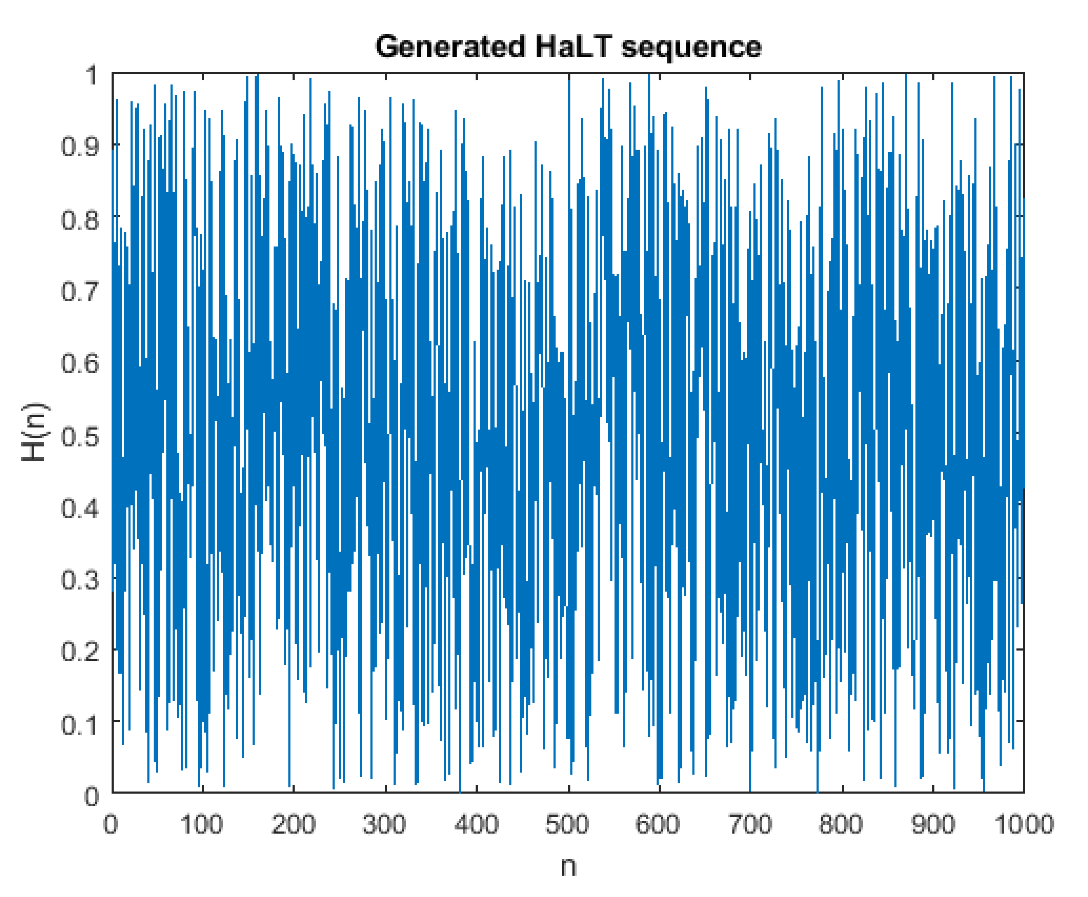
3.1.1. Proposed HaLT Map
3.1.2. Bit-Level Operations
3.1.3. Seed Generation Using Hash Functions
3.2. Phase 2
3.2.1. D Hyper-Chaotic Map
3.2.2. Key Image Generation
3.2.3. DNA Computing
- DNA Encoding
- DNA Diffusion
- DNA Encoding
3.3. Proposed Algorithm Steps
| Algorithm 1. Proposed Image Encryption Algorithm |
| Input—Gray Image of size , control parameters for hyper-chaotic map, (,, , , , , , ) = (35, 7, 35, −5, 10.6, 1, 5, 0.05), parameters for logistic map , parameters for tent map , parameters for Halton sequence . Output—Encrypted Gray Image of size . Step 1:-Input gray scale image of size . Step 2:-Initialize CLT map shown in Equation (6) with control parameters and initial condition, . Iterate it for finite number of times to remove transient effect. Continue iterating the map for times. This process created a chaotic sequence of size . Step 3:-Generate Halton sequence using Equations (1) and (2) of size . Step 4:-Combine the CLT map and Halton sequence, using Equation (5), to form a new chaotic sequence (HaLT map) of size . Where is the CLT map and is the Halton sequence. Step 5:-As shown in Figure 9 (Modified Quantization Unit), double sort the HaLT sequence and map it with the input image to get scrambled image . Step 6:-Using bit plane slicing technique extract the eight planes of the image . Step 7:-Intra-bit scrambling—Swap odd and even number of planes, as shown in Figure 9. Step 8:-Inter-bit scrambling—Flip all the even plane pixels up to down, using Equation (8). Step 9:-Convert the values from binary to decimal and reshape the matrix to size to obtain a final scrambled image . Step 10:-Generate three vectors (sum of all rows), (sum of all columns) and (sum of all pixels across diagonal) of both original image and scrambled image . Step 11:-Apply MD5 hash function on , and using Equation (9). Further apply SHA256 hash function, as given in Equation (10), to generate two 32-bit hash values and . Using Equation (11), XOR and to obtain . Step 12:-Using for initial seed calculation, as given in Equation (12), and control parameters as (,, , , , , , ) = (35, 7, 35, −5, 10.6, 1, 5, 0.05) generate 5D Hyper-Chaotic map given in Equation (7). Iterate the map for finite number of times to remove transient effect. Continue iterating the map for times. This process created a chaotic sequence of size . Step 13:-Key Image Generation—Normalize all five chaotic sequences in the range 0 to 255, using Equation (14). Key Image of size [] was formed, using Equation (15). Step 14:-The sequences obtained from Step 12 were normalized in the range 0 to 1, using Equation (13). Step 15:-DNA Encoding (level 1)—To randomly choose the eight DNA rules for encoding the scrambled image and key image , the sequence was normalized into values from 1 to 8, using Equation (16). The normalized sequence randomly chose a rule and encoded and to obtain and . Step 16:-Pixel permutation—Modified quantization unit was applied on the sequence and mapped with the encoded image to obtain a permutated image . Step 17:-DNA Diffusion—To randomly choose the seven DNA operations to apply between and , sequence was normalized in the range 1 to 7, using Equation (17). The normalized sequence randomly chose an operation to be performed between and to obtain a diffused image . Step 18:-DNA Encoding (level 2)—Vector was used to encode the diffused image to get the final encrypted image . |
4. Results and Discussion
4.1. Simulation Results of Proposed HaLT Map
4.1.1. NIST Test
4.1.2. Correlation
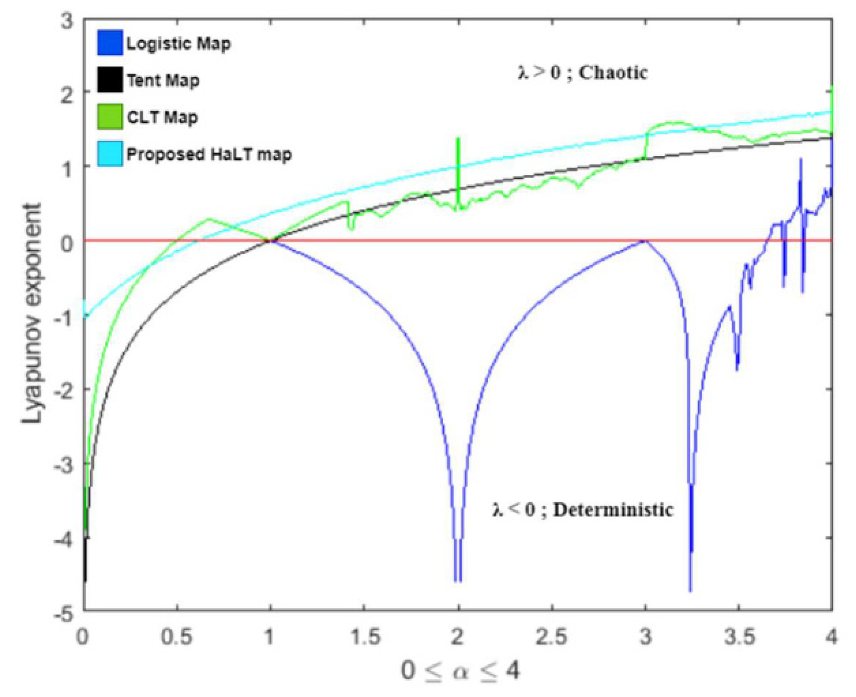
4.1.3. Lyapunov Exponent Spectrum
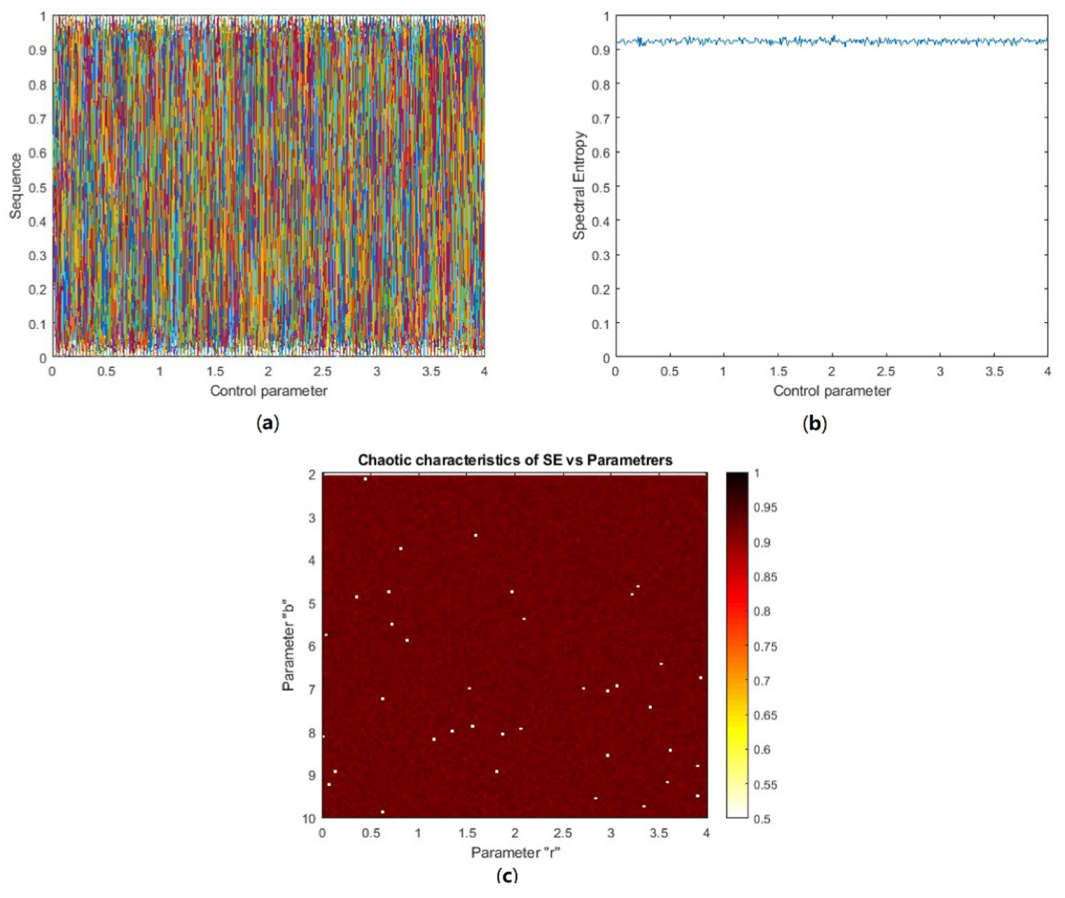
4.1.4. Information Spectral Entropy Analysis
4.2. Simulation Results of Proposed Image Encryption Algorithm
4.2.1. Statistical Attacks
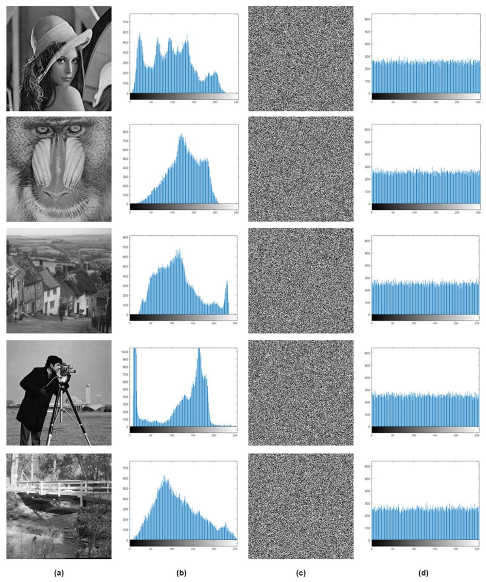
- Histogram Analysis
- Correlation Coefficient
- Chi-square Analysis
- Information Entropy
- Deviation from Ideality
4.2.2. Differential Attacks
- NPCR
- UACI
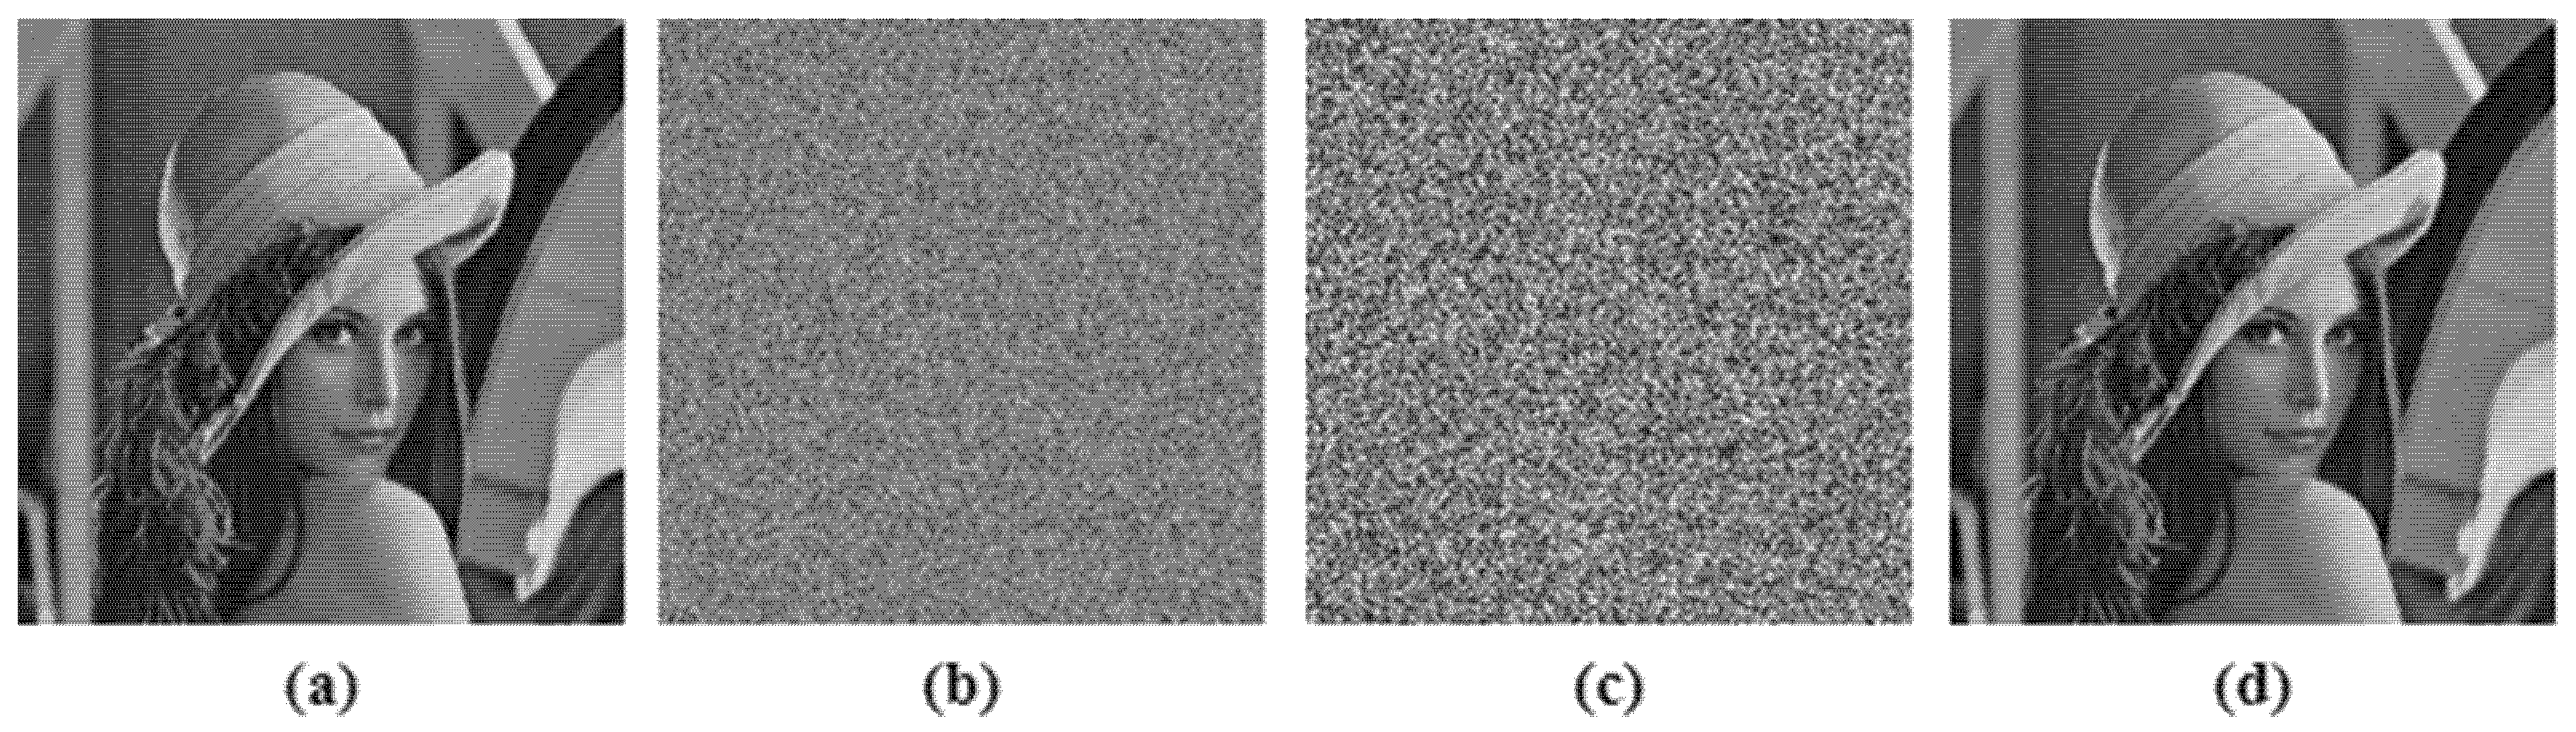
4.2.3. Key Space and Key Sensitivity Analysis
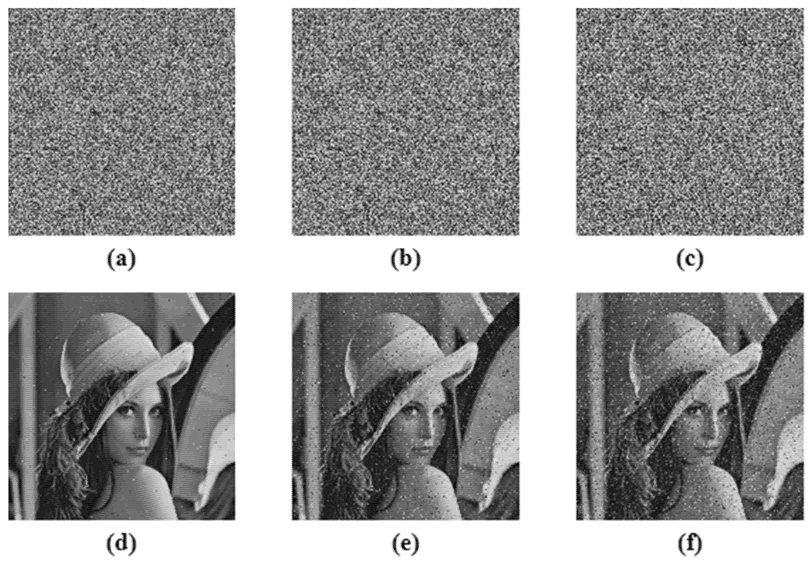
4.2.4. Robustness Analysis
4.2.5. Cryptanalytic Attacks
- Ciphertext Only Analysis (COA): In this type of attack, the attacker knows some ciphertext and tries to find the encryption key and plain text.
- Chosen Plaintext Analysis (CPA): In this, the attacker knows the encryption algorithm, chooses a random plaintext and generates a cipher text to find the encryption key.
- Known Plaintext Analysis (KPA): In this, the attacker maps the known plain text and cipher text to figure out the encryption key.
- Chosen Ciphertext Analysis (CCA): Here the attacker knows the decryption algorithm and tries to find the plain text by using a random cipher text.
4.2.6. Execution Time Analysis
5. Conclusions
Author Contributions
Funding
Institutional Review Board Statement
Informed Consent Statement
Data Availability Statement
Conflicts of Interest
References
- Stallings, W. Cryptography and Network Security: Principles and Practice, 5th ed.; Prentice Hall Press: Upper Saddle River, NJ, USA, 2010. [Google Scholar]
- Wang, X.; Feng, L.; Zhao, H. Fast image encryption algorithm based on parallel computing system. Inf. Sci. 2019, 486, 340–358. [Google Scholar] [CrossRef]
- Wang, X.; Yang, J. A privacy image encryption algorithm based on piecewise coupled map lattice with multi dynamic coupling coefficient. Inf. Sci. 2021, 569, 217–240. [Google Scholar] [CrossRef]
- Wang, X.; Liu, P. A New Full Chaos Coupled Mapping Lattice and Its Application in Privacy Image Encryption. IEEE Trans. Circuits Syst. I Regul. Pap. 2022, 69, 1291–1301. [Google Scholar] [CrossRef]
- Wong, K.W. Image Encryption Using Chaotic Maps. In Intelligent Computing Based on Chaos; Springer: Berlin/Heidelberg, Germany, 2009; Volume 184, pp. 333–354. [Google Scholar]
- Patel, S.; Thanikaiselvan, V.; Pelusi, D.; Nagaraj, B.; Arunkumar, R.; Amirtharajan, R. Colour image encryption based on customized neural network and DNA encoding. Neural Comput. Appl. 2021, 33, 14533–14550. [Google Scholar] [CrossRef]
- Wang, X.; Gao, S. Image encryption algorithm based on the matrix semi-tensor product with a compound secret key produced by a Boolean network. Inf. Sci. 2020, 539, 195–214. [Google Scholar] [CrossRef]
- Wang, X.; Gao, S. Image encryption algorithm for synchronously updating Boolean networks based on matrix semi-tensor product theory. Inf. Sci. 2020, 507, 16–36. [Google Scholar] [CrossRef]
- Xian, Y.; Wang, X. Fractal sorting matrix and its application on chaotic image encryption. Inf. Sci. 2021, 547, 1154–1169. [Google Scholar] [CrossRef]
- Liu, H.; Wang, X. Color image encryption based on one-time keys and robust chaotic maps. Comput. Math. Appl. 2010, 59, 3320–3327. [Google Scholar] [CrossRef] [Green Version]
- Liu, H.; Wang, X. Color image encryption using spatial bit-level permutation and high-dimension chaotic system. Opt. Commun. 2011, 284, 3895–3903. [Google Scholar] [CrossRef]
- Liu, H.; Wang, X.; Kadir, A. Image encryption using DNA complementary rule and chaotic maps. Appl. Soft Comput. 2012, 12, 1457–1466. [Google Scholar] [CrossRef]
- Lorenz, E.N. Deterministic nonperiodic flow. J. Atmos. Sci. 1963, 20, 130–141. [Google Scholar] [CrossRef] [Green Version]
- Fang, D.; Sun, S. A new secure image encryption algorithm based on a 5D hyperchaotic map. PLoS ONE 2020, 15, e0242110. [Google Scholar] [CrossRef]
- Rossler, O. An equation for hyperchaos. Phys. Lett. A 1979, 71, 155–157. [Google Scholar] [CrossRef]
- Kapitaniak, T.; Chua, L.O. Hyperchaotic Attractors of Unidirectionally-Coupled Chua’s Circuits. Int. J. Bifurc. Chaos 1994, 4, 477–482. [Google Scholar] [CrossRef]
- Tong, X.; Chen, P. A joint image lossless compression and encryption method based on chaotic map. Multimed. Tools Appl. 2017, 76, 13995–14020. [Google Scholar] [CrossRef]
- Zhang, Y.; Li, X. A fast image encryption scheme based on integer wavelet and hyper-chaotic system. In Proceedings of the IEEE International Conference on Artificial Intelligence and Big Data (ICAIBD), Chengdu, China, 26–28 May 2018; pp. 139–143. [Google Scholar]
- Peng, Z.; Yu, W.; Wang, J.; Zhou, Z.; Chen, J.; Zhong, G. Secure Communication Based on Microcontroller Unit with a Novel Five-Dimensional Hyperchaotic System. Arab. J. Sci. Eng. 2022, 47, 813–828. [Google Scholar] [CrossRef]
- Yang, Q.; Bai, M. A new 5D hyperchaotic system based on modified generalized Lorenz system. Nonlinear Dyn. 2017, 88, 189–221. [Google Scholar] [CrossRef]
- Wolf, A.; Swift, J.B.; Swinney, H.L.; Vastano, J.A. Determining Lyapunov exponents from a time series. Phys. D Nonlinear Phenom. 1985, 16, 285–317. [Google Scholar] [CrossRef] [Green Version]
- Yang, Q.; Chen, C. A 5D Hyperchaotic System with Three Positive Lyapunov Exponents Coined. Int. J. Bifurc. Chaos 2013, 23, 1350109. [Google Scholar] [CrossRef]
- Hu, G. Generating Hyperchaotic Attractors with Three Positive Lyapunov Exponents via State Feedback control. Int. J. Bifurc. Chaos 2009, 19, 651–660. [Google Scholar] [CrossRef]
- Wang, X.-Y.; Yang, L.; Liu, R.; Kadir, A. A chaotic image encryption algorithm based on perceptron model. Nonlinear Dyn. 2010, 62, 615–621. [Google Scholar] [CrossRef]
- Wang, X.; Liu, C.; Jiang, D. A novel triple-image encryption and hiding algorithm based on chaos, compressive sensing and 3D DCT. Inf. Sci. 2021, 574, 505–527. [Google Scholar] [CrossRef]
- Halton, J.H. On the efficiency of certain quasi-random sequences of points in evaluating multi-dimensional integrals. Numer. Math. 1960, 2, 84–90. [Google Scholar] [CrossRef]
- Ostadkalayeh, A.M.; Vajargah, B.F. The scrambles of Halton sequence and thier weaknesses. J. Hyperstruct. 2021, 9, 40–53. [Google Scholar]
- Ökten, G.; Liu, Y. Randomized quasi-Monte Carlo methods in global sensitivity analysis. Reliab. Eng. Syst. Saf. 2021, 210, 107520. [Google Scholar] [CrossRef]
- Es-Sabry, M.; El Akkad, N.; Merras, M.; Saaidi, A.; Satori, K. A new image encryption algorithm using random numbers generation of two matrices and bit-shift operators. Soft Comput. 2020, 24, 3829–3848. [Google Scholar] [CrossRef]
- Zhang, L.; Zhang, X. Multiple-image encryption algorithm based on bit planes and chaos. Multimed. Tools Appl. 2020, 79, 20753–20771. [Google Scholar] [CrossRef]
- Barik, R.C.; Changder, S. A novel and efficient amino acid codon based medical image encryption scheme colligating multiple chaotic maps. Multimed. Tools Appl. 2021, 80, 10723–10760. [Google Scholar] [CrossRef]
- Zhou, S.; Wang, B.; Zheng, X.; Zhou, C. An Image Encryption Scheme Based on DNA Computing and Cellular Automata. Discret. Dyn. Nat. Soc. 2016, 2016, 5408529. [Google Scholar] [CrossRef] [Green Version]
- Nandy, N.; Banerjee, D.; Pradhan, C. Color image encryption using DNA based cryptography. Int. J. Inf. Technol. 2021, 13, 533–540. [Google Scholar] [CrossRef]
- Chai, X.; Fu, X.; Gan, Z.; Lu, Y.; Chen, Y. A color image cryptosystem based on dynamic DNA encryption and chaos. Signal Processing 2019, 155, 44–62. [Google Scholar] [CrossRef]
- Tian, J.; Lu, Y.; Zuo, X.; Liu, Y.; Qiao, B.; Fan, M.; Ge, Q.; Fan, S. A novel image encryption algorithm using PWLCM map-based CML chaotic system and dynamic DNA encryption. Multimed. Tools Appl. 2021, 80, 32841–32861. [Google Scholar] [CrossRef]
- Banu, S.A.; Amirtharajan, R. A robust medical image encryption in dual domain: Chaos-DNA-IWT combined approach. Med. Biol. Eng. Comput. 2020, 58, 1445–1458. [Google Scholar] [CrossRef] [PubMed]
- Ravichandran, D.; Banu, S.A.; Murthy, B.K.; Balasubramanian, V.; Fathima, S.; Amirtharajan, R. An efficient medical image encryption using hybrid DNA computing and chaos in transform domain. Med. Biol. Eng. Comput. 2021, 59, 589–605. [Google Scholar] [CrossRef]
- Guan, M.; Yang, X.; Hu, W. Chaotic image encryption algorithm using frequency-domain DNA encoding. IET Image Processing 2019, 13, 1535–1539. [Google Scholar] [CrossRef]
- Chai, X.; Gan, Z.; Lu, Y.; Chen, Y.; Han, D. A novel image encryption algorithm based on the chaotic system and DNA computing. Int. J. Mod. Phys. C 2017, 28, 1750069. [Google Scholar] [CrossRef]
- Li, T.; Yang, M.; Wu, J.; Jing, X. A Novel Image Encryption Algorithm Based on a Fractional-Order Hyperchaotic System and DNA Computing. Complexity 2017, 2017, 9010251. [Google Scholar] [CrossRef] [Green Version]
- Zefreh, E.Z. An image encryption scheme based on a hybrid model of DNA computing, chaotic systems and hash functions. Multimed. Tools Appl. 2020, 79, 24993–25022. [Google Scholar] [CrossRef]
- Vulpiani, A.; Cecconi, F.; Cencini, M. Chaos: From Simple Models to Complex Systems; Series on Advances in Statistical Mechanics; World Scientific Publishing Co. Pte. Ltd.: Singapore, 2009; Volume 17. [Google Scholar]
- Liu, L.; Du, C.; Zhang, X.; Li, J.; Shi, S. Dynamics and Entropy Analysis for a New 4-D Hyperchaotic System with Coexisting Hidden Attractors. Entropy 2019, 21, 287. [Google Scholar] [CrossRef] [Green Version]
- SIPI Image Database—Misc. Available online: http://sipi.usc.edu/database/database.php?volume=misc (accessed on 20 February 2022).
- Hu, T.; Liu, Y.; Gong, L.-H.; Ouyang, C.-J. An image encryption scheme combining chaos with cycle operation for DNA sequences. Nonlinear Dyn. 2016, 87, 51–66. [Google Scholar] [CrossRef]
- Chai, X.; Gan, Z.; Yuan, K.; Chen, Y.; Liu, X. A novel image encryption scheme based on DNA sequence operations and chaotic systems. Neural Comput. Appl. 2019, 31, 219–237. [Google Scholar] [CrossRef]
- Hosny, K.; Kamal, S.; Darwish, M.; Papakostas, G. New Image Encryption Algorithm Using Hyperchaotic System and Fibonacci Q-Matrix. Electronics 2021, 10, 1066. [Google Scholar] [CrossRef]
- Girdhar, A.; Kapur, H.; Kumar, V. A novel grayscale image encryption approach based on chaotic maps and image blocks. Appl. Phys. A 2021, 127, 39. [Google Scholar] [CrossRef]
- Yan, X.; Wang, X.; Xian, Y. Chaotic image encryption algorithm based on arithmetic sequence scrambling model and DNA encoding operation. Multimed. Tools Appl. 2021, 80, 10949–10983. [Google Scholar] [CrossRef]
- Zhang, Y.-Q.; Wang, X.-Y. A symmetric image encryption algorithm based on mixed linear–nonlinear coupled map lattice. Inf. Sci. 2014, 273, 329–351. [Google Scholar] [CrossRef]
- Wang, X.-Y.; Zhang, Y.-Q.; Bao, X.-M. A novel chaotic image encryption scheme using DNA sequence operations. Opt. Lasers Eng. 2015, 73, 53–61. [Google Scholar] [CrossRef]
- Ping, P.; Fan, J.; Mao, Y.; Xu, F.; Gao, J. A Chaos Based Image Encryption Scheme Using Digit-Level Permutation and Block Diffusion. IEEE Access 2018, 6, 67581–67593. [Google Scholar] [CrossRef]
- Wang, X.; Liu, L.; Zhang, Y. A novel chaotic block image encryption algorithm based on dynamic random growth technique. Opt. Lasers Eng. 2015, 66, 10–18. [Google Scholar] [CrossRef]
- Zhang, Y.-Q.; Wang, X.-Y. A new image encryption algorithm based on non-adjacent coupled map lattices. Appl. Soft Comput. 2015, 26, 10–20. [Google Scholar] [CrossRef]
- Wang, X.; Teng, L.; Qin, X. A novel colour image encryption algorithm based on chaos. Signal Processing 2012, 92, 1101–1108. [Google Scholar] [CrossRef]
- Ping, P.; Xu, F.; Mao, Y.; Wang, Z. Designing permutation–substitution image encryption networks with Henon map. Neurocomputing 2018, 283, 53–63. [Google Scholar] [CrossRef]


| Binary | Rule 1 | Rule 2 | Rule 3 | Rule 4 | Rule 5 | Rule 6 | Rule 7 | Rule 8 |
|---|---|---|---|---|---|---|---|---|
| 00 | A | A | T | T | C | C | G | G |
| 01 | C | G | C | G | A | T | A | T |
| 10 | G | C | G | C | T | A | T | A |
| 11 | T | T | A | A | G | G | C | C |
| NIST Test | Generated HaLT Map | Average of 7 Encrypted Images | ||
|---|---|---|---|---|
| p-Value | Result | p-Value | Result | |
| Frequency | 0.45325 | Pass | 0.46518 | Pass |
| Block Frequency | 0.28364 | Pass | 0.67522 | Pass |
| Run | 0.90276 | Pass | 0.62306 | Pass |
| Longest Run | 0.56939 | Pass | 0.64648 | Pass |
| Rank | 0.91141 | Pass | 0.53462 | Pass |
| DFT | 0.84651 | Pass | 0.35814 | Pass |
| Overlapping Template | 0.71166 | Pass | 0.40358 | Pass |
| Non-Overlapping Template | 0.84651 | Pass | 0.52204 | Pass |
| Linear Complexity | 0.94350 | Pass | 0.35856 | Pass |
| Serial | 0.78696 | Pass | 0.46366 | Pass |
| Approximate Entropy | 0.96258 | Pass | 0.35566 | Pass |
| Cumulative Sums (Forward) | 0.61853 | Pass | 0.52716 | Pass |
| Cumulative Sums (Reverse) | 0.39183 | Pass | 0.55648 | Pass |
| Random Excursions: Chi-Squared | 0.86500 | Pass | 0.89098 | Pass |
| Random Excursions Variant: Counts | 0.42371 | Pass | 0.93064 | Pass |
| Lena | Baboon | Goldhill | Cameraman | Bridge | ||
|---|---|---|---|---|---|---|
| Encrypted | 5460.9 | 5471.01 | 5480.8 | 5455.01 | 5469.6 | |
| b | variance | 5256.2 | 5360.3 | 5431.5 | 5361.5 | 5270.5 |
| % change | 3.7 | 2.02 | 0.89 | 1.71 | 3.64 | |
| µ | variance | 5350.8 | 5272.6 | 5398.3 | 5500.4 | 5342.1 |
| % change | 2.01 | 3.6 | 1.50 | 0.83 | 2.33 | |
| α | variance | 5300.4 | 5479.9 | 5429.5 | 5276.4 | 5398.1 |
| % change | 2.93 | 0.16 | 0.93 | 3.27 | 1.29 | |
| p(0) | variance | 5411.3 | 5358.4 | 5269.1 | 5385.7 | 5210.6 |
| % change | 0.908 | 2.05 | 3.86 | 1.27 | 4.73 | |
| S | variance | 5201.3 | 4975.2 | 4895.7 | 5015.01 | 4830.4 |
| % change | 4.75 | 9.06 | 10.67 | 8.06 | 11.68 | |
| Metric | Images | Correlation | ||
|---|---|---|---|---|
| Horizontal | Vertical | Diagonal | ||
| Proposed | Lena | 0.0034 | −0.0052 | 0.0066 |
| Ref. [45] | 0.0197 | −0.0196 | 0.0088 | |
| Ref. [41] | −0.0004 | 0.0037 | −0.0378 | |
| Ref. [18] | 0.0100 | 0.0083 | −0.0143 | |
| Ref. [38] | 0.0011 | −0.0001 | −0.0002 | |
| Ref. [35] | 0.0016 | −0.0028 | −0.0001 | |
| Proposed | Baboon | 0.0328 | −0.0324 | 0.0065 |
| Ref. [45] | 0.0119 | 0.0014 | −0.0055 | |
| Ref. [41] | 0.0124 | −0.0118 | −0.0215 | |
| Ref. [18] | −0.0151 | 0.0006 | 0.0033 | |
| Ref. [38] | −0.0027 | −0.0040 | 0.0047 | |
| Proposed | Cameraman | 0.0026 | 0.0108 | −0.0111 |
| Ref. [45] | 0.0119 | 0.0175 | −0.0179 | |
| Ref. [41] | −0.0061 | 0.0058 | 0.0166 | |
| Proposed | Black | 0.0125 | 0.0105 | −0.0019 |
| Ref. [36] | 0.0041 | 0.0063 | 0.0009 | |
| Proposed | White | 0.0217 | 0.0046 | −0.0106 |
| Ref. [36] | −0.0028 | −0.0005 | 0.0032 | |
| Proposed | Goldhill | 0.0014 | 0.0101 | −0.0166 |
| Bridge | 0.0325 | 0.0061 | 0.0050 | |
| Images | Chi-Square | p-Value | 5% = 293.2478 | 1% = 310.457 |
|---|---|---|---|---|
| Lena | 242.1328 | 0.7088 | Pass | Pass |
| Baboon | 253.9688 | 0.5066 | Pass | Pass |
| Goldhill | 246.0313 | 0.6451 | Pass | Pass |
| Cameraman | 240.9297 | 0.7276 | Pass | Pass |
| Bridge | 245.7344 | 0.6502 | Pass | Pass |
| White | 260.7422 | 0.3890 | Pass | Pass |
| Black | 281.1328 | 0.1252 | Pass | Pass |
| Metric | Images | Entropy | |
|---|---|---|---|
| Original | Encrypted | ||
| Proposed | Lena | 7.568285 | 7.997523 |
| Ref. [45] | 7.568285 | 7.9975 | |
| Ref. [41] | 7.568285 | 7.9993 | |
| Ref. [18] | 7.568285 | 7.9981 | |
| Ref. [38] | 7.568285 | 7.9923 | |
| Ref. [35] | 7.568285 | 7.9977 | |
| Ref. [51] | 7.568285 | 7.9970 | |
| Proposed | Baboon | 7.228317 | 7.997656 |
| Ref. [45] | 7.228317 | 7.9975 | |
| Ref. [41] | 7.228317 | 7.9993 | |
| Ref. [18] | 7.228317 | 7.9983 | |
| Ref. [38] | 7.228317 | 7.9925 | |
| Ref. [35] | 7.228317 | 7.9973 | |
| Ref. [51] | 7.228317 | 7.9969 | |
| Proposed | Cameraman | 7.009716 | 7.997338 |
| Ref. [45] | 7.009716 | 7.9972 | |
| Ref. [41] | 7.009716 | 7.9992 | |
| Ref. [51] | 7.009716 | 7.9972 | |
| Proposed | Black | 0 | 7.996997 |
| Ref. [36] | 0 | 7.9974 | |
| Proposed | White | 0 | 7.997839 |
| Ref. [36] | 0 | 7.9969 | |
| Proposed | Goldhill | 7.471596 | 7.997290 |
| Bridge | 7.668557 | 7.997304 | |
| Images | Deviation |
|---|---|
| Lena | 0.0461 |
| Baboon | 0.0443 |
| Goldhill | 0.0485 |
| Cameraman | 0.0485 |
| Bridge | 0.0487 |
| White | 0.0498 |
| Black | 0.0523 |
| Metric | Images | NPCR (%) | UACI (%) | Critical Values (NPCR) 5% = 99.5693 1% = 99.5527 0.1% = 99.5341 | Critical Values (UACI) 5% = + = 33.2824 - = 33.6447 1% = + = 33.2255 - = 33.7016 0.1% = + = 33.1594 - = 33.7677 |
|---|---|---|---|---|---|
| Proposed | Lena | 99.6307 | 33.4740 | Pass | Pass |
| Ref. [45] | 99.5392 | 33.2406 | Pass | Fail | |
| Ref. [41] | 99.6000 | 33.4500 | Pass | Pass | |
| Ref. [18] | 99.6141 | 33.4473 | Pass | Pass | |
| Ref. [38] | 99.6387 | 33.6129 | Pass | Pass | |
| Ref. [35] | 99.5911 | 33.4488 | Pass | Pass | |
| Ref. [53] | 99.5864 | 33.4808 | Pass | Pass | |
| Proposed | Baboon | 99.6117 | 33.5345 | Pass | Pass |
| Ref. [45] | 99.5496 | 33.2543 | Pass | Fail | |
| Ref. [41] | 99.6000 | 33.4400 | Pass | Pass | |
| Ref. [18] | 99.6100 | 33.4621 | Pass | Pass | |
| Ref. [38] | 99.6727 | 33.2071 | Pass | Fail | |
| Ref. [35] | 99.6078 | 33.5766 | Pass | Pass | |
| Proposed | Cameraman | 99.6143 | 33.4792 | Pass | Pass |
| Ref. [45] | 99.5453 | 33.2742 | Pass | Fail | |
| Ref. [41] | 99.5900 | 33.4200 | Pass | Pass | |
| Ref. [35] | 99.6153 | 33.4216 | Pass | Pass | |
| Proposed | Goldhill | 99.6356 | 33.4663 | Pass | Pass |
| Bridge | 99.6278 | 33.4641 | Pass | Pass | |
| White | 99.6102 | 33.4644 | Pass | Pass | |
| Black | 99.6140 | 33.4670 | Pass | Pass |
| Metric | Input Images | Crop | Noise | ||||
|---|---|---|---|---|---|---|---|
| 6.25% | 25% | 50% | 0.005 | 0.05 | 0.1 | ||
| Proposed | Lena | 20.2853 | 14.5627 | 11.9464 | 31.5440 | 21.8211 | 18.8376 |
| Ref. [45] | 20.3668 | 14.3939 | 11.3895 | 31.2751 | 21.2502 | 18.3147 | |
| Ref. [41] | 20.3469 | 14.3600 | 11.3754 | 31.4956 | 21.3079 | 18.2648 | |
| Ref. [46] | 20.3745 | 14.4533 | 11.4365 | 30.2494 | 20.3405 | 17.4711 | |
| Ref. [47] | 16.7418 | - | - | 24.4812 | - | - | |
| Proposed | Baboon | 20.8067 | 14.3976 | 11.6392 | 31.6535 | 21.8956 | 18.9134 |
| Ref. [45] | 21.3753 | 15.3844 | 12.3608 | 32.4933 | 22.2653 | 19.2684 | |
| Ref. [41] | 21.2741 | 15.2579 | 12.2990 | 32.2013 | 22.2380 | 19.2031 | |
| Ref. [46] | 21.2852 | 15.3401 | 12.3520 | 31.3731 | 21.2675 | 18.3223 | |
| Ref. [47] | 18.5936 | - | - | 30.5936 | - | - | |
| Proposed | Cameraman | 20.5147 | 14.8108 | 11.7425 | 31.1133 | 21.5995 | 18.5968 |
| Ref. [45] | 20.7255 | 14.5872 | 11.5183 | 31.6209 | 21.5922 | 18.6581 | |
| Ref. [41] | 20.6414 | 14.6259 | 11.5914 | 31.0920 | 21.2046 | 18.2498 | |
| Ref. [46] | 20.3855 | 14.3947 | 11.4288 | 30.8824 | 20.7612 | 17.6897 | |
| Proposed | Goldhill | 20.8903 | 15.0199 | 12.3222 | 31.6763 | 21.9825 | 18.9869 |
| Bridge | 20.2805 | 14.4503 | 11.5082 | 30.9841 | 20.9767 | 17.8936 | |
| White | 19.9051 | 14.2204 | 11.0333 | 30.8069 | 20.5284 | 17.2869 | |
| Black | 19.9847 | 13.9664 | 11.0583 | 30.9237 | 20.5690 | 17.3458 | |
| Metric | Input Images | Encryption (s) | Decryption (s) |
|---|---|---|---|
| Proposed | Lena | 0.329276 | 0.217033 |
| Ref. [48] | 0.40585 | - | |
| Ref. [49] | 1.7351 | 3.4689 | |
| Ref. [56] | 0.3440 | - | |
| Ref. [46] | 10.8232 | 10.6952 | |
| Ref. [45] | 14.8401 | 14.9266 | |
| Proposed | Baboon | 0.319188 | 0.207845 |
| Ref. [46] | 10.7477 | 10.7146 | |
| Ref. [45] | 14.9134 | 14.9678 | |
| Proposed | Cameraman | 0.327988 | 0.220698 |
| Ref. [49] | 1.7223 | 2.9887 | |
| Ref. [46] | 10.8053 | 10.7977 | |
| Ref. [45] | 15.0087 | 15.2032 | |
| Proposed | Goldhill | 0.333641 | 0.223227 |
| Bridge | 0.339475 | 0.222850 | |
| White | 0.331611 | 0.214559 | |
| Black | 0.313327 | 0.203875 |
Publisher’s Note: MDPI stays neutral with regard to jurisdictional claims in published maps and institutional affiliations. |
© 2022 by the authors. Licensee MDPI, Basel, Switzerland. This article is an open access article distributed under the terms and conditions of the Creative Commons Attribution (CC BY) license (https://creativecommons.org/licenses/by/4.0/).
Share and Cite
Patel, S.; Veeramalai, T. Image Encryption Using a Spectrally Efficient Halton Logistics Tent (HaLT) Map and DNA Encoding for Secured Image Communication. Entropy 2022, 24, 803. https://doi.org/10.3390/e24060803
Patel S, Veeramalai T. Image Encryption Using a Spectrally Efficient Halton Logistics Tent (HaLT) Map and DNA Encoding for Secured Image Communication. Entropy. 2022; 24(6):803. https://doi.org/10.3390/e24060803
Chicago/Turabian StylePatel, Sakshi, and Thanikaiselvan Veeramalai. 2022. "Image Encryption Using a Spectrally Efficient Halton Logistics Tent (HaLT) Map and DNA Encoding for Secured Image Communication" Entropy 24, no. 6: 803. https://doi.org/10.3390/e24060803
APA StylePatel, S., & Veeramalai, T. (2022). Image Encryption Using a Spectrally Efficient Halton Logistics Tent (HaLT) Map and DNA Encoding for Secured Image Communication. Entropy, 24(6), 803. https://doi.org/10.3390/e24060803