
Outage Performance of Wireless Powered Decode-and-Forward Relaying Networks in Rician Fading


Abstract
:1. Introduction
1.1. Background
1.2. Related Work
1.3. Motivations & Contributions
1.4. Organization
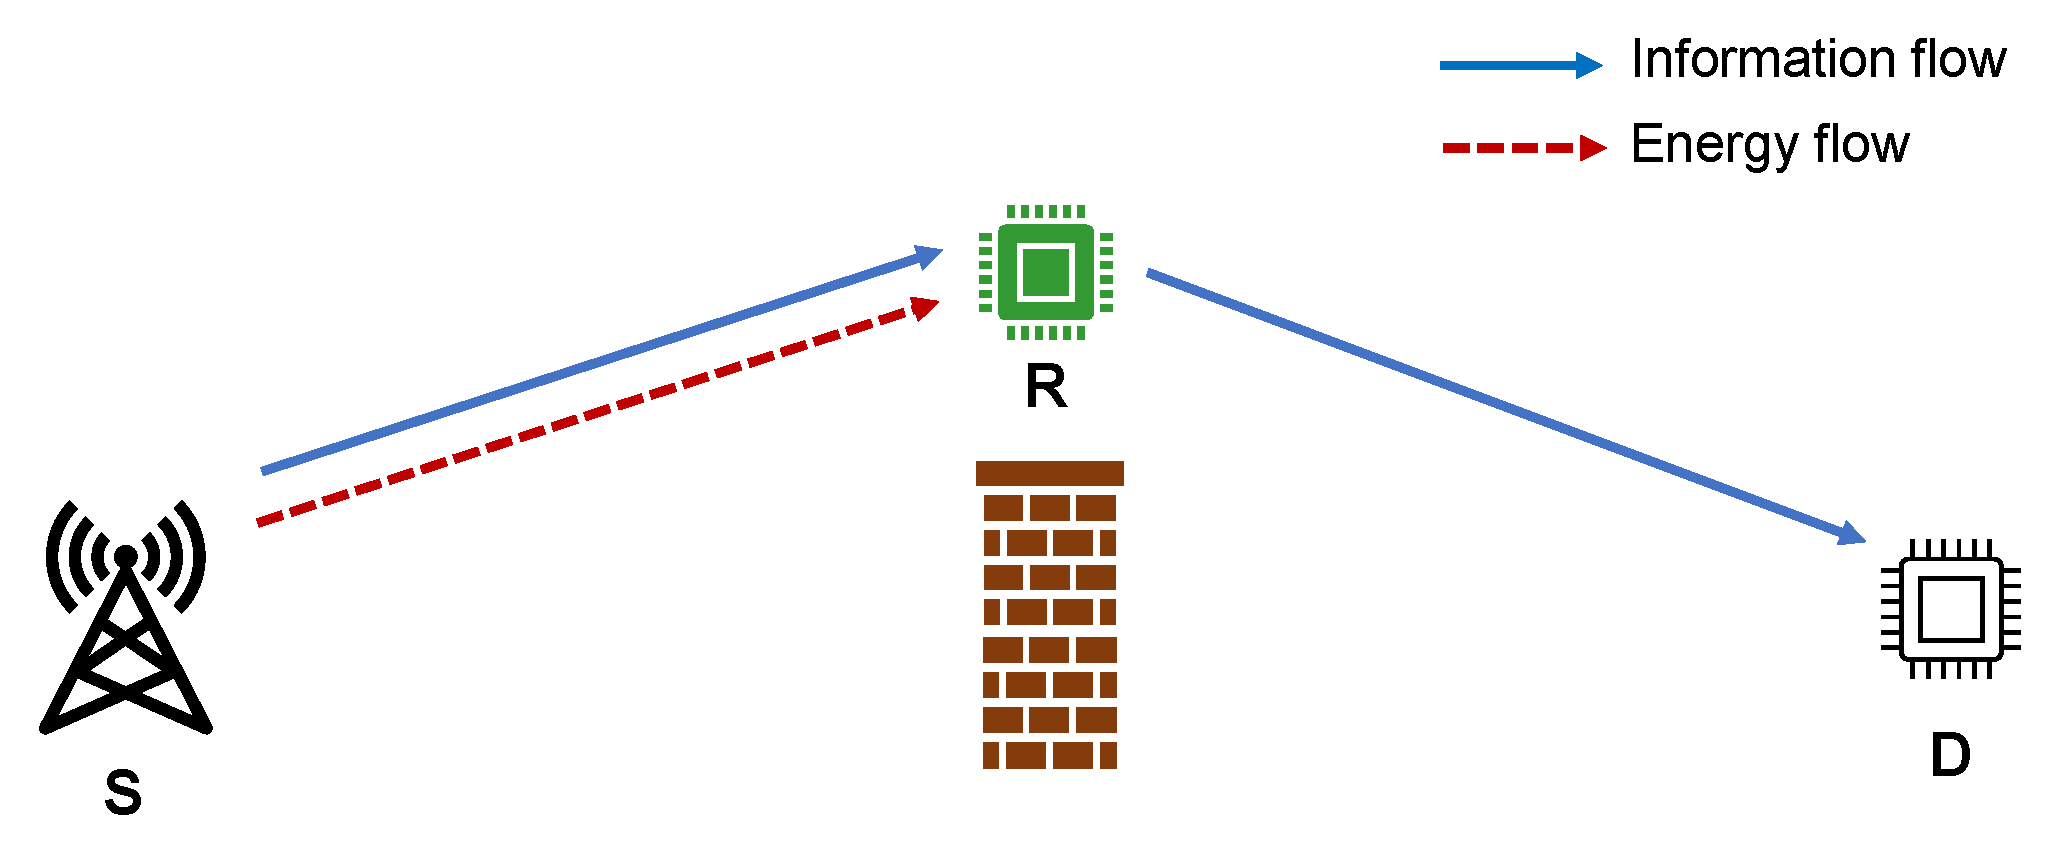
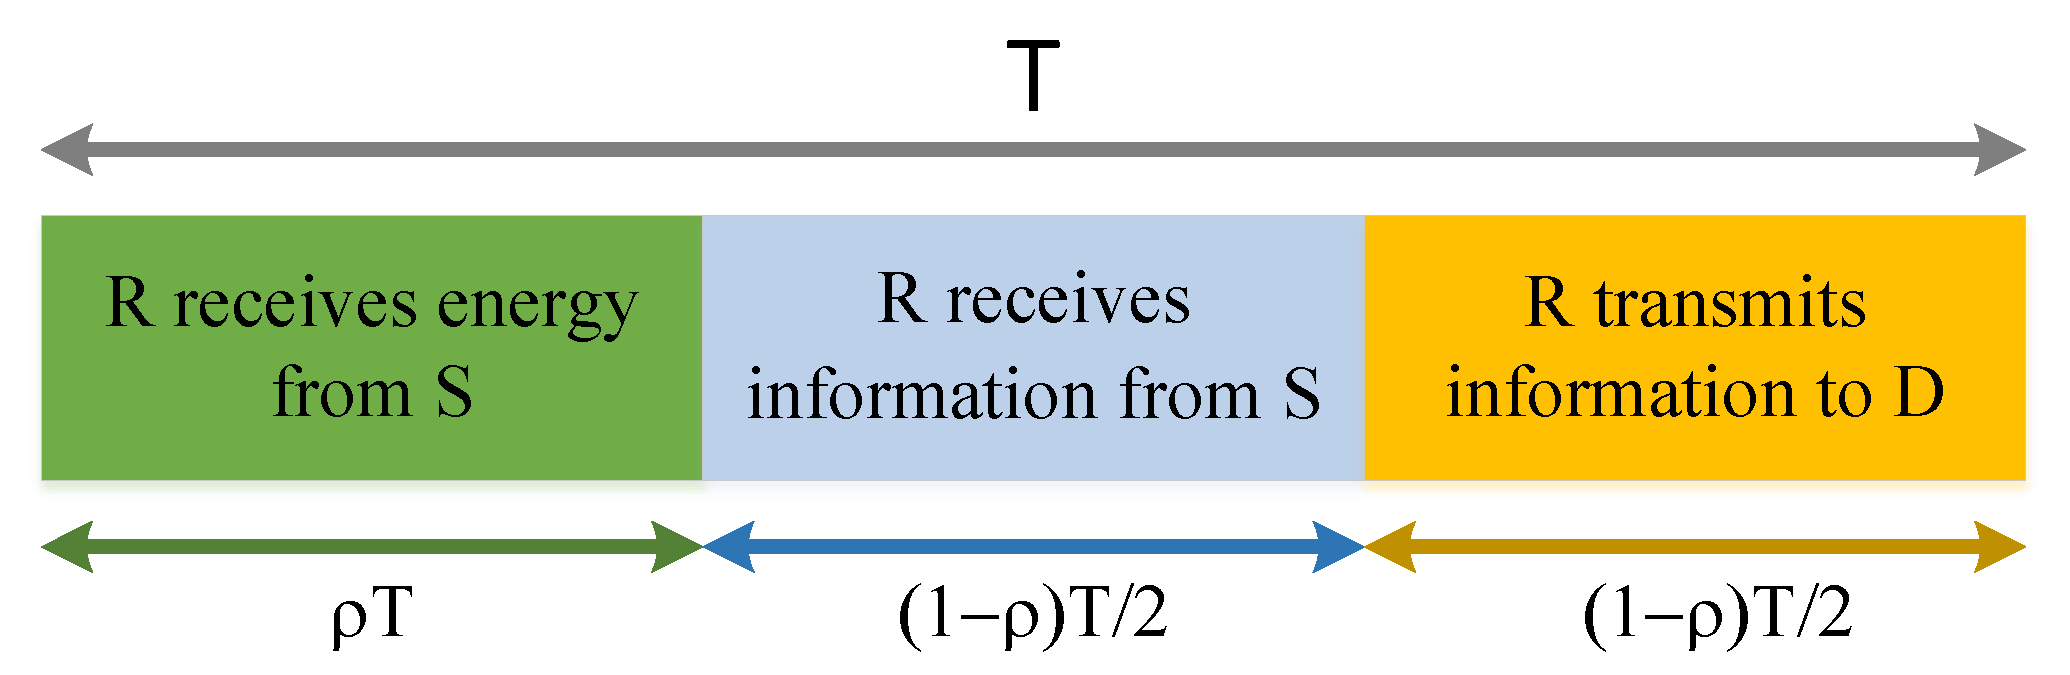
2. System Model
2.1. Energy Collection
2.2. Information Transmission
3. Outage Probability and Throughput Analysis
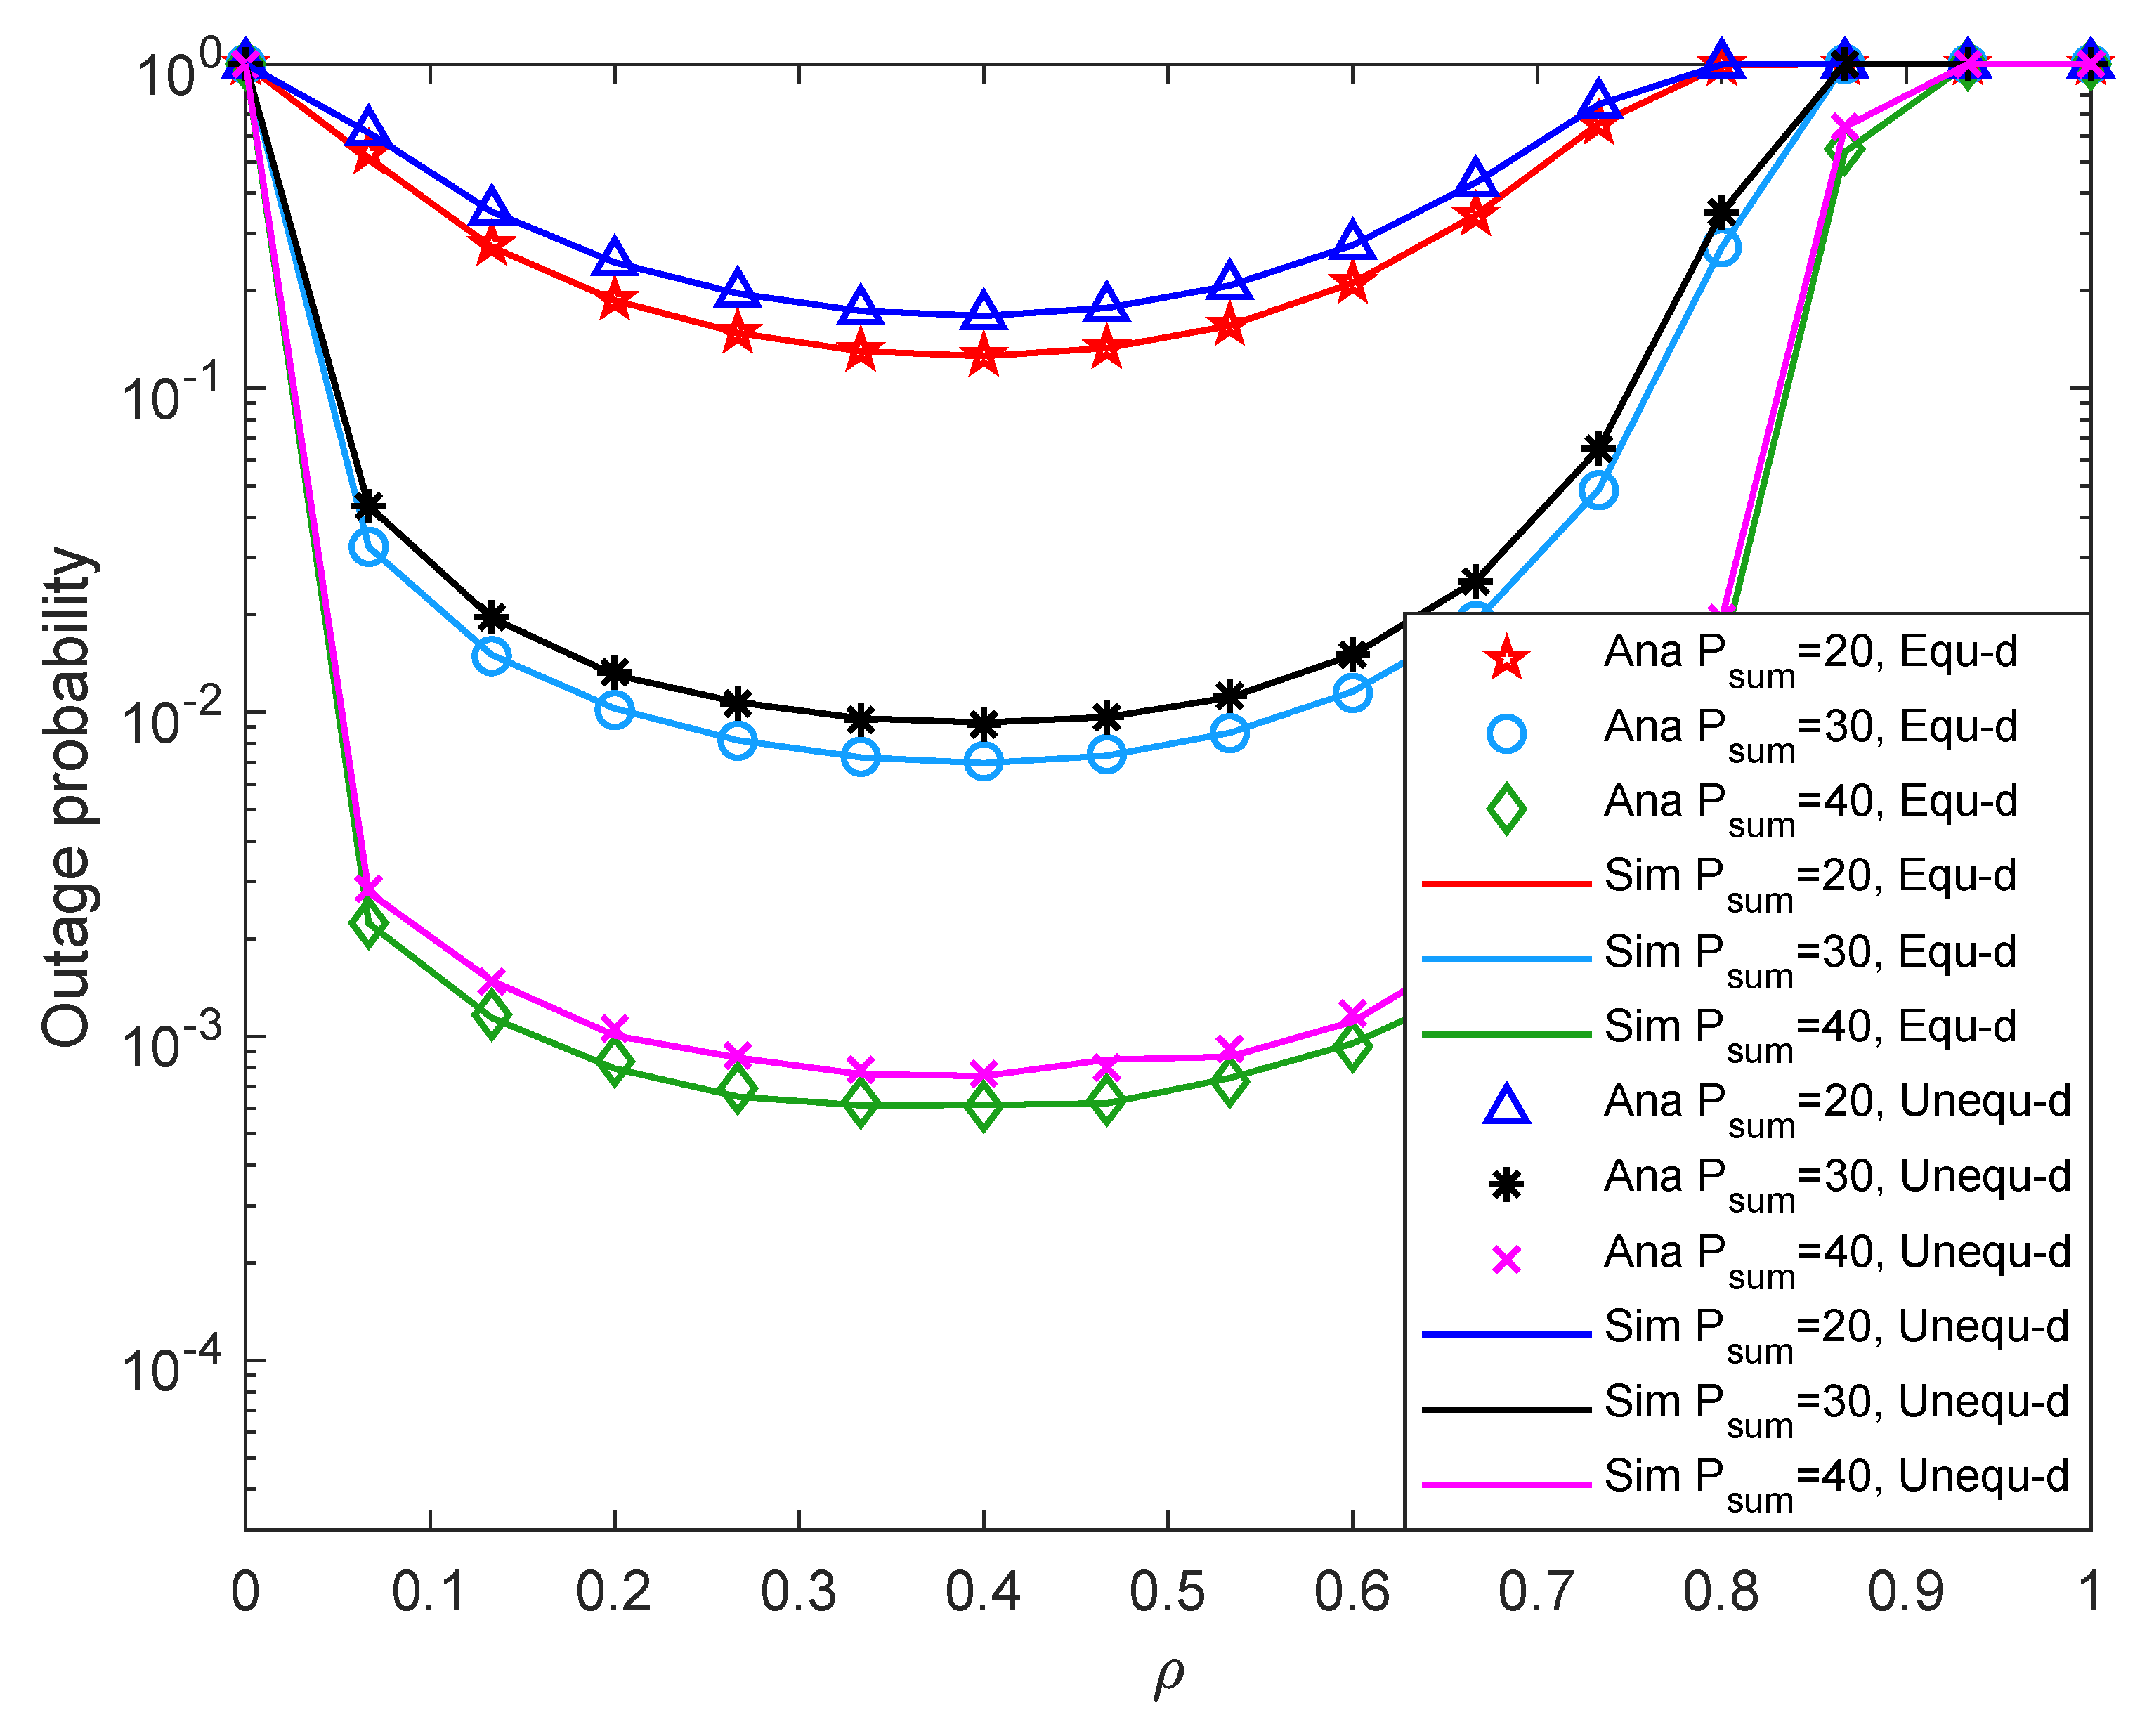
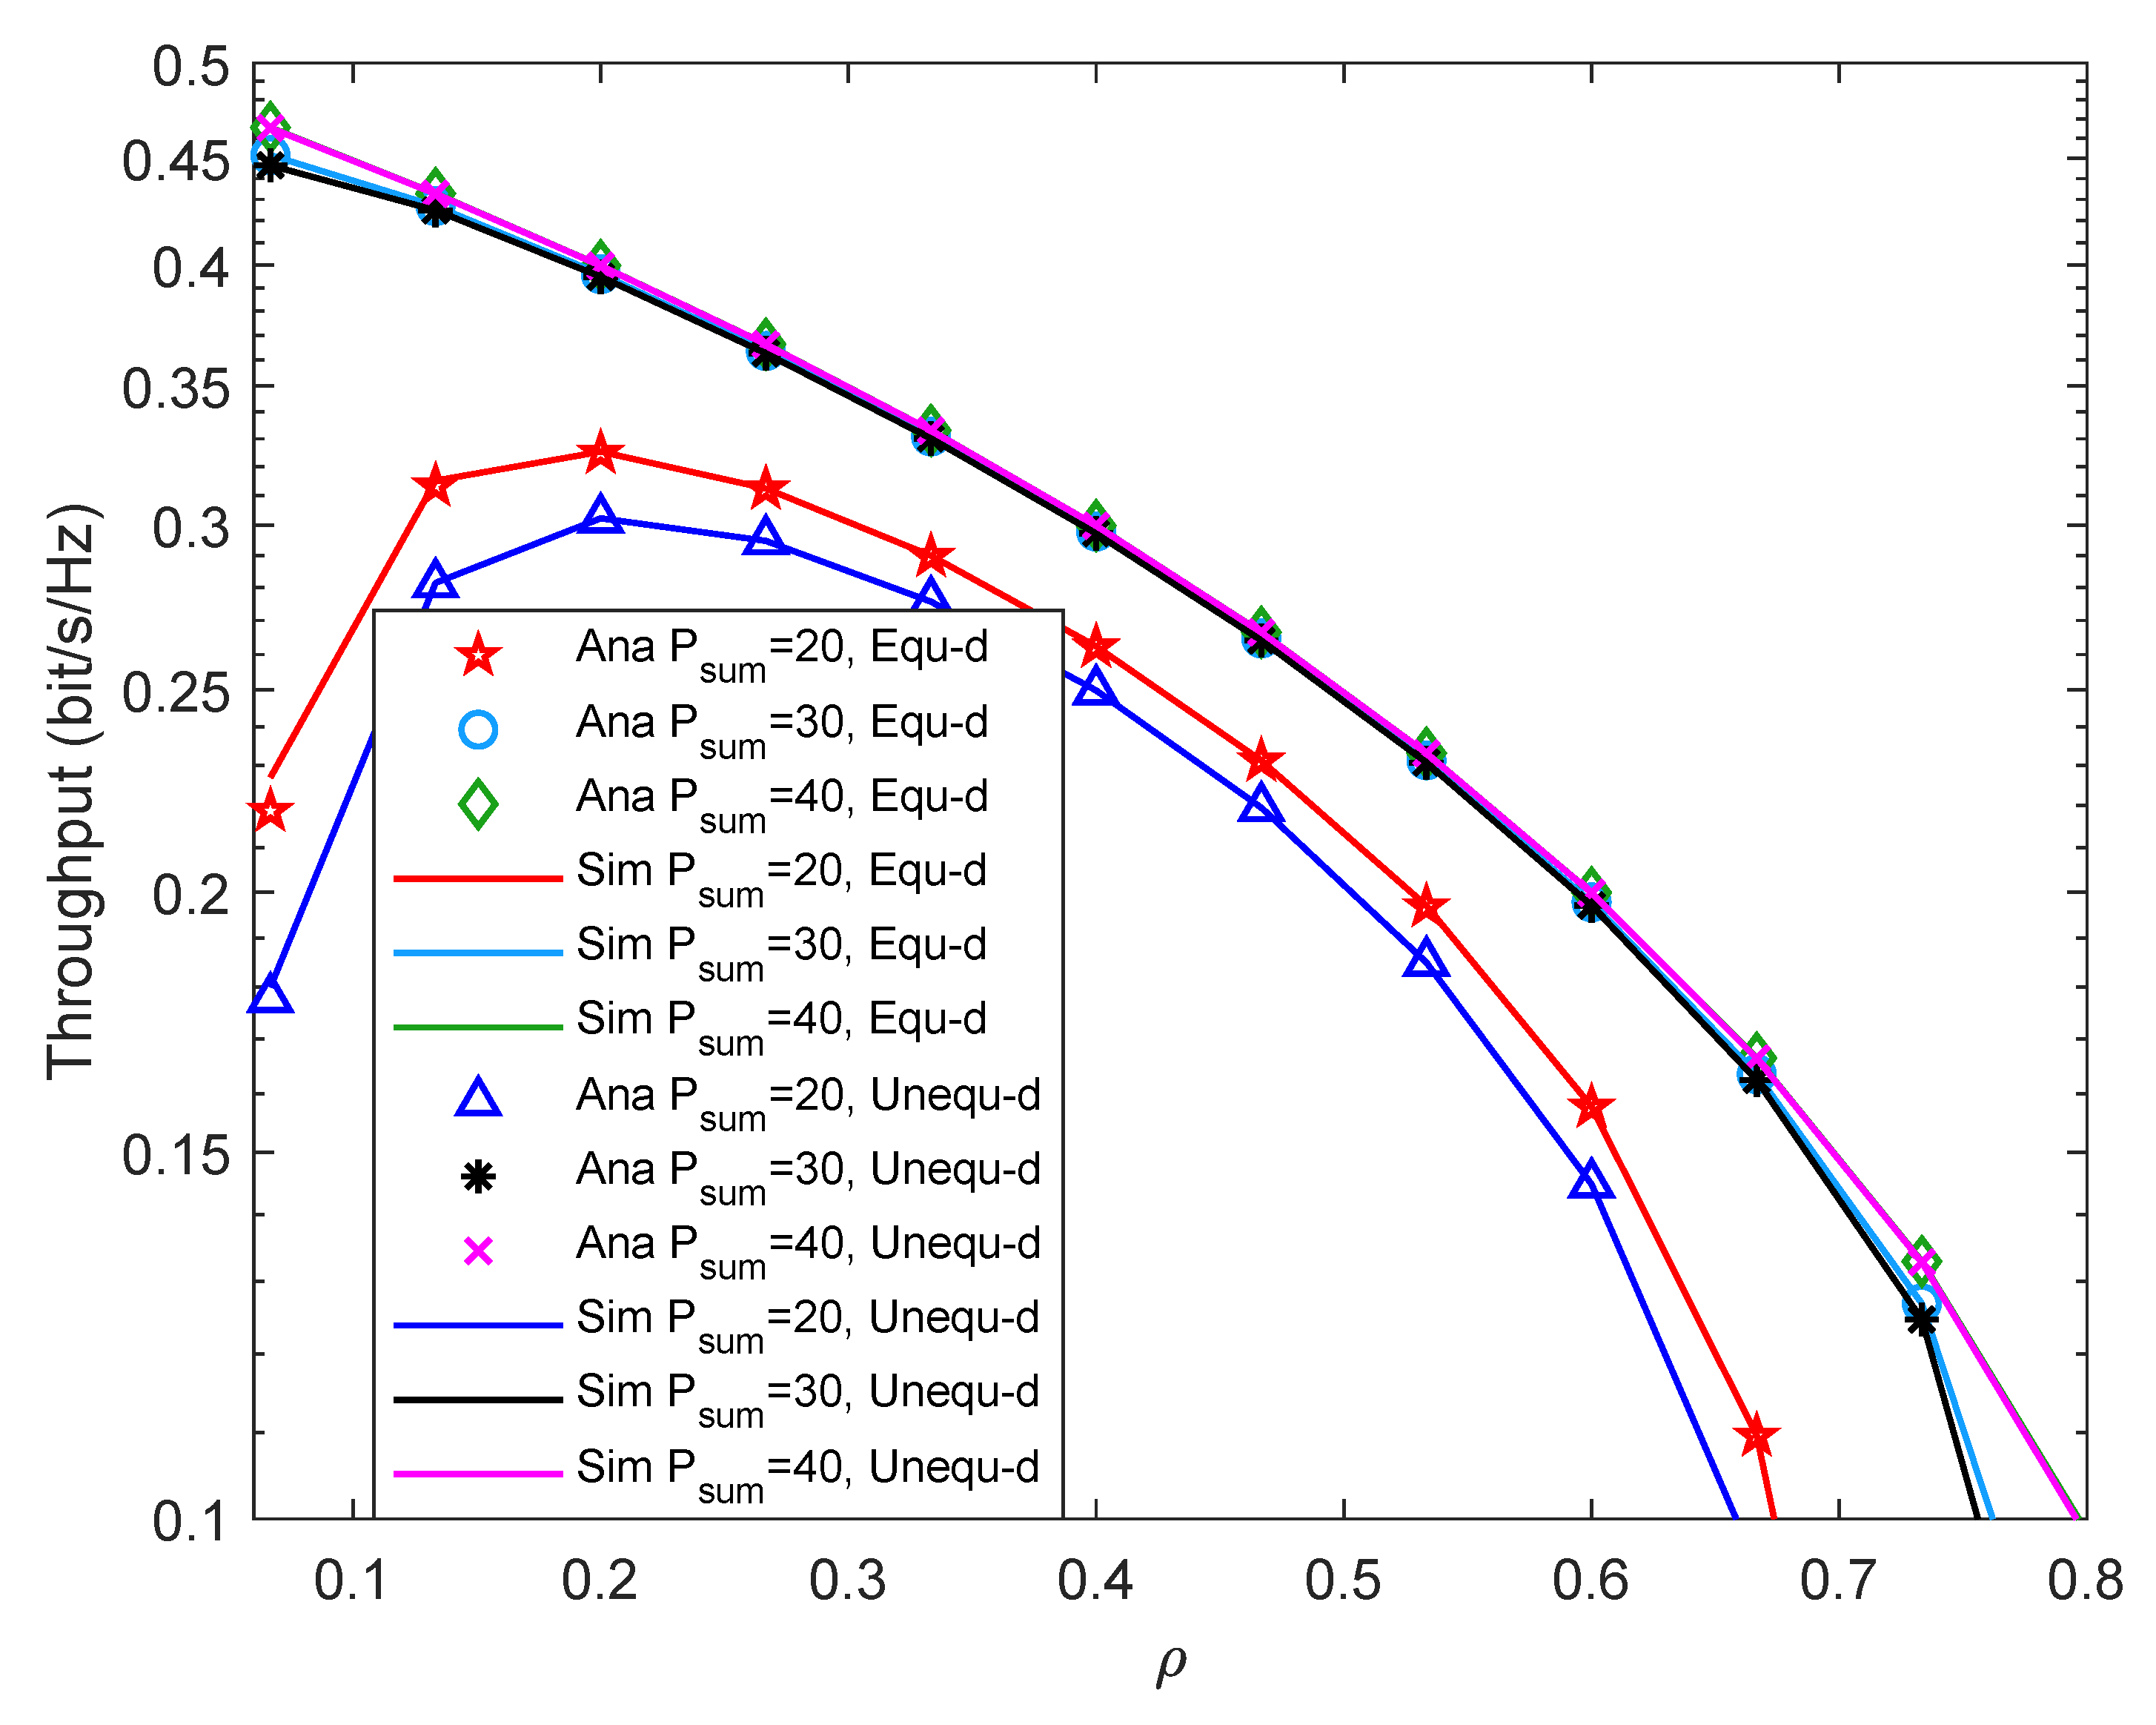
4. Simulation Results
4.1. Simulation Parameters
4.2. Simulation Results and Analysis
5. Conclusions
Author Contributions
Funding
Conflicts of Interest
Appendix A
References
- Ku, M.; Li, W.; Chen, Y.; Liu, K.J.R. Advances in Energy Harvesting Communications: Past, Present, and Future Challenges. IEEE Commun. Surv. Tutorials 2016, 18, 1384–1412. [Google Scholar] [CrossRef]
- Wang, Z.; Li, T.; Ye, J.; Yang, X.; Xiong, K. AN-Aided Secure Beamforming in SWIPT-Aware Mobile Edge Computing Systems with Cognitive Radio. Wirel. Commun. Mob. Comput. 2020, 2020, 8899314:1–8899314:10. [Google Scholar] [CrossRef]
- Varshney, L.R. Transporting information and energy simultaneously. In Proceedings of the International Symposium on Information Theory ISIT, Toronto, ON, Canada, 6–11 July 2008; Kschischang, F.R., Yang, E., Eds.; IEEE: Piscataway, NJ, USA, 2008; pp. 1612–1616. [Google Scholar] [CrossRef] [Green Version]
- Zhang, R.; Ho, C.K. MIMO Broadcasting for Simultaneous Wireless Information and Power Transfer. IEEE Trans. Wirel. Commun. 2013, 12, 1989–2001. [Google Scholar] [CrossRef] [Green Version]
- Bai, X.; Shao, J.; Tian, J.; Shi, L. Power-Splitting Scheme for Nonlinear Energy Harvesting AF Relaying with Direct Link. Wirel. Commun. Mob. Comput. 2018, 2018, 7906957:1–7906957:8. [Google Scholar] [CrossRef] [Green Version]
- Xiong, K.; Chen, C.; Qu, G.; Fan, P.; Letaief, K.B. Group Cooperation with Optimal Resource Allocation in Wireless Powered Communication Networks. IEEE Trans. Wirel. Commun. 2017, 16, 3840–3853. [Google Scholar] [CrossRef]
- Nguyen, T.N.; Minh, T.H.Q.; Tran, P.T.; Voznák, M. Adaptive Energy Harvesting Relaying Protocol for Two-Way Half-Duplex System Network over Rician Fading Channels. Wirel. Commun. Mob. Comput. 2018, 2018, 7693016. [Google Scholar] [CrossRef] [Green Version]
- Ju, H.; Zhang, R. Throughput Maximization in Wireless Powered Communication Networks. IEEE Trans. Wirel. Commun. 2014, 13, 418–428. [Google Scholar] [CrossRef] [Green Version]
- Pan, L.; Li, Z.; Wang, Z.; Zhang, F. Joint Relay Selection and Power Allocation for the Physical Layer Security of Two-Way Cooperative Relaying Networks. Wirel. Commun. Mob. Comput. 2019, 2019, 1839256:1–1839256:7. [Google Scholar] [CrossRef]
- Jiang, R.; Xiong, K.; Fan, P.; Zhou, L.; Zhong, Z. Outage Probability and Throughput of Multirelay SWIPT-WPCN Networks With Nonlinear EH Model and Imperfect CSI. IEEE Syst. J. 2020, 14, 1206–1217. [Google Scholar] [CrossRef]
- Xiong, K.; Wang, B.; Liu, K.J.R. Rate-Energy Region of SWIPT for MIMO Broadcasting Under Nonlinear Energy Harvesting Model. IEEE Trans. Wirel. Commun. 2017, 16, 5147–5161. [Google Scholar] [CrossRef]
- Lee, H.; Song, C.; Choi, S.; Lee, I. Outage Probability Analysis and Power Splitter Designs for SWIPT Relaying Systems With Direct Link. IEEE Commun. Lett. 2017, 21, 648–651. [Google Scholar] [CrossRef]
- Lei, R.; Xu, D.; Ahmad, I. Secrecy Outage Performance Analysis of Cooperative NOMA Networks with SWIPT. IEEE Wirel. Commun. Lett. 2021, 10, 1474–1478. [Google Scholar] [CrossRef]
- Liu, Z.; Lu, G.; Ye, Y.; Shi, L. On the Performance of Battery-Assisted PS-SWIPT Enabled DF Relaying. Information 2020, 11, 165. [Google Scholar] [CrossRef] [Green Version]
- Tang, K.; Liao, S. Outage Analysis of Relay-Assisted NOMA in Cooperative Cognitive Radio Networks with SWIPT. Information 2020, 11, 500. [Google Scholar] [CrossRef]
- Jiang, R.; Xiong, K.; Zhang, Y.; Zhong, Z. Outage Analysis and Optimization of SWIPT in Network-Coded Two-Way Relay Networks. Mob. Inf. Syst. 2017, 2017, 2516035:1–2516035:16. [Google Scholar] [CrossRef]
- Xia, H.; Li, Y.; Lu, Y. Relay Selection Optimization for SWIPT-Enabled Cooperative Networks. Information 2020, 11, 7. [Google Scholar] [CrossRef] [Green Version]
- Guo, W.; Wang, Y. Cooperative Non-Orthogonal Multiple Access with Energy Harvesting. Information 2017, 8, 111. [Google Scholar] [CrossRef] [Green Version]
- Soliman, S.S.; Beaulieu, N.C. Dual-hop AF systems with maximum end-to-end SNR relay selection over nakagami-m and rician fading links. In Proceedings of the IEEE International Conference on Computing, Networking and Communications (ICNC), San Diego, CA, USA, 28–31 January 2013; pp. 155–161. [Google Scholar] [CrossRef]
- Zhong, S.; Huang, H.; Li, R. Outage probability of power splitting SWIPT two-way relay networks in Nakagami-m fading. EURASIP J. Wirel. Commun. Netw. 2018, 2018, 11. [Google Scholar] [CrossRef] [Green Version]
- Liu, Z.; Lu, G.; Ye, Y.; Chu, X. System Outage Probability of PS-SWIPT Enabled Two-Way AF Relaying with Hardware Impairments. IEEE Trans. Veh. Technol. 2020, 69, 13532–13545. [Google Scholar] [CrossRef]
- Zhong, S.; Huang, H.; Li, R. Performance analysis of energy-harvesting-aware multi-relay networks in Nakagami-m fading. EURASIP J. Wirel. Commun. Netw. 2018, 2018, 63. [Google Scholar] [CrossRef] [Green Version]
- Lei, H.; Dai, Z.; Park, K.; Lei, W.; Pan, G.; Alouini, M. Secrecy Outage Analysis of Mixed RF-FSO Downlink SWIPT Systems. IEEE Trans. Commun. 2018, 66, 6384–6395. [Google Scholar] [CrossRef] [Green Version]
- Ghosh, S.; Acharya, T.; Maity, S.P. On Outage Analysis in SWIPT Enabled Bidirectional D2D Communications Using Spectrum Sharing in Cellular Networks. IEEE Trans. Veh. Technol. 2020, 69, 10167–10176. [Google Scholar] [CrossRef]
- Gurjar, D.S.; Nguyen, H.H.; Pattanayak, P. Performance of Wireless Powered Cognitive Radio Sensor Networks with Nonlinear Energy Harvester. IEEE Sens. Lett. 2019, 3, 1–4. [Google Scholar] [CrossRef]
- Prathima, A.; Gurjar, D.S.; Nguyen, H.H.; Bhardwaj, A. Performance Analysis and Optimization of Bidirectional Overlay Cognitive Radio Networks with Hybrid-SWIPT. IEEE Trans. Veh. Technol. 2020, 69, 13467–13481. [Google Scholar] [CrossRef]
- Khan, I.; Rajatheva, N.; Tanoli, S.A.K.; Jan, S. Performance analysis of cooperative network over Nakagami and Rician fading channels. Int. J. Commun. Syst. 2014, 27, 2703–2722. [Google Scholar] [CrossRef]
- Mishra, D.; De, S.; Chiasserini, C. Joint Optimization Schemes for Cooperative Wireless Information and Power Transfer over Rician Channels. IEEE Trans. Commun. 2016, 64, 554–571. [Google Scholar] [CrossRef]
- Sheng, X.; Lu, G.; Shi, L.; Ye, Y. Performance Analysis of Hybrid Protocol Based AF EH Relaying over Asymmetric Fading Channels. Information 2019, 10, 50. [Google Scholar] [CrossRef] [Green Version]
- Jameel, F.; Jayakody, D.N.K.; Flanagan, M.F.; Tellambura, C. Secure communication for separated and integrated receiver architectures in SWIPT. In Proceedings of the IEEE Wireless Communications and Networking Conference (WCNC), Barcelona, Spain, 15–18 April 2018; pp. 1–6. [Google Scholar] [CrossRef]
- Xiong, K.; Fan, P.; Zhang, C.; Letaief, K.B. Wireless Information and Energy Transfer for Two-Hop Non-Regenerative MIMO-OFDM Relay Networks. IEEE J. Sel. Areas Commun. 2015, 33, 1595–1611. [Google Scholar] [CrossRef] [Green Version]
- Lee, J.B.; Rong, Y.; Gopal, L.; Chiong, C.W.R. Robust Transceiver Design for SWIPT DF MIMO Relay Systems with Time-Switching Protocol. IEEE Syst. J. 2021, 1–12. [Google Scholar] [CrossRef]
- Wu, M.; Song, Q.; Ni, Q.; Guo, L.; Ning, Z.; Obaidat, M.S. Joint User Pairing and Resource Allocation for SWIPT-Enabled Cooperative D2D Communications. In Proceedings of the IEEE International Conference on Communications, Montreal, QC, Canada, 14–23 June 2021; pp. 1–6. [Google Scholar] [CrossRef]
- Nasir, A.A.; Tuan, H.D.; Dutkiewicz, E.; Poor, H.V.; Hanzo, L. Relay-Aided Multi-User OFDM Relying on Joint Wireless Power Transfer and Self-Interference Recycling. IEEE Trans. Commun. 2022, 70, 291–305. [Google Scholar] [CrossRef]
- Banerjee, A.; Maity, S.P. On Residual Energy Maximization in DF Cognitive Radio Networks with Multiple Eavesdroppers. IEEE Trans. Cogn. Commun. Netw. 2020, 6, 718–727. [Google Scholar] [CrossRef]
- Krikidis, I. Average Age of Information in Wireless Powered Sensor Networks. IEEE Wirel. Commun. Lett. 2019, 8, 628–631. [Google Scholar] [CrossRef] [Green Version]
- Anh, P.V.T.; Bao, V.N.Q.; Le, K.N. Performance of TAS/MRC Wireless Energy Harvesting Relaying Networks over Rician Fading Channels. Wirel. Pers. Commun. 2018, 103, 1859–1870. [Google Scholar] [CrossRef]
- Shannon, C.E. A mathematical theory of communication. Bell Syst. Tech. J. 1948, 27, 379–423. [Google Scholar] [CrossRef] [Green Version]
- Gradshteyn, I.S.; Ryzhik, I.M. Table of Integrals, Series, and Products, 7th ed.; Elsevier/Academic Press: Amsterdam, The Netherlands, 2007; p. xlviii+1171. [Google Scholar]
- Guo, J.; Zhu, X. An improved analytical model for RF-DC conversion efficiency in microwave rectifiers. In Proceedings of the 2012 IEEE/MTT-S International Microwave Symposium Digest, Montreal, QC, Canada, 17–22 June 2012; pp. 1–3. [Google Scholar]
- Onel, L. Alcaraz López and Hirley Alves and Richard Demo Souza and Samuel Montejo Sánchez. Statistical Analysis of Multiple Antenna Strategies for Wireless Energy Transfer. IEEE Trans. Commun. 2019, 67, 7245–7262. [Google Scholar]


| Symbol | Meaning | Value |
|---|---|---|
| Energy conversion efficiency | ||
| The mean of channel gain | 1 | |
| m | Path loss coefficient | 2 |
| Minimum transmission rate required by system | 1 bit/s/Hz | |
| Time assignment factor | ||
| Total transmission power of source node | 30 dBm | |
| K | Rice factor | 3 |
| Threshold of circuit energy | J | |
| Number of source nodes antenna | 2 | |
| Noise power | dBm |
Publisher’s Note: MDPI stays neutral with regard to jurisdictional claims in published maps and institutional affiliations. |
© 2022 by the authors. Licensee MDPI, Basel, Switzerland. This article is an open access article distributed under the terms and conditions of the Creative Commons Attribution (CC BY) license (https://creativecommons.org/licenses/by/4.0/).
Share and Cite
Zhang, Z.; Dong, P.; Tan, X.; Li, Y.; Xiong, K. Outage Performance of Wireless Powered Decode-and-Forward Relaying Networks in Rician Fading. Entropy 2022, 24, 763. https://doi.org/10.3390/e24060763
Zhang Z, Dong P, Tan X, Li Y, Xiong K. Outage Performance of Wireless Powered Decode-and-Forward Relaying Networks in Rician Fading. Entropy. 2022; 24(6):763. https://doi.org/10.3390/e24060763
Chicago/Turabian StyleZhang, Zhifei, Peng Dong, Xinlu Tan, Yaping Li, and Ke Xiong. 2022. "Outage Performance of Wireless Powered Decode-and-Forward Relaying Networks in Rician Fading" Entropy 24, no. 6: 763. https://doi.org/10.3390/e24060763
APA StyleZhang, Z., Dong, P., Tan, X., Li, Y., & Xiong, K. (2022). Outage Performance of Wireless Powered Decode-and-Forward Relaying Networks in Rician Fading. Entropy, 24(6), 763. https://doi.org/10.3390/e24060763