Abstract
The Reynolds averaged N-S equation and dynamic equation for nanoparticles are numerically solved in the two-phase flow around cylinders, and the distributions of the concentration M0 and geometric mean diameter dg of particles are given. Some of the results are validated by comparing with previous results. The effects of particle coagulation and breakage and the initial particle concentration m00 and size d0 on the particle distribution are analyzed. The results show that for the flow around a single cylinder, M0 is reduced along the flow direction. Placing a cylinder in a uniform flow will promote particle breakage. For the flow around multiple cylinders, the values of M0 behind the cylinders oscillate along the spanwise direction, and the wake region in the flow direction is shorter than that for the flow around a single cylinder. For the initial monodisperse particles, the values of dg increase along the flow direction and the effect of particle coagulation is larger than that of particle breakage. The values of dg fluctuate along the spanwise direction; the closer to the cylinders, the more frequent the fluctuations of dg values. For the initial polydisperse particles with d0 = 98 nm and geometric standard deviation σ = 1.65, the variations of dg values along the flow and spanwise directions show the same trend as for the initial monodisperse particles, although the differences are that the values of dg are almost the same for the cases with and without considering particle breakage, while the distribution of dg along the spanwise direction is flatter in the case with initial polydisperse particles.
1. Introduction
The particle-laden flow around cylinders has attracted the attention of many scholars because of its extensive industrial applications. The particle dispersion and distribution in the wake behind cylinders have been extensively studied in experimental and numerical simulations during the past decade. Zhou et al. [1] showed that the particle distribution was dependent on the Stokes number (St). The particles dispersed into the core regions of the vortex at small St values concentrated on the boundary of vortex at intermediate St values and assembled in the outer region of the vortex at large St values. Haddadi et al. [2] found that the hydrodynamic interaction between particles led to the exchange of particles between the wake area and the free stream. Jafari et al. [3] indicated that particle motion in the wake was strongly affected by vortex shedding, while the particle Brownian diffusion influenced the deposition rate of particles. Haddadi et al. [4] studied the suspension around the cylinder with a particle fraction of about 0.08 in the microchannel and found that particles could escape the wake area due to velocity fluctuations by increasing the particle number in the wake. There was also particle exchange between the wake area and the free stream. Huang et al. [5] indicated that the particle collection efficiency was positively related to the particle formation fraction, while the thermophoresis enhanced the impaction efficiency of particles by 1–2 orders. Jeong and Kim [6] indicated that the thermophorectic effect on the particles was obvious at small St values, while the deposition efficiency of particles was increased by increasing the temperature difference between the flow and the cylinder or by decreasing the ratio of thermal conductivity of the particle to the fluid. The particles with small St values follow the fluid in the upstream surface of the cylinder without collision, but move backward in the downstream direction. Gopan et al. [7] developed correlations for particle temperatures and impaction rates based on the flow and boundary conditions, as well as particle properties.
However, most of the above studies involved large particles, without considering the coagulation and breakage of particle clusters after coagulation. In practical applications, particle coagulation and breakage often occur, which affects the distribution of the particle concentration and sizein the wake behind cylinders. In addition, particle dispersion is dominant when the particle density is low, while it is necessary to consider the coagulation caused by particle collision when the particle density is high. Keita et al. [8] numerically studied the nanoparticle dispersion at Re = 9300. They found that the Brownian diffusion tended to concentrate the particles at the edges of the vortices, while the turbulence dispersed particles from the periphery to the core of the vortices. Tu and Zhang [9] experimentally studied the condensation of submicron- and nanoscale particles within Re = 5200–35,000. They found that the particle diameter downstream of the cylinder was larger than that upstream, and the total particle concentration and geometric mean diameter in the free stream werelarger and less than in the wake, respectively. Multi-cylinder alignment could be used to enhance particle coagulation. Liu et al. [10] numerically and experimentally studied the structural properties of the vortex generators affecting the particle coagulation. They showed that the optimal efficiency of the particle coagulation was about 16.42% for particles with sizes ranging from 15.7 to 850.0 nm at aflow velocity of 4.8 m/s. Particle collision and coagulation mainly occurred in the windward boundary layer of the vortex generator and at the longitudinal edges of the vortices. Kolsiet al. [11] numerically studied the effects of using double rotating cylinders and partly porous layers in the bifurcating channels on the hydrothermal performance and indicated that the proposed methods of heat transfer enhancement could be considered simultaneously for effective control of the thermal performance of those systems. Alsaberyet al. [12] investigated transient entropy generation and mixed convection due to a rotating hot inner cylinder within a square cavity with a flexible side wall and achieved the highest average heat transfer and global entropy generation rates for counter-clockwise rotation of the circular cylinder and lower values in terms of flexible wall deformation.
From the above, it can be seen that there are few studies on particle distribution while simultaneously considering the effects of particle coagulation and breakage, and research results for the two-phase flow of nanoparticles around multiple cylinders are also rare. In this work, a numerical simulation is carried out to study the distribution of the particle concentration and particle size in the two-phase flow of nanoparticles around a single cylinder and multiple cylinders. The flow of fluid around cylinders is selected because this kind of flow is the most common in practical applications. Meanwhile, the effects of particle coagulation and breakage, initial particle concentration, and size on the particle distribution are discussed.
2. Governing Equations
For the nanoparticle-laden flow around cylinders, as shown in Figure 1 the distance between two walls in the z direction is long enough and there is no velocity in the z direction, meaning that the change of the flow along the z direction can be ignored. Therefore, the three-dimensional flow can be reduced to flow the in x-y plane. The distribution of the particle concentration and size in the wake behind cylinders is closely related to the flow characteristics. In Figure 1a, the cylinder diameter is D = 50 mm and the geometric center of the cylinder is used as the coordinate origin. Coordinates x, y, and z represent the flow, vertical direction, and span direction, respectively. In Figure 1b, the cylinder diameter is D = 10 mm; the flow direction positions of the four columns of cylinders are x= 0.05, 0.09, 0.13, and 0.17 m, respectively; and the spanwise positions of the five rows of cylinders are y = ±0.02, 0, and ±0.04 m, respectively. The Reynolds number of the flow is defined as Re = UD/ν.
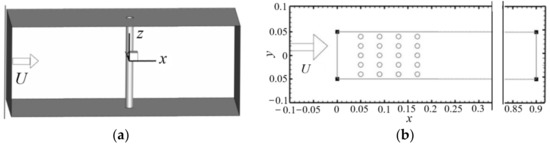
Figure 1.
Nanoparticle-laden flows: (a) flow around a cylinder; (b) flow around 20 cylinders.
2.1. Fluid Flow
For the incompressible flow, the continuity and the Reynolds averaged N-S equations are:
where ui is the mean velocity, ρ is the density, p is the pressure, μ is the fluid viscosity, and is the Reynolds stress, which is modeled by:
in which νt = Cμk2/ε, where Cμ is a function of the average strain rate, and k and ε are the turbulent kinetic energy and dissipation rate, respectively. The standard k-ε turbulence model is selected here because it is suitable for flow with Reynolds numbers in the range of 300 < Re < 3 × 10⁵ and is not directly affected by the wall. The transport equations of k and ε are:
where Cμ = 0.09, Cε1 =1.44, Cε2 =192, σk = 1.0, and σε = 1.3.
2.2. General Dynamic Equation for Nanoparticles
The instantaneous general dynamic equation for nanoparticles considering the convection, diffusion, and particle coagulation and breakage is [13,14]:
where n is the spatial distribution of the number of particles with volume v at time t, and DT is the turbulent diffusion coefficient, which is approximated by the turbulent viscosity of the fluid [15]. The first two terms on the right hand side of Equation (6) are the generation and disappearance of particles with volume v caused by coagulation, while β(v1,v) is the kernel function of coagulation of the two particles with volume v and volume v1 and consists of two parts, i.e., β = βB + βT, where βB is the coagulation kernel caused by Brownian motion [16]:
where K is the Boltzmann constant, T is the temperature, and λ is the average free path of gas molecules. Here, βT is the coagulation kernel caused by turbulent shear [17]:
The last two terms on the right hand side of Equation (6) are the generation and disappearance of particles caused by breakage. The volume-based breakage kernel function a(v) represents the breakage frequency of particles with volume v. Particle breakage is related to the particle size, velocity gradient, and particle concentration. The exponential breakage kernel function obtained by fitting the experimental data by Spicer [18] is:
where A is 0.47 m−1s−0.6. In Equation (6), the particle breakage distribution b(v|v1) gives the relationship between the parent particles and separated sub-particles. Large particle breakage is not a simple process. The floc is assumed to be composed of small particles of the same size, meaning the distribution function of large, symmetrical broken particles composed of monomers is [19]:
2.3. Moment Equation of Particle Density
In order to obtain the number density distribution of particles more effectively, the general dynamic equation for nanoparticles is usually transformed into the moment equation of the particle density.
The k-th moment of the particle density is defined as:
Based on Equation (11), Equation (6) can be transformed into a moment equation by multiplying the terms of Equation (6) by vk and then integrating this over the entire volume distribution:
Substituting Equations (7)–(11) into Equation (12), it can be found that different fractional moments in the equation are difficult to solve. Therefore, the Taylor series expansion technique [20] is used to transform the fractional moment into the moments represented by the first three moments (i.e., 0, 1, 2):
The zero-order moment m0 represents the total number of particles of all sizes in the unit volume at a given position and time, which is also called the particle concentration. The first-order moment m1 represents the volumes of all particles in the unit volume at a given position and time, which is also called the volume concentration. The second-order moment m2 is related to the dispersion of particles. In the simulation, the dimensionless quantity is defined as Mn = mn/mnn(n = 0, 1, 2), where mnn is the initial value of mn. The geometric mean diameter dg of particles is defined as:
3. Numerical Simulation
All simulations are based on the finite volume method and are carried out using the OpenFOAM platform. OpenFOAM is an open source CFD software and has an extensive range of features to solve anything from complex fluid flows involving turbulence and heat transfer, to solid mechanics and electromagnetic simulations. The equations of fluid flow are solved numerically with the basic solver pisoFoam in the platform. The piso algorithm takes an iterative approach to deal with the coupled pressure–velocity. The discrete and solution modes of the specific equation terms are also given. Gaussian linear interpolation scheme is employed to discretize divergence terms, gradient terms, and Laplace terms of the equations (interpolated from the body center of the grid unit to the surface center). The equations for nanoparticles are solved numerically with the self- made solver. The one-way coupling method is used, i.e., where the effect of particles on the flow is ignored. The particles are obtained from lit permethrin-based mosquito coils. The particles have a density of 730 kg/m3 and a diameter of 98 nm, which are the typical density and diameter of nanoparticles.
3.1. Main Steps
The calculation domain is shown in Figure 1, where the boundary conditions are as follows. The inlet velocity is evenly distributed and equal to 2.664 m/s, the pressure boundary condition is adopted at the outlet, and the no slip boundary condition is adopted on the wall. In the simulation, the range of Reynolds numbers is 300 < Re < 3 × 10⁵. In this Reynolds number range, the boundary layer on the cylinder surface is laminar but the flow behind the cylinder is turbulent. In addition, the flow around a cylinder with this range of Reynolds number is very common. In the simulation, the grid around a single cylinder is shown in Table 1, where 2D and 3D represent two and three dimension, respectively. Since all boundaries are far enough from the wake region, the effects of the existence of boundaries (i.e., size of the domain) on the solution accuracy can be ignored.

Table 1.
Mesh characteristics.
In the simulation, the time step ΔT is 1.5 × 10⁻⁴ s and the courant number is less than 1 for achieving numerical stability and accuracy. The tolerance set by the solver was 10−5. The mean velocity and pressure are calculated by adding the field average functions to the control file.
3.2. Grid Independence Test and Validation
The velocity distribution of the flow around a cylinder is shown in Figure 2, where a stagnation point is formed at the front end of the cylinder. The region close to the tail of the cylinder is the wake region, where the velocity is very small. Downstream of cylinder, two alternating vortices obviously appear. In order to validate the numerical method and code, the present numerical result for the time-averaged streamline in 3D flow is compared with the experimental ones [9], as shown in Figure 3, where both results are in good agreement.
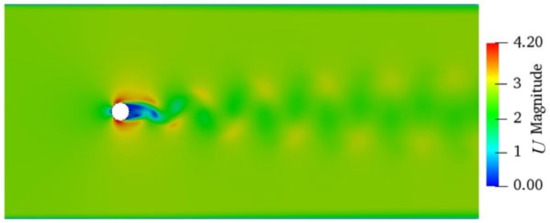
Figure 2.
Velocity distribution of flow around a cylinder.
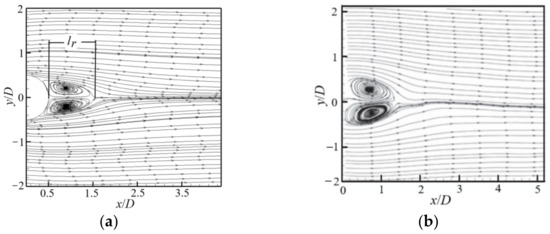
Figure 3.
Distribution of time-averaged streamlines: (a) present result; (b) experimental result [9].
An important parameter to describe the flow around a cylinder is the reflux length lr, which is defined as shown in Figure 3a. The present numerical result for the reflux length lr is further compared with other numerical results. For the present result in 3D flow, lr = 0.08 − 0.025 m = 0.55 m and the particle diameter D = 0.5 m, so lr = 1.1D (Re = 9000), as shown in Figure 4. Keita et al. [8] also numerically simulated the flow around a 2D cylinder at Re = 9300 and gave a reflux length lr = 0.9D. The main reason for the slight deviation in the value of the reflux length is the difference between the Reynolds number and calculation dimension. Figure 4 shows a comparison of the streamwise velocity at the centerline along the x direction, where it can be seen that the present numerical results are in good agreement with the experimental results [21].
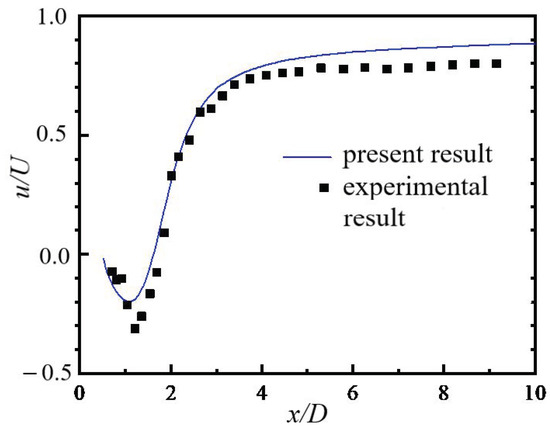
Figure 4.
Comparison of streamwise velocity at the centerline.
A grid independence test is performed by changing the grid number, as shown in Figure 5, where mesh A and mesh B correspond to 28,800 and 46,000 grid numbers, respectively, as shown in Table 1. The results are almost the same for both grid numbers, so mesh A is selected in the simulation.
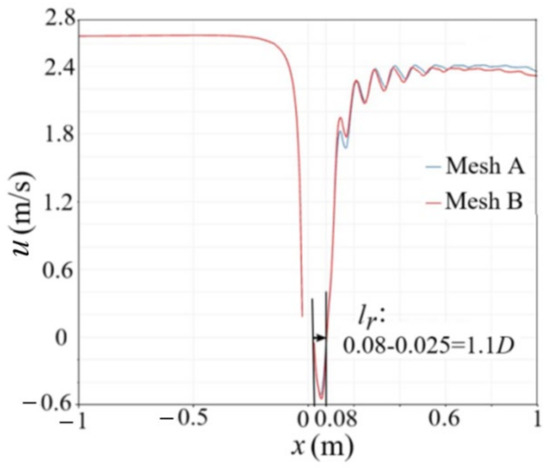
Figure 5.
Streamwise velocity at the centerline along the x direction.
4. Results and Discussion
4.1. The Flow around a Single Cylinder
4.1.1. Particle Coagulation and Distribution of Particle Concentration
In a fully developed turbulent wake flow, the particle coagulation mainly results from the Brownian motion and turbulent shear in the free molecular region. The coagulated particles may break up under the action of turbulent shear. The characteristic times for flow convection, particle coagulation, and particle breakage are different. Previous research results have shown that particle coagulation occurs when the ratio of the characteristic time of flow convection to that of particle coagulation is less than 0.1 [22,23,24]. Figure 6 shows the distributions of particle concentration M0 (=m0/m00) with different initial particle concentrations m00. It can be seen that the values of M0 upstream of the cylinder are uniformly distributed along the spanwise direction and gradually reduced along the flow direction, which indicates that coagulation has occurred in the process of particle transportation downstream. The values of M0 are large (as shown in Figure 6a) and small (as shown in Figure 6b) in the wake region close to the tail of the cylinder, indicating that it is easy for the particles with an initial m00 = 3.6 × 10¹¹/m3(i.e., relatively low initial particle concentration) to enter the wake area behind the cylinder, although the opposite is true for the particles with an initial m00 = 3.6 × 10¹⁵/m3. The variation ranges of M0 are 0.9997~1.0002, as shown in Figure 6a, and 0.23~1.0, as shown in Figure 6b, showing that it is easier for the particles to coagulate when m00 is high, resulting in a wide distribution range of M0. An oscillating wake is formed behind the cylinder and the values of M0 in the oscillating wake are obviously larger (as shown in Figure 6a) and smaller (as shown in Figure 6b) than that around the wake. At the position close to the outlet, the values of M0 return to the uniform distribution along the spanwise direction. Three conclusions can be drawn from Figure 6: (1) there is an obvious coagulation phenomenon of particles forthe parameters of m00, d0, and Re given in the paper, and the larger the value of m00, the larger the differences in values of M0 in different regions of the flow; (2) the existence of the cylinder has a great influence on the distribution of the particles; (3) m00 will affect the number of particles in the cylindrical wake.
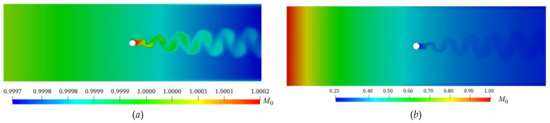
Figure 6.
Distribution of M0 values (d0 = 98 nm, Re = 9000): (a) m00 = 3.6 × 10¹¹/m3; (b) m00 = 3.6 × 10¹⁵/m3.
4.1.2. Function of Particle Breakage
The coagulated particles may break up under the action of turbulent shear. However, whether the coagulated particles are broken depends on the size of coagulated particles and the shear rate of the flow. The variations in particle concentration M0 (=m0/m00) at the centerline along the flow direction are shown in Figure 7. In the flow upstream of the cylinder (x < 0), the values of M0 are decreased along the flow direction due to the occurrence of particle coagulation, and there is almost no difference in M0 between the cases with and without considering particle breakage because the particles do not have enough time to break up after coagulation and the shear rate of the flow is very small. The discontinuous part of M0 is located at the position of the cylinder (x = 0). In the flow downstream of the cylinder, the values of M0 for the case considering particle breakage are obviously larger than that for the case without considering particle breakage because the shear rate of the flow downstream of the cylinder is large. A large shear rate is more likely to lead to particle breakage and an increase in M0. The fluctuation curve shows that the values of M0 are affected by the wake flow. Therefore, putting an obstacle in a uniform flow will promote particle breakage under a certain particle concentration.
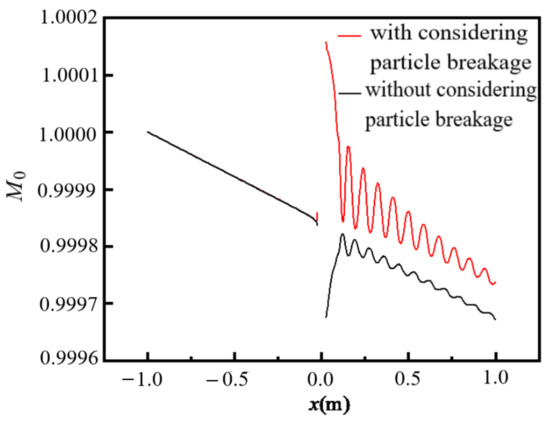
Figure 7.
Variations in M0 at the centerline along the flow direction (Re = 9000, d0 = 98 nm, m00 = 3.6 × 10¹¹/m3).
4.1.3. Distribution of Particles along the Spanwise Direction
Figure 8 shows the distribution of M0 along the spanwise direction in the flow downstream of the cylinder for two different m00. In Figure 8a, the values of M0 for both cases with and without considering particle breakage decrease along the flow direction, showing that the particle coagulation effect is larger than the breakage effect. The values of M0 along the spanwise direction, except for the wake regions behind the cylinder and the near wall region, are uniformly distributed and the same for the cases with and without considering particle breakage because the shear rate of the flow is very small in this region.
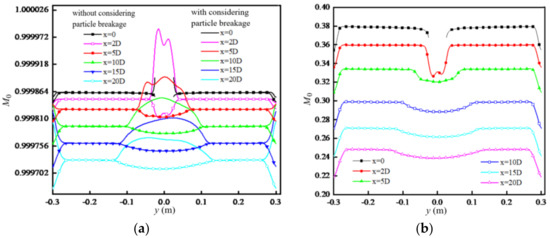
Figure 8.
Distribution of M0: (a) m00 = 3.6 × 10¹¹/m3; (b) m00 = 3.6 × 10¹⁵/m3 (considering particle breakage).
In the wake region behind the cylinder, the values of M0 for the case considering particle breakage are obviously larger than that for the case without considering particle breakage becausethe shear rate in this regionis large. As the flow develops downstream, the values of M0 for both cases with and without considering particle breakage tend to be uniformly distributed along the spanwise direction. Figure 8b shows the distribution of M0 when considering particle breakage in the case of higher m00. It can be seen that the distribution of M0 is qualitatively consistent with that in Figure 8a, but the magnitude of M0 is far less than that in Figure 8a. The reason is that the higher m00 increases the chance of particle coagulation, so the value of M0 (=m0/m00) is far less than m00.
4.2. The Flow around Multiple Cylinders
4.2.1. Particle Coagulation and Distribution of Particles
For the flow around multiple cylinders, the distribution of M0 is shown in Figure 9. It can be seen that the values of M0 upstream of the cylinders are uniformly distributed along the spanwise direction and gradually reduced along the flow direction because of particle coagulation. The values of M0 behind the cylinders oscillate laterally under the influence of the flow structure in the wake of each cylinder. Compared with the flow around a single cylinder, as shown in Figure 5, the wake region of the flow around multiple cylinders is shorter along the flow direction due to the mutual interference of wakes behind multiple cylinders. The distribution of M0 along the spanwise direction becomes uniform as the influence of the wake disappears, and turns to a parabolic distribution due to the increase in wall influence at the position close to the outlet.

Figure 9.
Distribution of M0 in the flow around multiple cylinders (d0 = 98 nm, m00 = 3.6 × 10¹⁴/m3, Re = 9000).
4.2.2. Distribution of the Geometric Mean Diameter of Particles with the Initial Monodispersity
Figure 10 shows the distribution of the geometric mean diameters dg of particles along the flow and spanwise directions for initial monodisperse particles. The values of dg are given along the centerline of the flow in Figure 10a, where there are four jumps and discontinuities in the values of dg at the positions of the four columns of cylinders. The values of dg increase along the flow direction because of the occurrence of particle coagulation in the process of particle transportation downstream, showing that the characteristic time of the flow convection is longer than the characteristic time of the particle coagulation and that the particles have enough time to coagulate, while at the same time showing that the effect of particle coagulation is larger than that of particle breakage. The values of dg are larger for the case without considering particle breakage than that when considering particle breakage, which is reasonable because the number of small particles increases when considering particle breakage. Figure 10b shows the distribution of dg along the spanwise direction at different positions of x. The values of dg increase along the flow direction and fluctuate along the spanwise direction. The closer to the cylinders, the more frequent the fluctuations of dg due to the influence of the wake. In the far downstream area (x = 0.90), the distribution of dg along the spanwise direction shows a single arc due to the influence of the boundary. The values of dg are small in the middle and large on both sides at x = 0.50 and x = 0.90, which is the reason that the breakage of coagulated particles is larger in the middle area with high M0.
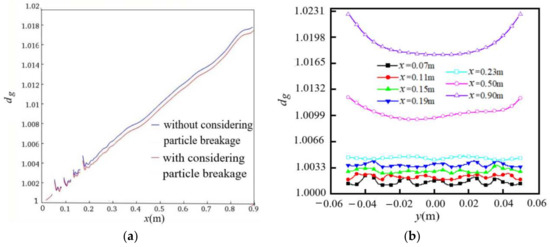
Figure 10.
Distribution of dg for initial monodisperse particles (d0 = 98 nm, m00 = 3.6×10¹⁴/m3, Re = 9000): (a) along the flow direction; (b) along the spanwise direction (considering particle breakage).
4.2.3. Distribution of Geometric Mean Diameter of Particles with Initial Polydispersity
Figure 11 shows the distribution of the geometric mean diameter dg of particles along the flow and spanwise directions for initial polydisperse particles with d0 = 98 nm and geometric standard deviation σ = 1.65. In Figure 11a, the variations of dg along the flow direction show the same trend as in Figure 10a, although the difference is that the values of dg are almost the same for the cases with and without considering particle breakage for the initial polydisperse particles. This is because the particle breakage distribution b(v|v1) included in Equation (6) is only for the parent particles composed of separated sub-particles, with the same size as that shown in Equation (10). The particle breakage is insignificant for the polydisperse particles of different sizes. In Figure 11b, the distribution of dg along the spanwise direction at different positions of x is similar to that shown in Figure 10b; the difference is that the distribution of dg along the spanwise direction is flatter in Figure 11b than in Figure 10b.
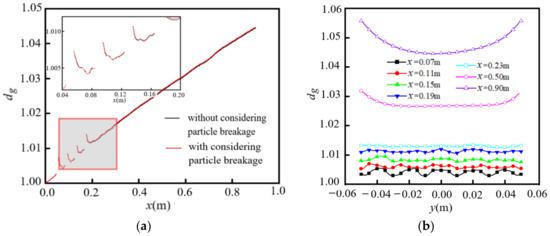
Figure 11.
Distribution of dg for initial polydisperse particles (d0 = 98 nm, m00 = 3.6 × 10¹⁴/m3, Re = 9000): (a) along theflow direction; (b) along the spanwise direction (considering particle breakage).
5. Conclusions
In this paper, the Reynolds averaged N-S equation and general dynamic equation for nanoparticles are numerically solved in the two-phase flow around a single cylinder and multiple cylinders. The distributions of M0 and dg values of particles with different m00 and d0 values are given. Some of the results are validated by comparing them with the experimental and numerical results. The effects of particle coagulation and breakage, m00 and d0, on the particle distribution are discussed. The main conclusions are summarized as follows:
- (1)
- For the flow around a single cylinder, there is an obvious particle coagulation phenomenon. The existence of a single cylinder has a great influence on the distribution of particles. The number of particles in the wake is dependent on the value of m00. In the flow upstream of the cylinder, there is almost no difference in M0 between the cases with and without considering particle breakage. Putting a cylinder in a uniform flow will promote particle breakage. As the flow develops downstream, the values of M0 for both cases with and without considering particle breakage tend to be uniformly distributed along the spanwise direction;
- (2)
- For the flow around multiple cylinders, the values of M0 are reduced along the flow direction upstream of the cylinders and oscillate laterally behind the cylinders under the influence of the flow structure. For the initial monodisperse particles, the effect of particle coagulation is larger than that of particle breakage. For the initial polydisperse particles with d0 = 98 nm and geometric standard deviation σ = 1.65, the variations in dg show the same trend as for the initial monodisperse particles, but the differences are that the values of dg are almost the same for the cases with and without considering particle breakage;
- (3)
- In future work, it will be necessary to further study the numerical simulation of three-dimensional flow and to explore the particle breakage model in the case of polydisperse particles.
Author Contributions
Conceptualization, J.L. and R.S.; methodology, R.S. and H.Y.; software, R.S. and H.Y.; validation, R.S. and H.Y.; writing, R.S. and H.Y.; resources R.S. and J.L.; review, J.L. All authors have read and agreed to the published version of the manuscript.
Funding
This work was supported by the National Natural Science Foundation of China (Grant no. 12132015).
Institutional Review Board Statement
Not applicable.
Informed Consent Statement
Not applicable.
Conflicts of Interest
There are no conflicts of interest regarding the publication of this paper.
References
- Zhou, H.; Mo, G.; Cen, K. Numerical investigation of dispersed gas-solid two-phase flow around a circular cylinder using lattice Boltzmann method. Comput. Fluids 2011, 52, 130–138. [Google Scholar] [CrossRef]
- Haddadi, H.; Shojaei-zadeh, S.; Morris, J.F. Lattice-Boltzmann simulation of inertial particle-laden flow around an obstacle. Phys. Rev. Fluids 2016, 1, 024201. [Google Scholar] [CrossRef]
- Jafari, S.; Salmanzadeh, M.; Rahnama, M.; Ahmadi, G. Investigation of particle dispersion and deposition in a channel with a square cylinder obstruction using the lattice Boltzmann method. J. Aerosol Sci. 2010, 41, 198–206. [Google Scholar] [CrossRef]
- Haddadi, H.; Shojaei-Zadeh, S.; Connington, K.; Morris, J.F. Suspension flow past a cylinder: Particle interactions with recirculating wakes. J. Fluid Mech. 2014, 760, R2. [Google Scholar] [CrossRef]
- Huang, Q.; Zhang, Y.; Yao, Q.; Li, S.Q. Numerical and experimental study on the deposition offine particulate matter during the combustion of pulverized lignite coal in a 25 kW combustor. Powder Technol. 2017, 317, 449–457. [Google Scholar] [CrossRef]
- Jeong, S.; Kim, D. Simulation of the particle deposition on a circular cylinder in high-temperature particle-laden flow. Korean Soc. Manuf. Process Eng. 2019, 18, 73–81. [Google Scholar] [CrossRef]
- Gopan, A.; Yang, Z.; Axelbaum, R.L. Predicting particle deposition for flow over a circular cylinder in combustion environments. Proc. Combust. Inst. 2019, 37, 4427–4434. [Google Scholar] [CrossRef]
- Keita, N.S.; Mehel, A.; Murzyn, F.; Taniere, A.; Arcen, B.; Diourte, B. Numerical study of ultrafine particles dispersion in the wake of a cylinder. Atmos. Pollut. Res. 2019, 10, 294–302. [Google Scholar] [CrossRef]
- Tu, C.; Zhang, J. Nanoparticle-laden gas flow around a circular cylinder at high Reynolds number. Int. J. Numer. Methods Heat Fluid Flow 2014, 24, 1782–1794. [Google Scholar] [CrossRef]
- Liu, H.; Yang, F.; Tan, H.; Li, Z.H.; Feng, P.; Du, Y.L. Experimental and numerical investigation on the structure characteristics of vortex generators affecting particle agglomeration. Powder Technol. 2020, 362, 805–816. [Google Scholar] [CrossRef]
- Kolsi, L.; Selimefendigil, F.; Oztop, H.F.; Hassen, W.; Aich, W. Impacts of double rotating cylinders on the forced convection of hybrid nanofluid in a bifurcating channel with partly porous layers. Case Stud. Therm. Eng. 2021, 26, 101020. [Google Scholar] [CrossRef]
- Alsabery, A.I.; Selimefendigil, F.; Hashim, I.; Chamkha, A.J.; Ghalambaz, M. Fluid-structure interaction analysis of entropy generation and mixed convection inside a cavity with flexible right wall and heated rotating cylinder. Int. J. Heat Mass Transf. 2019, 140, 331–345. [Google Scholar] [CrossRef]
- Ramkrishna, D. Population Balances: Theory and Applications to Particulate Systems in Engineering; Academic Press: London, UK, 2000. [Google Scholar]
- Vasudev, V.; Ku, X.K.; Lin, J.L. Kinetic study and pyrolysis characteristics of algal and lignocellulosic biomasses. Bioresour. Technol. 2019, 288, 121496. [Google Scholar] [CrossRef] [PubMed]
- Guichard, R.; Belut, E. Simulation of airborne nanoparticles transport, deposition and aggregation: Experimental validation of a CFD-QMOM approach. J. Aerosol Sci. 2017, 104, 16–31. [Google Scholar] [CrossRef][Green Version]
- Yu, M.; Lin, J.Z. Taylor-expansion moment method for agglomerate coagulation due to Brownian motion in the entire size regime. J. Aerosol Sci. 2009, 40, 549–562. [Google Scholar] [CrossRef]
- Saffman, P.G.; Turner, J.S. On the collision of drops in turbulent clouds. J. Fluid Mech. 1956, 1, 16–30. [Google Scholar] [CrossRef]
- Spicer, P.T.; Pratsinis, S.E. Coagulation and fragmentation: Universal steady-state particle-size distribution. AIChE J. 1996, 42, 1612–1620. [Google Scholar] [CrossRef]
- Lick, W.; Lick, J. Aggregation and disaggregation of fine-grained lake sediments. J. Great Lakes Res. 1988, 14, 514–523. [Google Scholar] [CrossRef]
- Yu, M.; Lin, J.; Chan, T. A new moment method for solving the coagulation equation for particles in Brownian motion. Aerosol Sci. Technol. 2008, 42, 705–713. [Google Scholar] [CrossRef]
- Lam, K.; Wang, F.H.; So, R.M.C. Three-dimensional nature of vortices in the near wake of a wavy cylinder. J. Fluids Struct. 2004, 19, 815–833. [Google Scholar] [CrossRef]
- Lin, J.Z.; Qian, L.J.; Xiong, H.B. Effects of operating conditions on the droplet deposition onto surface in the atomization impinging spray with an impinging plate. Surf. Coat. Technol. 2009, 203, 1733–1740. [Google Scholar] [CrossRef]
- Qian, L.J.; Lin, J.Z.; Xiong, H.B. A fitting formula for predicting droplet mean diameter for various liquid in effervescent atomization spray. J. Therm. Spray Technol. 2010, 19, 586–601. [Google Scholar] [CrossRef]
- Yu, M.Z.; Lin, J.Z. Binary homogeneous nucleation and growth of water-sulfuric acid nanoparticles using a TEMOM model. Int. J. Heat Mass Transf. 2010, 53, 635–644. [Google Scholar] [CrossRef]
Publisher’s Note: MDPI stays neutral with regard to jurisdictional claims in published maps and institutional affiliations. |
© 2022 by the authors. Licensee MDPI, Basel, Switzerland. This article is an open access article distributed under the terms and conditions of the Creative Commons Attribution (CC BY) license (https://creativecommons.org/licenses/by/4.0/).