
Volatility Dynamics of Non-Linear Volatile Time Series and Analysis of Information Flow: Evidence from Cryptocurrency Data


Abstract
1. Introduction
1.1. Complex Systems and Statistical Relationships
1.2. Transfer Entropy and Mutual Information
1.3. Cryptocurrencies and Transfer Entropy
1.4. Hypothesis Development
2. Methods
2.1. Returns, Volatility and Correlation
2.2. Hurst Exponent
- where R denotes the rescaled range of variation, S—standard deviation, k—constant, N—number of sample elements, H—the Hurst exponent;
- The hurst exponent ranges from zero to one;
- For random (Wiener) processes in particular, the Hurst index turns out equal to 0.5;
- A value larger than 0.5 may indicate a fractal model or long-run dependence and positively correlated;
- A value less than 0.5 indicates rough anti-correlated series.
| Algorithm 1. Hurst Exponent Computations |
|
2.3. Shannon Entropy
- where the convention holds, and , represents the probability of , for . therefore, and ;
- The entropy will be equal to its maximum value if all events follow the equally likely assumption;
- An event for which probability is less than one, the entropy has a positive sign;
- Shannon entropy is utilized for quantifying the variability in an individual random variable.
2.4. Rényi Entropy
- The Rényi’s entropy is a non-negative, monotonically decreasing function of r and for r = 1, Rényi’s entropy converges to Shannon’s entropy;
- For r closer to 0, Rényi entropy becomes uniform to all possible events and independent of the density function of the random variables;
- The different values of r can be used to express the influence of the different probability intervals on the results;
- For r > 1, the Rényi entropy depends more on the values with large probabilities and less on those of the rare ones.
2.5. Mutual Information
- Mutual information measures mutual dependence. In other words, it determines how much information is communicated between two random variables;
- We can use MI to infer about one random time series by observing another random one;
- MI measures linear and nonlinear dependencies between two time series. The measure can be used as a nonlinear equivalent of the correlation function;
- It is a symmetric measure, therefore the direction of information cannot be distinguished;
- Higher values indicate stronger dependency, and low values, a weaker dependence. For two independent variables, the MI value is zero.
2.6. Shannon and Rényi Transfer Entropies
- The TE is defined as the ratio of the conditional distribution of one variable depending on the past samples of both processes versus the conditional distribution of that variable depending only on its own past values;
- The asymmetry of TE results in a differentiation of the two directions of information flow;
- We may note that for independent processes, the TE is zero and it is not a symmetric measure;
- The TE quantifies the information flow from process X to process by measuring the deviation from the generalized Markov property;
- The difference between and allows to discover the dominant direction of the information flow;
- The common choices of the order of the Markov process are conducted by ;
- Transfer entropy (TE) is closely related to conditional entropy, but it extends to two processes.
2.7. Effective Transfer Entropy
| Algorithm 2. Transfer Entropies Computations |
|
3. Analyzing Data
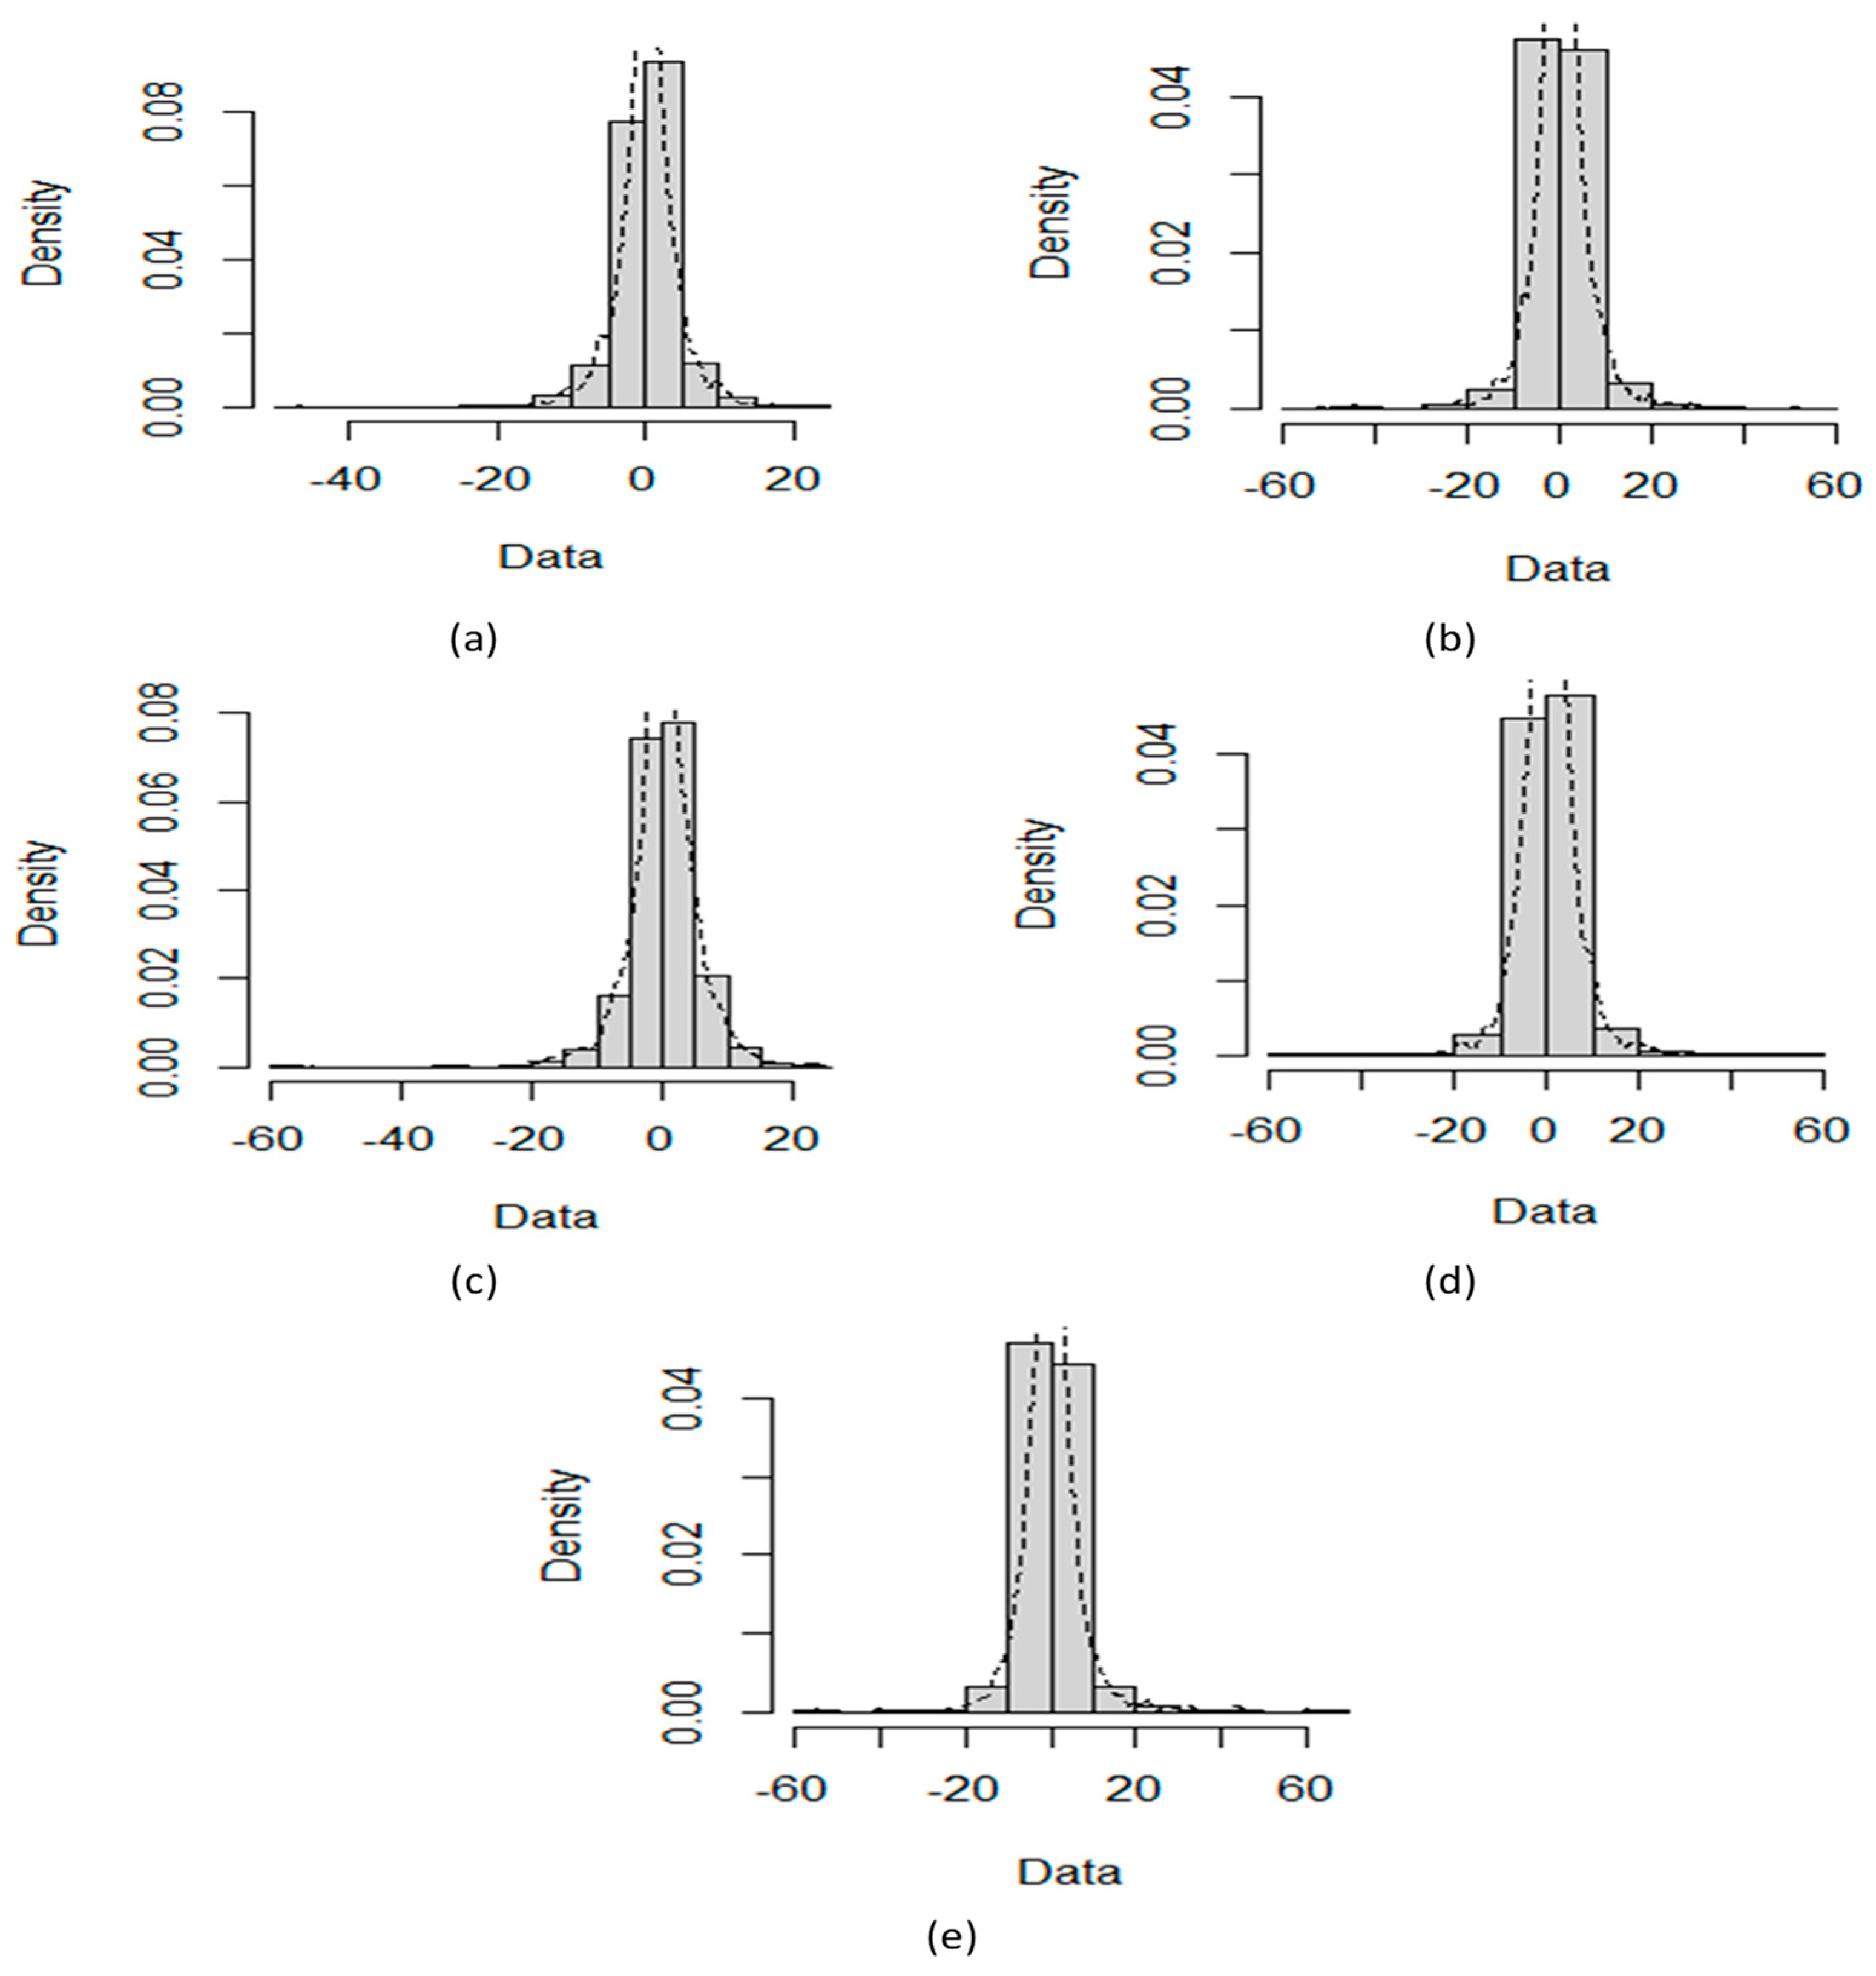
3.1. Distributional Properties and Nonlinearity Tests
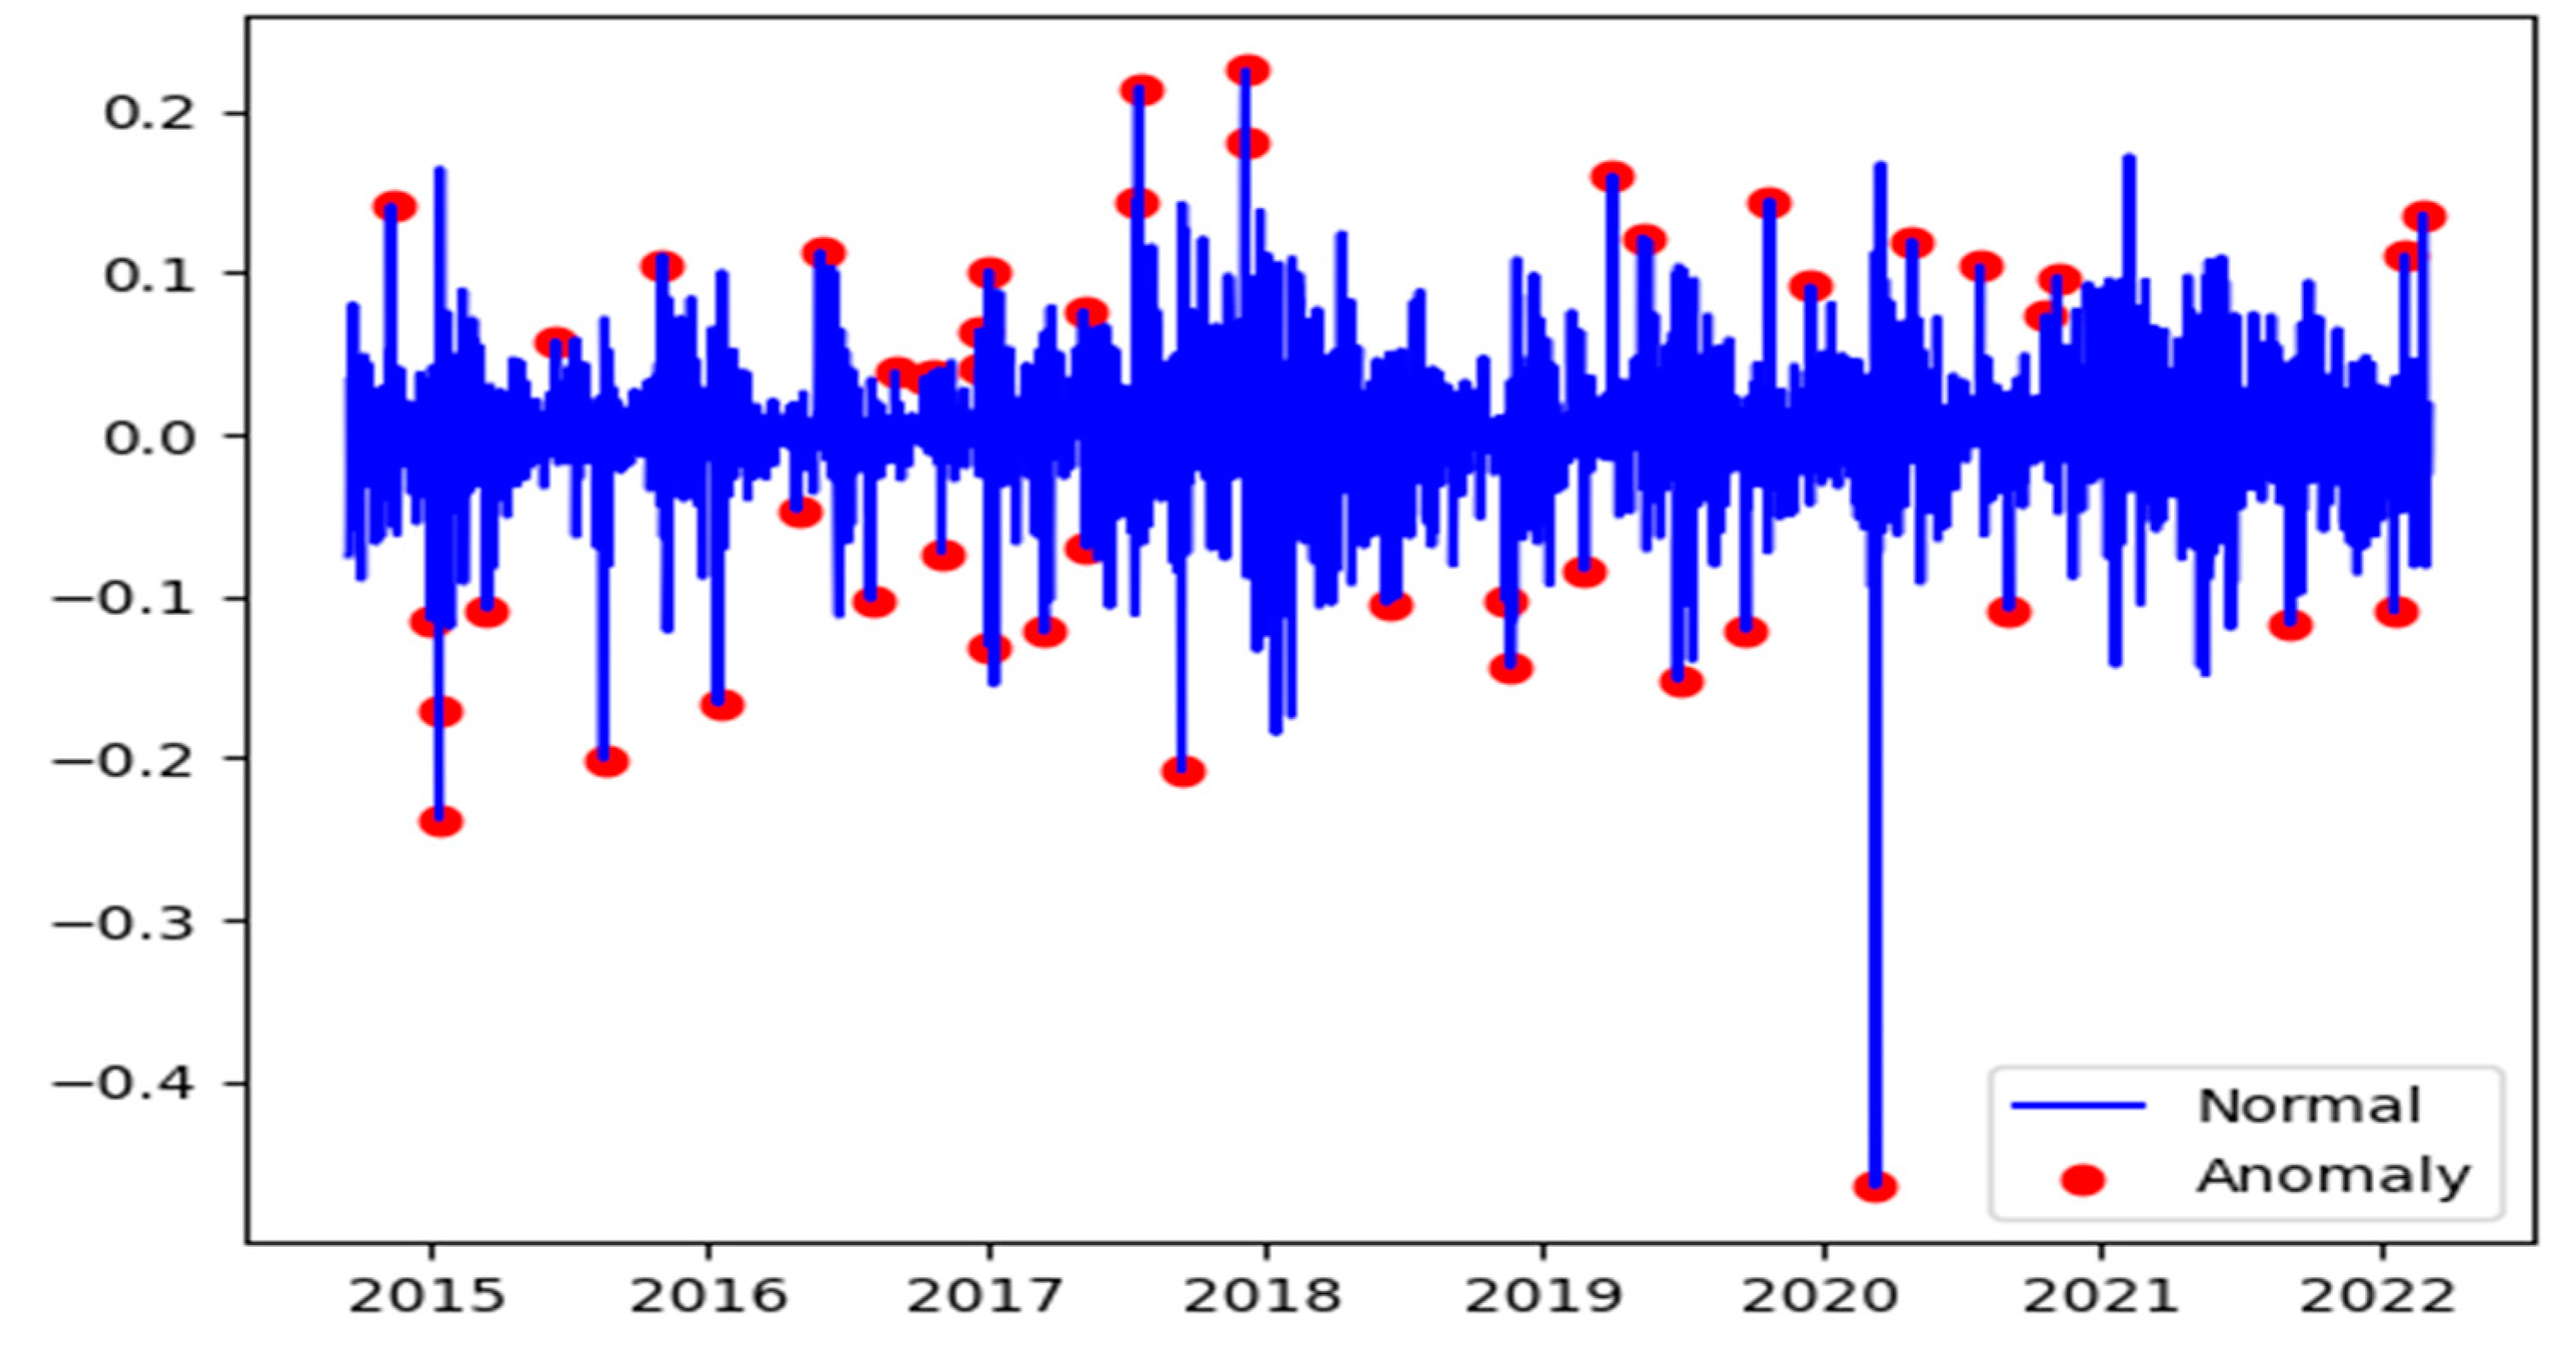
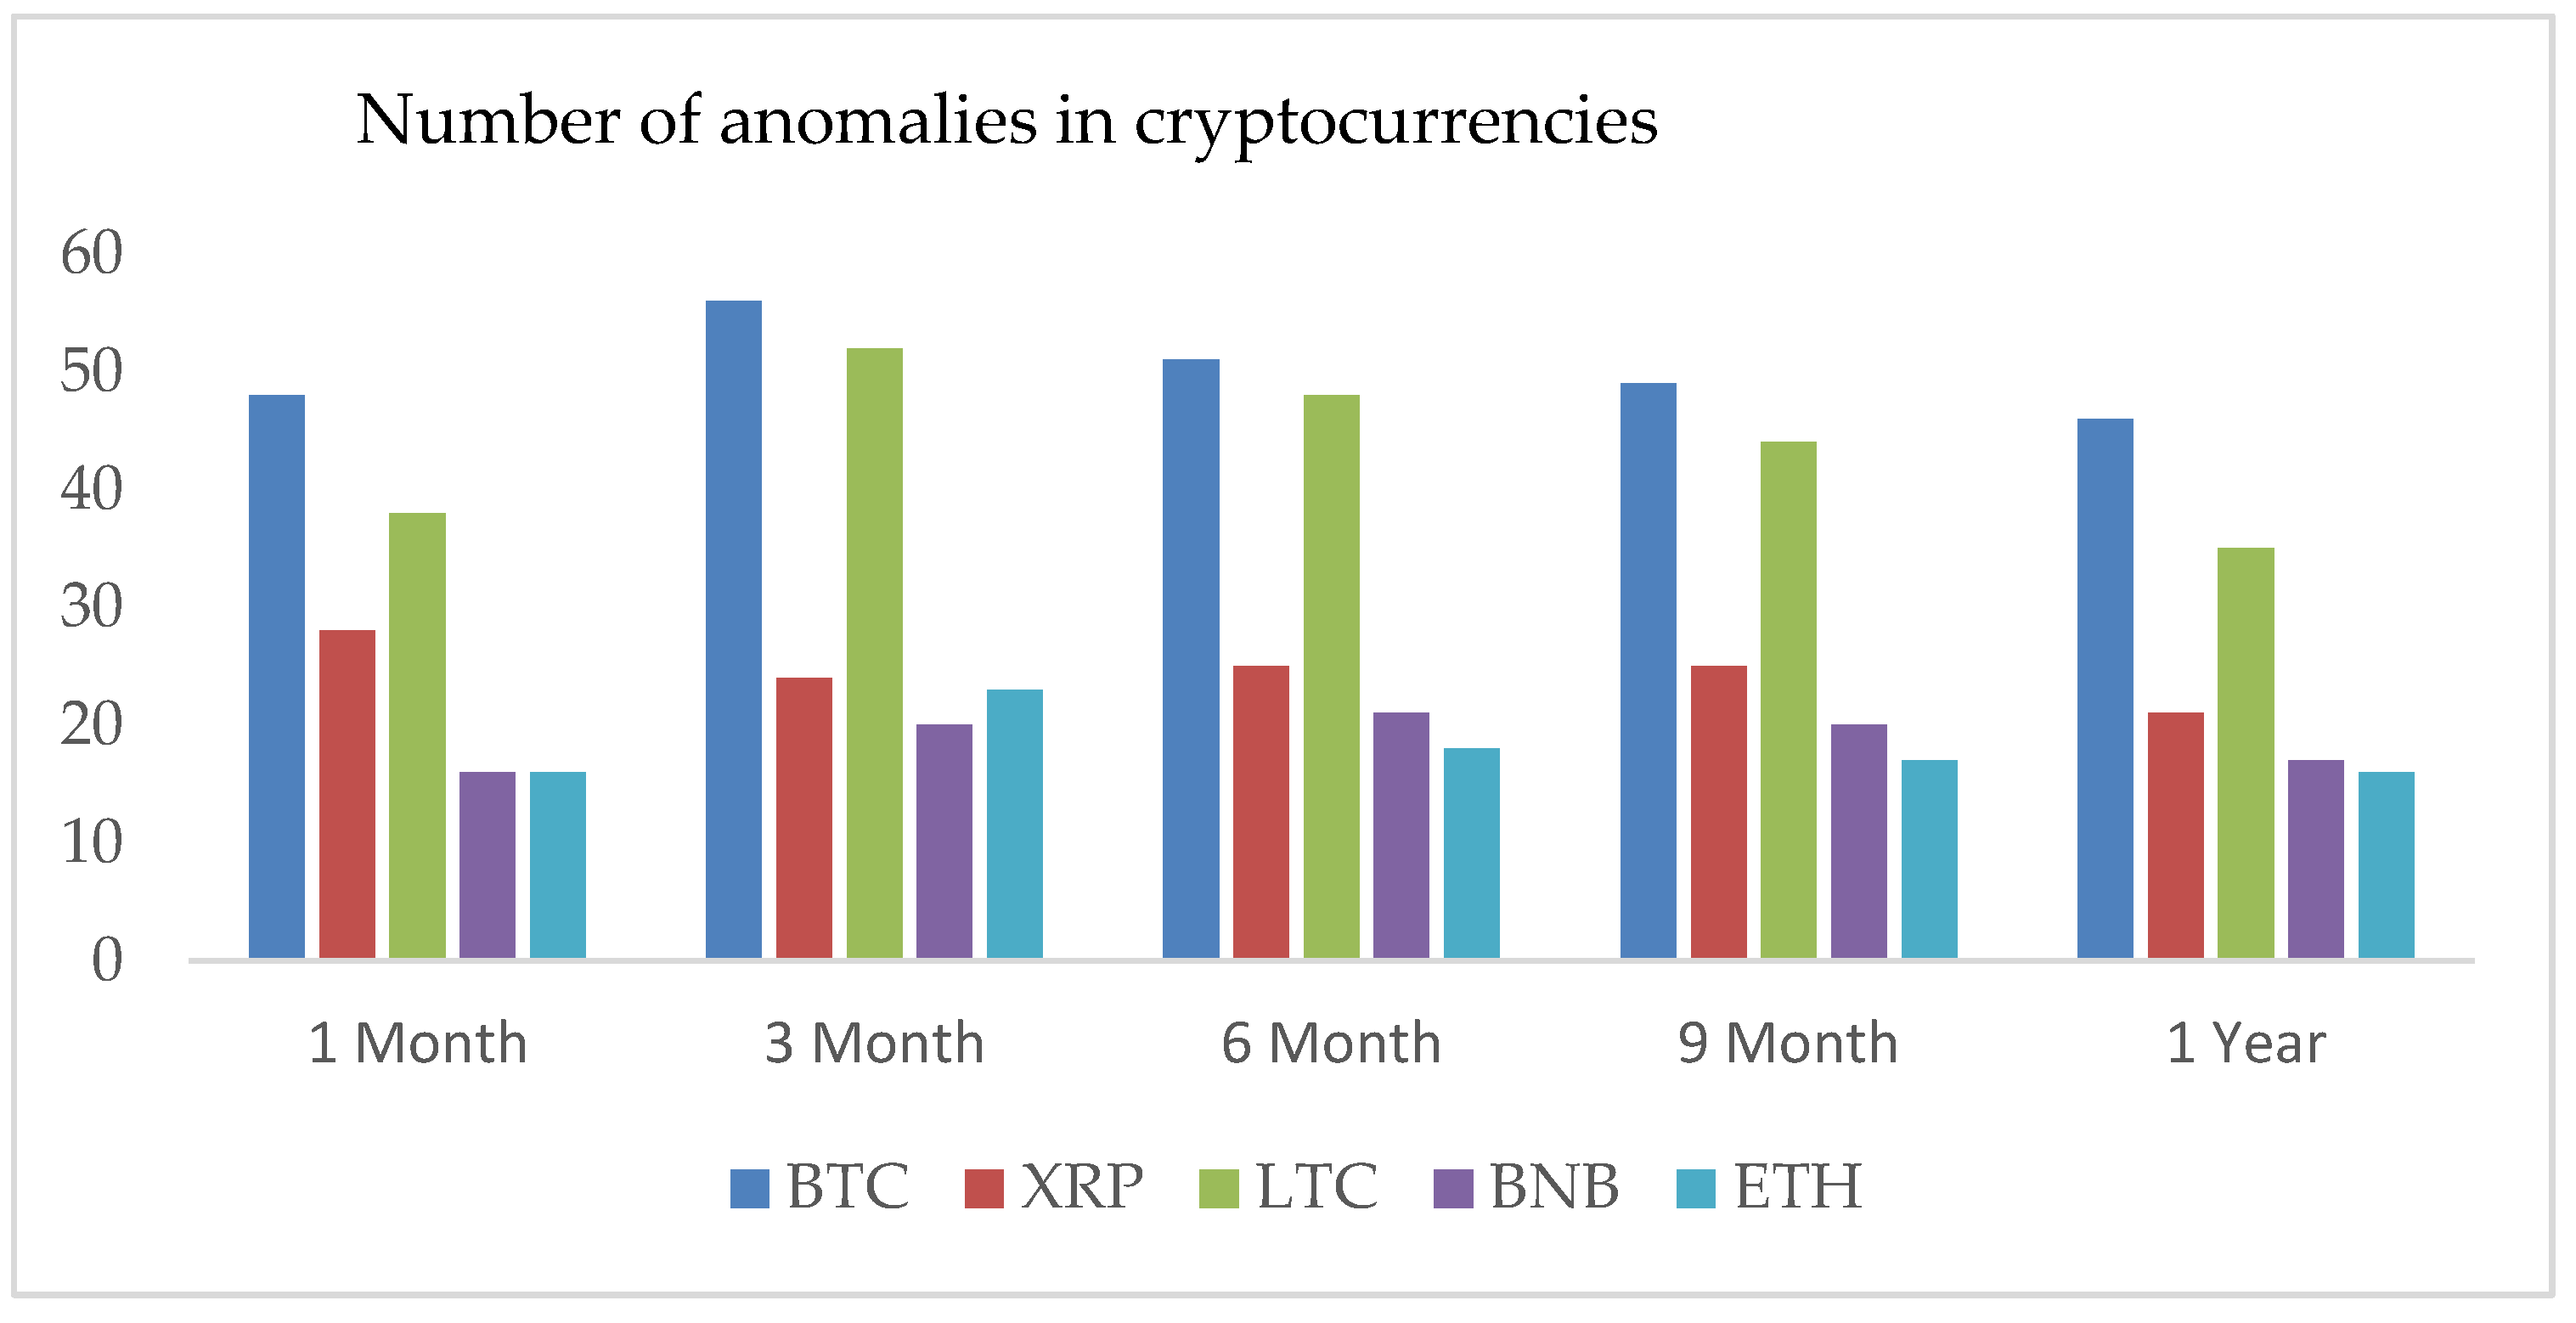
3.2. Anomalies in Cryptocurrencies Data
3.3. Long Memory
4. Results
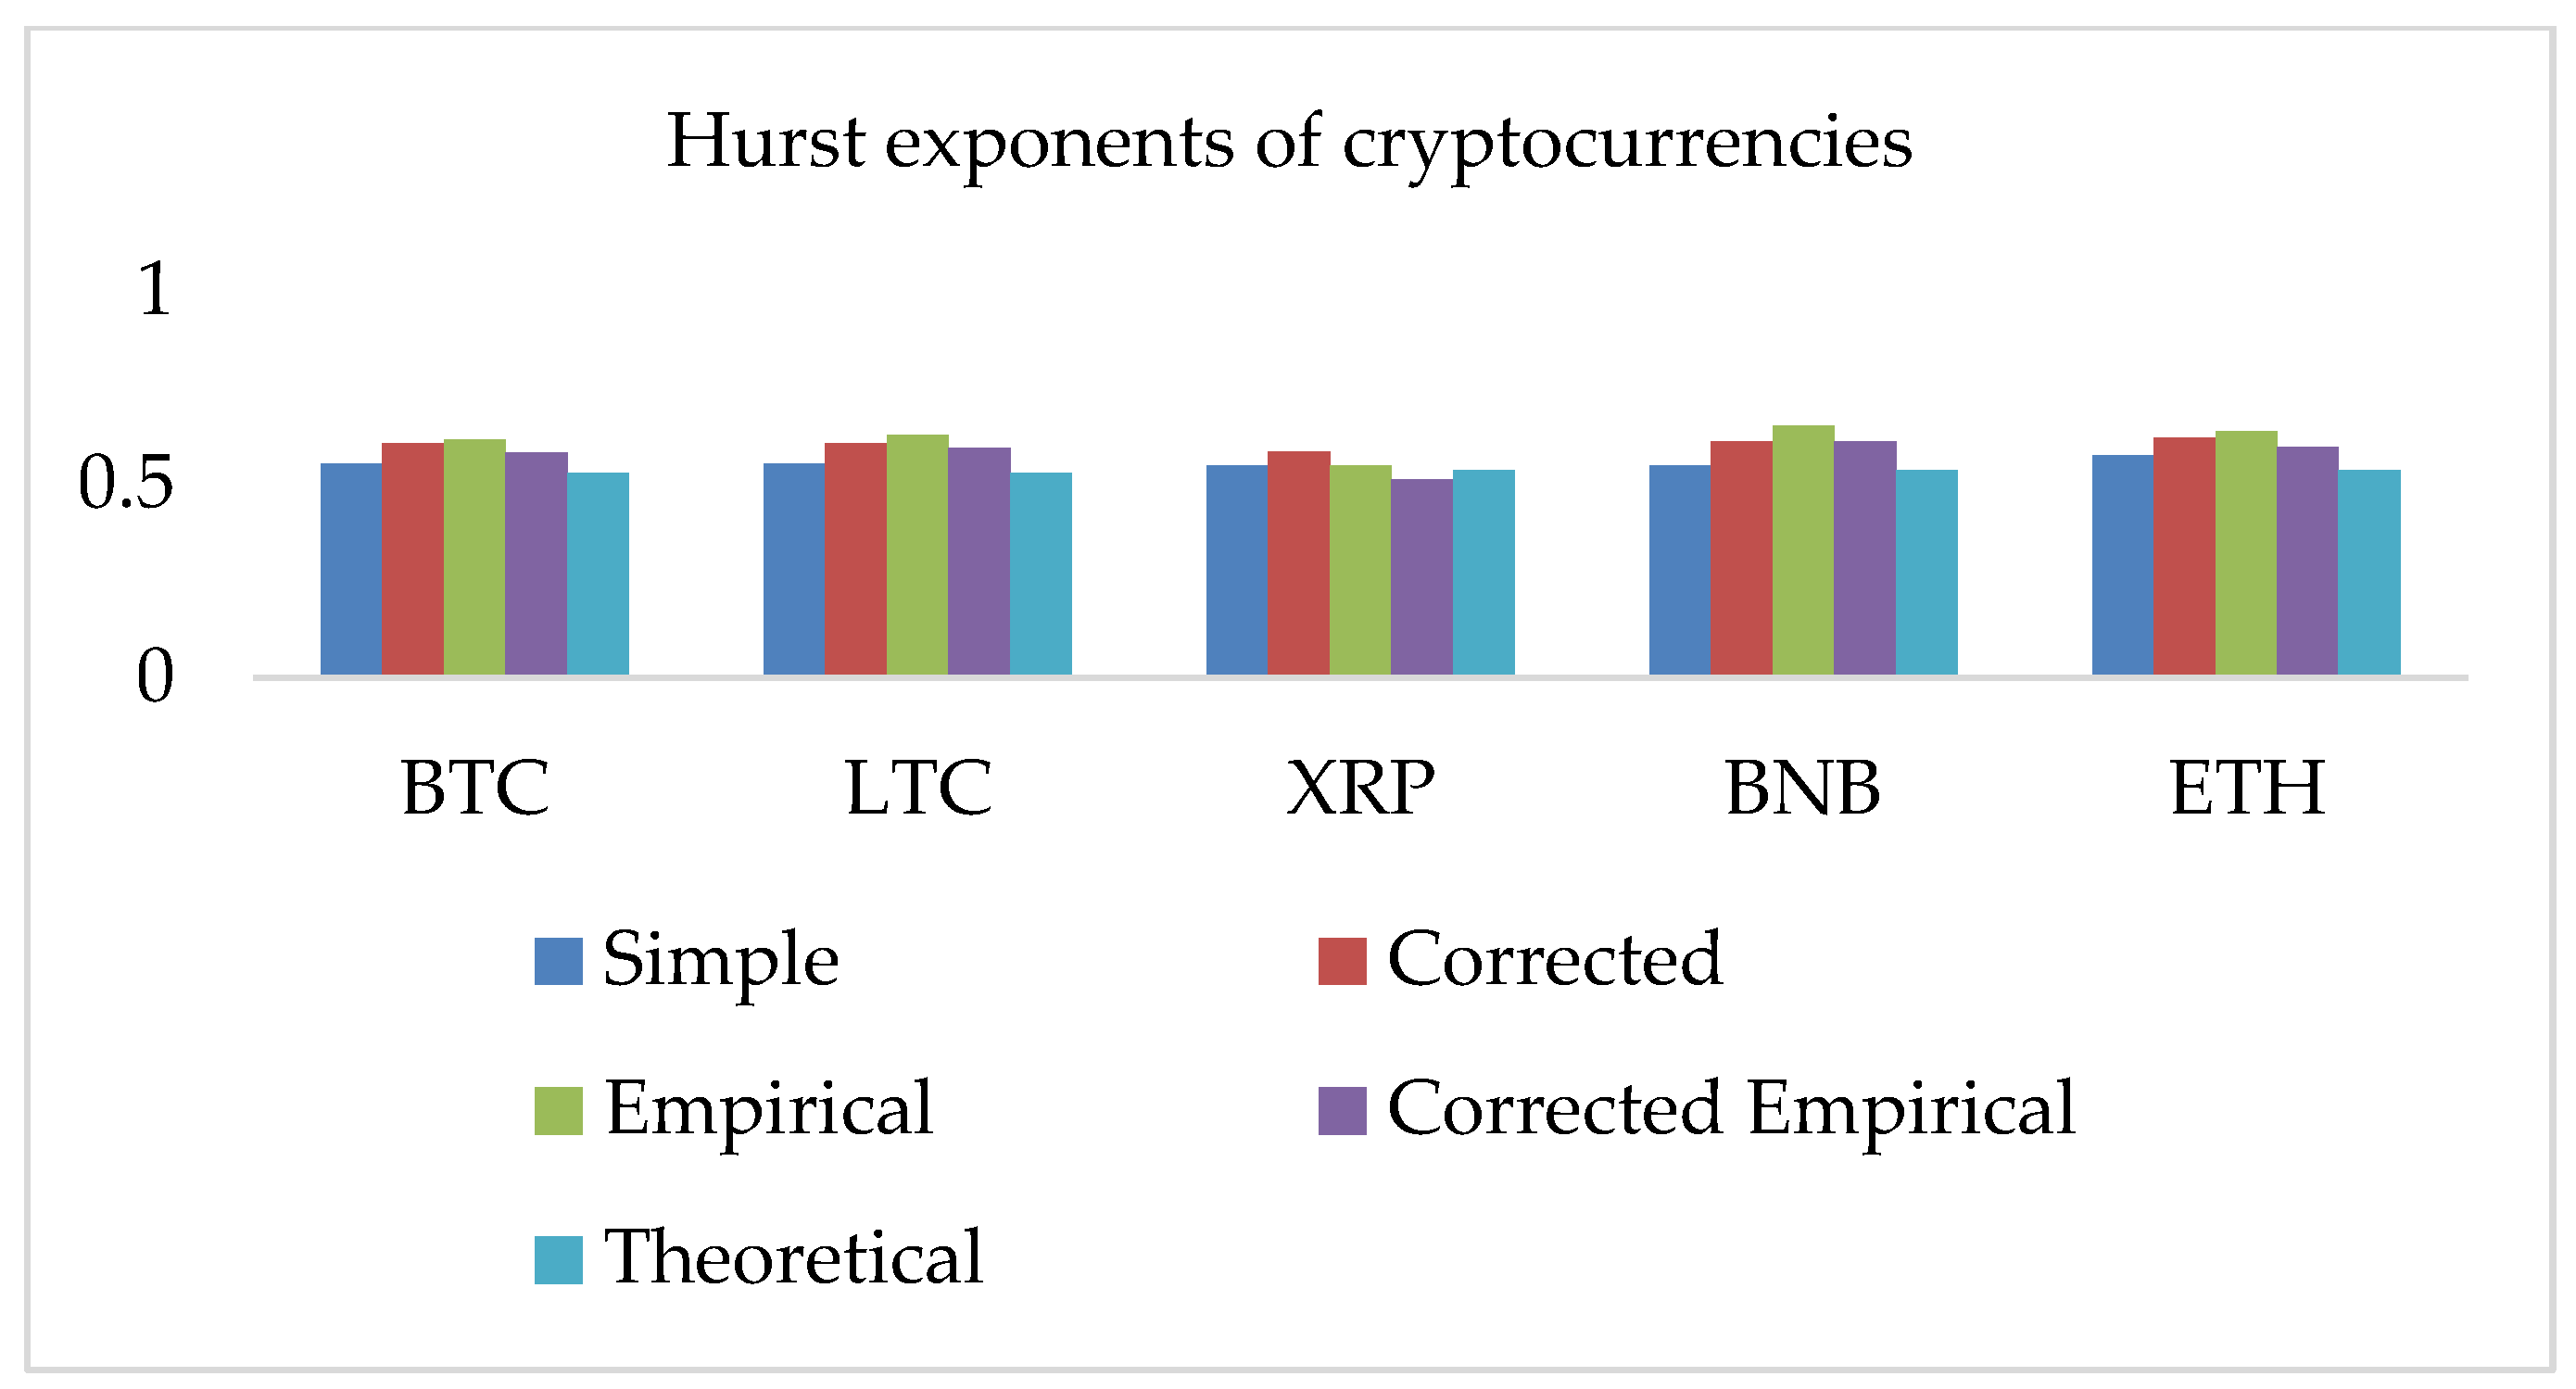
4.1. Hurst Exponent Analysis
4.2. Mutual Information of Cryptocurrencies Returns and Estimated Volatilities
4.3. Transfer Entropies Results of OHLC Volatilities
5. Discussion and Conclusions
- We conclude that underlying returns and estimated volatilities movements of five cryptocurrencies are not independent over time;
- All datasets contain positive long-term autocorrelation, which implies persistent time series with long-term memory and connection with the Hurst exponent;
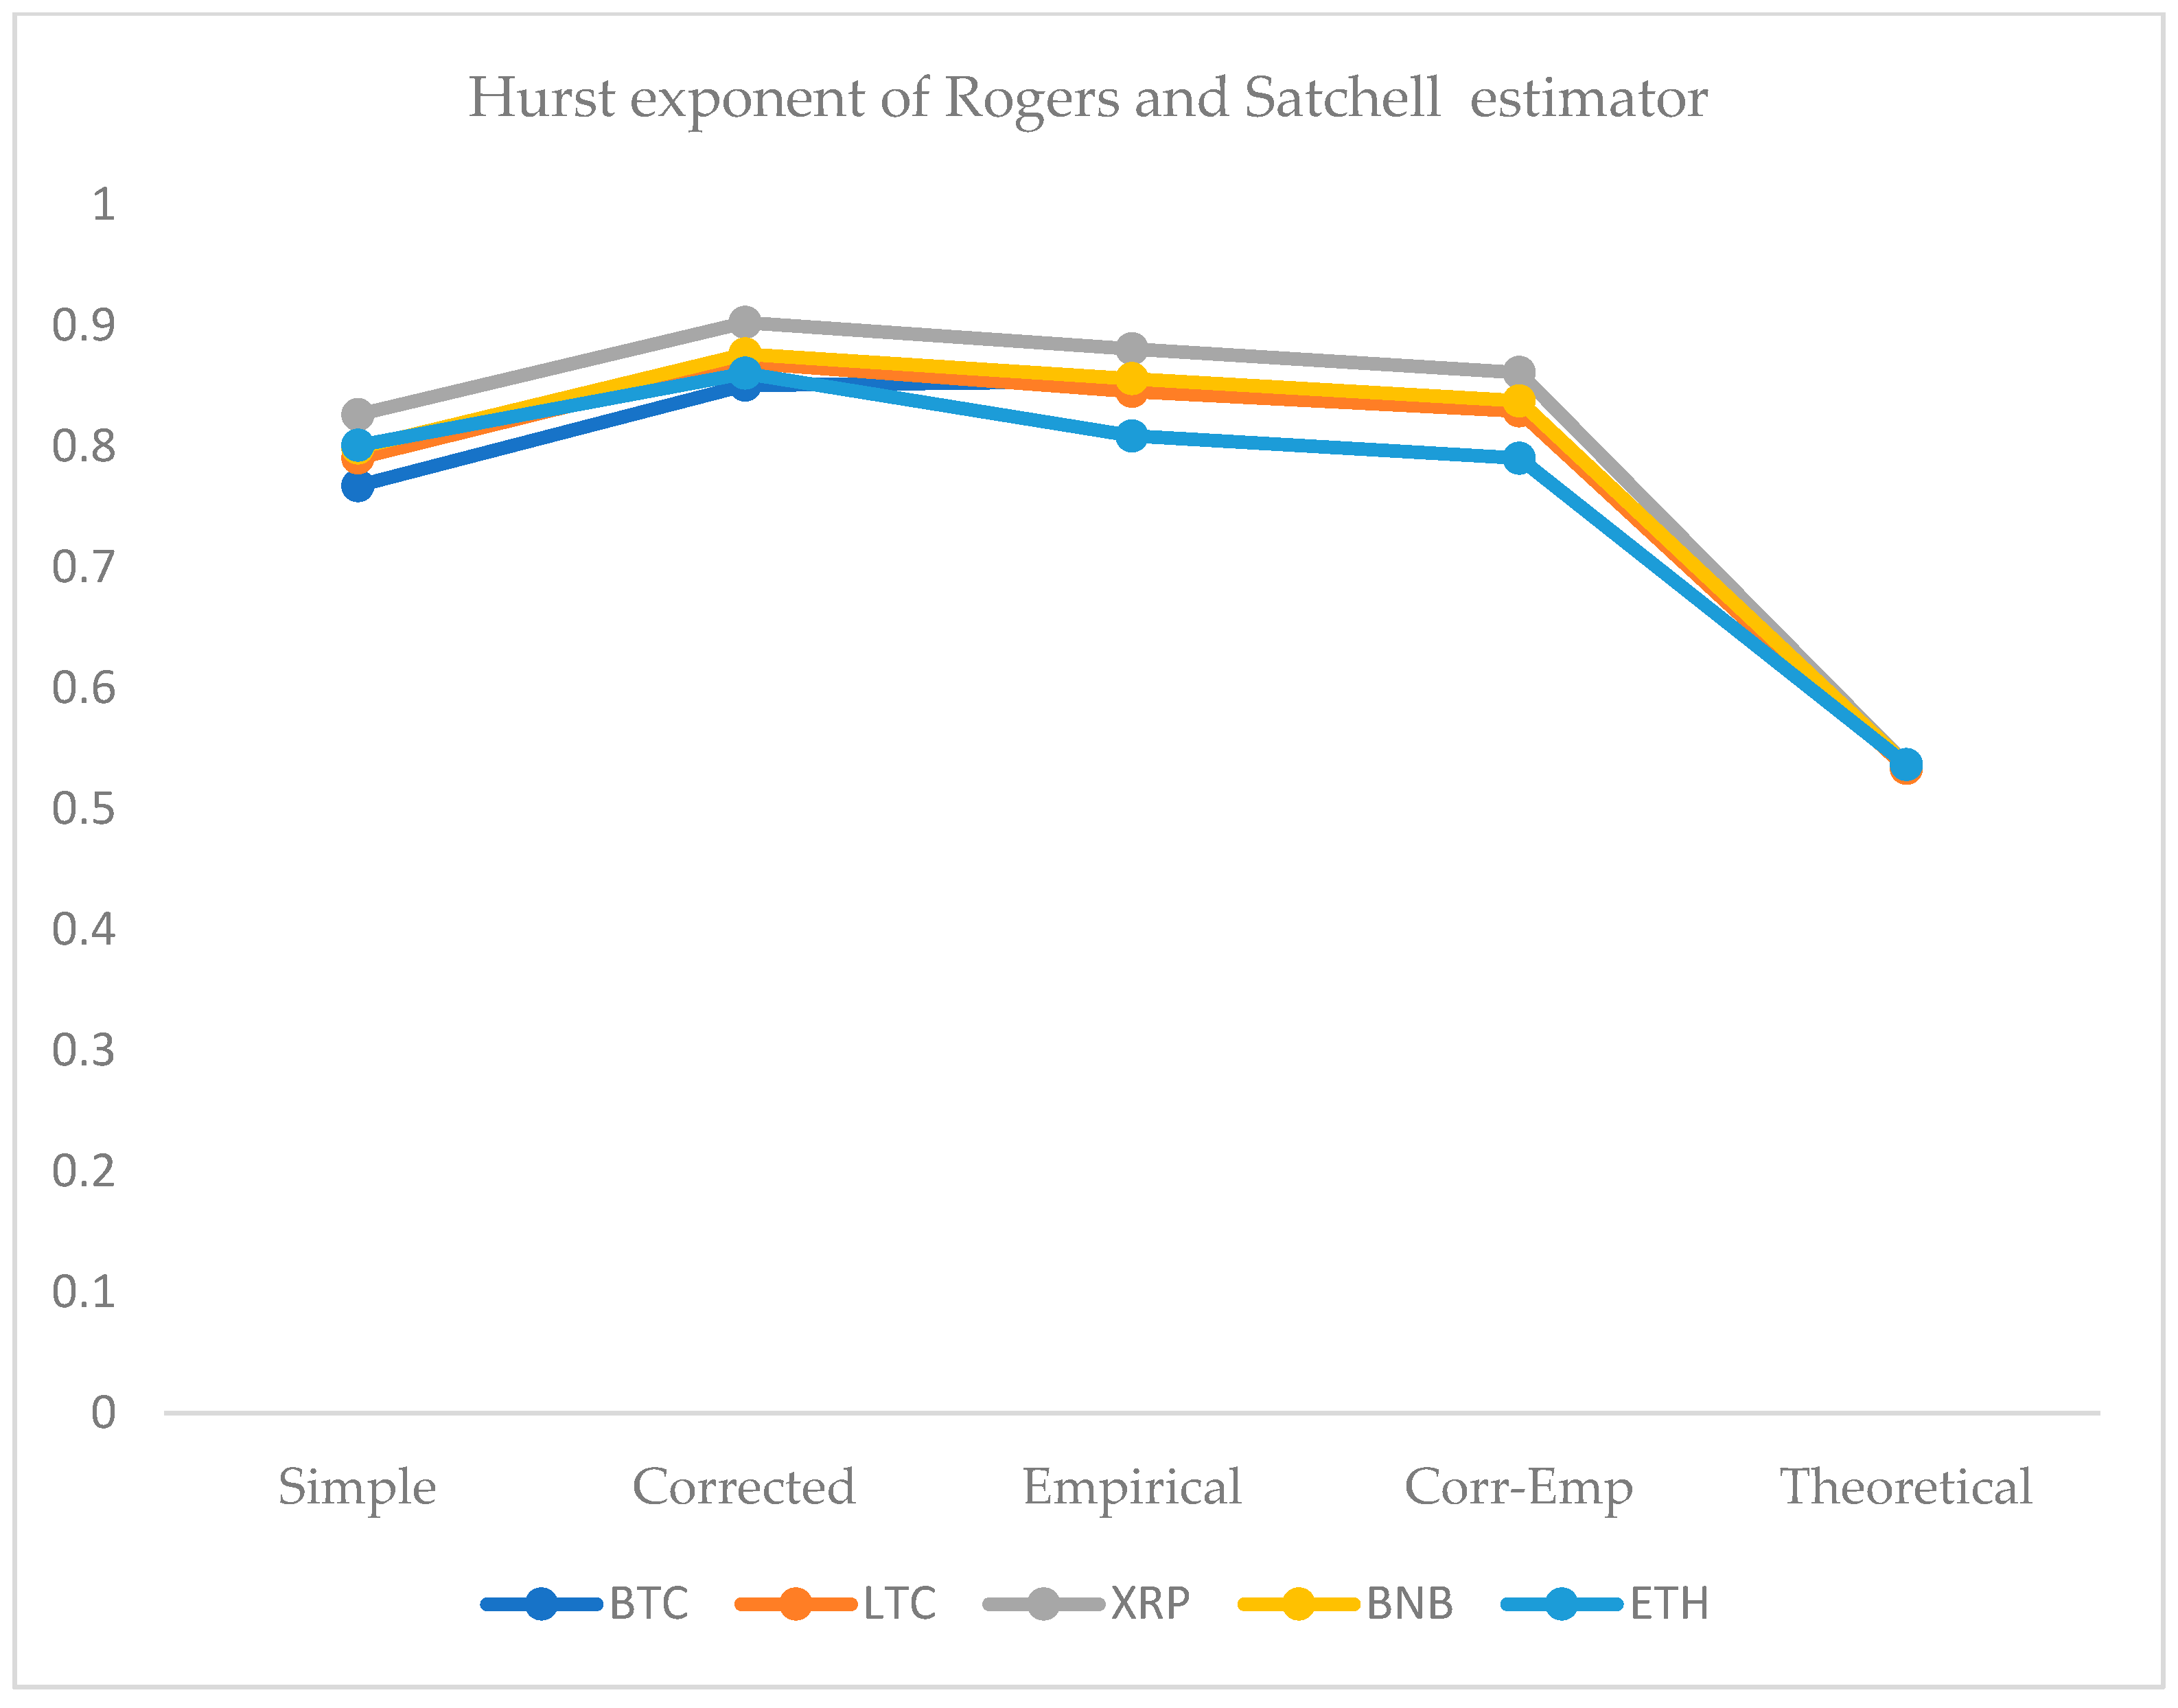
- We obtained all HE values larger than 0.5 for all returns series data that indicate a fractal model or long-run dependence. Therefore, these data series might attempt to express a persistent behavior and a nonlinear variance growth;
- A choice of fractional Brownian motion model for underlying data series can incorporate the variance that does not grow linear over time;
- Traditionally, economists investigate and execute analyses under the efficient market hypothesis following the standard Brownian motion model. Our results recommend that the volatility series of these cryptocurrencies tend to grow faster over time because all Hurst exponents are higher than 0.5 for all OHLC estimates;
- The Hurst exponents greater than 0.5 indicates an inefficient market. Therefore, investors, risk managers, and policymakers could distinguish the underlying returns or estimates of volatility series based on the value of the Hurst exponent;
- Our study proposes that log returns and estimated volatility series of Bitcoin and the other four cryptocurrencies deviate from the random walk model and mean reverting characteristics.
- ETH and BNB, and BTC and LTC shared the highest mutual information;
- For OHLC volatility estimates, ETH and XRP shared the highest mutual information and BTC and LTC show almost a constant trend of sharing mutual information;
- The overall trend of mutual information for realized volatility estimates of BTC and LTC and ETH, XRP, and BNB have increased over time, spanning from one month to one year.
- The Shannon and effective transfer entropies are statistically significant for BTC and LTC in both directions. Similarly, for the second dataset (ETH, BNB, XRP) of underlying cryptocurrencies, all p-values for transfer entropies of OHLC estimators are statistically significant;
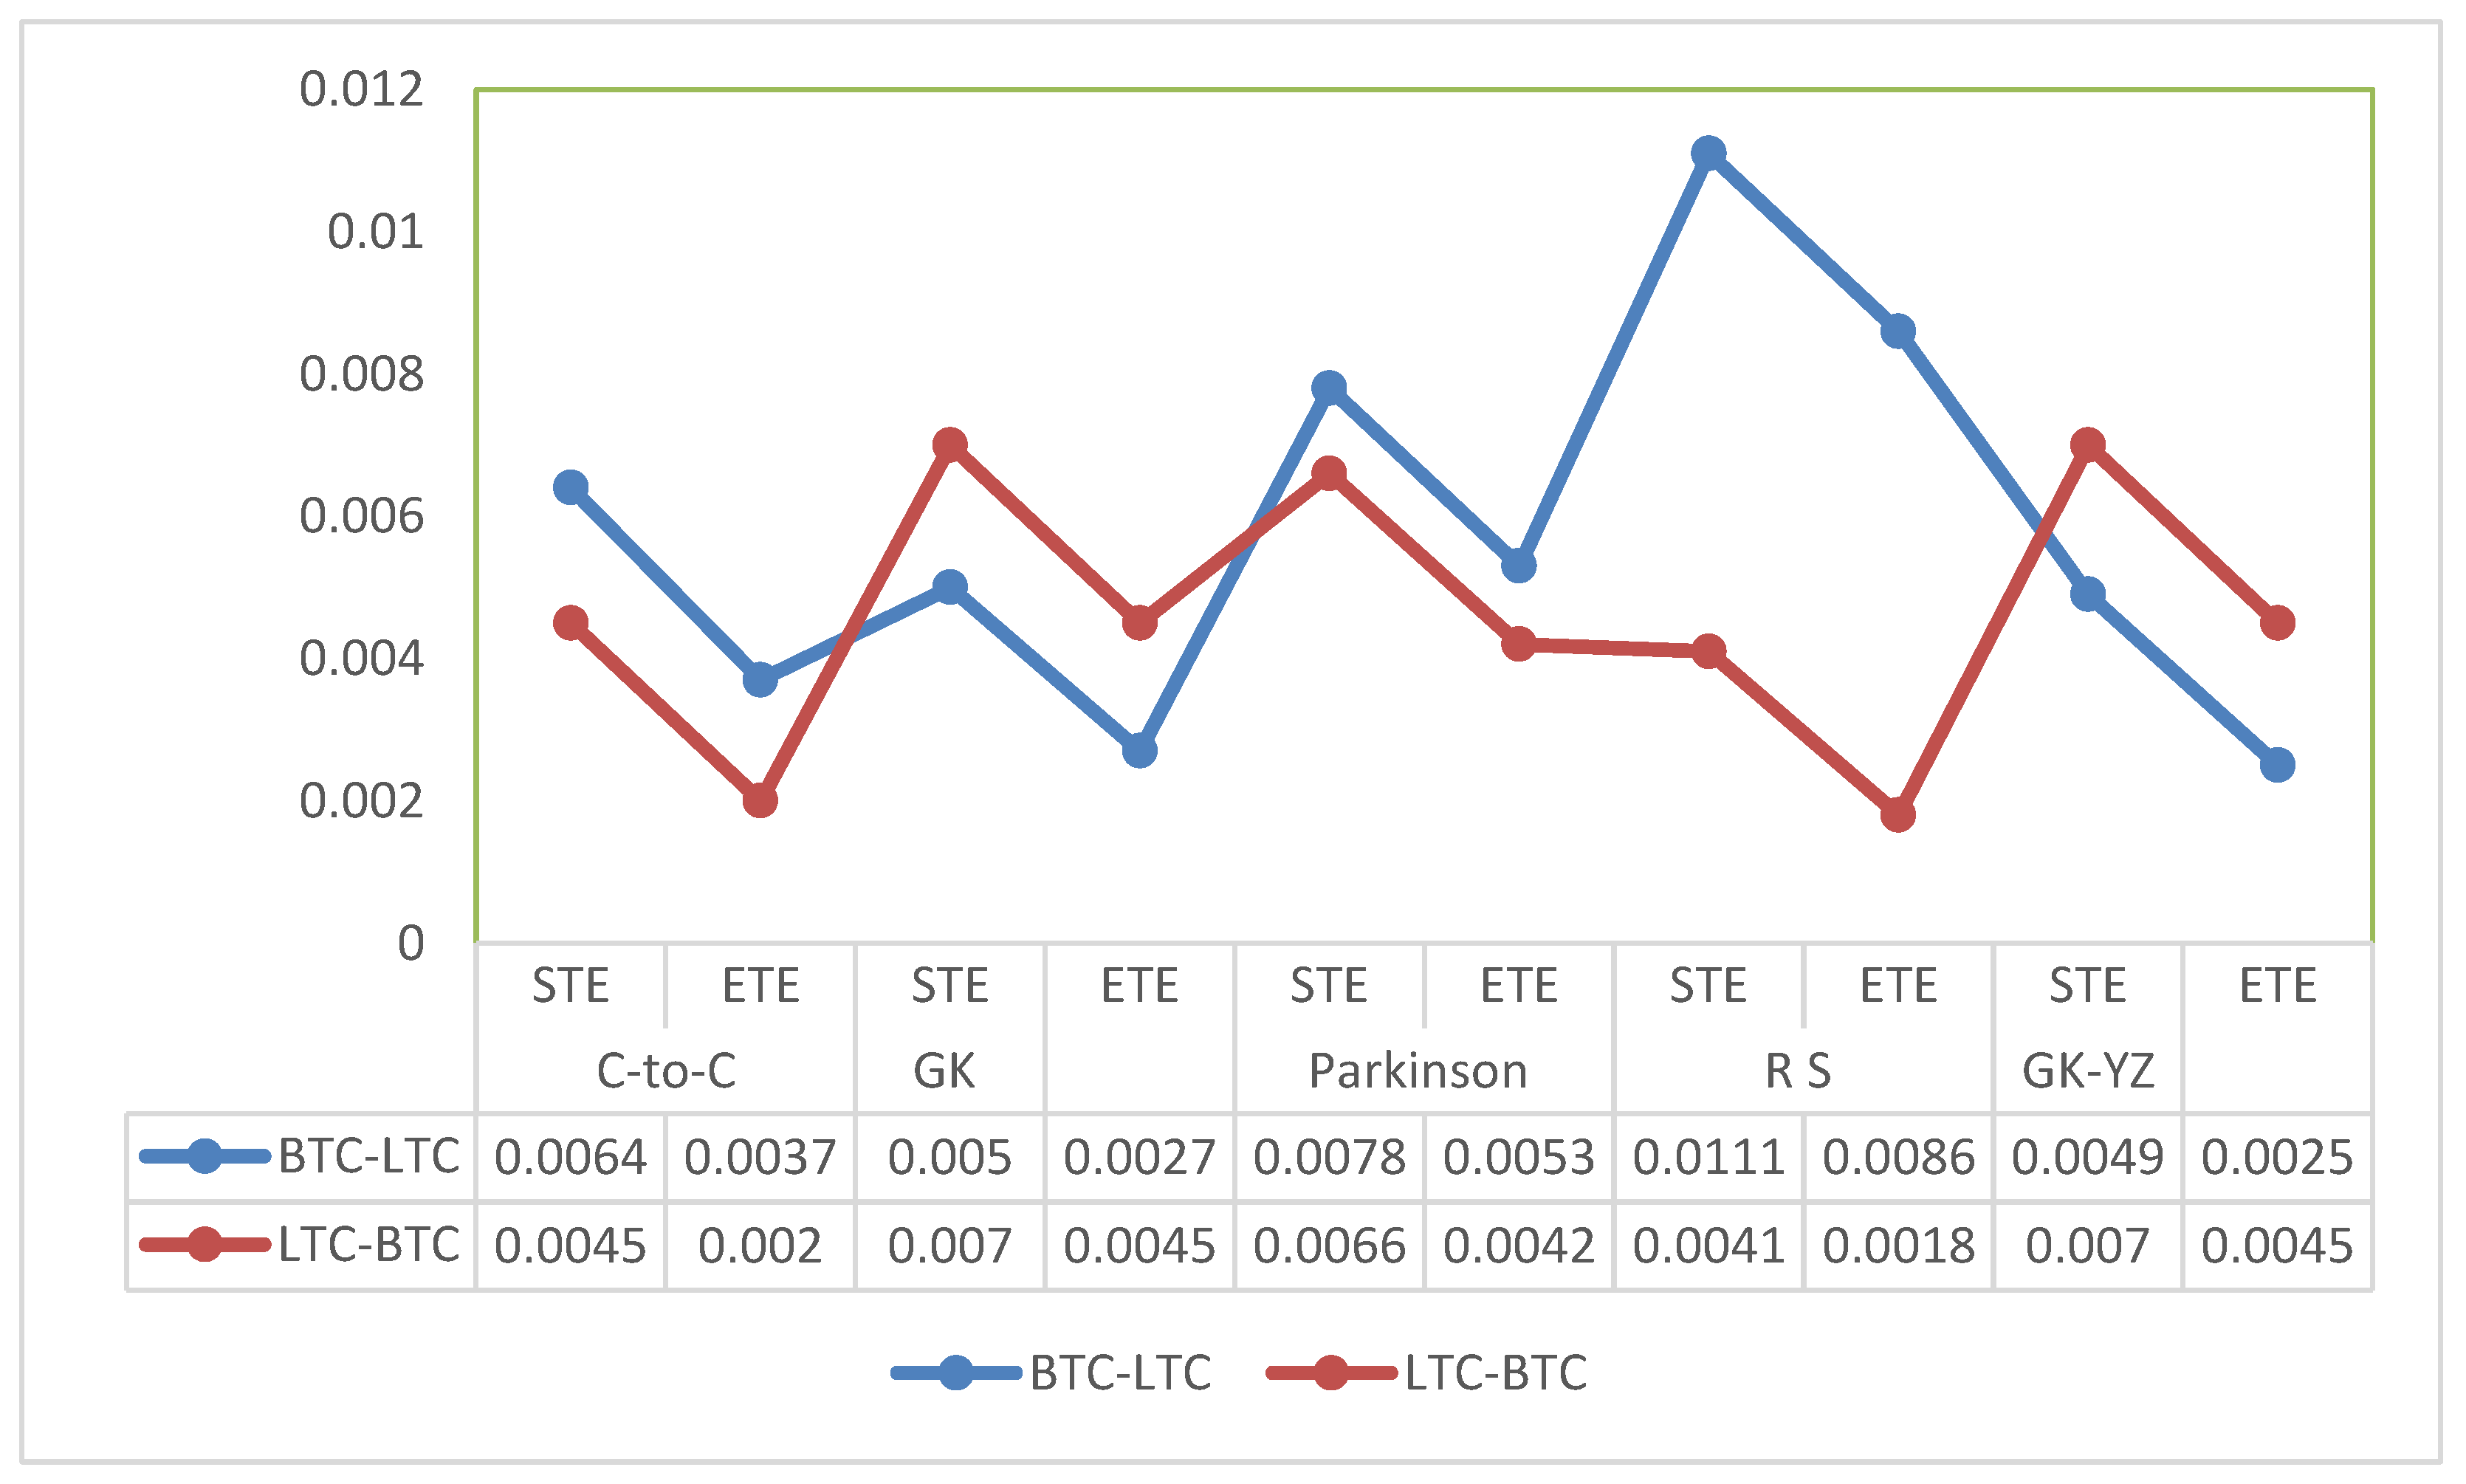
- Consequently, in the case of transfer entropy estimates of OHLC volatilities, we report the highest information flow from BTC to LTC for Rogers and Satchell. Therefore, BTC is found to be informationally dominant, and extreme changes in BTC volatility should be incorporated consequently into the volatility of LTC;
- We can also examine the net information flow from BTC and LTC. We illustrate from Figure 15 that the net information flow is positive for C-to-C, Parkinson’s and RS estimates, meaning that BTC informationally dominates LTC in most of the OHLC estimates;
- We observed the log returns series of all cryptocurrencies deviate from the normal distribution and exhibit fat-tailed behavior. Consequently, the statistical analysis of estimated OHLC estimates describes rightly skewed volatility distributions. For example, Table 2 shows a case of BTC and LTC following high kurtosis and skewness values of LTC and supports the fat-tailed characteristics. Thus, the data in the distribution tails has extreme relevance, and computation of information flow between volatilities of digital currencies has provided an insight to assess the dominance of underlying digital currency;
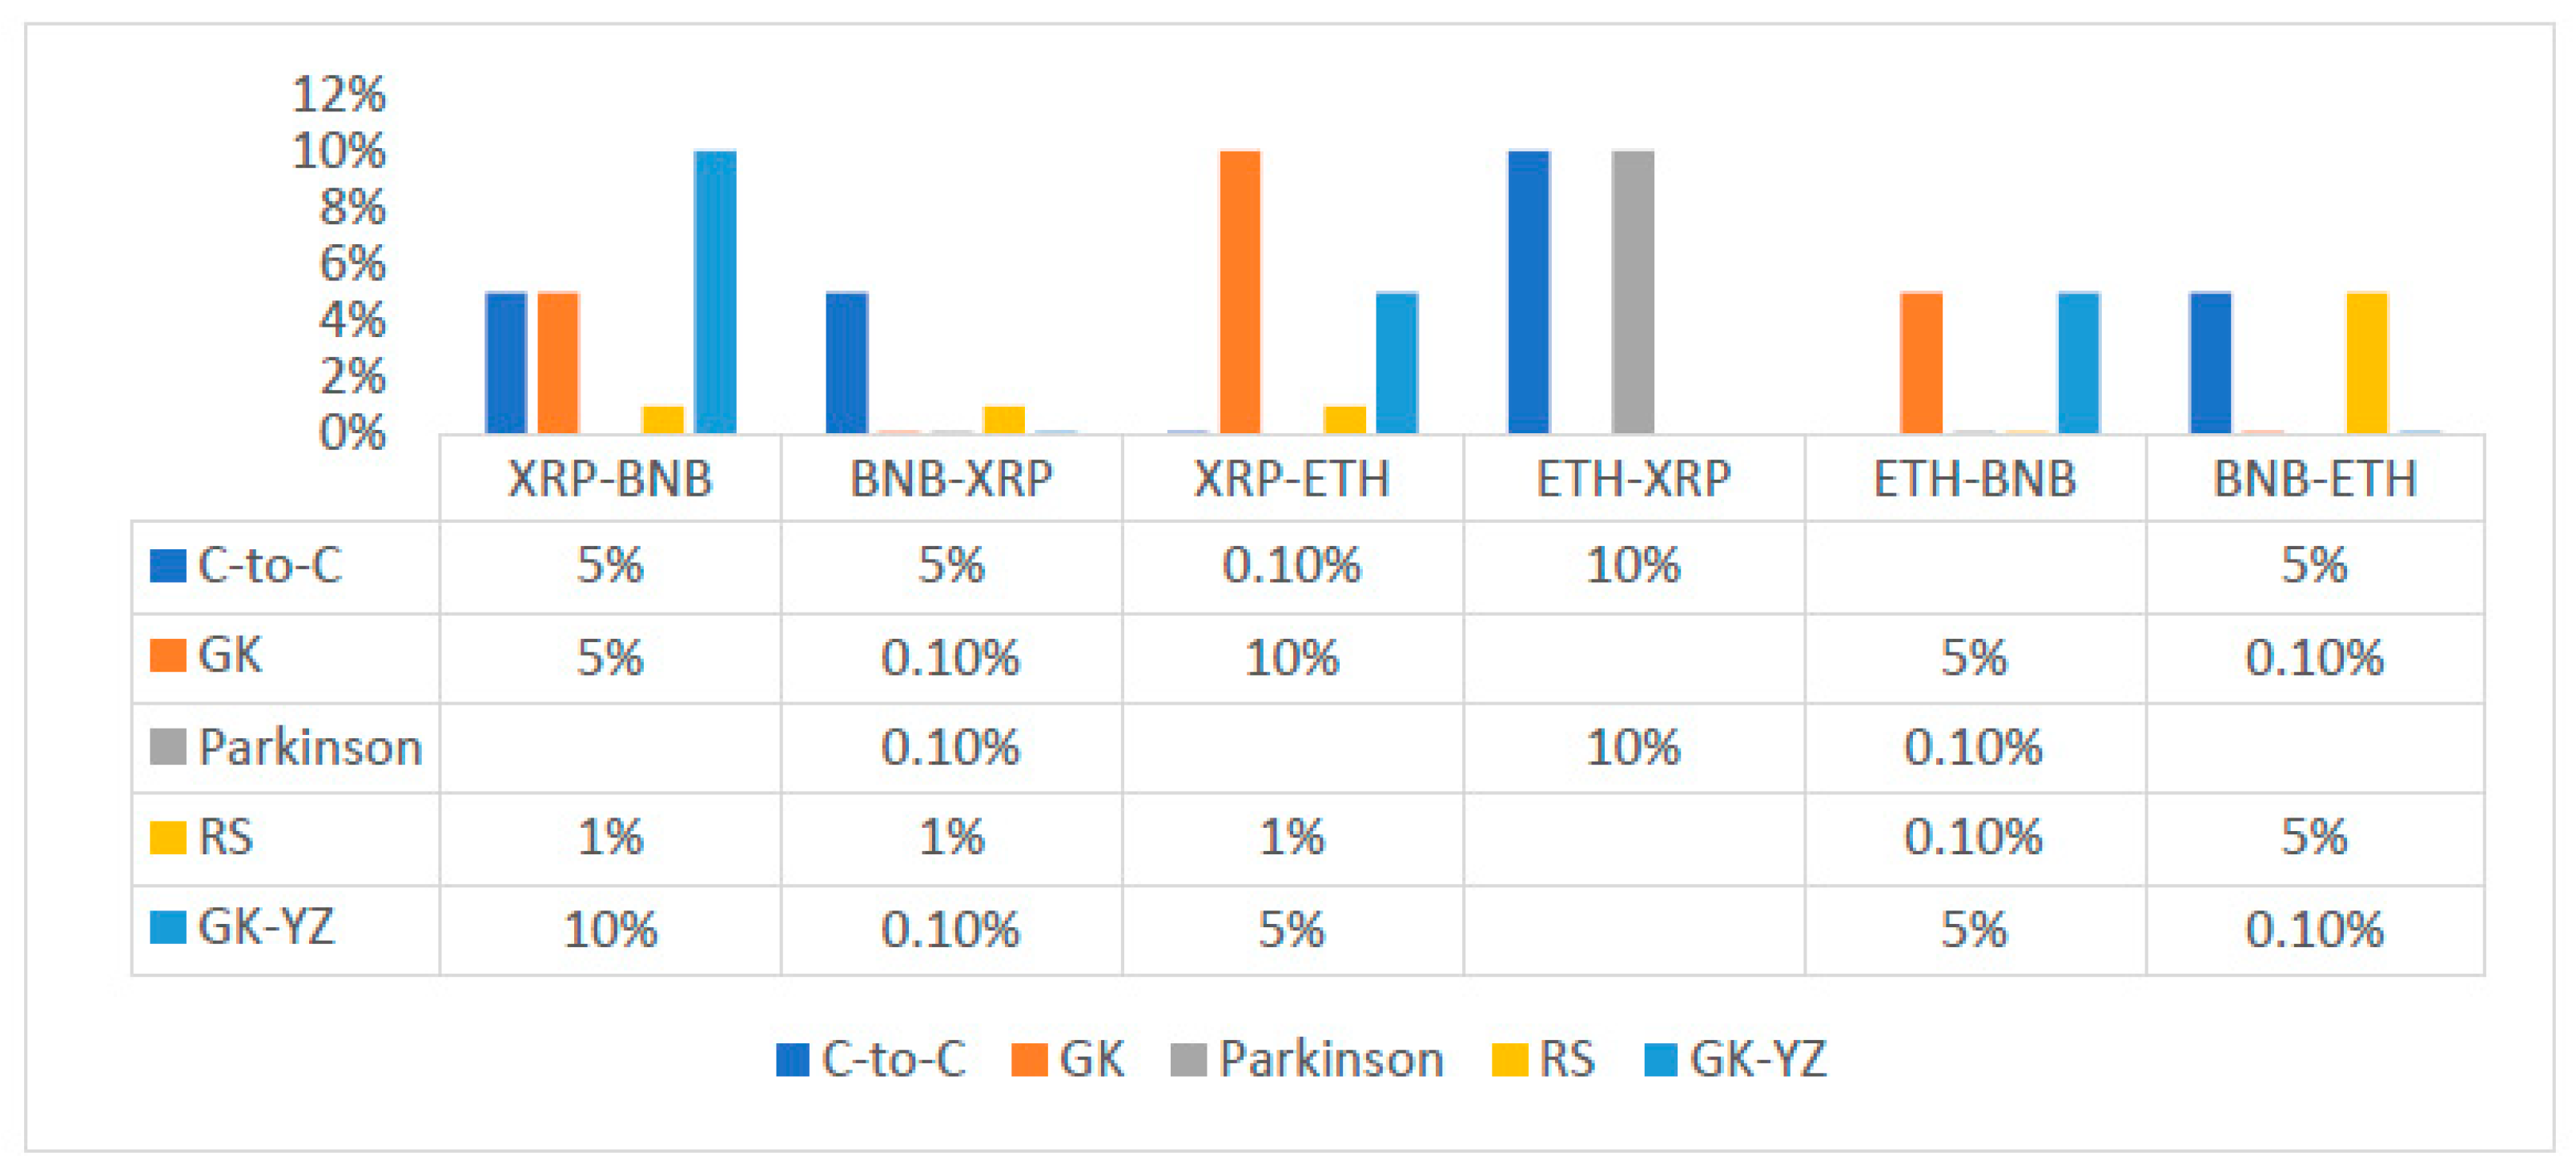
- Similarly, for BNB and XRP, the net information flow is positive for all volatility estimates, and BNB prevails over the XRP and ETH in the sense of information flow;
- We conclude that the null hypothesis of no information flow between the estimated volatilities of BTC and LTC and ETH, BNB, and XRP can be rejected at any statistical significance level. However, the TE results depend on the choice of the number of bins into which a given dataset is partitioned and, on the block-length chosen for the transferee and transferor variable.
Author Contributions
Funding
Institutional Review Board Statement
Data Availability Statement
Acknowledgments
Conflicts of Interest
References
- Granger, C.W. Investigating causal relations by econometric models and cross-spectral methods. Econometrica 1969, 37, 424–438. [Google Scholar] [CrossRef]
- Chu, X.; Wu, C.; Qiu, J. A nonlinear Granger causality test between stock returns and investor sentiment for Chinese stock market: A wavelet-based approach. Appl. Econo. 2016, 48, 1915–1924. [Google Scholar] [CrossRef]
- Zhao, X.P.; Shang, P.; Huang, J. Mutual-information matrix analysis for nonlinear interactions of multivariate time series. Nonlin. Dyna. 2017, 88, 477–487. [Google Scholar] [CrossRef]
- Polanco-Martínez, J.M. Dynamic relationship analysis between NAFTA stock markets using nonlinear, nonparametric, non-stationary methods. Nonlin. Dyna. 2019, 97, 369–389. [Google Scholar] [CrossRef]
- Lahmiri, S. A look at short- and long-term nonlinear dynamics in family business stock returns listed on Casablanca stock. Fractals 2019, 27, 1950140. [Google Scholar] [CrossRef]
- Lahmiri, S.; Bekiros, S. Nonlinear analysis of Casablanca Stock Exchange, Dow Jones and S&P500 industrial sectors with a comparison. Physica A 2020, 539, 122923. [Google Scholar]
- Sahoo, P.K. COVID-19 pandemic and cryptocurrency markets: An empirical analysis from a linear and nonlinear causal relationship. Stud. Econ. Finan. 2021, 38, 454–468. [Google Scholar] [CrossRef]
- Ghorbel, A.; Frikha, W.; Manzil, Y.S. Testing for asymmetric non-linear short- and long-run relationships between crypto-currencies and stock markets. Eurasi. Econ. Revi. 2022, 12, 387–425. [Google Scholar] [CrossRef]
- Tong, Z.; Chen, Z.; Zhu, C. Nonlinear dynamics analysis of cryptocurrency price fluctuations based on Bitcoin. Finan. Res. Lett. 2022, 47, 102803. [Google Scholar] [CrossRef]
- Sheraz, M.; Nasir, I. Information-Theoretic Measures and Modeling Stock Market Volatility: A Comparative Approach. Risks 2021, 9, 89. [Google Scholar] [CrossRef]
- Preda, V.; Sheraz, M. Risk-neutral densities in entropy theory of stock options using Lambert function and a new approach. Proc. Roman. Acad. Ser. A 2015, 16, 20–27. [Google Scholar]
- Paluš, M.; Hlaváčkovxax-Schindler, K.; Vejmelka, M.; Bhattacharya, J. Causality detection based on information-theoretic approaches in time series analysis. Phys. Repor. 2007, 441, 1–46. [Google Scholar]
- Schreiber, T. Measuring Information Transfer. Phys. Revi. Lett. 2000, 85, 461–464. [Google Scholar] [CrossRef] [PubMed]
- Marschinski, R.; Kantz, H. Analysing the information flow between financial time series. Eur. Phys. J. B Cond. Matt. Comp. Syst. 2000, 30, 275–281. [Google Scholar] [CrossRef]
- Baek, S.K.; Jung, W.S.; Kwon, O.; Moon, H.T. Transfer entropy analysis of the stock market. arXiv preprint 2005, arXiv:physics/0509014. [Google Scholar]
- Kwon, O.; Yang, J.S. Information flow between composite stock index and individual stocks. Phys A Stat. Mech. App. 2008, 387, 2851–2856. [Google Scholar] [CrossRef]
- Kwon, O.; Yang, J.S. Information flow between stock indices. Europhys. Lett. 2008, 82, 68003. [Google Scholar] [CrossRef]
- Dimpfl, T.; Peter, F.J. The impact of the financial crisis on transatlantic information flows: An intraday analysis. J. Int. Finan. Mark Inst. Mon. 2014, 31, 1–13. [Google Scholar] [CrossRef]
- Sensoy, A.; Sobaci, C.; Sensoy, S.; Alali, A. Effective transfer entropy approach to information flow between exchange rates and stock markets. Chaos. Solit. Frac. 2014, 68, 180–181. [Google Scholar] [CrossRef]
- Lahmiri, S.; Bekiros, S. Renyi entropy and mutual information measurement of market expectations and investor fear during the COVID-19 pandemic. Cha. Solit. Frac. 2020, 139, 110084. [Google Scholar] [CrossRef]
- Jizba, P.; Kleinert, H.; Shefaat, M. Rényi’s information transfer between financial time series. Physica A Stat. Mech. App. 2012, 391, 2971–2989. [Google Scholar] [CrossRef]
- Dimpfl, T.; Peter, F.J. Using transfer entropy to measure information flows between financial markets. Stud. Nonlin. Dyn. Econo. 2013, 17, 85–102. [Google Scholar] [CrossRef]
- Leonidas, S. Structure of a global network of financial companies based on tansfer entropy. Entropy 2014, 16, 4443–4482. [Google Scholar]
- Behrendt, S.; Dimpfl, T.; Peter, F.J.; Zimmermann, D.J.R. Transferentropy-quantifying information flow between different time series using effective transfer entropy. Software X 2019, 10, 265. [Google Scholar]
- Hempel, S.; Koseska, A.; Kurths, J.; Nikoloski, Z. Inner composition alignment for inferring directed networks from short time series. Phys. Rev. Lett. 2011, 107, 054101. [Google Scholar] [CrossRef] [PubMed]
- Hempel, S.; Koseska, A.; Nikoloski, Z. Data-driven reconstruction of directed networks. Eur. Phys. J. B 2013, 86, 250. [Google Scholar] [CrossRef]
- Wang, J.; Shang, P.J.; Lin, A.J.; Chen, Y.C. Segmented inner composition alignment to detect coupling of different subsystems. Nonlinear Dyn. 2014, 76, 1821–1828. [Google Scholar] [CrossRef]
- Bandt, C.; Pompe, B. Permutation entropy: A natural complexity measure for time series. Phys. Rev. Lett. 2002, 88, 174102. [Google Scholar] [CrossRef]
- Shi, W.P.; Shang, P.; Lin, A. The coupling analysis of stock market indices based on cross-permutation entropy. Nonlin. Dyna. 2015, 79, 2439–2447. [Google Scholar] [CrossRef]
- Papana, A.; Papana-Dagiasis, A.; Siggiridou, E. Shortcomings of Transfer Entropy and Partial Transfer Entropy: Extending Them to Escape the Curse of Dimensionality. Int. J. Bifur. Chaos. 2020, 30, 2050250. [Google Scholar] [CrossRef]
- Rozo, A.; Morales, J.; Moeyersons, J.; Joshi, R.; Caiani, E.G.; Borzée, P.; Buyse, B.; Testelmans, D.; Van Huffel, S.; Varon, C. Benchmarking Transfer Entropy Methods for the Study of Linear and Nonlinear Cardio-Respiratory Interactions. Entropy 2021, 23, 939. [Google Scholar] [CrossRef] [PubMed]
- Bossomaier, T.; Barnett, L.; Harre, M.; Lizier, J.T. An Introduction to Transfer Entropy: Information Flow in Complex Systems; Springer International Publishing: Cham, Germany, 2016. [Google Scholar]
- Blau, B.M. Price dynamics and speculative trading in bitcoin. Rese. Int. Bus. Finan. 2017, 41, 493–499. [Google Scholar] [CrossRef]
- Chan, S.; Chu, J.; Nadarajah, S.; Osterrieder, J. A Statistical Analysis of Cryptocurrencies. J. Risk. Finan. Manag. 2017, 10, 12. [Google Scholar] [CrossRef]
- Sheraz, M.; Dedu, S. Bitcoin Cash: Stochastic Models of Fat-Tail Returns and Risk Modelling. Econ. Comp. Econ. Cyb. Stud. Rese 2020, 3, 43–58. [Google Scholar]
- Chu, J.; Chan, S.; Nadarajah, S.; Osterrieder, J. GARCH modelling of cryptocurrencies. J. Risk. Finan. Manag. 2017, 10, 17. [Google Scholar] [CrossRef]
- Dyhrberg, A.H. Bitcoin, Gold and the Dollar—A GARCH Volatility Analysis. Finan. Rese. Lett. 2016, 16, 85–92. [Google Scholar] [CrossRef]
- Yi, S.; Xu, Z.; Wang, G.J. Volatility connectedness in the cryptocurrency market: Is Bitcoin a dominant cryptocurrency? Int. Rev. Financ. Anal. 2018, 60, 98–114. [Google Scholar] [CrossRef]
- Ciaian, P.; Rajcaniova, M.; Kancs, D. Virtual relationships: Short-and long-run evidence from Bitcoin and altcoin markets. J. Int. Financ. Mark. Inst. Money 2018, 52, 173–195. [Google Scholar] [CrossRef]
- Katsiampa, P. Volatility co-movement between Bitcoin and Ether. Financ. Res. Lett. 2019, 30, 221–227. [Google Scholar] [CrossRef]
- Assaf, A.; Bilgin, M.H.; Demir, E. Using transfer entropy to measure information flows between cryptocurrencies. Physica A Stat. Mech. App. 2022, 586, 126484. [Google Scholar] [CrossRef]
- Assaf, A.; Charif, H.; Demir, E. Information sharing among cryptocurrencies: Evidence from mutual information and approximate entropy during COVID-19. Finan. Rese. Lett. 2022, 47, 102556. [Google Scholar] [CrossRef] [PubMed]
- García-Medina, A.; González Farías, G. Transfer entropy as a variable selection methodology of cryptocurrencies in the framework of a high dimensional predictive model. PLoS ONE 2020, 15, e0227269. [Google Scholar] [CrossRef]
- Garman, M.B.; Klass, M.J. On the Estimation of Security Price Volatilities from Historical Data. J. Bus 1980, 53, 67–78. [Google Scholar] [CrossRef]
- Parkinson, M. The Extreme Value Method for Estimating the Variance of the Rate of Return. J. Bus 1980, 53, 61–68. [Google Scholar] [CrossRef]
- Rogers, L.; Satchell, S. Estimating Variance from High, Low and Closing Prices. Ann. Appl. Prob. 1991, 1, 504–512. [Google Scholar] [CrossRef]
- Yang, D.; Zhang, Q. Drift-Independent Volatility Estimation Based on High, Low, Open, and Close Prices. J. Bus 2000, 73, 477–491. [Google Scholar] [CrossRef]
- Hurst, H. The long-term storage capacity of reservoirs. Trans. Amer. Soc.Civil. Eng. 1951, 116, 770–799. [Google Scholar] [CrossRef]
- Cover, T.M.; Thomas, J.A. Elements of Information Theory; John Wiley & Sons: Hoboken, NJ, USA, 1991; pp. 13–37. [Google Scholar]
- Shannon, C.E. A mathematical theory of communication. Bell. Syst. Tech. J. 1948, 27, 379–423. [Google Scholar] [CrossRef]
- Rényi, A. On measures of entropy and information. Proc. Fourth. Berkeley. Symp. Math. Stat. Prob. 1961, 1, 547–561. [Google Scholar]
- Vicente, R.; Wibral, M. Directed Information Measures in Neuroscience, Understanding Complex Systems; Springer-Verlag: Berlin Heidelberg, Germany, 2014; pp. 37–58. [Google Scholar] [CrossRef]
- He, J.; Shang, P. Comparison of transfer entropy methods for financial time series. Phys. A Stat. Mech. App. 2017, 482, 772–785. [Google Scholar] [CrossRef]
- Fama, E. Efficient capital markets: A review of theory and empirical work. J. Finan. 1970, 25, 383–417. [Google Scholar] [CrossRef]
- Mandelbrot, B. New methods in statistical economics. J. Polit. Econ. 1963, 71, 21–440. [Google Scholar] [CrossRef]
- Osterrieder, J.; Lorenz, J. A Statistical Risk Assessment of Bitcoin and Its Extreme Tail Behavior. Ann. Fin. Econ. 2017, 12, 1750003. [Google Scholar] [CrossRef]
- Zhang, W.; Wang, P.; Li, X.; Shen, D. Some Stylized Facts of the Cryptocurrency Market. Appl. Econ. 2018, 50, 5950–5965. [Google Scholar] [CrossRef]
- Kaya Soylu, P.; Okur, M.; Çatıkkaş, Ö.; Altintig, Z.A. Long Memory in the Volatility of Selected Cryptocurrencies: Bitcoin, Ethereum and Ripple. J. Risk Financ. Manag. 2020, 13, 107. [Google Scholar] [CrossRef]
- Wu, L.; Chen, S. Long memory and efficiency of Bitcoin under heavy tails. Appl. Econ. 2020, 52, 52985309. [Google Scholar] [CrossRef]
- Lahmiri, S.; Bekiros, S.; Salvic, A. Long-range memory, distributional variation and randomness of bitcoin volatility. Chaos Soli. Fract 2018, 107, 43–48. [Google Scholar] [CrossRef]
- Rambaccussing, D.; Mazibas, M. True versus Spurious Long Memory in Cryptocurrencies. J. Risk Financ. Manag. 2020, 13, 186. [Google Scholar] [CrossRef]
- Peters, E.E. Fractal Market Analysis—Applying Chaos Theory to Investment and Economics; John Wiley & Sons: New York, NY, USA, 1994; pp. 3–150. [Google Scholar]
- Keskin, Z.; Aste, T. Information-theoretic measures for nonlinear causality detection: Application to social media sentiment and cryptocurrency prices. R. Soc. Open Sci. 2020, 7, 200863. [Google Scholar] [CrossRef]
- Dimpfl, T.; Peter, F.J. Group transfer entropy with an application to cryptocurrencies. Phys. A Stat. Mech. Appl. 2019, 516, 543–551. [Google Scholar] [CrossRef]
- Aslanidisa, A.; Bariviera, A.; Parez-Laborda, A. Are cryptocurrencies becoming more interconnected? Econ. Lett. 2021, 199, 109725. [Google Scholar] [CrossRef]
- Chlodnicka, H.; Zimon, G. Bankruptcu Risk Assessment Measures of Polish SMEs. Wseas Trans. Busi. Econ. 2020, 17, 14–20. [Google Scholar] [CrossRef]
- Moradi, M.; Appolloni, A.; Zimon, G.; Tarighi, H.; Kamali, M. Macroeconomic Factors and Stock Price Crash Risk: Do Managers Withhold Bad News in the Crisis-Ridden Iran Market? Sustainability 2021, 13, 3688. [Google Scholar] [CrossRef]


| BTC | XRP | LTC | BNB | ETH | |
|---|---|---|---|---|---|
| Mean | −0.03703 | −0.06191 | −0.05493 | −0.05214 | −0.05728 |
| S.D. | 0.07238 | 0.10920 | 0.09316 | 0.09821 | 0.09256 |
| Skew | −1.26871 | −0.64820 | −0.69160 | −1.16927 | −1.19954 |
| Kurtosis | 5.9159 | 7.49848 | 6.96313 | 6.86183 | 5.39491 |
| TNNT | 0.00294 | 0.00000 | 0.000152 | 0.000152 | 0.001269 |
| WNNT | 0.00365 | 0.02157 | 0.1136 | 0.00003 | 0.02069 |
| TT | 0.00627 | 0.00000 | 0.00000 | 0.00000 | 0.00009 |
| Estimator | C-to-C | GK | Parkinson | RS | GK-YZ |
|---|---|---|---|---|---|
| No. Obs | 2722 | 2722 | 2722 | 2722 | 2722 |
| Min. | 0.034882 (0.047521) | 0.056787 (0.089142) | 0.058855 (0.081461) | 0.052196 (0.089221) | 0.056877 (0.091779) |
| Max. | 2.922745 (3.717033) | 1.906995 (3.079054) | 2.135686 (3.058603) | 1.985108 (3.093214) | 1.907693 (3.080433) |
| Q1 | 0.309654 (0.411025) | 0.289040 (0.711020) | 0.304833 (0.412632) | 0.278607 (0.403002) | 0.289474 (0.410253) |
| Q2 | 0.677364 (0.959929) | 0.623378 (0.613357) | 0.645079 (0.900679) | 0.622717 (0.858271) | 0.624116 (0.869989) |
| Mean | 0.538511 (0.758029) | 0.499735 (0.711020) | 0.516278 (0.731707) | 0.494480 (0.701918) | 0.500892 (0.712596) |
| Median | 0.477780 (0.663103) | 0.437840 (0.613357) | 0.453897 (0.637059) | 0.421143 (0.597912) | 0.438332 (0.615175) |
| SD | 0.328704 (0.509606) | 0.306106 (0.450409) | 0.303292 (0.458338) | 0.319009 (0.460012) | 0.306424 (0.450420) |
| Skew | 1.833196 (0.509606) | 1.476352 (1.778702) | 1.435663 (1.735067) | 0.319009 (1.843520) | 1.471404 (1.780488) |
| Kurtosis | 6.790848 (5.644189) | 2.748862 (4.488842) | 2.987795 (4.408125) | 3.082362 (4.589814) | 2.727228 (4.489153) |
Publisher’s Note: MDPI stays neutral with regard to jurisdictional claims in published maps and institutional affiliations. |
© 2022 by the authors. Licensee MDPI, Basel, Switzerland. This article is an open access article distributed under the terms and conditions of the Creative Commons Attribution (CC BY) license (https://creativecommons.org/licenses/by/4.0/).
Share and Cite
Sheraz, M.; Dedu, S.; Preda, V. Volatility Dynamics of Non-Linear Volatile Time Series and Analysis of Information Flow: Evidence from Cryptocurrency Data. Entropy 2022, 24, 1410. https://doi.org/10.3390/e24101410
Sheraz M, Dedu S, Preda V. Volatility Dynamics of Non-Linear Volatile Time Series and Analysis of Information Flow: Evidence from Cryptocurrency Data. Entropy. 2022; 24(10):1410. https://doi.org/10.3390/e24101410
Chicago/Turabian StyleSheraz, Muhammad, Silvia Dedu, and Vasile Preda. 2022. "Volatility Dynamics of Non-Linear Volatile Time Series and Analysis of Information Flow: Evidence from Cryptocurrency Data" Entropy 24, no. 10: 1410. https://doi.org/10.3390/e24101410
APA StyleSheraz, M., Dedu, S., & Preda, V. (2022). Volatility Dynamics of Non-Linear Volatile Time Series and Analysis of Information Flow: Evidence from Cryptocurrency Data. Entropy, 24(10), 1410. https://doi.org/10.3390/e24101410