
A Study on Consumers’ Visual Image Evaluation of Wrist Wearables

Abstract
:1. Introduction
2. Theoretical Background
2.1. Kansei Engineering
2.2. Multidimensional Scaling (MDS)
2.3. Factor Analysis
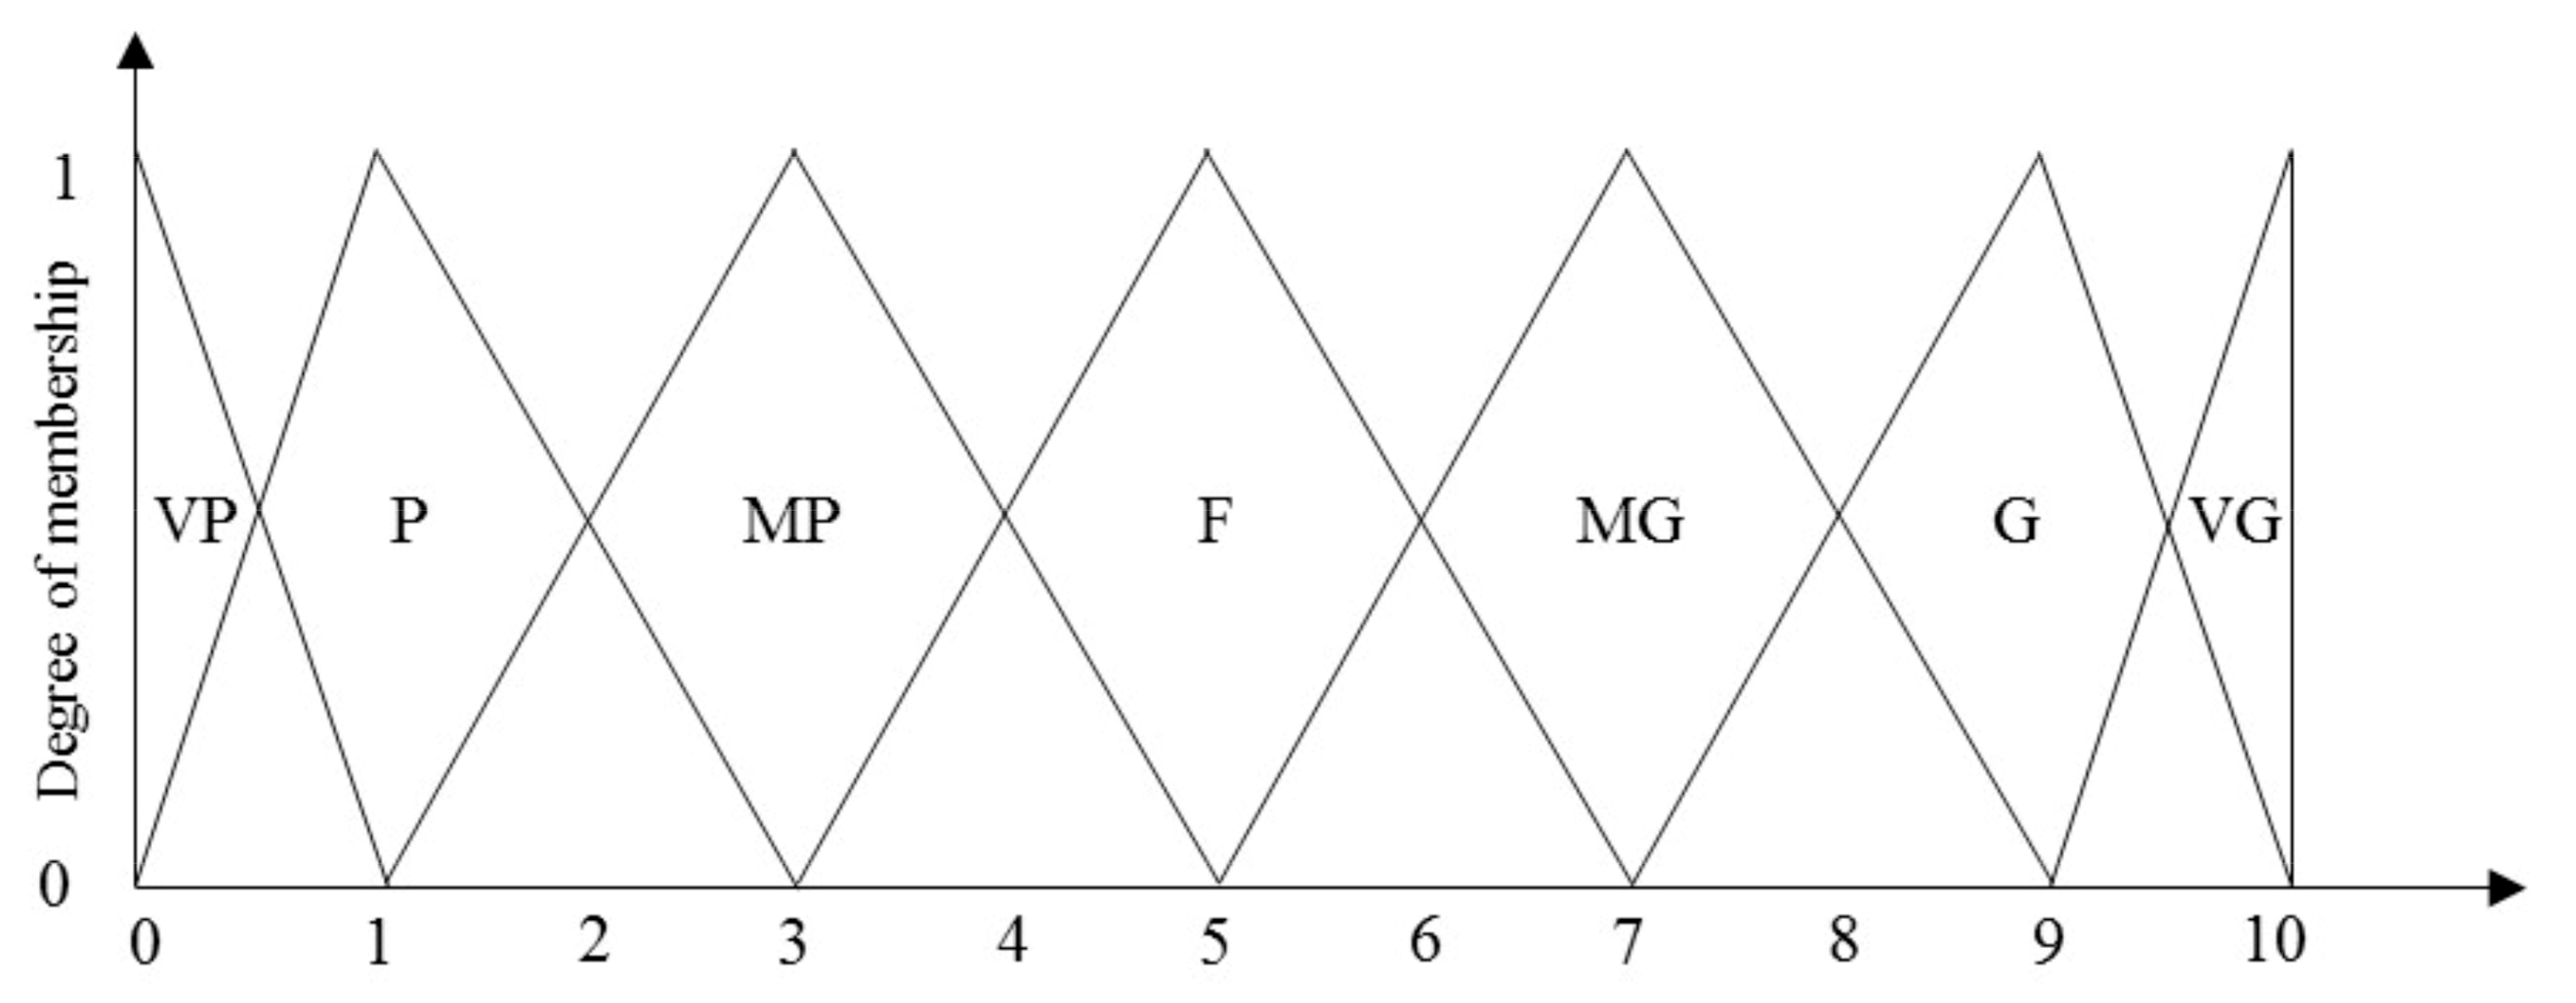
2.4. Fuzzy Theory
2.5. General Linear Model
3. Implementation Procedures
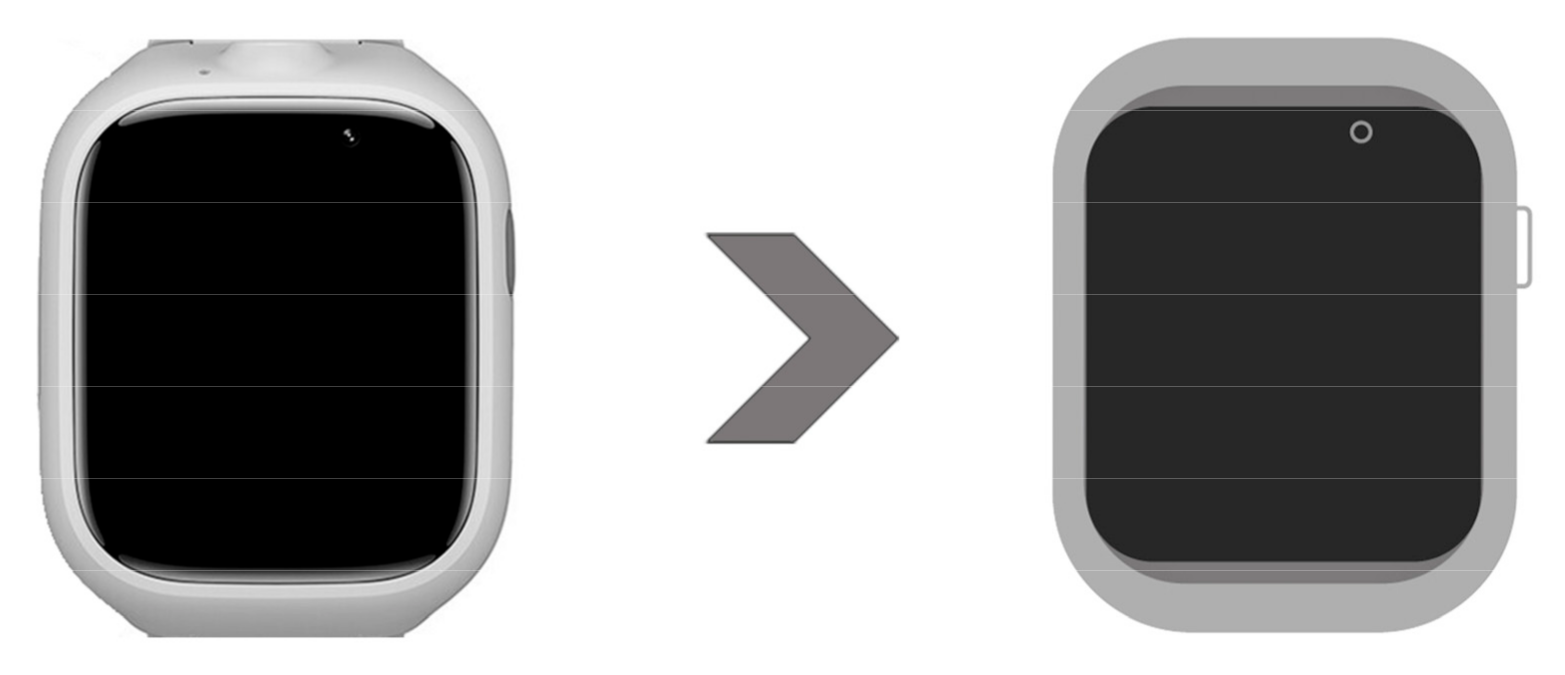
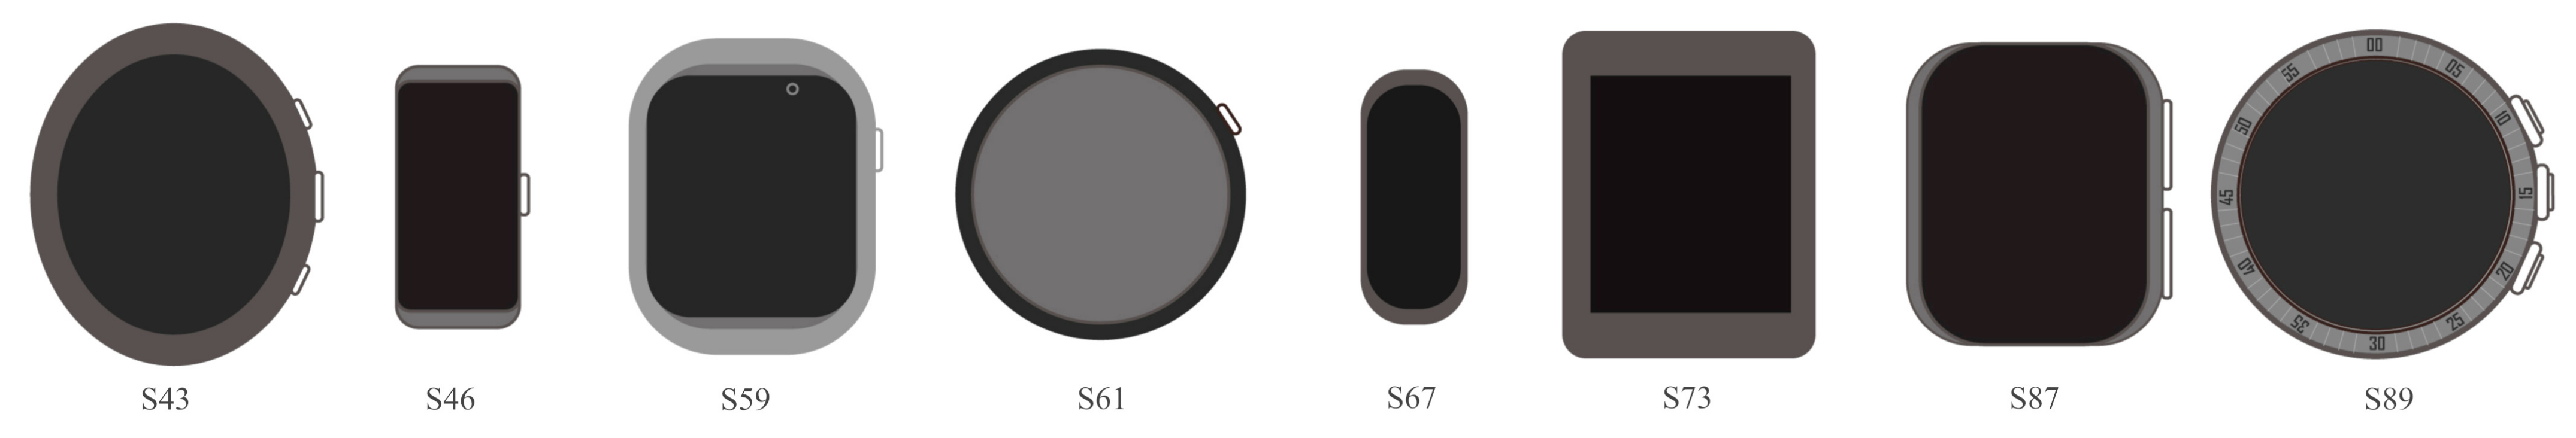
3.1. Step 1: Selection of the Representative Samples
3.2. Step 2: Extraction and Classification of the Visual Image Adjectives of the Representative Samples
3.3. Step 3: Investigation of Consumers’ Evaluation of Visual Images for the Representative Samples
3.4. Step 4: Investigation of Consumers’ Preference and the Willingness to Purchase the Representative Samples
4. Results and Discussion
4.1. Screening Outcomes of the Representative Wrist Wearable Samples
4.2. The Results for Visual Image Adjective Extraction and Classification
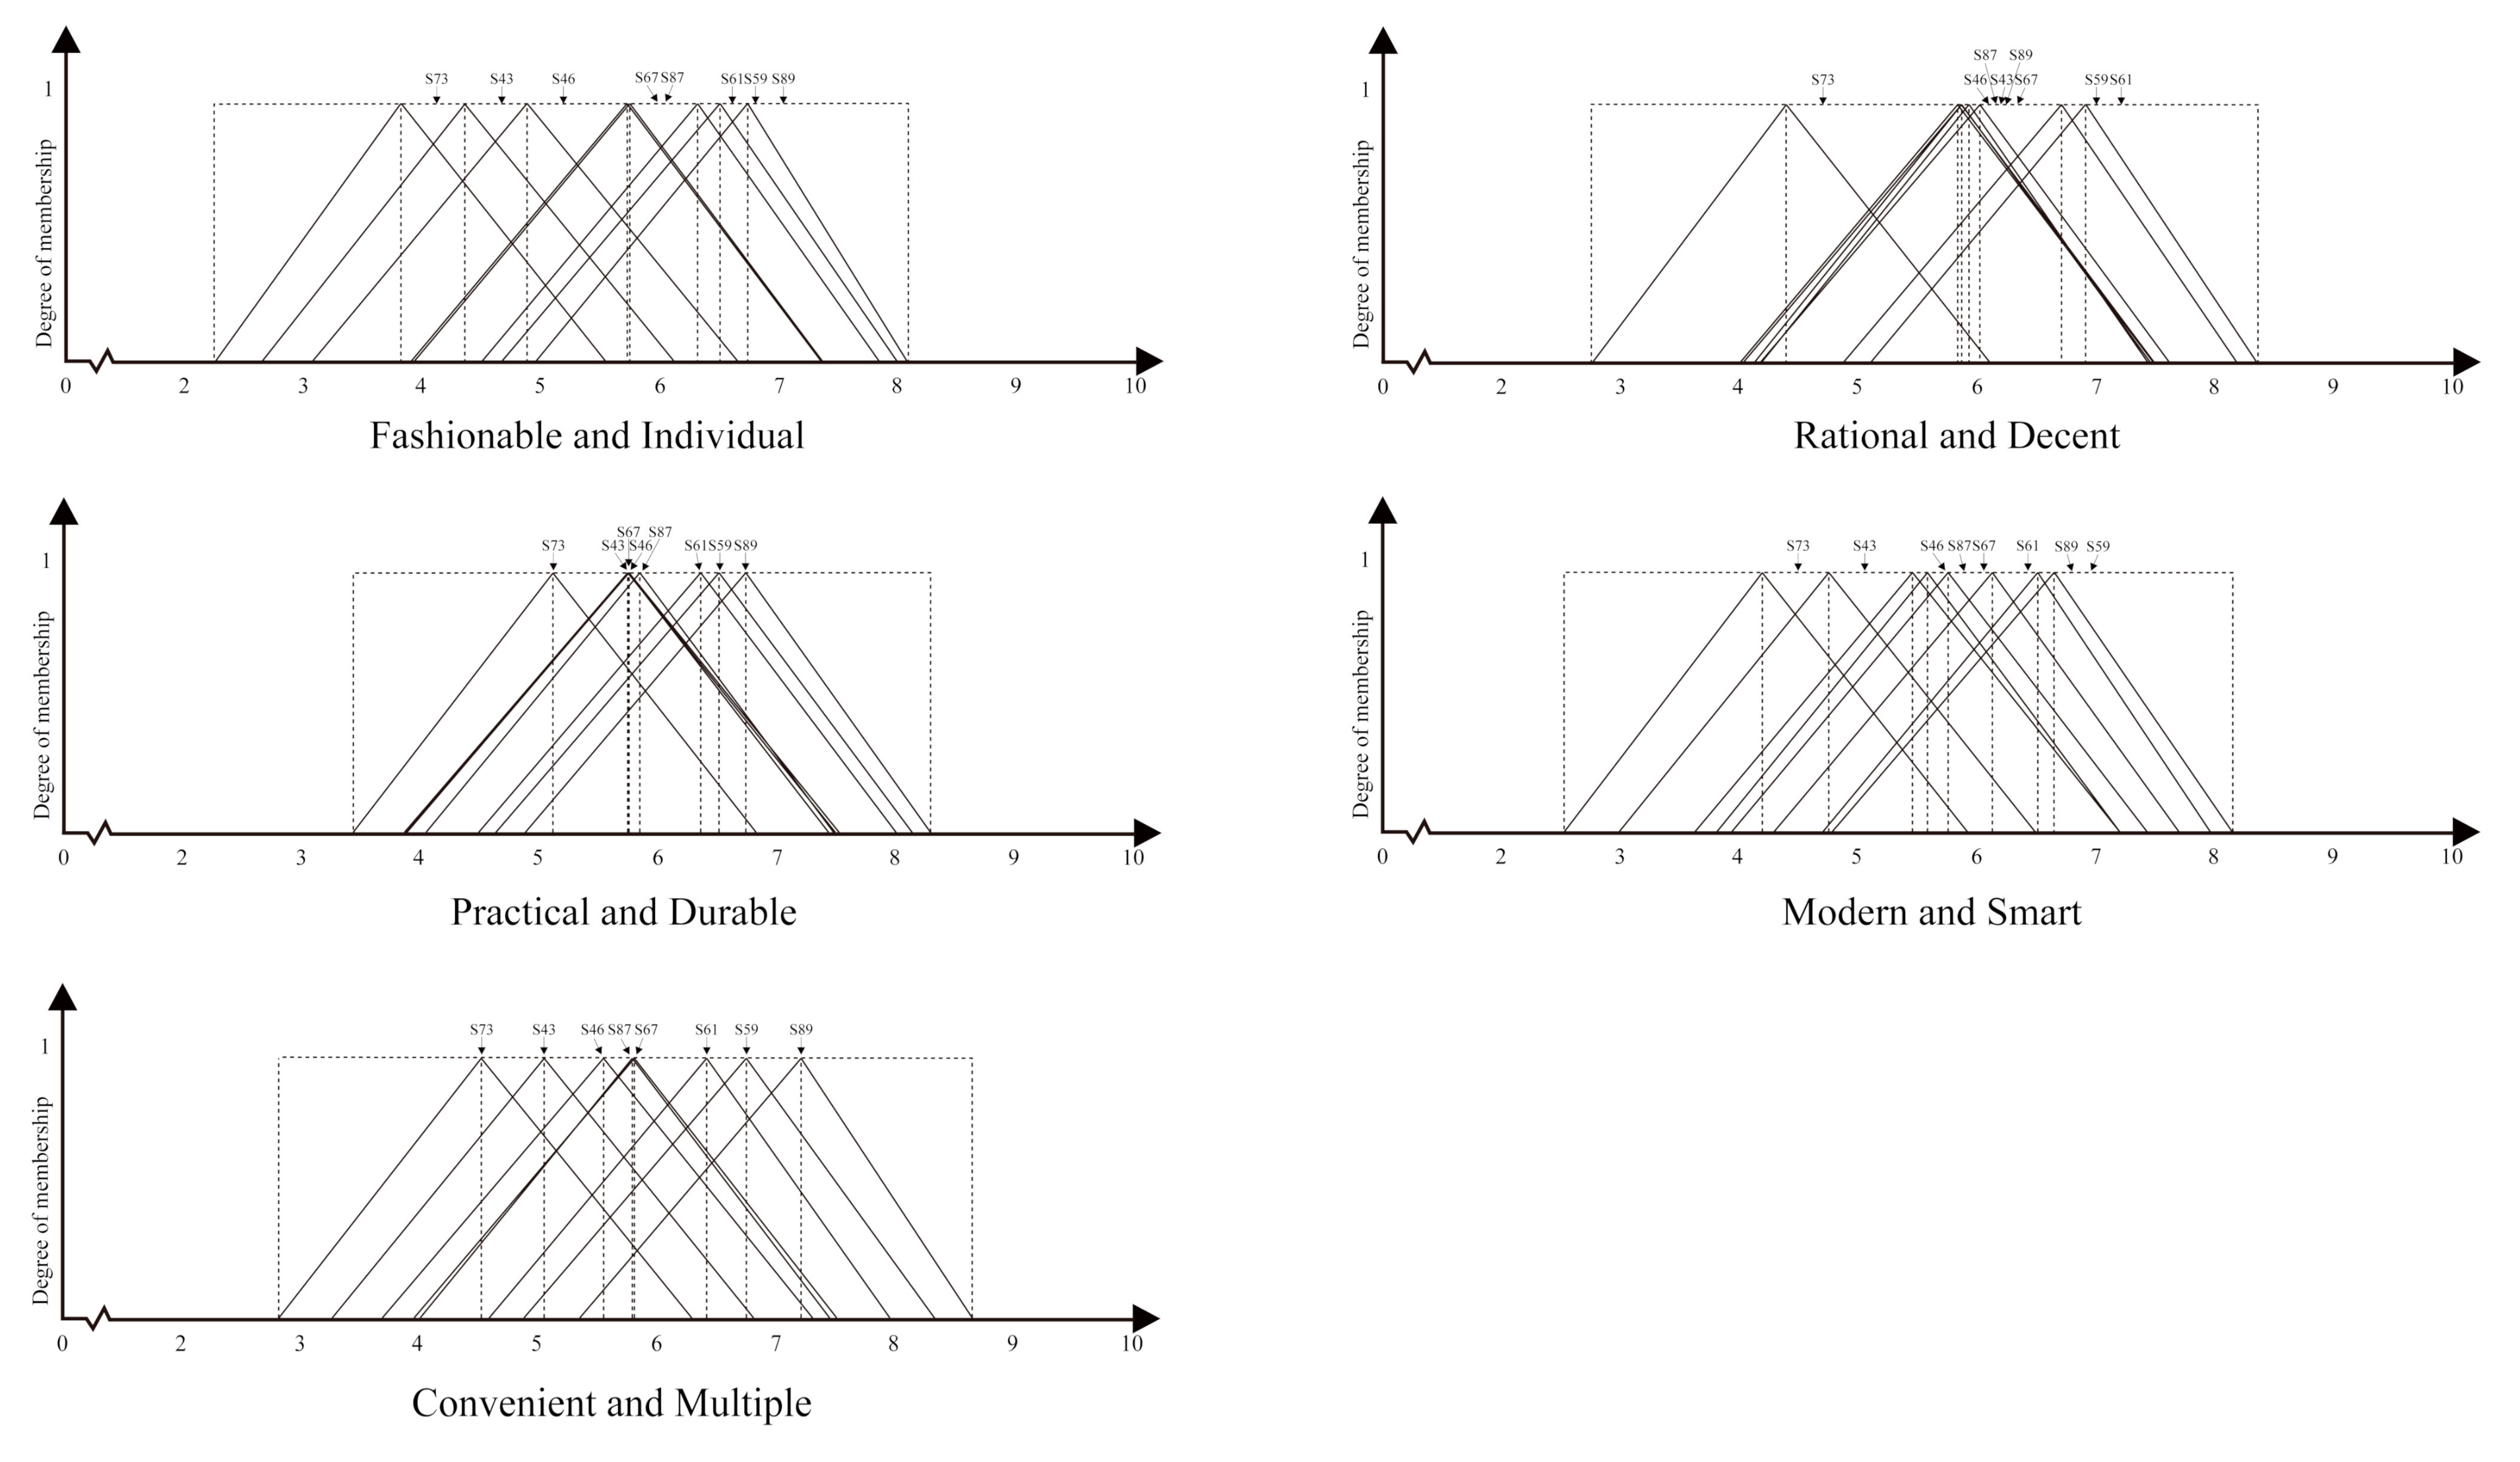
4.3. The Results of the Fuzzy Operation
4.4. The Results and Discussion of the Preferences
4.5. The Results and Discussion of the Willingness to Purchase
5. Conclusions and Suggestions
5.1. Conclusions
5.2. Suggestions
6. Research Limitations and Future Directions
Author Contributions
Funding
Institutional Review Board Statement
Informed Consent Statement
Data Availability Statement
Acknowledgments
Conflicts of Interest
References
- Counterpoint. Podcast: Wearables get Pandemic Push. 2021. Available online: https://www.counterpointresearch.com/podcast-wearables-get-pandemic-push/ (accessed on 25 March 2021).
- Seneviratne, S.; Hu, Y.; Nguyen, T.; Lan, G.; Khalifa, S.; Thilakarathna, K.; Hassan, M.; Seneviratne, A. A survey of wearable devices and challenges. IEEE Commun. Surv. Tutor. 2017, 19, 2573–2620. [Google Scholar] [CrossRef]
- Park, E. User acceptance of smart wearable devices: An expectation-confirmation model approach. Telemat. Inform. 2020, 47, 101318. [Google Scholar] [CrossRef]
- Iqbal, S.M.; Mahgoub, I.; Du, E.; Leavitt, M.A.; Asghar, W. Advances in healthcare wearable devices. NPJ Flex. Electron. 2021, 5, 1–14. [Google Scholar] [CrossRef]
- Ramon, T.L. Worldwide Wearable Computing Device Forecast, 2021–2025: CY 1Q21. 2021. Available online: https://www.idc.com/getdoc.jsp?containerId=US47225221 (accessed on 28 March 2021).
- Meghan, R. Gartner Forecasts Global Spending on Wearable Devices to Total $81.5 Billion in 2021. 2021. Available online: https://www.gartner.com/en/newsroom/press-releases/2021-01-11-gartner-forecasts-global-spending-on-wearable-devices-to-total-81-5-billion-in-2021 (accessed on 2 April 2021).
- Ranjit, A.; Alan, A.; Amy, T. Forecast Analysis: Wearable Electronic Devices, Worldwide. 2021. Available online: https://www.gartner.com/en/documents/3995162-forecast-analysis-wearable-electronic-devices-worldwide (accessed on 5 April 2021).
- Blakeway, L. A Growing Role in Health Care for Smartwatches. 2021. Available online: www.nytimes.com/2014/01/21/fashion/a-growing-role-in-health-care-for-smartwatches.html?_r=2 (accessed on 2 April 2021).
- Tong, L.; Song, Q.; Ge, Y.; Liu, M. HMM-based human fall detection and prediction method using tri-axial accelerometer. IEEE Sens. J. 2013, 13, 1849–1856. [Google Scholar] [CrossRef]
- Shany, T.; Redmond, S.J.; Narayanan, M.R.; Lovell, N.H. Sensors-Based Wearable Systems for Monitoring of Human Movement and Falls. IEEE Sens. J. 2012, 12, 658–670. [Google Scholar] [CrossRef]
- Motti, V.G.; Caine, K. Smart Wearables or Dumb Wearables? Understanding How Context Impactsthe UX in Wrist Worn Interaction. In Proceedings of the 34th ACM International Conference on the Design of Communication, Silver Spring, MD, USA, 23–24 September 2016. [Google Scholar]
- Counterpoint. TWS Drives 2020 Wearables Growth; Smartwatches to Add Momentum from 2021. 2021. Available online: https://www.counterpointresearch.com/tws-drives-2020-wearables-growth-smartwatches-add-momentum-2021/ (accessed on 10 April 2021).
- Canalys. TWS and Watches became Key Smartphone Companion Devices in Q4 2020. 2021. Available online: https://www.canalys.com/newsroom/canalys-tws-and-wearables-q4-2020 (accessed on 13 April 2021).
- Bloch, P.H. Seeking the ideal form: Product design and consumer response. J. Mark. 1995, 59, 16–29. [Google Scholar] [CrossRef] [Green Version]
- Sevener, Z. In A semantic differential study of the influence of aesthetic properties on product pleasure. In Proceedings of the 2003 international conference on Designing pleasurable products and interfaces, Association for Computing Machinery, New York, NY, USA, 16–23 June 2003. [Google Scholar]
- Choi, J.; Kim, S. Is the smartwatch an IT product or a fashion product? A study on factors affecting the intention to use smartwatches. Comput. Hum. Behav. 2016, 63, 777–786. [Google Scholar] [CrossRef]
- Hsiao, K.L. Android smartphone adoption and intention to pay for mobile internet: Perspectives from software, hardware, design, and value. Library Hi Tech 2013, 31, 216–235. [Google Scholar] [CrossRef]
- Zheng, X.; Vieira Campos, A.; Ordieres-Meré, J.; Balseiro, J.; Labrador Marcos, S.; Aladro, Y. Continuous Monitoring of Essential Tremor Using a Portable System Based on Smartwatch. Front. Neurol. 2017, 8, 96. [Google Scholar] [CrossRef] [PubMed] [Green Version]
- Seva, R.R.; Duh, H.B.L.; Helander, M.G. The marketing implications of affective product design. Appl. Ergon. 2007, 38, 723–731. [Google Scholar] [CrossRef]
- Mugge, R.; Dahl, D.W.; Schoormans, J.P. “What You See, Is What You Get?” Guidelines for Influencing Consumers’ Perceptions of Consumer Durables through Product Appearance. J. Prod. Innov. Manag. 2018, 35, 309–329. [Google Scholar] [CrossRef]
- Wang, J.; Hsu, Y. Does Sustainable Perceived Value Play a Key Role in the Purchase Intention Driven by Product Aesthetics? Taking Smartwatch as an Example. Sustainability 2019, 11, 6806. [Google Scholar] [CrossRef] [Green Version]
- Cyr, D.; Head, M.; Ivanov, A. Design aesthetics leading to m-loyalty in mobile commerce. Inf. Manag. 2006, 43, 950–963. [Google Scholar] [CrossRef]
- Jung, Y.; Kim, S.; Choi, B. Consumer valuation of the wearables: The case of smartwatches. Comput. Hum. Behav. 2016, 63, 899–905. [Google Scholar] [CrossRef]
- Kim, K.J. Shape and size matter for smartwatches: Effects of screen shape, screen size, and presentation mode in wearable communication. J. Comput. Mediat. Commun. 2017, 22, 124–140. [Google Scholar] [CrossRef]
- Hsu, S.H.; Chuang, M.C.; Chang, C.C. A semantic differential study of designers’ and users’ product form perception. Int. J. Ind. Ergon. 2000, 25, 375–391. [Google Scholar] [CrossRef]
- Chen, W.S.; Lee, A.S.; Lin, H.C. Study of visual evaluations for wood flooring applying fuzzy logic. J. Wood Sci. 2014, 60, 327–338. [Google Scholar] [CrossRef]
- Zhao, R.; Gao, Y.; Lin, X.; Tian, Y.; Chen, X.; Xia, L.; Jie, Y. Fuzzy theory analysis on imagery modeling of wearable bracelet in the urbanian health management. Math. Biosci. Eng. 2020, 18, 600–615. [Google Scholar] [CrossRef]
- Nagamachi, M. Kansei engineering: A new ergonomic consumer-oriented technology for product development. Int. J. Ind. Ergon. 1995, 15, 3–11. [Google Scholar] [CrossRef]
- Chen, C.H.; Lin, Z.Z. The Application of Fuzzy Theory in the Evaluation of Visual Images of Smartphone Rear Cameras. Appl. Sci. 2021, 11, 3555. [Google Scholar] [CrossRef]
- Gretton, M.; Peter, F.P. Wearables. In Position, Navigation, and Timing Technologies in the 21st Century: Integrated Satellite Navigation, Sensor Systems, and Civil Applications; Morton, Y.J., van Diggelen, F., Spilker, J.J., Jr., Parkinson, B.W., Lo, S., Gao, G., Eds.; John Wiley & Sons: Hoboken, NJ, USA, 2021. [Google Scholar]
- Lopez, X.; Afrin, K.; Nepal, B. Examining the design, manufacturing and analytics of smart wearables. Med. Devices. Sens. 2020, 3, e10087. [Google Scholar] [CrossRef]
- Almusawi, H.; Husi, G. Design and Development of Continuous Passive Motion (CPM) for Fingers and Wrist Grounded-Exoskeleton Rehabilitation System. Appl. Sci. 2021, 11, 815. [Google Scholar] [CrossRef]
- Quan, H.; Li, S.; Hu, J. Product Innovation Design Based on Deep Learning and Kansei Engineering. Appl. Sci. 2018, 8, 2397. [Google Scholar] [CrossRef] [Green Version]
- Zuo, Y.; Wang, Z. Subjective Product Evaluation System Based on Kansei Engineering and Analytic Hierarchy Process. Symmetry 2020, 12, 1340. [Google Scholar] [CrossRef]
- Xue, L.; Yi, X.; Zhang, Y. Research on Optimized Product Image Design Integrated Decision System Based on Kansei Engineering. Appl. Sci. 2020, 10, 1198. [Google Scholar] [CrossRef] [Green Version]
- Naamachi, M. Kansei engineering as a powerful consumer-oriented technology for product development. Appl. Ergon. 2002, 33, 289–294. [Google Scholar] [CrossRef]
- Simon, T.W.S.; Eklund, J.; Jan, R.C.A.; Nagamachi, M. Concepts, methods and tools in Kansei engineering. Theor. Issues Ergon. Sci. 2004, 5, 214–231. [Google Scholar]
- Tang, C.Y.; Fung, K.Y.; Lee, E.W.M.; Ho, G.T.S.; Siu, K.W.M.; Mou, W.L. Product Form Design Using Customer Perception Evaluation by a Combined Superellipse Fitting and ANN Approach. Adv. Eng. Inform. 2013, 27, 386–394. [Google Scholar] [CrossRef]
- Machado, J.A.T.; Galhano, A.; Cao Labora, D. A Clustering Perspective of the Collatz Conjecture. Mathematics 2021, 9, 314. [Google Scholar] [CrossRef]
- Cox, T.F.; Cox, M.A. Multidimensional Scaling; CRC Press: Boca Raton, FL, USA, 2000. [Google Scholar]
- Malhotra, N.K. Marketing Research: An Applied Orientation, 6th ed.; Pearson Education Inc.: New York, NY, USA, 2010. [Google Scholar]
- Connor, M.; Lawrence, A.B. Understanding Adolescents’ Categorisation of Animal Species. Animals 2017, 7, 65. [Google Scholar] [CrossRef] [Green Version]
- Li, Q.; Gu, Y.; Jia, J. Classification of Multiple Chinese Liquors by Means of a QCM-based E-Nose and MDS-SVM Classifier. Sensors 2017, 17, 272. [Google Scholar] [CrossRef] [Green Version]
- Tenreiro Machado, J.A.; Lopes, A.M.; Galhano, A.M. Multidimensional Scaling Visualization Using Parametric Similarity Indices. Entropy 2015, 17, 1775–1794. [Google Scholar] [CrossRef] [Green Version]
- Schiffman, S.S.; Schiffman, S.B.; Reynolds, M.L.; Young, F.W. Introduction to Multidimensional Scaling: Theory, Methods and Applications, 1th ed.; Emerald Publishing: Bingley, WY, UK, 1981. [Google Scholar]
- Kruskal, J.B.; Wish, M. Multidimensional Scaling. In Sage University Paper Series on Quantitative Applications in the Social, Sciences, 11th ed.; Uslaner, E.M., Ed.; Sage Publications: Beverly Hills, CA, USA, 1978. [Google Scholar]
- Rohde, D.L. Methods for binary multidimensional scaling. Neural Comput. 2002, 14, 1195–1232. [Google Scholar] [CrossRef] [PubMed]
- MacKay, K.J.; Fesenmaier, D.R. An exploration of cross-cultural destination image assessment. J. Travel Res. 2000, 38, 417–423. [Google Scholar] [CrossRef]
- Wang, J.; Hsu, Y. The Relationship of Symmetry, Complexity, and Shape in Mobile Interface Aesthetics, from an Emotional Perspective—A Case Study of the Smartwatch. Symmetry 2020, 12, 1403. [Google Scholar] [CrossRef]
- Kruskal, J.B. Multidimensional scaling by optimizing goodness of fit to a nonmetric hypothesis. Psychometrika 1964, 29, 1–27. [Google Scholar] [CrossRef]
- Lewis-Beck, M.S. Factor Analysis and Related Techniques; Sage Publications: Newbury Park, CA, USA, 1994. [Google Scholar]
- Brown, F.G. Principles of Educational and Psychological Testing, 3rd ed.; Holt, Rinehart and Winston: New York, NY, USA, 1983. [Google Scholar]
- Kline, P. An Easy Guide to Factor Analysis, 1st ed.; Routledge: London, UK, 1994. [Google Scholar]
- Pearson, K. LIII. On lines and planes of closest fit to systems of points in space. Lond. Edinb. Dublin Philos. Mag. J. Sci. 1901, 2, 559–572. [Google Scholar] [CrossRef] [Green Version]
- Shyu, G.-S.; Cheng, B.-Y.; Chiang, C.-T.; Yao, P.-H.; Chang, T.-K. Applying Factor Analysis Combined with Kriging and Information Entropy Theory for Mapping and Evaluating the Stability of Groundwater Quality Variation in Taiwan. Int. J. Environ. Res. Public Health 2011, 8, 1084–1109. [Google Scholar] [CrossRef]
- Waris, M.; Shahir Liew, M.; Khamidi, M.F.; Idrus, A. Criteria for the Selection of Sustainable Onsite Construction Equipment. Int. J. Sustain. Built Environ. 2014, 3, 96–110. [Google Scholar] [CrossRef] [Green Version]
- Solangi, Y.A.; Tan, Q.; Khan, M.W.A.; Mirjat, N.H.; Ahmed, I. The Selection of Wind Power Project Location in the Southeastern Corridor of Pakistan: A Factor Analysis, AHP, and Fuzzy-TOPSIS Application. Energies 2018, 11, 1940. [Google Scholar] [CrossRef] [Green Version]
- Kaiser, H.F. The application of electronic computers to factor analysis. Educ. Psychol. Meas. 1960, 20, 141–151. [Google Scholar] [CrossRef]
- Zadeh, L.A. Fuzzy sets. Inf. Control. 1965, 8, 338–353. [Google Scholar] [CrossRef] [Green Version]
- Dubois, D.; Prade, H. Fuzzy Sets and Systems: Theory and Applications; Academic Press: Cambridge, MA, USA, 1980. [Google Scholar]
- Ishikawa, A.; Amagasa, M.; Shiga, T.; Tomizawa, G.; Tatsuta, R.; Mieno, H. The max-min Delphimethod and fuzzy Delphi method via fuzzy integration. Fuzzy Sets Syst. 1993, 55, 241–253. [Google Scholar] [CrossRef]
- Zadeh, L.A. Outline of a new approach to the analysis of complex systems and decision processes. IEEE Trans. Syst. Man Cybern. 1973, 3, 28–44. [Google Scholar] [CrossRef] [Green Version]
- Zadeh, L.A. The concept of a linguistic variable and its application to approximate reasoning—I. Inf. Sci. 1975, 8, 199–249. [Google Scholar] [CrossRef]
- Chen, C.T. A fuzzy approach to select the location of the distribution center. Fuzzy Set. Syst. 2001, 118, 65–73. [Google Scholar] [CrossRef]
- Gani, A.N.; Assarudeen, S.M. A new operation on triangular fuzzy number for solving fuzzy linear programming problem. Appl. Math. Sci. 2012, 6, 525–532. [Google Scholar]
- Hsiao, S.W. Fuzzy logic based decision model for product design. Int. J. Ind. Ergon. 1998, 21, 103–116. [Google Scholar] [CrossRef]
- Maturo, F.; Fortuna, F. Bell-shaped fuzzy numbers associated with the normal curve. In Proceedings of the 47th Scientific Meeting of the Italian Statistical Society, University of Cagliari, Cagliari, Italy, 8–10 June 2014. [Google Scholar]
- Duch, W. Uncertainty of data, fuzzy membership functions, and multilayer perceptrons. IEEE Trans. Neural Netw. 2005, 16, 10–23. [Google Scholar] [CrossRef]
- Wang, X.; Zhang, C.; Li, S.; Wang, C.; Wang, H.; Cui, Y. Ecological risk, health risk assessment, and pollution source analysis of Xinli Lake wetland based on triangular fuzzy number. Environ. Sci. Pollut. Res. Int. 2021, 28, 22334–22347. [Google Scholar] [CrossRef]
- Hsieh, C.H.; Chen, S.H. A model and algorithm of fuzzy product positioning. Inf. Sci. 1999, 121, 61–82. [Google Scholar] [CrossRef]
- Wang, Y.M.; Elhag, T.M. Fuzzy TOPSIS method based on alpha level sets with an application to bridge risk assessment. Expert Syst. Appl. 2006, 31, 309–319. [Google Scholar] [CrossRef]
- Hwang, G.J.; Huang, S.T. A new environment for developing fuzzy expert systems. J. Inf. Sci. 1999, 15, 53–69. [Google Scholar]
- Chen, S.H. Ranking fuzzy numbers with maximizing set and minimizing set. Fuzzy Sets. Syst. 1985, 17, 113–129. [Google Scholar] [CrossRef]
- Raj, P.A.; Kumar, D.N. Ranking Alternatives with Fuzzy Weights using Maximizing Set and Minimizing Set. Fuzzy Sets. Syst. 1999, 105, 365–375. [Google Scholar]
- Choi, A.-N.; Lee, J.-H.; Son, S.-A.; Jung, K.-H.; Kwon, Y.H.; Park, J.-K. Effect of Dentin Wetness on the Bond Strength of Universal Adhesives. Materials 2017, 10, 1224. [Google Scholar] [CrossRef] [Green Version]
- Umka Welbat, J.; Sirichoat, A.; Chaijaroonkhanarak, W.; Prachaney, P.; Pannangrong, W.; Pakdeechote, P.; Sripanidkulchai, B.; Wigmore, P. Asiatic Acid Prevents the Deleterious Effects of Valproic Acid on Cognition and Hippocampal Cell Proliferation and Survival. Nutrients 2016, 8, 303. [Google Scholar] [CrossRef] [Green Version]
- Liu, C.W.; Lin, K.H.; Kuo, Y.M. Application of factor analysis in the assessment of groundwater quality in a blackfoot disease area in Taiwan. Sci. Total Environ. 2003, 313, 77–89. [Google Scholar] [CrossRef]
- Bar, M.; Neta, M. Humans prefer curved visual objects. Psychol. Sci. 2006, 17, 645–648. [Google Scholar] [CrossRef]
- Berlyne, D.E. Aesthetics and Psychobiology; Appleton-Century-Crofts: New York, NY, USA, 1971. [Google Scholar]
- Creusen, M.E.; Veryzer, R.W.; Schoormans, J.P. Product value importance and consumer preference for visual complexity and symmetry. Eur. J. Mark. 2010, 44, 1437–1452. [Google Scholar] [CrossRef]
- Luffarelli, J.; Stamatogiannakis, A.; Yang, H. The visual asymmetry effect: An interplay of logo design and brand personality on brand equity. J. Mark. Res. 2019, 56, 89–103. [Google Scholar] [CrossRef]
- Leder, H.; Tinio, P.P.; Brieber, D.; Kröner, T.; Jacobsen, T.; Rosenberg, R. Symmetry is not a universal law of beauty. Empir. Stud. Arts 2019, 37, 104–114. [Google Scholar] [CrossRef] [Green Version]
- Tinio, P.P.; Leder, H. Just how stable are stable aesthetic features? Symmetry, complexity, and the jaws of massive familiarization. Acta Psychol. 2009, 130, 241–250. [Google Scholar] [CrossRef] [PubMed]
- Wu, T.-Y. The Effect of Product Aesthetics on Older Consumers. In International Conference on Human-Computer Interaction; Springer: Berlin/Heidelberg, Germany, 2019. [Google Scholar]
- Hsiao, K.-L.; Chen, C.-C. What drives smartwatch purchase intention? Perspectives from hardware, software, design, and value. Telemat. Inform. 2018, 35, 103–113. [Google Scholar] [CrossRef]


| Linguistic Scales | Corresponding Triangular Fuzzy Number |
|---|---|
| Very poor (VP) | (0,0,1) |
| Poor (P) | (0,1,3) |
| Medium poor (MP) | (1,3,5) |
| Fair (F) | (3,5,7) |
| Medium good (MG) | (5,7,9) |
| Good (G) | (7,9,10) |
| Very good (VG) | (9,10,10) |
| Dimensions | 2 | 3 | 4 | 5 | 6 |
|---|---|---|---|---|---|
| Stress | 0.19598 | 0.12567 | 0.08583 | 0.06803 | 0.05685 |
| RSQ | 0.78577 | 0.87374 | 0.92253 | 0.93835 | 0.94614 |
| Category | 1 | 2 | 3 | 4 | 5 | 6 | 7 | 8 |
|---|---|---|---|---|---|---|---|---|
| Sample | S43 | S46 | S59 | S61 | S67 | S73 | S87 | S89 |
| Distance | 0.85811 | 0.89645 | 0.41045 | 0.54486 | 0.97418 | 1.30389 | 0.56787 | 0.67504 |
| Modern | Smart | Scientific | Concise | Fashionable | Stylish | Practical | Exquisite |
| Accessible | Classic | Durable | Quality | Multifunctional | Superior | Fancy | Fascinating |
| Minimalist | Convenient | Geometrical | Decent | Magnificent | Innovative | Futuristic | Steady |
| Compact | Rational | Tidy | Advanced | Precise | Mechanical | Ordered | Delicate |
| Individual | Simple | Sleek | Trendy | Refreshing | Excellent | Unique | Mature |
| Adjectives | Extraction | Adjectives | Extraction | Adjectives | Extraction |
|---|---|---|---|---|---|
| Modern | 0.601 | Superior | 0.683 | Ordered | 0.569 |
| Smart | 0.747 | Fancy | 0.566 | Delicate | 0.546 |
| Scientific | 0.659 | Fascinating | 0.578 | Individual | 0.577 |
| Fashionable | 0.542 | Convenient | 0.570 | Simple | 0.518 |
| Practical | 0.559 | Decent | 0.564 | Sleek | 0.575 |
| Exquisite | 0.633 | Magnificent | 0.594 | Trendy | 0.639 |
| Accessible | 0.669 | Innovative | 0.670 | Refreshing | 0.709 |
| Classic | 0.529 | Futuristic | 0.616 | Excellent | 0.634 |
| Durable | 0.626 | Rational | 0.508 | Unique | 0.624 |
| Quality | 0.657 | Tidy | 0.537 | Mature | 0.623 |
| Multifunctional | 0.566 | Advanced | 0.630 |
| Factor of Component | Initial Eigenvalues | Squares Loading Extraction | Transformed Squares Loading | ||||||
|---|---|---|---|---|---|---|---|---|---|
| Total | Variance (%) | Accumulative (%) | Total | Variance (%) | Accumulative (%) | Total | Variance (%) | Accumulative (%) | |
| 1 | 11.387 | 35.583 | 35.583 | 11.387 | 35.583 | 35.583 | 5.765 | 18.017 | 18.017 |
| 2 | 2.654 | 8.292 | 43.876 | 2.654 | 8.292 | 43.876 | 5.301 | 16.566 | 34.583 |
| 3 | 2.235 | 6.985 | 50.860 | 2.235 | 6.985 | 50.860 | 3.720 | 11.624 | 46.207 |
| 4 | 1.663 | 5.198 | 56.058 | 1.663 | 5.198 | 56.058 | 2.746 | 8.581 | 54.788 |
| 5 | 1.379 | 4.308 | 60.367 | 1.379 | 4.308 | 60.367 | 1.785 | 5.578 | 60.367 |
| Adjectives | Component | ||||
|---|---|---|---|---|---|
| 1 | 2 | 3 | 4 | 5 | |
| Innovative | 0.780 | 0.115 | 0.177 | 0.084 | 0.099 |
| Individual | 0.721 | 0.094 | 0.205 | 0.034 | 0.073 |
| Trendy | 0.690 | 0.307 | 0.075 | 0.155 | 0.197 |
| Fascinating | 0.679 | 0.024 | 0.111 | 0.320 | −0.039 |
| Unique | 0.675 | 0.270 | 0.301 | −0.057 | 0.024 |
| Fashionable | 0.649 | 0.174 | 0.216 | 0.197 | 0.072 |
| Futuristic | 0.649 | 0.121 | 0.210 | 0.243 | 0.277 |
| Fancy | 0.631 | 0.283 | 0.238 | 0.153 | −0.091 |
| Superior | 0.554 | 0.250 | 0.213 | 0.324 | −0.404 |
| Advanced | 0.533 | 0.356 | 0.067 | 0.290 | 0.361 |
| Excellent | 0.531 | 0.461 | 0.364 | 0.077 | −0.032 |
| Refreshing | 0.274 | 0.782 | 0.049 | 0.049 | 0.134 |
| Sleek | 0.136 | 0.743 | 0.058 | 0.032 | 0.002 |
| Ordered | 0.195 | 0.703 | 0.180 | −0.066 | −0.020 |
| Tidy | 0.019 | 0.699 | −0.005 | 0.113 | 0.188 |
| Simple | 0.158 | 0.671 | 0.002 | 0.176 | 0.109 |
| Rational | 0.009 | 0.636 | 0.193 | 0.142 | 0.213 |
| Mature | 0.347 | 0.616 | 0.313 | −0.057 | −0.146 |
| Decent | 0.121 | 0.589 | 0.199 | 0.231 | −0.331 |
| Delicate | 0.324 | 0.554 | 0.288 | 0.177 | −0.138 |
| Magnificent | 0.319 | 0.524 | 0.288 | 0.261 | −0.257 |
| Quality | 0.182 | 0.029 | 0.778 | 0.128 | −0.048 |
| Durable | 0.157 | 0.114 | 0.759 | −0.057 | 0.091 |
| Exquisite | 0.372 | 0.116 | 0.637 | 0.105 | −0.252 |
| Practical | 0.205 | 0.181 | 0.611 | 0.060 | 0.327 |
| Accessible | 0.202 | 0.206 | 0.609 | 0.134 | 0.444 |
| Classic | 0.300 | 0.302 | 0.587 | 0.053 | −0.014 |
| Smart | 0.234 | 0.099 | 0.024 | 0.791 | 0.239 |
| Scientific | 0.200 | 0.161 | 0.124 | 0.760 | 0.019 |
| Modern | 0.125 | 0.122 | 0.042 | 0.754 | −0.028 |
| Multifunctional | 0.188 | 0.058 | 0.042 | 0.471 | 0.551 |
| Convenient | 0.341 | 0.165 | 0.365 | 0.128 | 0.527 |
| Factor | Factor (Group) Naming | Groups of Adjectives |
|---|---|---|
| 1 | Fashionable and individual | Innovative, individual, trendy, fascinating, unique, fashionable, futuristic, fancy, superior, advanced, excellent |
| 2 | Rational and decent | Refreshing, sleek, ordered, tidy, simple, rational, mature, decent, delicate, magnificent |
| 3 | Practical and durable | Quality, durable, exquisite, practical, accessible, classic |
| 4 | Modern and smart | Smart, scientific, modern |
| 5 | Convenient and multiple | Multifunctional, convenient |
| Fashionable and Individual | Rational and Decent | Practical and Durable | Modern and Smart | Convenient and Multiple |
|---|---|---|---|---|
| S89(5.23 7.03 8.39) | S61(5.39 7.21 8.67) | S89(4.88 6.73 8.29) | S59(5.08 6.94 8.44) | S89(5.35 7.21 8.65) |
| S59(4.96 6.80 8.30) | S59(5.16 7.01 8.49) | S59(4.63 6.51 8.13) | S89(5.00 6.81 8.27) | S59(4.88 6.75 8.33) |
| S61(4.78 6.61 8.14) | S67(4.46 6.32 7.92) | S61(4.49 6.36 8.00) | S61(4.59 6.42 8.00) | S61(4.59 6.42 7.96) |
| S87(4.22 6.04 7.68) | S43(4.32 6.17 7.79) | S46(3.87 5.76 7.52) | S67(4.23 6.06 7.72) | S67(3.96 5.81 7.51) |
| S67(4.19 6.02 7.66) | S46(4.29 6.13 7.78) | S43(3.86 5.74 7.49) | S87(4.11 5.88 7.50) | S87(4.01 5.79 7.45) |
| S46(3.36 5.18 6.96) | S87(4.41 6.17 7.76) | S87(4.04 5.84 7.48) | S46(3.93 5.76 7.50) | S46(3.69 5.54 7.31) |
| S43(2.94 4.66 6.42) | S89(4.47 6.22 7.74) | S67(3.88 5.75 7.43) | S43(3.29 5.05 6.79) | S43(3.27 5.05 6.81) |
| S73(2.54 4.11 5.85) | S73(3.05 4.69 6.41) | S73(3.43 5.11 6.82) | S73(2.83 4.49 6.22) | S73(2.82 4.52 6.29) |
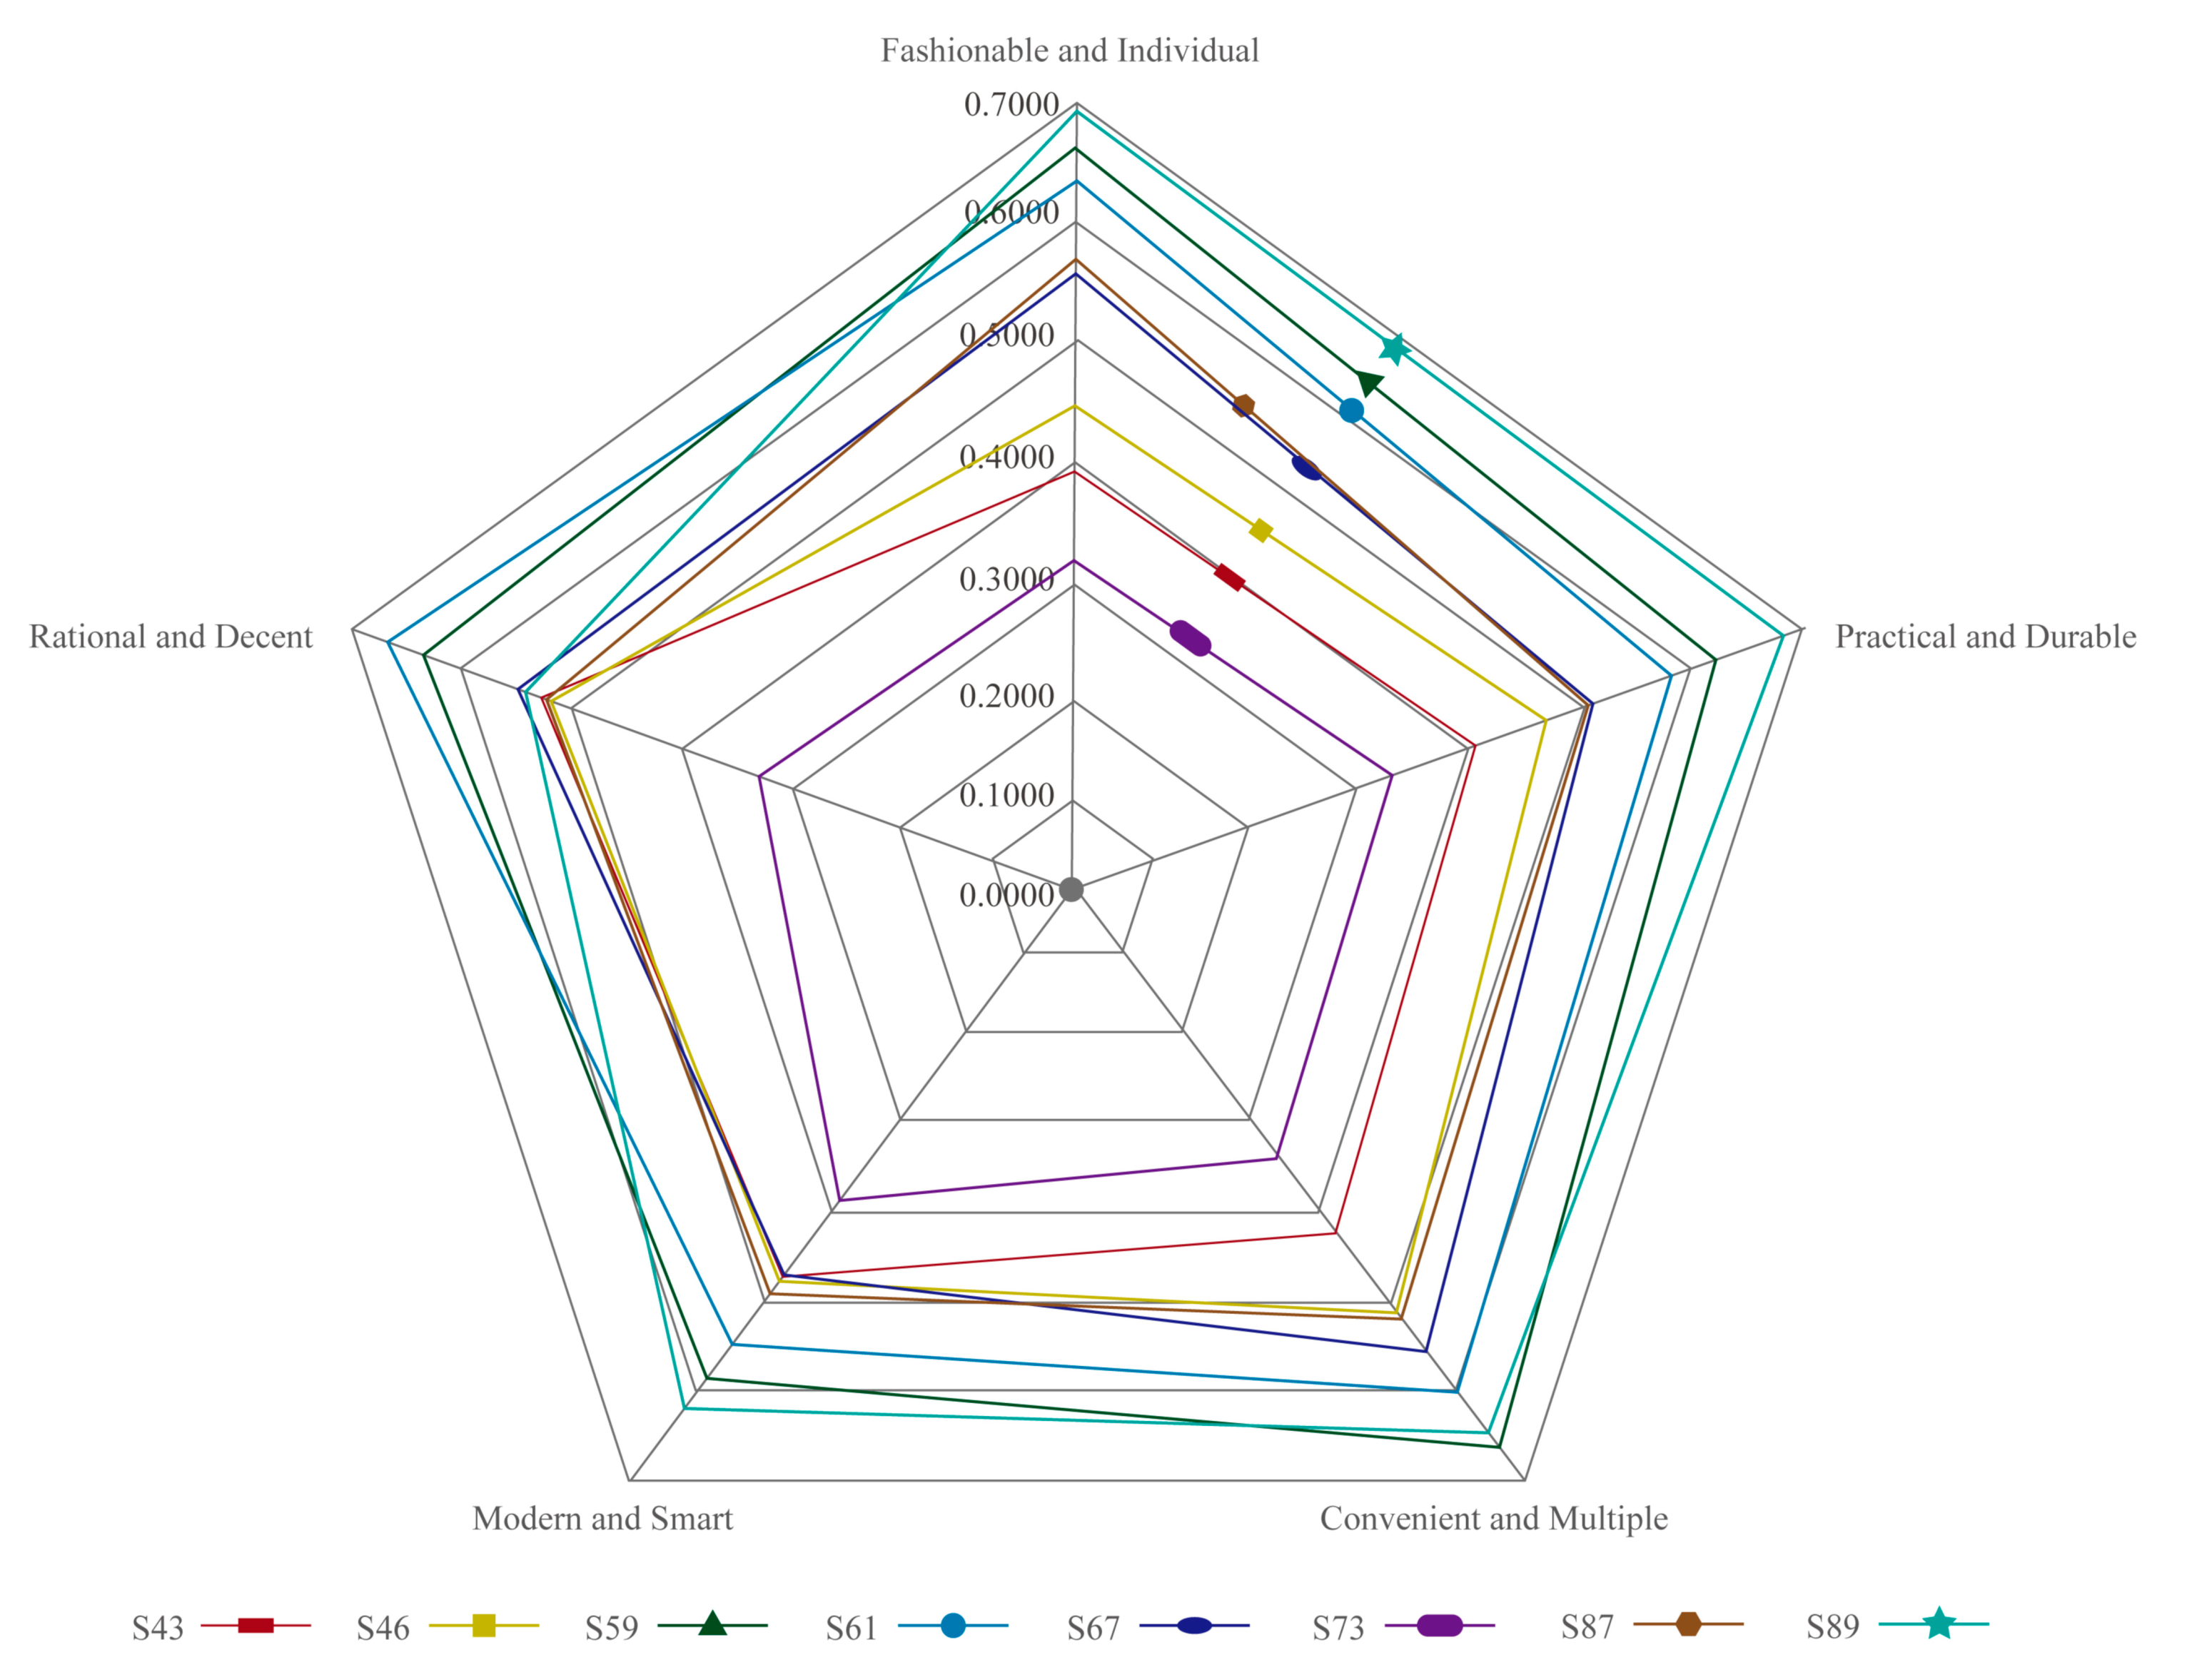
| Samples | Fashionable and Individual | Rational and Decent | Practical and Durable | Modern and Smart | Convenient and Multiple | |
|---|---|---|---|---|---|---|
| S43 |  | 0.3950 | 0.5362 | 0.4785 | 0.4234 | 0.4094 |
| S46 |  | 0.4618 | 0.5318 | 0.4815 | 0.5096 | 0.4725 |
| S59 |  | 0.6689 | 0.6482 | 0.5912 | 0.6696 | 0.6270 |
| S61 |  | 0.6444 | 0.6765 | 0.5693 | 0.6008 | 0.5837 |
| S67 |  | 0.5684 | 0.5559 | 0.4782 | 0.5534 | 0.5061 |
| S73 |  | 0.3239 | 0.3419 | 0.3865 | 0.3451 | 0.3412 |
| S87 |  | 0.5713 | 0.5381 | 0.4925 | 0.5296 | 0.5043 |
| S89 |  | 0.6992 | 0.5435 | 0.6244 | 0.6529 | 0.6864 |
| Source | SS | DF | MS | F | p | η2 | LSD |
|---|---|---|---|---|---|---|---|
| wrist wearables | 294.186 | 7 | 42.027 | 19.650 | 0.000 *** | 0.134 | S43, S73 < S46, S67, S87 < S59, S61, S89 |
| Source | SS | DF | MS | F | p | η2 | LSD |
|---|---|---|---|---|---|---|---|
| wrist wearables | 320.929 | 7 | 45.847 | 19.213 | 0.000 *** | 0.132 | S43, S73 < S46, S67 < S59, S61, S89. S43, S73 < S59, S61, S87. S43, S73 < S67, S87. S46 < S87 < S89. |
Publisher’s Note: MDPI stays neutral with regard to jurisdictional claims in published maps and institutional affiliations. |
© 2021 by the authors. Licensee MDPI, Basel, Switzerland. This article is an open access article distributed under the terms and conditions of the Creative Commons Attribution (CC BY) license (https://creativecommons.org/licenses/by/4.0/).
Share and Cite
Jia, L.-M.; Tung, F.-W. A Study on Consumers’ Visual Image Evaluation of Wrist Wearables. Entropy 2021, 23, 1118. https://doi.org/10.3390/e23091118
Jia L-M, Tung F-W. A Study on Consumers’ Visual Image Evaluation of Wrist Wearables. Entropy. 2021; 23(9):1118. https://doi.org/10.3390/e23091118
Chicago/Turabian StyleJia, Liang-Ming, and Fang-Wu Tung. 2021. "A Study on Consumers’ Visual Image Evaluation of Wrist Wearables" Entropy 23, no. 9: 1118. https://doi.org/10.3390/e23091118
APA StyleJia, L.-M., & Tung, F.-W. (2021). A Study on Consumers’ Visual Image Evaluation of Wrist Wearables. Entropy, 23(9), 1118. https://doi.org/10.3390/e23091118