
Statistics-Based Outlier Detection and Correction Method for Amazon Customer Reviews


 , , and
Abstract
:1. Introduction
2. Related Work
3. Datasets
4. Statistics-Based Outlier Detection and Correction Method (SODCM)
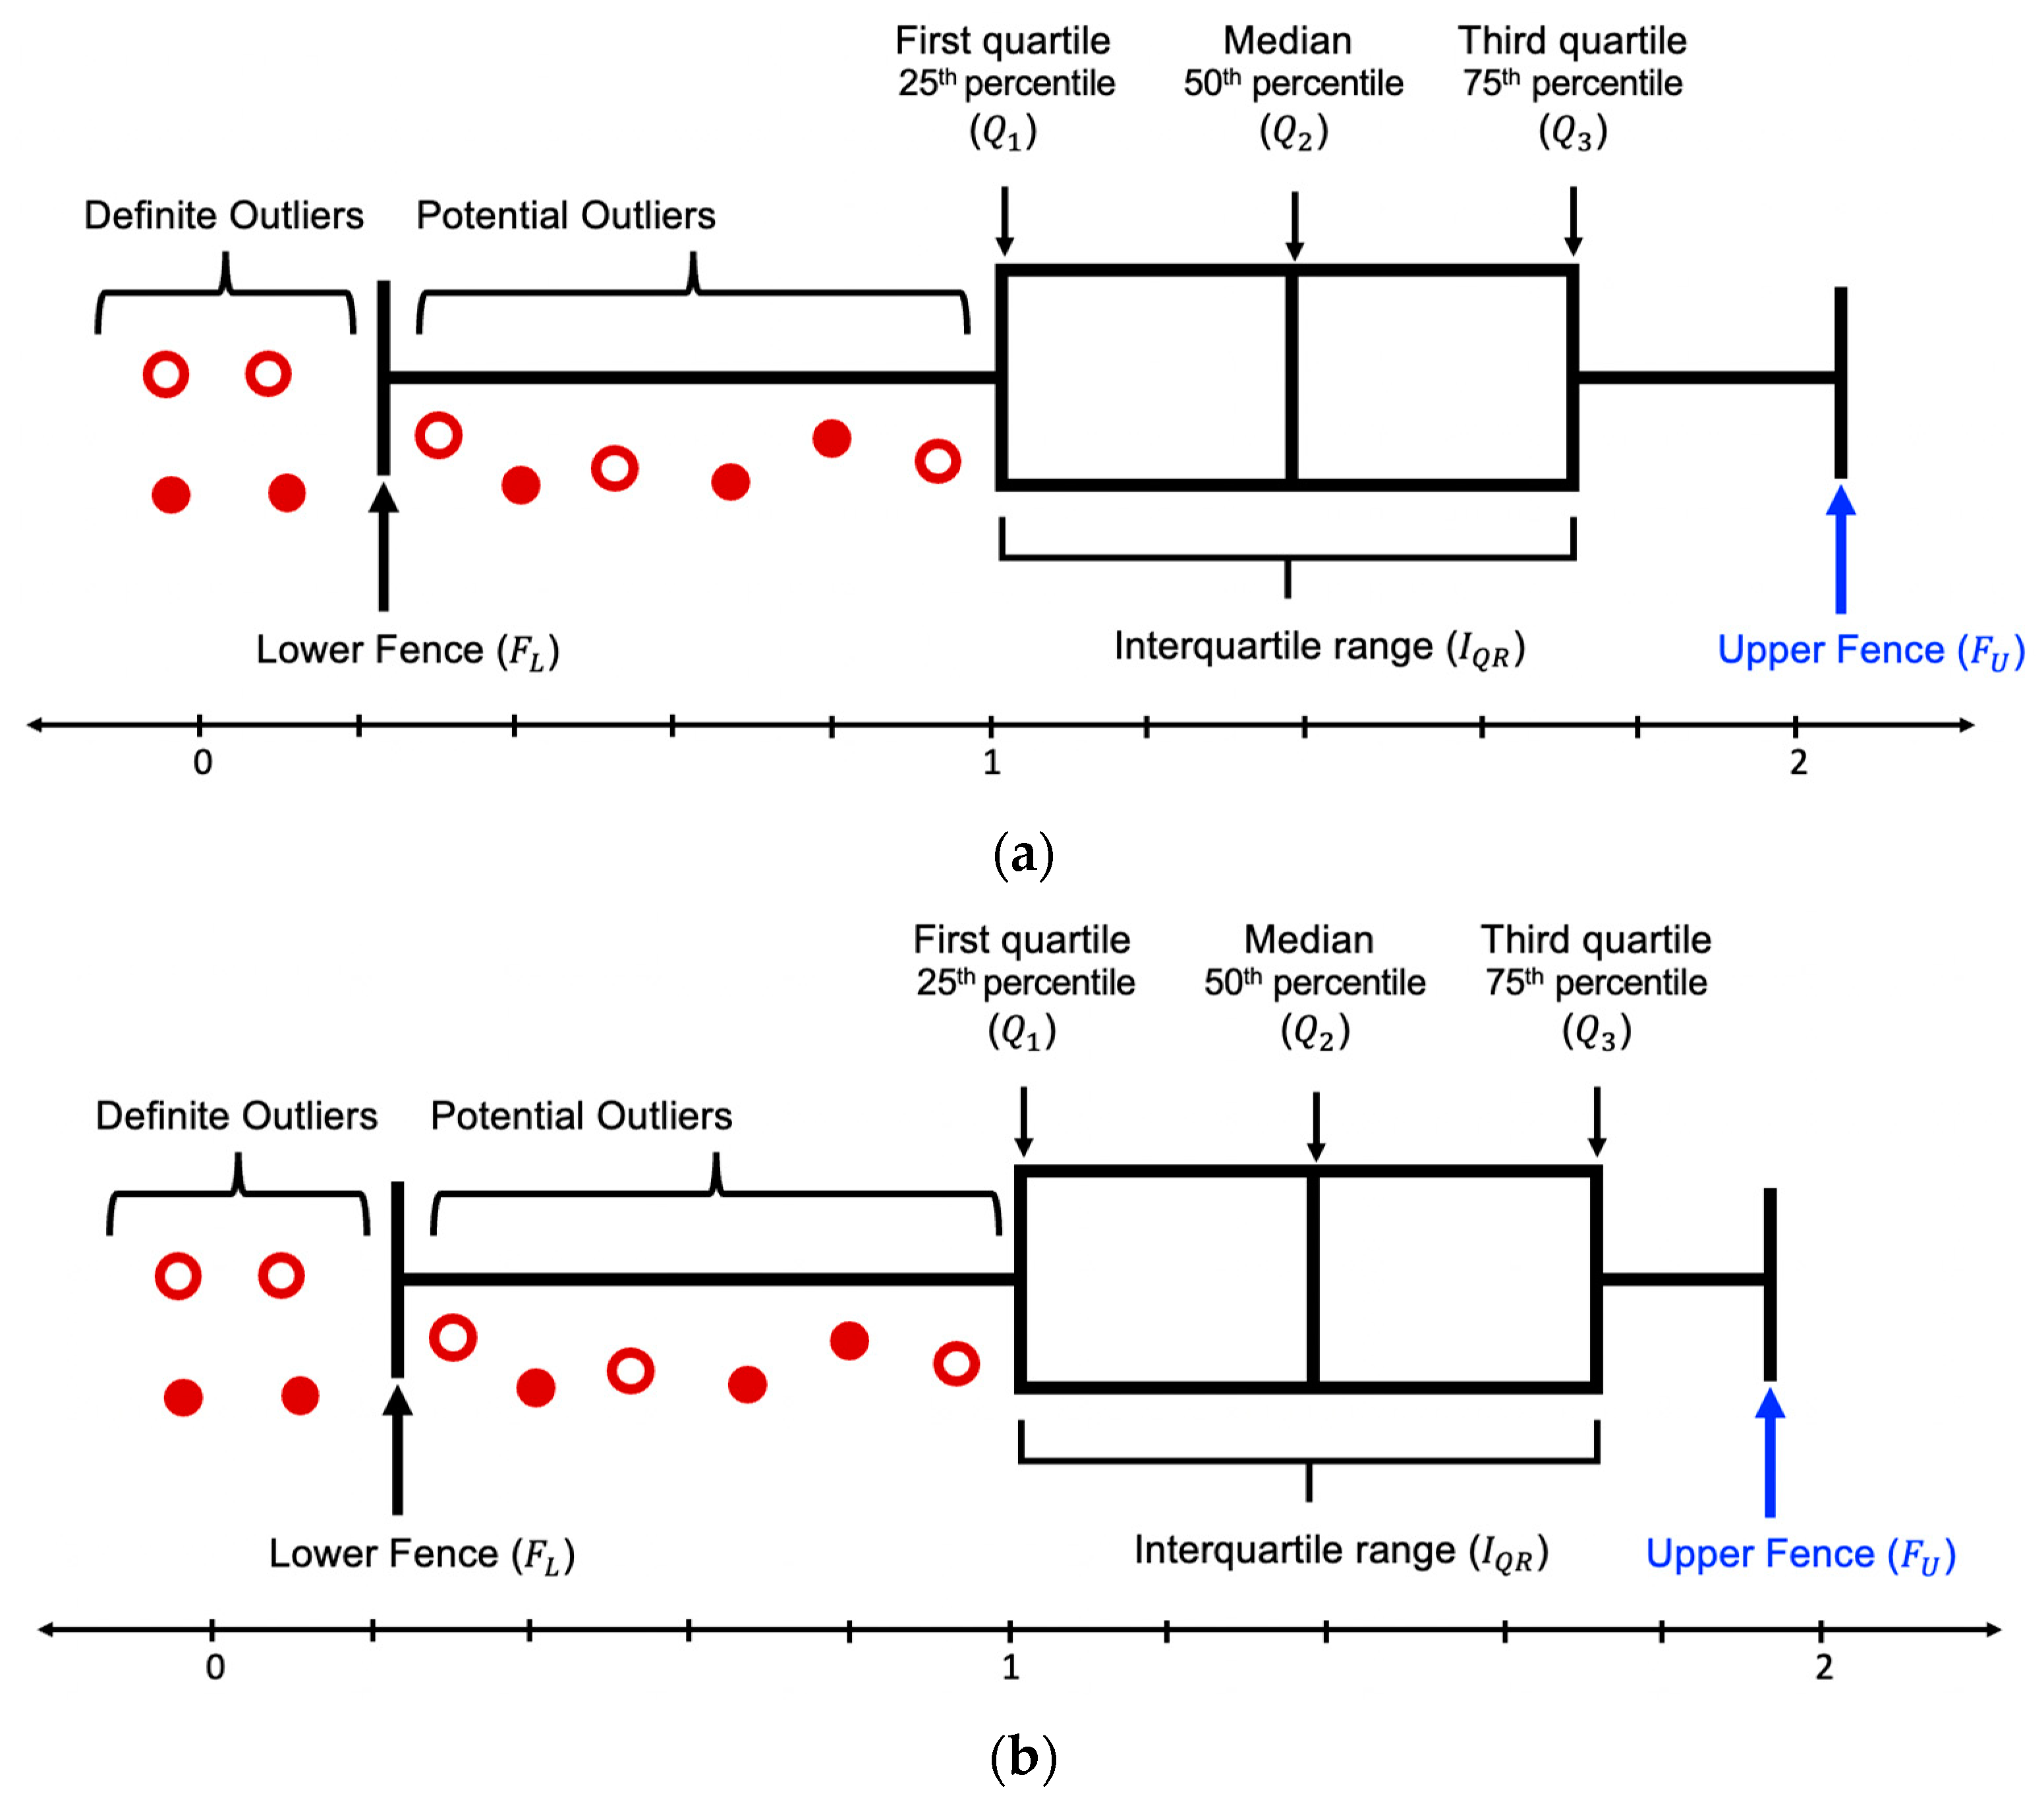
4.1. Interquartile Range
4.2. Definitions for SODCM
4.3. Proposed Algorithm
- Input:
- The input for SODCM is any dataset containing customer reviews () and their corresponding star ratings ();
- Step 1:
- is calculated using . If belongs to then and if belongs to then . Since this work focuses on the binary classification of the sentiments of customer reviews, the values assigned to are or ;
- Step 2:
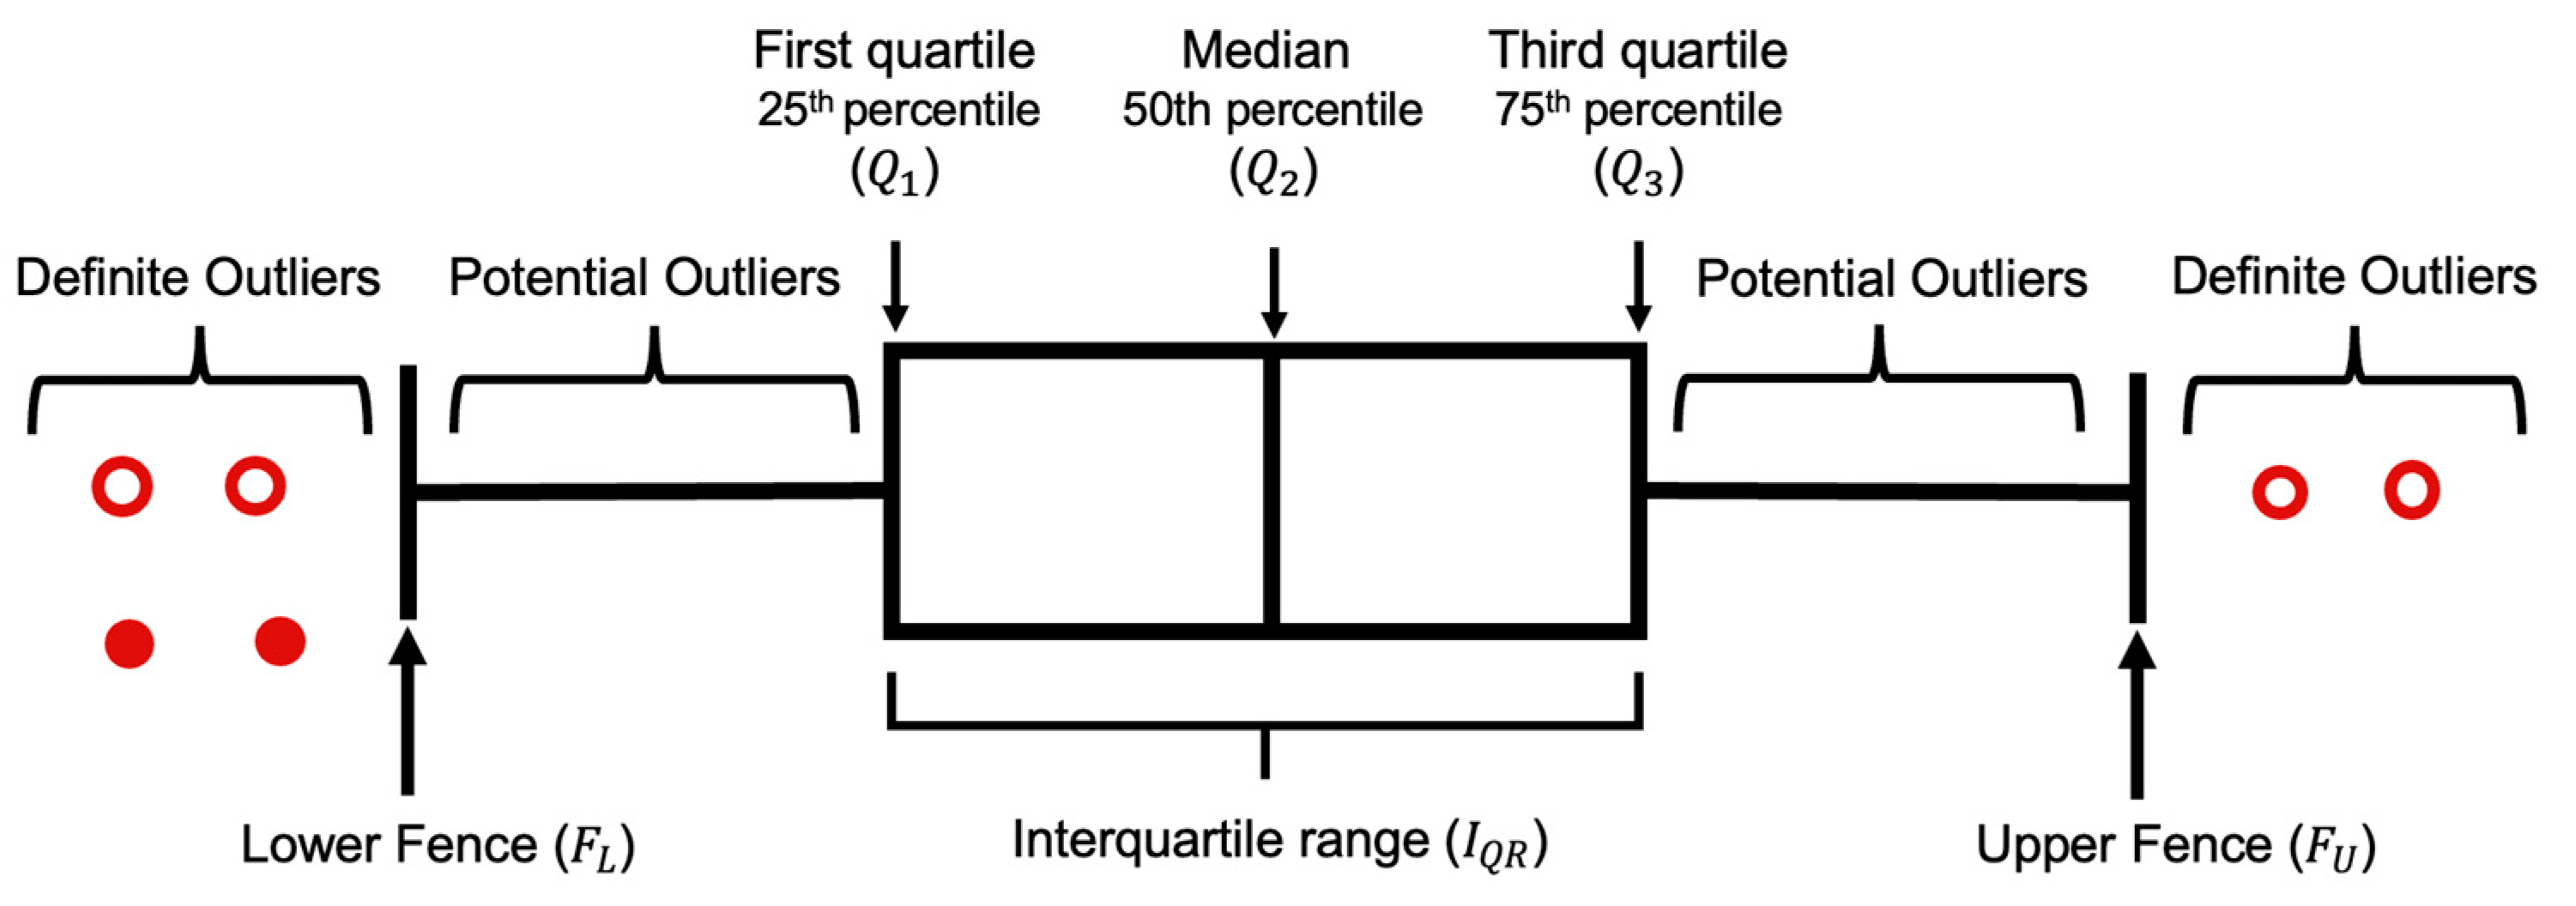
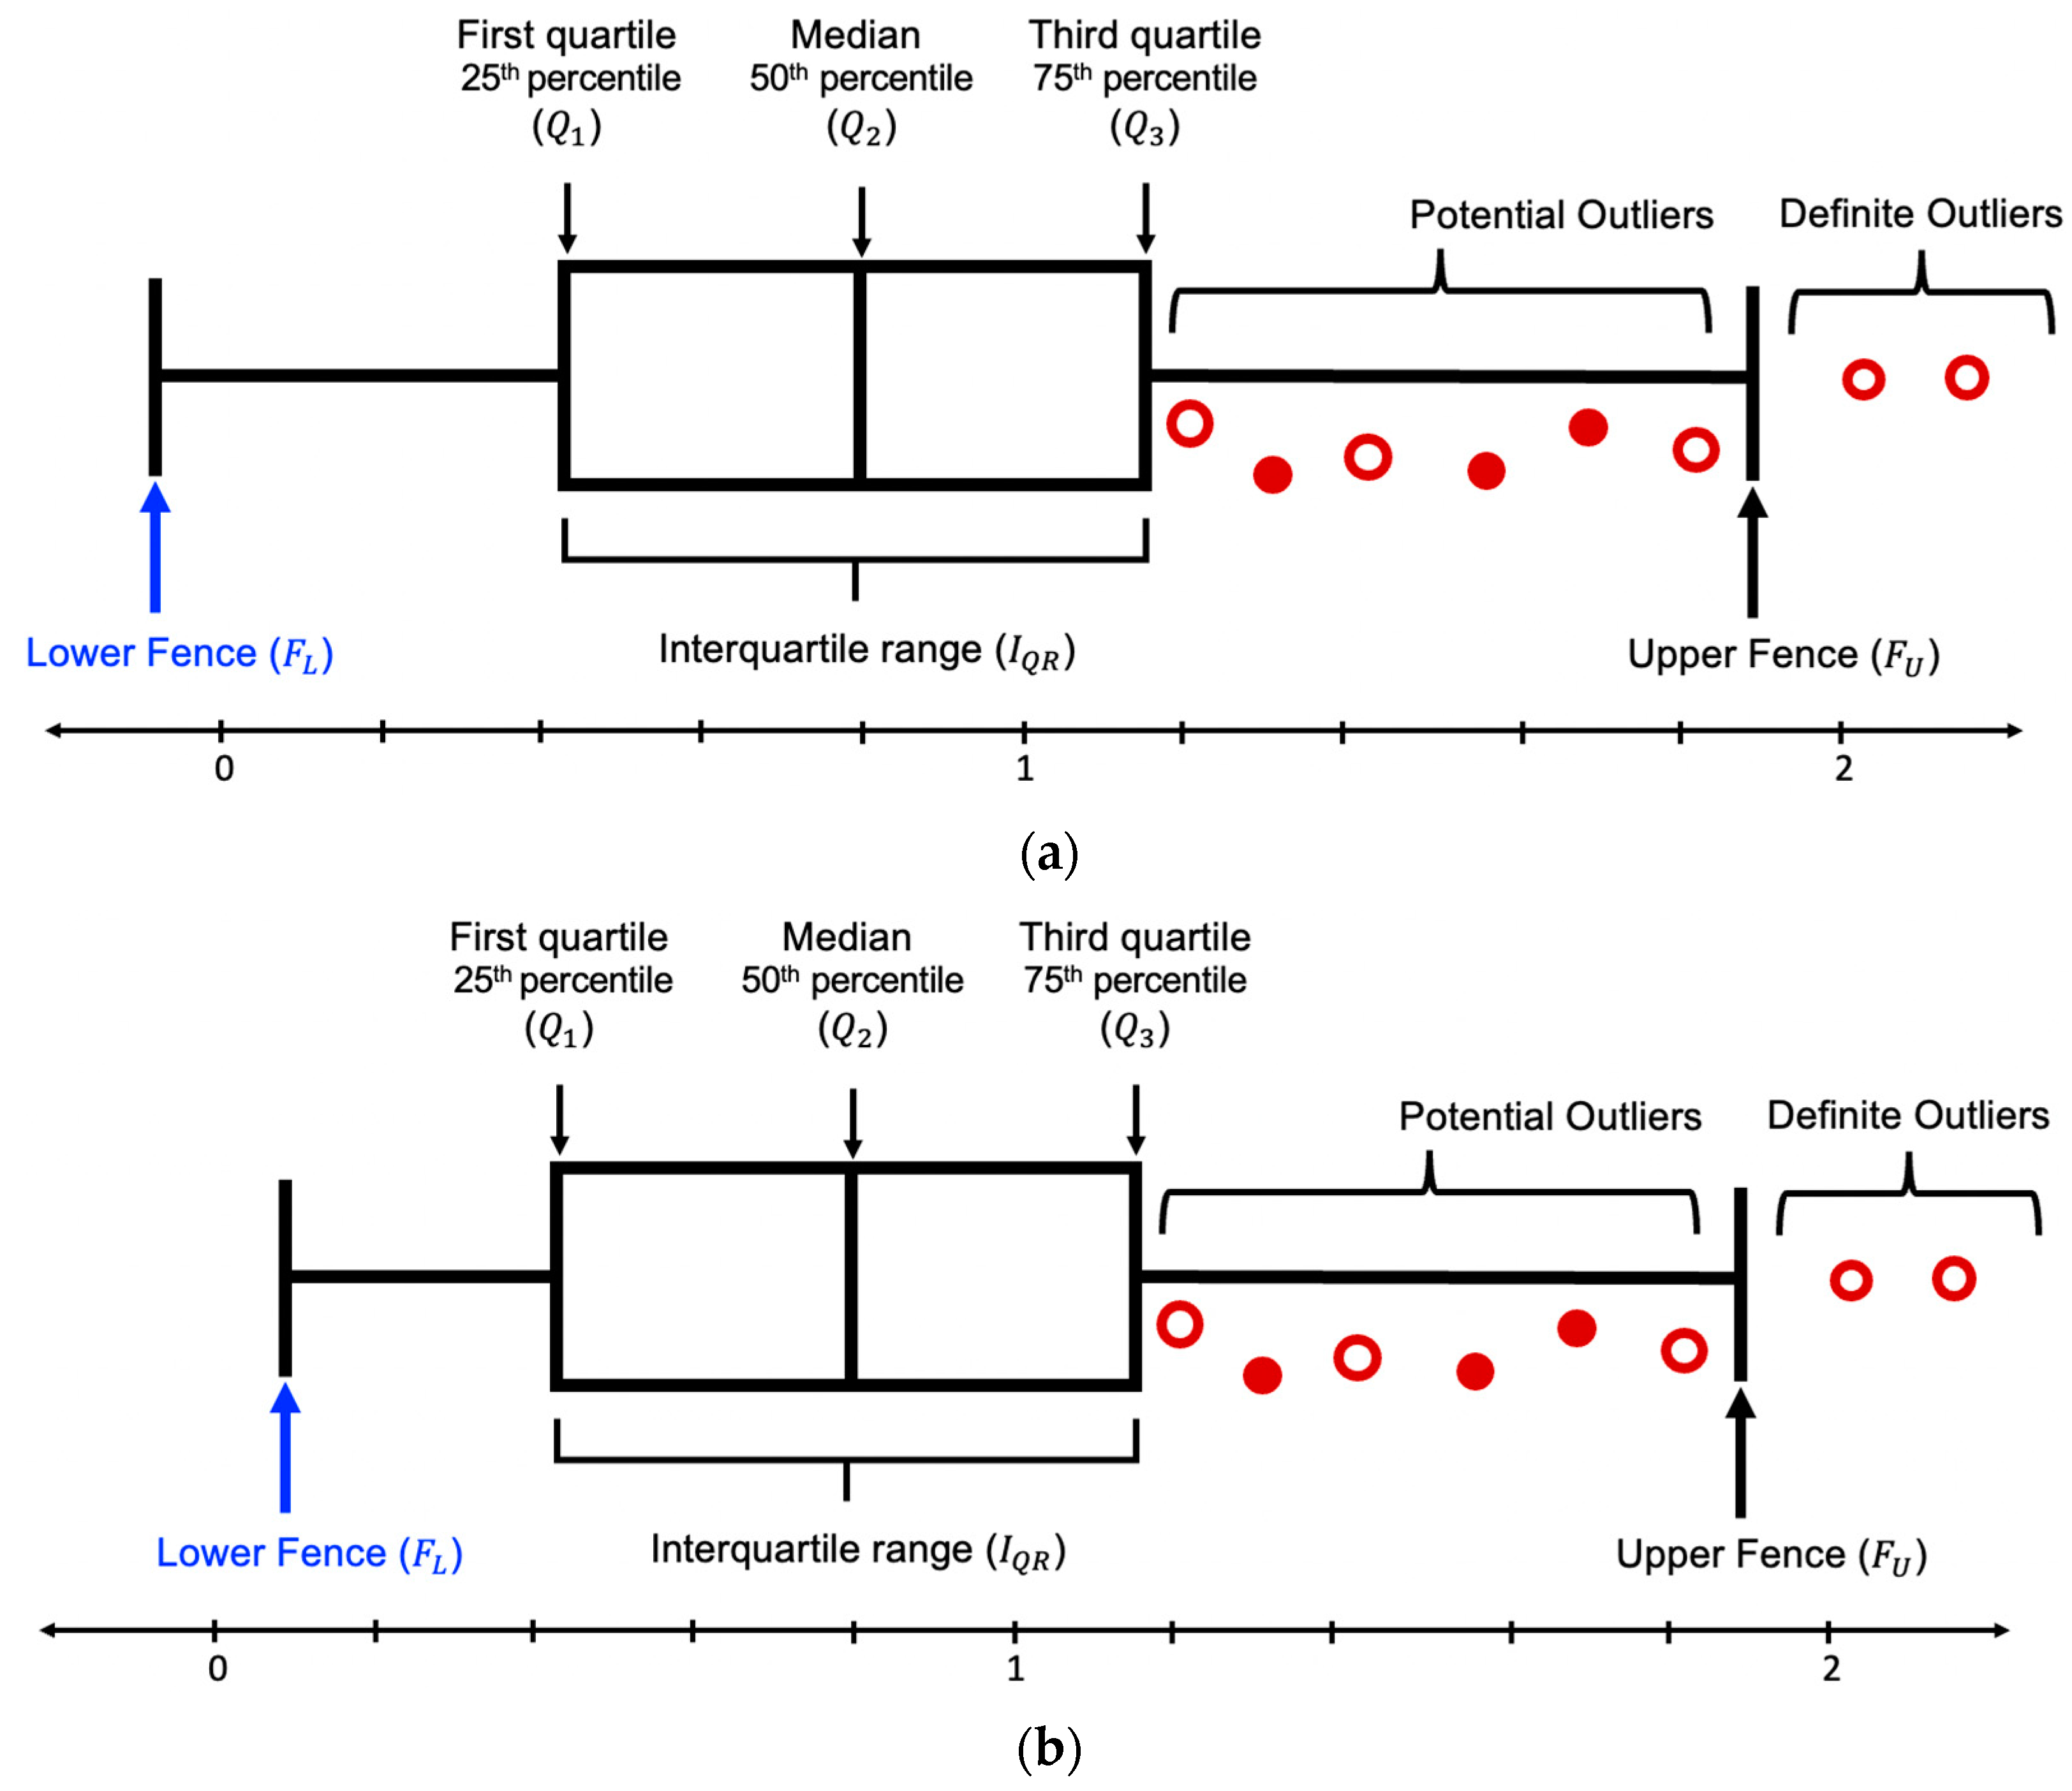
- is calculated between and . The value of is always positive. Since the minimum and maximum value and is 0 and 1, the range of is between 0 and 2. Figure 4 is an example of the box plot distribution of . Since the minimum value can hold is 0, Figure 4a depicts the box plot of when is negative and Figure 4b depicts the box plot of when is positive. Figure 5 is an example of the box plot distribution of . Since the maximum value can hold is 2, Figure 5a depicts the box plot of when > 2 and Figure 5b depicts the box plot of when ≤ 2;
- Step 3:
- After analyzing the dataset, it can be construed that has some reviews whose sentiment does not match the nature of star rating; hence, they are considered outliers. On the other hand, has very few reviews whose opinions match the essence of their respective star rating; hence, the reviews which are correctly assigned to their corresponding star ratings are considered outliers. This implies that most negative comments are incorrectly rated; therefore, the outliers, in this case, would be the correctly rated comments. In other words, the incorrectly labeled reviews are all the reviews in , excluding the ones which are outliers. Hence, the dataset is split into and ;
- Step 4:
- In , if is negative, then can be calculated as else, . Since the range of is [0, 2], the least value it can hold is 0. In if , then can be calculated as else, . We compute as follows:
- Step 5:
- In , , if is outlier. For , customer comments, whose , are outliers. In , if , if is outlier. For , customer comments whose , are outliers. These five steps complete the outlier detection process;
- Step 6:
- of reviews labeled as outliers in is reversed, meaning a comment with now becomes re-labeled as and vice versa. On the contrary, for , of reviews that are not labeled as outliers is reversed. This step is vital as it performs outlier correction by changing the nature of ;
- Output:
- The output of the proposed algorithm is the dataset consisting of reviews with their corrected nature of star ratings which means a positive natured review is labeled as and the negative natured review as . SODCM helps in detecting the outliers and correcting them without eliminating or modifying any review.
| Algorithm 1 Statistics-based outlier detection and correction method (SODCM) | |
| Input: // dataset containing and Output: // modified dataset post outlier detection and correction | |
| Step 1: 1 if then 2 ; 3 else 4 ; 5 end if Step 2: 6 INITIALIZE to array [0]; 7 for each do 8 ; 9 end for Step 3: 10 INITIALIZE to array [0]; 11 INITIALIZE to array [0]; 12 for each do 13 if then 14 ; 15 else 16 ; 17 end if 18 end for Step 4: 19 Function calculation 20 Sort ; 21 Let first quartile (); 22 Let third quartile (); ; 23 ; 24 ; 25 if then 26 if then 27 ; 28 else 29 30 end if 31 Else 32 if then 33 ; 34 else 35 36 end if | 37 end if 38 return ; 39 end Function 40 calculation ; 41 calculation ; Step 5: 42 INITIALIZE to array [0]; 43 INITIALIZE to array [0]; 44 for each in do 45 if then 46 ‘yes’; 47 else 48 ‘no’; 49 end if 50 end for 51 for each in do 52 if then 53 ‘yes’; 54 else 55 ‘no’; 56 end if 57 end for Step 6: 58 for each in do 59 if ‘yes’ then 60 toggle; 61 end if 62 end for 63 for each in do 64 if ‘no’ then 65 toggle; 66 end if 67 end for 68 concat ; |
5. Experimental Results
6. Conclusions and Future Work
Author Contributions
Funding
Institutional Review Board Statement
Informed Consent Statement
Data Availability Statement
Acknowledgments
Conflicts of Interest
Appendix A

| Dataset | Accuracy | ||||
|---|---|---|---|---|---|
| Book | 1.181 | 55 | 9 | 46 | 0.973 |
| 1.141 | 74 | 17 | 57 | 0.978 | |
| 1.1 | 92 | 26 | 66 | 0.982 | |
| 1.0 | 297 | 87 | 210 | 0.967 | |
| 0.9 | 485 | 109 | 376 | 0.922 | |
| 0.8 | 1005 | 129 | 826 | 0.795 | |
| Electronics | 1.184 | 35 | 1 | 34 | 0.929 |
| 1.105 | 75 | 5 | 70 | 0.946 | |
| 1.1 | 86 | 8 | 78 | 0.951 | |
| 1.0 | 231 | 154 | 231 | 0.991 | |
| 0.9 | 573 | 298 | 275 | 0.853 | |
| 0.8 | 1178 | 435 | 743 | 0.61 | |
| Entertainment | 1.747 | 15 | 1 | 14 | 0.886 |
| 1.7 | 17 | 2 | 15 | 0.887 | |
| 1.6 | 26 | 4 | 22 | 0.89 | |
| 1.5 | 40 | 9 | 31 | 0.894 | |
| 1.478 | 43 | 9 | 34 | 0.895 | |
| 1.4 | 65 | 13 | 52 | 0.902 | |
| 1.3 | 94 | 15 | 79 | 0.911 | |
| 1.2 | 147 | 21 | 126 | 0.926 | |
| 1.1 | 257 | 46 | 211 | 0.96 | |
| 1.0 | 705 | 351 | 354 | 0.903 | |
| 0.9 | 937 | 454 | 483 | 0.832 | |
| 0.8 | 1224 | 590 | 634 | 0.745 | |
| Grocery | 1.6 | 25 | 1 | 24 | 0.924 |
| 1.5 | 32 | 2 | 30 | 0.926 | |
| 1.4 | 45 | 4 | 41 | 0.93 | |
| 1.355 | 54 | 4 | 50 | 0.933 | |
| 1.3 | 71 | 10 | 61 | 0.937 | |
| 1.2 | 102 | 17 | 85 | 0.947 | |
| 1.1 | 162 | 35 | 127 | 0.964 | |
| 1.0 | 604 | 245 | 359 | 0.905 | |
| 0.9 | 774 | 301 | 473 | 0.855 | |
| 0.8 | 1061 | 354 | 707 | 0.771 | |
| Health Care | 1.365 | 26 | 3 | 23 | 0.938 |
| 1.345 | 28 | 3 | 25 | 0.939 | |
| 1.3 | 33 | 7 | 26 | 0.941 | |
| 1.2 | 76 | 12 | 64 | 0.954 | |
| 1.1 | 119 | 17 | 102 | 0.969 | |
| 1.0 | 400 | 183 | 217 | 0.937 | |
| 0.9 | 672 | 291 | 381 | 0.847 | |
| 0.8 | 1075 | 408 | 667 | 0.713 | |
| Personal Care | 1.687 | 17 | 1 | 16 | 0.934 |
| 1.6 | 21 | 1 | 20 | 0.935 | |
| 1.5 | 45 | 3 | 42 | 0.942 | |
| 1.425 | 50 | 3 | 47 | 0.945 | |
| 1.4 | 60 | 9 | 51 | 0.947 | |
| 1.3 | 78 | 9 | 69 | 0.953 | |
| 1.2 | 100 | 16 | 84 | 0.96 | |
| 1.1 | 161 | 43 | 118 | 0.979 | |
| 1.0 | 671 | 233 | 438 | 0.861 | |
| 0.9 | 801 | 295 | 506 | 0.82 | |
| 0.8 | 1039 | 375 | 664 | 0.745 | |
| Pharmaceutical | 1.75 | 13 | 1 | 12 | 0.896 |
| 1.7 | 14 | 1 | 13 | 0.897 | |
| 1.6 | 28 | 4 | 14 | 0.901 | |
| 1.5 | 38 | 7 | 31 | 0.903 | |
| 1.4 | 48 | 15 | 33 | 0.906 | |
| 1.3 | 77 | 28 | 49 | 0.914 | |
| 1.2 | 130 | 57 | 73 | 0.929 | |
| 1.1 | 242 | 114 | 128 | 0.961 | |
| 1.0 | 1203 | 146 | 1057 | 0.769 | |
| 0.9 | 1459 | 177 | 1282 | 0.697 | |
| 0.8 | 1744 | 207 | 1616 | 0.595 |
| Dataset | Accuracy | ||||
|---|---|---|---|---|---|
| Book | 1.174 | 5 | 1 | 4 | 0.981 |
| 1.138 | 6 | 1 | 5 | 0.986 | |
| 1.1 | 6 | 1 | 5 | 0.986 | |
| 1.0 | 14 | 6 | 8 | 0.977 | |
| 0.9 | 26 | 8 | 18 | 0.922 | |
| 0.8 | 49 | 12 | 37 | 0.817 | |
| Electronics | 1.194 | 9 | 2 | 7 | 0.928 |
| 1.114 | 21 | 2 | 19 | 0.939 | |
| 1.1 | 23 | 4 | 19 | 0.941 | |
| 1.0 | 94 | 27 | 67 | 0.991 | |
| 0.9 | 260 | 122 | 138 | 0.835 | |
| 0.8 | 522 | 205 | 317 | 0.588 | |
| Entertainment | 1.587 | 1 | 0 | 1 | 0.872 |
| 1.5 | 4 | 0 | 5 | 0.881 | |
| 1.4 | 5 | 0 | 5 | 0.884 | |
| 1.365 | 5 | 0 | 5 | 0.884 | |
| 1.3 | 13 | 0 | 13 | 0.908 | |
| 1.2 | 19 | 0 | 19 | 0.926 | |
| 1.1 | 30 | 1 | 29 | 0.958 | |
| 1.0 | 73 | 18 | 55 | 0.914 | |
| 0.9 | 95 | 33 | 62 | 0.849 | |
| 0.8 | 127 | 52 | 75 | 0.754 | |
| Grocery | 1.568 | 4 | 0 | 4 | 0.918 |
| 1.5 | 7 | 0 | 7 | 0.922 | |
| 1.4 | 12 | 1 | 11 | 0.929 | |
| 1.326 | 14 | 1 | 13 | 0.932 | |
| 1.3 | 15 | 1 | 14 | 0.934 | |
| 1.2 | 22 | 6 | 16 | 0.944 | |
| 1.1 | 39 | 10 | 29 | 0.969 | |
| 1.0 | 115 | 62 | 53 | 0.919 | |
| 0.9 | 148 | 69 | 79 | 0.871 | |
| 0.8 | 198 | 82 | 116 | 0.797 | |
| Health Care | 1.312 | 9 | 1 | 8 | 0.927 |
| 1.269 | 13 | 1 | 12 | 0.931 | |
| 1.2 | 21 | 2 | 19 | 0.94 | |
| 1.1 | 44 | 9 | 35 | 0.965 | |
| 1.0 | 133 | 54 | 79 | 0.936 | |
| 0.9 | 214 | 93 | 121 | 0.847 | |
| 0.8 | 361 | 125 | 236 | 0.685 | |
| Personal Care | 1.69 | 7 | 0 | 7 | 0.943 |
| 1.6 | 7 | 0 | 7 | 0.943 | |
| 1.5 | 13 | 2 | 11 | 0.95 | |
| 1.429 | 14 | 2 | 12 | 0.952 | |
| 1.4 | 15 | 2 | 13 | 0.953 | |
| 1.3 | 18 | 3 | 15 | 0.956 | |
| 1.2 | 25 | 4 | 21 | 0.964 | |
| 1.1 | 41 | 6 | 35 | 0.983 | |
| 1.0 | 184 | 123 | 61 | 0.849 | |
| 0.9 | 213 | 147 | 66 | 0.815 | |
| 0.8 | 264 | 187 | 77 | 0.755 | |
| Pharmaceutical | 1.75 | 1 | 0 | 1 | 0.894 |
| 1.7 | 2 | 0 | 2 | 0.896 | |
| 1.6 | 4 | 1 | 3 | 0.898 | |
| 1.5 | 5 | 1 | 4 | 0.9 | |
| 1.4 | 8 | 3 | 5 | 0.903 | |
| 1.3 | 13 | 4 | 9 | 0.91 | |
| 1.2 | 26 | 9 | 17 | 0.927 | |
| 1.1 | 44 | 17 | 27 | 0.951 | |
| 1.0 | 243 | 139 | 104 | 0.79 | |
| 0.9 | 290 | 153 | 137 | 0.729 | |
| 0.8 | 383 | 161 | 222 | 0.609 |
| Dataset | Accuracy | ||||
|---|---|---|---|---|---|
| Book | 0.834 | 2 | 1 | 1 | 0.951 |
| 0.9 | 3 | 1 | 2 | 0.967 | |
| 1.0 | 6 | 1 | 5 | 0.983 | |
| 1.006 | 6 | 1 | 5 | 0.983 | |
| 1.1 | 9 | 4 | 5 | 0.935 | |
| 1.2 | 16 | 10 | 6 | 0.822 | |
| Electronics | 0.817 | 8 | 1 | 7 | 0.933 |
| 0.9 | 24 | 6 | 18 | 0.953 | |
| 0.993 | 59 | 8 | 51 | 0.997 | |
| 1.0 | 65 | 11 | 54 | 0.994 | |
| 1.1 | 179 | 79 | 100 | 0.851 | |
| 1.2 | 376 | 210 | 166 | 0.604 | |
| Entertainment | 0.279 | 4 | 0 | 4 | 0.87 |
| 0.3 | 4 | 0 | 4 | 0.87 | |
| 0.4 | 5 | 0 | 5 | 0.872 | |
| 0.5 | 8 | 0 | 8 | 0.876 | |
| 0.530 | 9 | 0 | 9 | 0.878 | |
| 0.6 | 14 | 1 | 13 | 0.886 | |
| 0.7 | 16 | 1 | 15 | 0.889 | |
| 0.8 | 29 | 3 | 26 | 0.909 | |
| 0.9 | 46 | 7 | 39 | 0.936 | |
| 1.0 | 146 | 65 | 81 | 0.907 | |
| 1.1 | 210 | 90 | 120 | 0.808 | |
| 1.2 | 279 | 143 | 136 | 0.7 | |
| Grocery | 0.572 | 1 | 1 | 0 | 0.902 |
| 0.6 | 1 | 1 | 0 | 0.902 | |
| 0.7 | 2 | 1 | 1 | 0.91 | |
| 0.771 | 4 | 1 | 3 | 0.925 | |
| 0.8 | 5 | 2 | 3 | 0.932 | |
| 0.9 | 10 | 4 | 6 | 0.97 | |
| 1.0 | 21 | 12 | 9 | 0.947 | |
| 1.1 | 29 | 18 | 11 | 0.888 | |
| 1.2 | 40 | 26 | 14 | 0.805 | |
| Health Care | 0.615 | 4 | 1 | 3 | 0.889 |
| 0.7 | 5 | 1 | 4 | 0.893 | |
| 0.8 | 9 | 1 | 8 | 0.908 | |
| 0.812 | 9 | 1 | 8 | 0.908 | |
| 0.9 | 18 | 7 | 11 | 0.942 | |
| 1.0 | 51 | 24 | 27 | 0.931 | |
| 1.1 | 68 | 32 | 36 | 0.866 | |
| 1.2 | 113 | 66 | 47 | 0.695 | |
| Personal Care | 0.241 | 2 | 0 | 2 | 0.902 |
| 0.3 | 2 | 0 | 2 | 0.902 | |
| 0.4 | 2 | 0 | 2 | 0.902 | |
| 0.5 | 3 | 0 | 3 | 0.907 | |
| 0.53 | 3 | 0 | 3 | 0.907 | |
| 0.6 | 7 | 1 | 6 | 0.929 | |
| 0.7 | 9 | 2 | 7 | 0.94 | |
| 0.8 | 12 | 2 | 10 | 0.956 | |
| 0.9 | 16 | 5 | 11 | 0.978 | |
| 1.0 | 40 | 18 | 22 | 0.891 | |
| 1.1 | 46 | 22 | 24 | 0.858 | |
| 1.2 | 59 | 33 | 26 | 0.788 | |
| Pharmaceutical | 0.482 | 1 | 0 | 1 | 0.893 |
| 0.5 | 1 | 0 | 1 | 0.893 | |
| 0.6 | 1 | 0 | 1 | 0.893 | |
| 0.7 | 1 | 0 | 1 | 0.893 | |
| 0.701 | 1 | 0 | 1 | 0.893 | |
| 0.8 | 2 | 1 | 1 | 0.904 | |
| 0.9 | 8 | 3 | 5 | 0.989 | |
| 1.0 | 37 | 25 | 12 | 0.723 | |
| 1.1 | 44 | 31 | 13 | 0.648 | |
| 1.2 | 62 | 46 | 16 | 0.457 |
| Dataset | Accuracy | ||||
|---|---|---|---|---|---|
| Book | 0.793 | 1 | 0 | 1 | 0.978 |
| 0.9 | 2 | 0 | 2 | 1 | |
| 0.9706 | 2 | 0 | 2 | 1 | |
| 1.0 | 4 | 1 | 3 | 0.956 | |
| 1.1 | 7 | 3 | 4 | 0.891 | |
| 1.2 | 17 | 10 | 7 | 0.673 | |
| Electronics | 0.827 | 5 | 1 | 4 | 0.933 |
| 0.9 | 11 | 3 | 8 | 0.955 | |
| 1.0 | 21 | 5 | 16 | 0.992 | |
| 1.001 | 25 | 6 | 19 | 0.993 | |
| 1.1 | 61 | 22 | 39 | 0.859 | |
| 1.2 | 124 | 65 | 59 | 0.627 | |
| Entertainment | 0.346 | 1 | 0 | 1 | 0.82 |
| 0.4 | 1 | 0 | 1 | 0.82 | |
| 0.5 | 1 | 0 | 1 | 0.82 | |
| 0.566 | 2 | 0 | 2 | 0.825 | |
| 0.6 | 2 | 0 | 2 | 0.825 | |
| 0.7 | 2 | 0 | 2 | 0.825 | |
| 0.8 | 8 | 1 | 7 | 0.855 | |
| 0.9 | 23 | 3 | 20 | 0.93 | |
| 1.0 | 50 | 13 | 37 | 0.935 | |
| 1.1 | 68 | 18 | 50 | 0.845 | |
| 1.2 | 95 | 31 | 64 | 0.71 | |
| Grocery | 0.342 | 1 | 0 | 1 | 0.894 |
| 0.4 | 2 | 1 | 1 | 0.903 | |
| 0.5 | 2 | 1 | 1 | 0.903 | |
| 0.585 | 2 | 1 | 1 | 0.903 | |
| 0.6 | 3 | 2 | 1 | 0.913 | |
| 0.7 | 4 | 2 | 2 | 0.923 | |
| 0.8 | 7 | 2 | 5 | 0.951 | |
| 0.9 | 8 | 2 | 6 | 0.961 | |
| 1.0 | 22 | 7 | 15 | 0.903 | |
| 1.1 | 29 | 12 | 17 | 0.836 | |
| 1.2 | 38 | 17 | 21 | 0.75 | |
| Health Care | 0.599 | 1 | 0 | 1 | 0.887 |
| 0.7 | 2 | 0 | 2 | 0.892 | |
| 0.798 | 6 | 0 | 6 | 0.913 | |
| 0.8 | 7 | 1 | 6 | 0.918 | |
| 0.9 | 13 | 4 | 9 | 0.948 | |
| 1.0 | 41 | 20 | 21 | 0.908 | |
| 1.1 | 58 | 29 | 29 | 0.821 | |
| 1.2 | 91 | 55 | 36 | 0.653 | |
| Personal Care | 0.512 | 1 | 0 | 1 | 0.947 |
| 0.6 | 1 | 0 | 1 | 0.947 | |
| 0.7 | 1 | 0 | 1 | 0.947 | |
| 0.734 | 1 | 0 | 1 | 0.947 | |
| 0.8 | 1 | 0 | 1 | 0.947 | |
| 0.9 | 4 | 0 | 4 | 0.973 | |
| 1.0 | 21 | 9 | 12 | 0.877 | |
| 1.1 | 24 | 10 | 14 | 0.85 | |
| 1.2 | 32 | 16 | 16 | 0.78 | |
| Pharmaceutical | 0.25 | 0 | 0 | 0 | 0.862 |
| 0.3 | 0 | 0 | 0 | 0.862 | |
| 0.4 | 0 | 0 | 0 | 0.862 | |
| 0.5 | 0 | 0 | 0 | 0.862 | |
| 0.6 | 0 | 0 | 0 | 0.862 | |
| 0.7 | 0 | 0 | 0 | 0.862 | |
| 0.8 | 0 | 0 | 0 | 0.862 | |
| 0.9 | 6 | 5 | 1 | 0.980 | |
| 1.0 | 18 | 15 | 3 | 0.784 | |
| 1.1 | 22 | 19 | 3 | 0.705 | |
| 1.2 | 23 | 20 | 3 | 0.588 |
| Dataset | Accuracy | ||||
|---|---|---|---|---|---|
| Book | 0.706 | 10 | 2 | 8 | 0.931 |
| 0.8 | 24 | 4 | 20 | 0.956 | |
| 0.9 | 32 | 5 | 27 | 0.97 | |
| 0.914 | 33 | 5 | 28 | 0.972 | |
| 1.0 | 72 | 25 | 47 | 0.959 | |
| 1.1 | 110 | 55 | 55 | 0.892 | |
| 1.2 | 190 | 123 | 67 | 0.752 | |
| Electronics | 0.809 | 2 | 1 | 1 | 0.929 |
| 0.9 | 13 | 1 | 12 | 0.958 | |
| 0.987 | 25 | 5 | 20 | 0.989 | |
| 1.0 | 31 | 6 | 25 | 0.994 | |
| 1.1 | 89 | 30 | 59 | 0.844 | |
| 1.2 | 202 | 106 | 96 | 0.55 | |
| Entertainment | 0.309 | 2 | 0 | 2 | 0.838 |
| 0.4 | 3 | 1 | 2 | 0.84 | |
| 0.5 | 5 | 1 | 4 | 0.846 | |
| 0.545 | 6 | 1 | 5 | 0.851 | |
| 0.6 | 10 | 1 | 9 | 0.853 | |
| 0.7 | 16 | 1 | 15 | 0.865 | |
| 0.8 | 25 | 2 | 23 | 0.882 | |
| 0.9 | 48 | 7 | 41 | 0.925 | |
| 1.0 | 127 | 47 | 80 | 0.926 | |
| 1.1 | 185 | 64 | 121 | 0.818 | |
| 1.2 | 262 | 108 | 154 | 0.674 | |
| Grocery | 0.357 | 2 | 0 | 2 | 0.933 |
| 0.4 | 2 | 0 | 2 | 0.933 | |
| 0.5 | 6 | 3 | 3 | 0.939 | |
| 0.6 | 7 | 3 | 4 | 0.94 | |
| 0.606 | 8 | 3 | 5 | 0.942 | |
| 0.7 | 9 | 5 | 4 | 0.943 | |
| 0.8 | 13 | 6 | 7 | 0.949 | |
| 0.9 | 32 | 11 | 21 | 0.977 | |
| 1.0 | 121 | 77 | 44 | 0.89 | |
| 1.1 | 168 | 110 | 58 | 0.821 | |
| 1.2 | 229 | 153 | 76 | 0.731 | |
| Health Care | 0.608 | 5 | 2 | 3 | 0.933 |
| 0.7 | 8 | 3 | 5 | 0.938 | |
| 0.795 | 14 | 4 | 10 | 0.948 | |
| 0.8 | 14 | 4 | 10 | 0.948 | |
| 0.9 | 28 | 8 | 20 | 0.97 | |
| 1.0 | 92 | 46 | 46 | 0.925 | |
| 1.1 | 147 | 77 | 70 | 0.836 | |
| 1.2 | 244 | 148 | 96 | 0.679 | |
| Personal Care | 0.312 | 5 | 0 | 5 | 0.922 |
| 0.4 | 7 | 0 | 7 | 0.925 | |
| 0.5 | 11 | 0 | 11 | 0.931 | |
| 0.575 | 12 | 0 | 12 | 0.933 | |
| 0.6 | 13 | 1 | 12 | 0.933 | |
| 0.7 | 17 | 3 | 14 | 0.94 | |
| 0.8 | 24 | 3 | 21 | 0.951 | |
| 0.9 | 37 | 8 | 29 | 0.971 | |
| 1.0 | 137 | 86 | 51 | 0.876 | |
| 1.1 | 167 | 105 | 62 | 0.831 | |
| 1.2 | 231 | 156 | 75 | 0.733 | |
| Pharmaceutical | 0.35 | 2 | 0 | 2 | 0.874 |
| 0.4 | 2 | 0 | 2 | 0.874 | |
| 0.5 | 3 | 1 | 2 | 0.876 | |
| 0.566 | 3 | 1 | 2 | 0.876 | |
| 0.6 | 5 | 3 | 2 | 0.88 | |
| 0.7 | 11 | 6 | 5 | 0.891 | |
| 0.8 | 22 | 16 | 6 | 0.913 | |
| 0.9 | 42 | 31 | 11 | 0.951 | |
| 1.0 | 166 | 135 | 31 | 0.808 | |
| 1.1 | 211 | 172 | 39 | 0.722 | |
| 1.2 | 280 | 236 | 44 | 0.588 |
References
- Garcia-Diaz, V.; Espada, J.P.; Crespo, R.G.; G-Bustelo, B.C.P.; Lovelle, J.M.C. An approach to improve the accuracy of probabilistic classifiers for decision support systems in sentiment analysis. Appl. Soft Comput. 2018, 67, 822–833. [Google Scholar] [CrossRef]
- Oyebode, O.; Alqahtani, F.; Orji, R. Using Machine Learning and Thematic Analysis Methods to Evaluate Mental Health Apps Based on User Reviews. IEEE Access 2020, 8, 111141–111158. [Google Scholar] [CrossRef]
- Afzaal, M.; Usman, M.; Fong, A. Tourism Mobile App with Aspect-Based Sentiment Classification Framework for Tourist Reviews. IEEE Trans. Consum. Electron. 2019, 65, 233–242. [Google Scholar] [CrossRef]
- Li, W.; Xu, B. Aspect-Based Fashion Recommendation with Attention Mechanism. IEEE Access 2020, 8, 141814–141823. [Google Scholar] [CrossRef]
- Chenaghlou, M. Data Stream Clustering and Anomaly Detection. Ph.D. Thesis, The Univerisity of Melbourne, Parkville, Australia, 2019. [Google Scholar]
- Wang, H.; Bah, M.J.; Hammad, M. Progress in Outlier Detection Techniques: A Survey. IEEE Access 2019, 7, 107964–108000. [Google Scholar] [CrossRef]
- de la Torre-Abaitua, G.; Lago-Fernández, L.F.; Arroyo, D. A compression-based method for detecting anomalies in textual data. Entropy 2021, 23, 618. [Google Scholar] [CrossRef]
- Iglesias, C.A.; Moreno, A. Sentiment Analysis for social media. Appl. Sci. 2019, 9, 5037. [Google Scholar] [CrossRef] [Green Version]
- Chakraborty, K.; Bhattacharyya, S.; Bag, R. A Survey of Sentiment Analysis from Social Media Data. IEEE Trans. Comput. Soc. Syst. 2020, 7, 450–464. [Google Scholar] [CrossRef]
- Hou, Q.; Han, M.; Cai, Z. Survey on data analysis in social media: A practical application aspect. Big Data Min. Anal. 2020, 3, 259–279. [Google Scholar] [CrossRef]
- Nazir, A.; Rao, Y.; Wu, L.; Sun, L. Issues and Challenges of Aspect-based Sentiment Analysis: A Comprehensive Survey. IEEE Trans. Affect. Comput. 2020. [Google Scholar] [CrossRef]
- Hu, T.; She, B.; Duan, L.; Yue, H.; Clunis, J. A Systematic Spatial and Temporal Sentiment Analysis on Geo-Tweets. IEEE Access 2019, 8, 8658–8667. [Google Scholar] [CrossRef]
- Park, J. Framework for Sentiment-Driven Evaluation of Customer Satisfaction with Cosmetics Brands. IEEE Access 2020, 8, 98526–98538. [Google Scholar] [CrossRef]
- Hu, S.; Kumar, A.; Al-Turjman, F.; Gupta, S.; Seth, S. Shubham Reviewer Credibility and Sentiment Analysis Based User Profile Modelling for Online Product Recommendation. IEEE Access 2020, 8, 26172–26189. [Google Scholar] [CrossRef]
- Li, M.; Ma, Y.; Cao, P. Revealing Customer Satisfaction with Hotels Through Multi-Site Online Reviews: A Method Based on the Evidence Theory. IEEE Access 2020, 8, 225226–225239. [Google Scholar] [CrossRef]
- Jerripothula, K.R.; Rai, A.; Garg, K.; Rautela, Y.S. Feature-Level Rating System Using Customer Reviews and Review Votes. IEEE Trans. Comput. Soc. Syst. 2020, 7, 1210–1219. [Google Scholar] [CrossRef]
- Ali, S.; Wang, G.; Riaz, S. Aspect Based Sentiment Analysis of Ridesharing Platform Reviews for Kansei Engineering. IEEE Access 2020, 8, 173186–173196. [Google Scholar] [CrossRef]
- Zhang, B.; Li, X.; Xu, X.; Leung, K.-C.; Chen, Z.; Ye, Y. Knowledge Guided Capsule Attention Network for Aspect-Based Sentiment Analysis. IEEE/ACM Trans. Audio Speech Lang. Process. 2020, 28, 2538–2551. [Google Scholar] [CrossRef]
- Liu, H.; Chatterjee, I.; Zhou, M.; Lu, X.S.; Abusorrah, A. Aspect-Based Sentiment Analysis: A Survey of Deep Learning Methods. IEEE Trans. Comput. Soc. Syst. 2020, 7, 1358–1375. [Google Scholar] [CrossRef]
- Benlahbib, A.; Nfaoui, E.H. Aggregating Customer Review Attributes for Online Reputation Generation. IEEE Access 2020, 8, 96550–96564. [Google Scholar] [CrossRef]
- Almaghrabi, M.; Chetty, G. Improving Sentiment Analysis in Arabic and English Languages by Using Multi-Layer Perceptron Model (MLP). In Proceedings of the 2020 IEEE 7th International Conference on Data Science and Advanced Analytics (DSAA), Sydney, Australia, 6–9 October 2020; pp. 745–746. [Google Scholar]
- Basiri, M.E.; Abdar, M.; Kabiri, A.; Nemati, S.; Zhou, X.; Allahbakhshi, F.; Yen, N.Y. Improving Sentiment Polarity Detection Through Target Identification. IEEE Trans. Comput. Soc. Syst. 2020, 7, 113–128. [Google Scholar] [CrossRef]
- Younas, A.; Nasim, R.; Ali, S.; Wang, G.; Qi, F. Sentiment Analysis of Code-Mixed Roman Urdu-English Social Media Text using Deep Learning Approaches. In Proceedings of the 2020 IEEE 23rd International Conference on Computational Science and Engineering (CSE), Guangzhou, China, 29 December 2020—1 January 2021; pp. 66–71. [Google Scholar]
- Yadav, V.; Verma, P.; Katiyar, V. E-Commerce Product Reviews Using Aspect Based Hindi Sentiment Analysis. In Proceedings of the 2021 International Conference on Computer Communication and Informatics (ICCCI), Coimbatore, India, 27–29 January 2021; pp. 1–8. [Google Scholar]
- Yaqub, U.; Malik, M.A.; Zaman, S. Sentiment Analysis of Russian IRA Troll Messages on Twitter during US Presidential Elections of 2016. In Proceedings of the 2020 7th International Conference on Behavioural and Social Computing (BESC), Bournemouth, UK, 5–7 November 2020; pp. 1–6. [Google Scholar]
- Li, G.; Zheng, Q.; Zhang, L.; Guo, S.; Niu, L. Sentiment Infomation based Model for Chinese text Sentiment Analysis. In Proceedings of the 2020 IEEE 3rd International Conference on Automation, Electronics and Electrical Engineering (AUTEEE), Shenyang, China, 20–22 November 2020; pp. 366–371. [Google Scholar]
- Saputra, F.T.; Wijaya, S.H.; Nurhadryani, Y. Defina Lexicon Addition Effect on Lexicon-Based of Indonesian Sentiment Analysis on Twitter. In Proceedings of the 2020 International Conference on Informatics, Multimedia, Cyber and Information System (ICIMCIS), Jakarta, Indonesia, 19–20 November 2020; pp. 136–141. [Google Scholar]
- García-Mendoza, C.V.; Gambino, O.J.; Villarreal-Cervantes, M.G.; Calvo, H. Evolutionary Optimization of Ensemble Learning to Determine Sentiment Polarity in an Unbalanced Multiclass Corpus. Entropy 2020, 22, 1020. [Google Scholar] [CrossRef] [PubMed]
- Wang, Y.; Chen, Q.; Ahmed, M.; Li, Z.; Pan, W.; Liu, H. Joint Inference for Aspect-level Sentiment Analysis by Deep Neural Networks and Linguistic Hints. IEEE Trans. Knowl. Data Eng. 2021, 33, 2002–2014. [Google Scholar] [CrossRef]
- Jadon, P.; Bhatia, D.; Mishra, D.K. A BigData approach for sentiment analysis of twitter data using Naive Bayes and SVM Algorithm. In Proceedings of the 2019 Sixteenth International Conference on Wireless and Optical Communication Networks (WOCN), Bhopal, India, 19–21 December 2019. [Google Scholar]
- Saranya, G.; Geetha, G.; Meenakshi, K.; Karpagaselvi, S. Sentiment analysis of healthcare Tweets using SVM Classifier. In Proceedings of the 2020 International Conference on Power, Energy, Control and Transmission Systems (ICPECT), Chennai, India, 29–30 April 2020; pp. 1–3. [Google Scholar]
- Zhang, B.; Xu, D.; Zhang, H.; Li, M. STCS Lexicon: Spectral-Clustering-Based Topic-Specific Chinese Sentiment Lexicon Construction for Social Networks. IEEE Trans. Comput. Soc. Syst. 2019, 6, 1180–1189. [Google Scholar] [CrossRef]
- Singh, J.; Tripathi, P. Sentiment analysis of Twitter data by making use of SVM, Random Forest and Decision Tree algorithm; Sentiment analysis of Twitter data by making use of SVM, Random Forest and Decision Tree algorithm. In Proceedings of the 10th IEEE International Conference on Communication Systems and Network Technologies (CSNT), Bhopal, India, 18–19 June 2021. [Google Scholar] [CrossRef]
- Wang, L.; Niu, J.; Yu, S. SentiDiff: Combining Textual Information and Sentiment Diffusion Patterns for Twitter Sentiment Analysis. IEEE Trans. Knowl. Data Eng. 2020, 32, 2026–2039. [Google Scholar] [CrossRef]
- Shofiya, C.; Abidi, S. Sentiment Analysis on COVID-19-Related Social Distancing in Canada Using Twitter Data. Int. J. Environ. Res. Public Health 2021, 18, 5993. [Google Scholar] [CrossRef] [PubMed]
- Zhang, Y.; Xu, B.; Zhao, T. Convolutional multi-head self-attention on memory for aspect sentiment classification. IEEE/CAA J. Autom. Sin. 2020, 7, 1038–1044. [Google Scholar] [CrossRef]
- Abdalgader, K.; Al Shibli, A. Experimental Results on Customer Reviews Using Lexicon-Based Word Polarity Identification Method. IEEE Access 2020, 8, 179955–179969. [Google Scholar] [CrossRef]
- Chen, H.; Zhang, X.; Du, S.; Wu, Z.; Zheng, N. A correntropy-based affine iterative closest point algorithm for robust point set registration. IEEE/CAA J. Autom. Sin. 2019, 6, 981–991. [Google Scholar] [CrossRef]
- Shanmugam, M.; Agawane, A.; Tiwari, A.; Deolekar, R.V. Twitter Sentiment Analysis using Novelty Detection. In Proceedings of the 2020 Third International Conference on Smart Systems and Inventive Technology (ICSSIT), Tirunelveli, India, 20–22 August 2020; pp. 1258–1263. [Google Scholar]
- Schmitt, M.F.L.; Spinosa, E.J. Outlier Detection on Semantic Space for Sentiment Analysis with Convolutional Neural Networks. In Proceedings of the 2018 International Joint Conference on Neural Networks (IJCNN), Rio de Janeiro, Brazil, 8–13 July 2018; pp. 1–8. [Google Scholar]
- Kim, J.; Park, M.; Kim, H.; Cho, S.; Kang, P. Insider threat detection based on user behavior modeling and Anomaly Detection Algorithms. Appl. Sci. 2019, 9, 4018. [Google Scholar] [CrossRef] [Green Version]
- Neagu, B.C.; Grigoras, G.; Scarlatache, F. Outliers discovery from Smart Meters data using a statistical based data mining approach. In Proceedings of the 2017 10th International Symposium on Advanced Topics in Electrical Engineering (ATEE), Bucharest, Romania, 23–25 March 2017; pp. 555–558. [Google Scholar]
- Ahmed, I.; Dagnino, A.; Ding, Y. Unsupervised anomaly detection based on minimum spanning tree approximated distance measures and its application to hydropower turbines. IEEE Trans. Autom. Sci. Eng. 2019, 16, 654–667. [Google Scholar] [CrossRef]
- Cui, M.; Wang, J.; Florita, A.R.; Zhang, Y. Generalized Graph Laplacian Based Anomaly Detection for Spatiotemporal MicroPMU Data. IEEE Trans. Power Syst. 2019, 34, 3960–3963. [Google Scholar] [CrossRef]
- Verma, P.; Sinha, M.; Panda, S. Fuzzy c-Means Clustering-Based Novel Threshold Criteria for Outlier Detection in Electronic Nose. IEEE Sens. J. 2021, 21, 1975–1981. [Google Scholar] [CrossRef]
- Corain, M.; Garza, P.; Asudeh, A. DBSCOUT: A Density-based Method for Scalable Outlier Detection in Very Large Datasets. In Proceedings of the 2021 IEEE 37th International Conference on Data Engineering (ICDE), Chania, Greece, 19–22 April 2021; pp. 37–48. [Google Scholar]
- Sapegin, A.; Meinel, C. K-metamodes: Frequency-and ensemble-based distributed k-modes clustering for security analytics. In Proceedings of the 2020 19th IEEE International Conference on Machine Learning and Applications (ICMLA), Miami, FL, USA, 14–17 December 2020; pp. 344–351. [Google Scholar]
- Ghahramani, M.H.; Zhou, M.; Hon, C.T. Toward cloud computing QoS architecture: Analysis of cloud systems and cloud services. IEEE/CAA J. Autom. Sin. 2017, 4, 6–18. [Google Scholar] [CrossRef]
- Masters, K. 89% of Consumers Are More Likely to Buy Products from Amazon than Other E-Commerce Sites: Study. Forbes 20 March 2019. Available online: https://www.forbes.com/sites/kirimasters/2019/03/20/study-89-of-consumers-are-more-likely-to-buy-products-from-amazon-than-other-e-commerce-sites/?sh=273313e64af1 (accessed on 12 November 2021).
- Chatterjee, I. Amazon Customer Review. Harvard Dataverse. 2021. Available online: https://doi.org/10.7910/DVN/W96OFO (accessed on 29 November 2021).
- Hu, N.; Zhang, J.; Pavlou, P.A. Overcoming the J-shaped distribution of product reviews. Commun. ACM 2009, 52, 144–147. [Google Scholar] [CrossRef]
- Hussain, A.; Aleem, M. GoCJ: Google Cloud Jobs Dataset for Distributed and Cloud Computing Infrastructures. Data 2018, 3, 38. [Google Scholar] [CrossRef] [Green Version]
- Amazon Customer Reviews Dataset. Available online: https://s3.amazonaws.com/amazon-reviews-pds/readme.html (accessed on 12 November 2021).
- Release 0.16. Available online: https://buildmedia.readthedocs.org/media/pdf/textblob/latest/textblob.pdf (accessed on 18 October 2021).
- Riahi-Madvar, M.; Nasersharif, B.; Azirani, A.A. Subspace Outlier Detection in High Dimensional Data using Ensemble of PCA-based Subspaces. In Proceedings of the 2021 26th International Computer Conference, Computer Society of Iran (CSICC), Tehran, Iran, 3–4 March 2021; pp. 1–5. [Google Scholar]
- Studiawan, H.; Sohel, F.; Payne, C. Anomaly Detection in Operating System Logs with Deep Learning-based Sentiment Analysis. IEEE Trans. Dependable Secur. Comput. 2021, 18, 2136–2148. [Google Scholar] [CrossRef]
- Tian, R.; Ruan, K.; Li, L.; Le, J.; Greenberg, J.; Barbat, S. Standardized evaluation of camera-based driver state monitoring systems. IEEE/CAA J. Autom. Sin. 2019, 6, 716–732. [Google Scholar] [CrossRef]
- Tian, G.; Zhang, H.; Zhou, M.; Li, Z. AHP, Gray Correlation, and TOPSIS Combined Approach to Green Performance Evaluation of Design Alternatives. IEEE Trans. Syst. Man Cybern. Syst. 2018, 48, 1093–1105. [Google Scholar] [CrossRef]
- Feng, Y.; Zhou, M.; Tian, G.; Li, Z.; Zhang, Z.; Zhang, Q.; Tan, J. Target Disassembly Sequencing and Scheme Evaluation for CNC Machine Tools Using Improved Multiobjective Ant Colony Algorithm and Fuzzy Integral. IEEE Trans. Syst. Man Cybern. Syst. 2018, 49, 2438–2451. [Google Scholar] [CrossRef]
- Han, W.; Lu, X.S.; Zhou, M.; Shen, X.; Wang, J.; Xu, J. An Evaluation and Optimization Methodology for Efficient Power Plant Programs. IEEE Trans. Syst. Man Cybern. Syst. 2020, 50, 707–716. [Google Scholar] [CrossRef]
- Ghahramani, M.; Qiao, Y.; Zhou, M.; O Hagan, A.; Sweeney, J. AI-based modeling and data-driven evaluation for smart manufacturing processes. IEEE/CAA J. Autom. Sin. 2020, 7, 1026–1037. [Google Scholar] [CrossRef]
- Tian, G.; Hao, N.; Zhou, M.; Pedrycz, W.; Zhang, C.; Ma, F.; Li, Z. Fuzzy Grey Choquet Integral for Evaluation of Multicriteria Decision Making Problems with Interactive and Qualitative Indices. IEEE Trans. Syst. Man Cybern. Syst. 2020, 51, 1–14. [Google Scholar] [CrossRef]
- Luo, X.; Zhou, M.; Leung, H.; Xia, Y.; Zhu, Q.; You, Z.; Li, S. An Incremental-and-Static-Combined Scheme for Matrix-Factorization-Based Collaborative Filtering. IEEE Trans. Autom. Sci. Eng. 2016, 13, 333–343. [Google Scholar] [CrossRef]
- Shang, M.; Luo, X.; Liu, Z.; Chen, J.; Yuan, Y.; Zhou, M. Randomized latent factor model for high-dimensional and sparse matrices from industrial applications. IEEE/CAA J. Autom. Sin. 2019, 6, 131–141. [Google Scholar] [CrossRef]


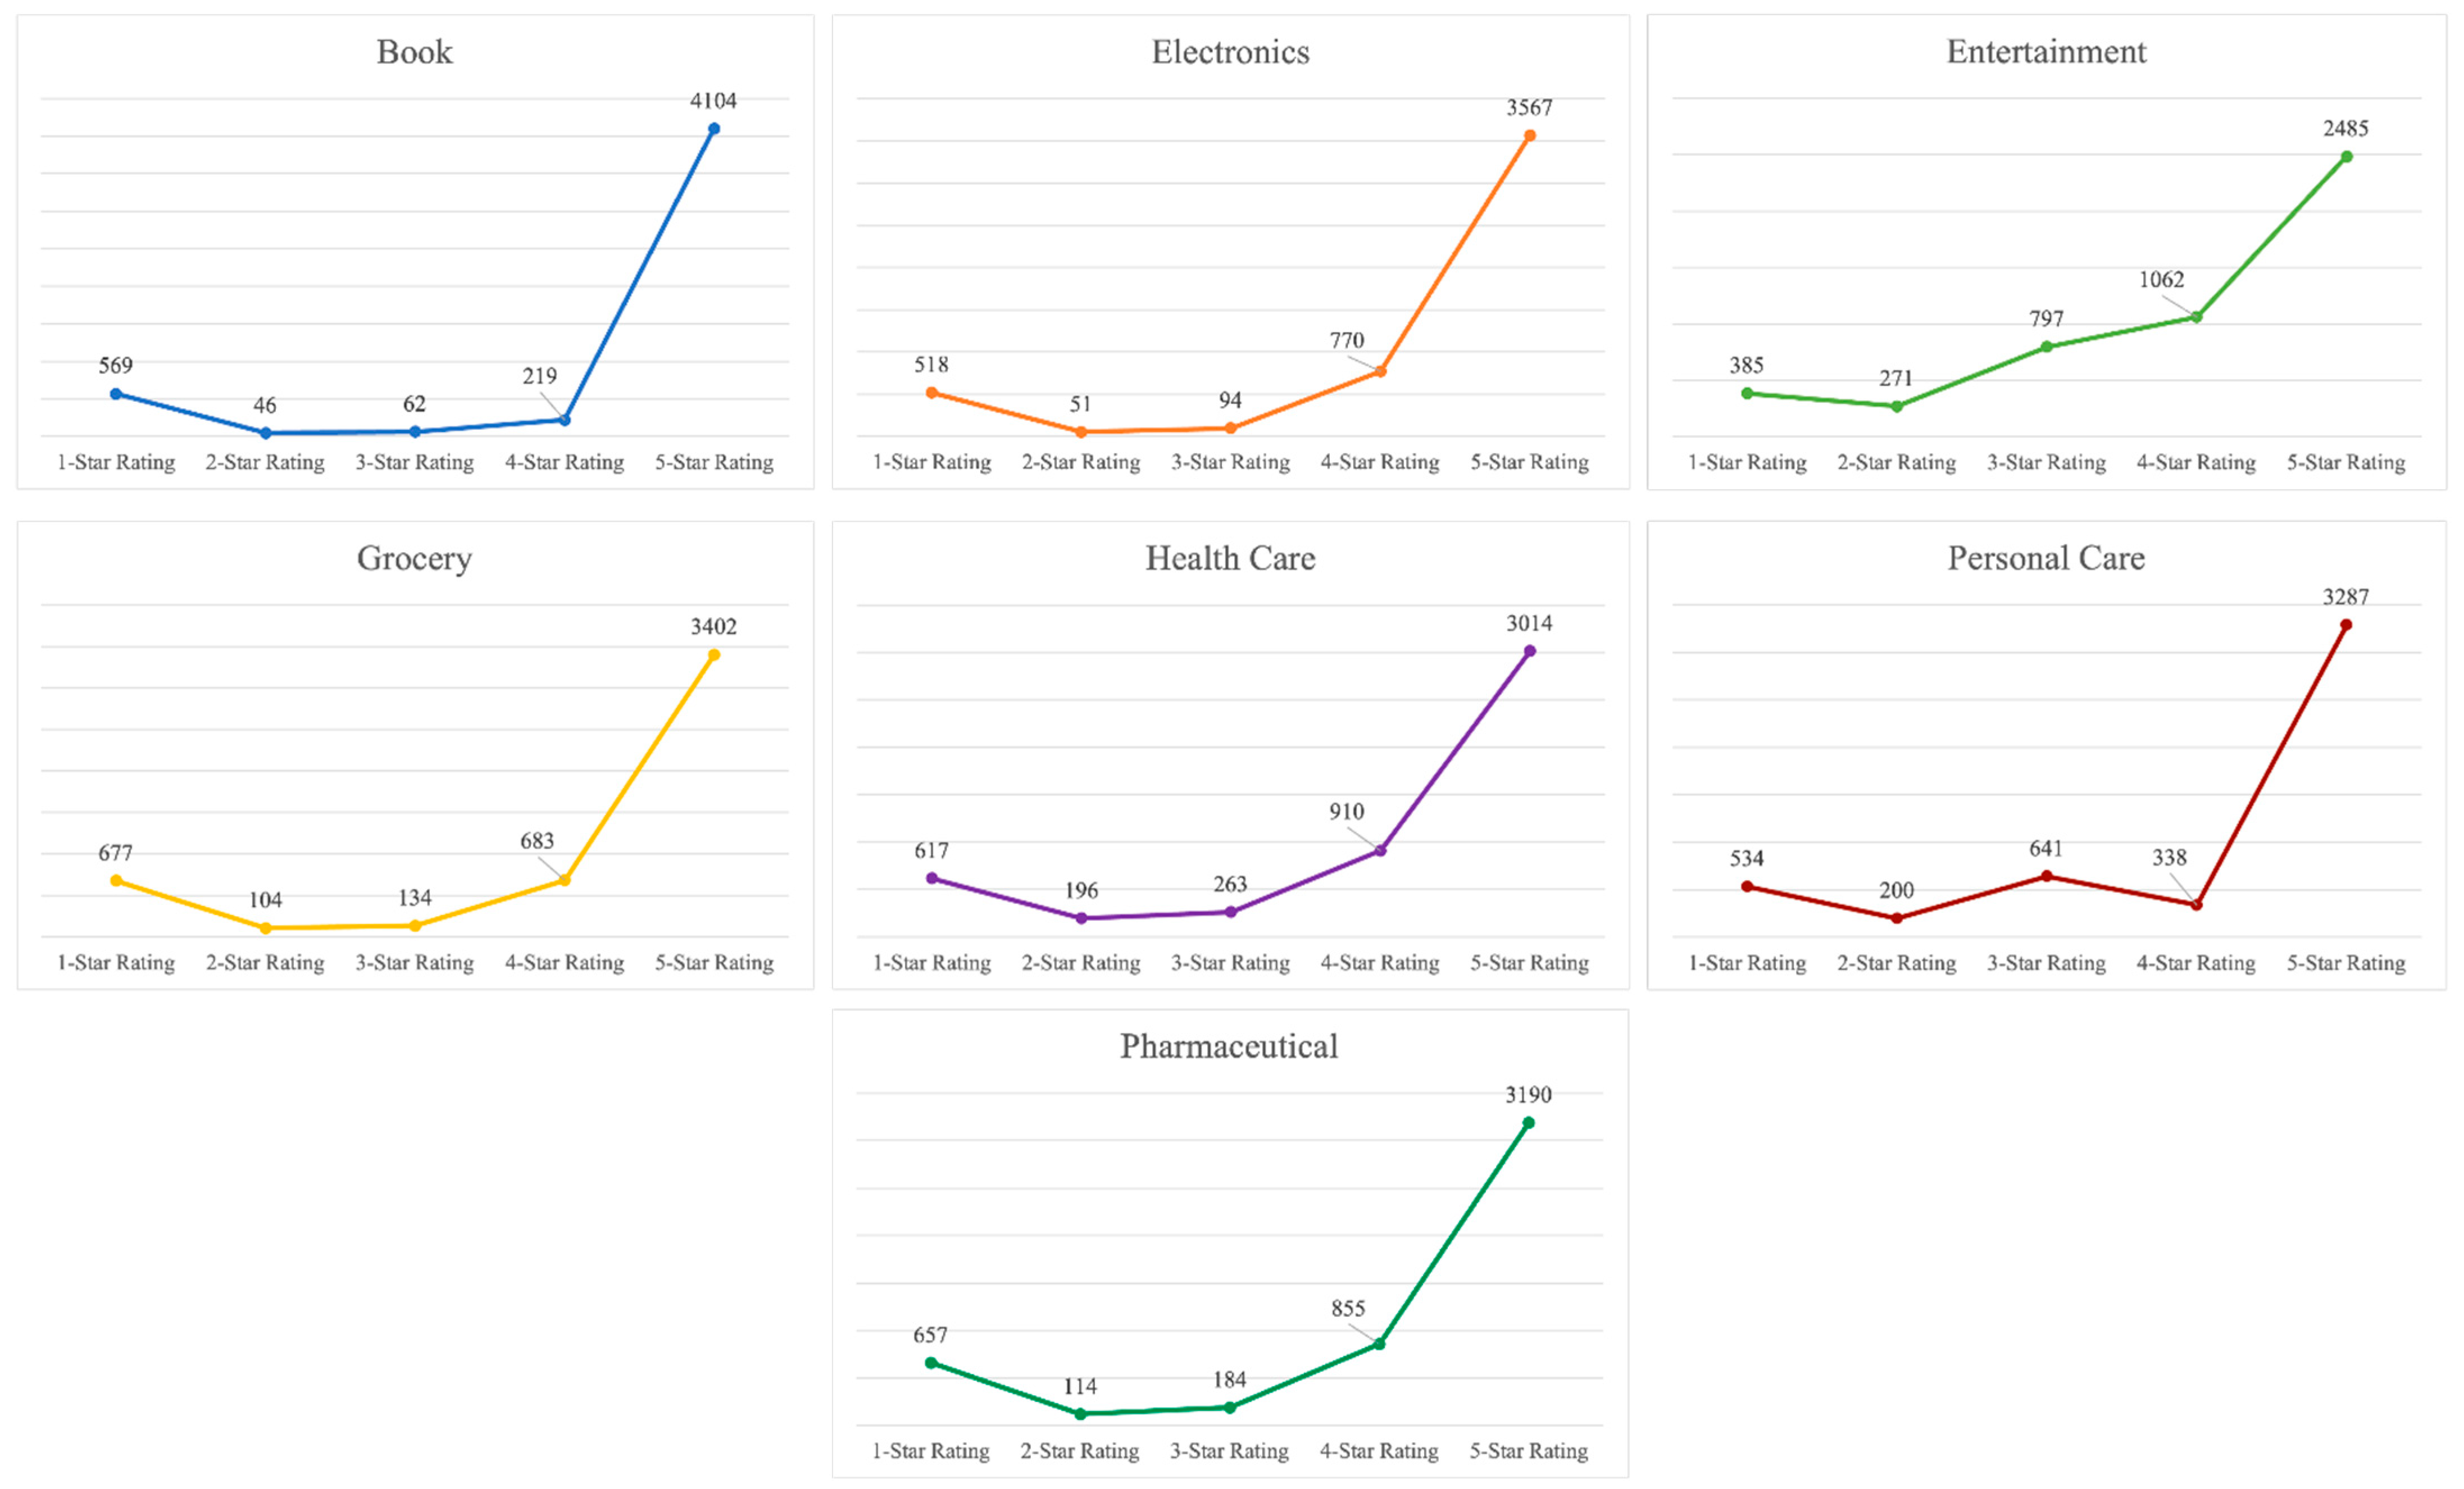
| Dataset | 5-Star Rating | 4-Star Rating | 3-Star Rating | 2-Star Rating | 1-Star Rating |
|---|---|---|---|---|---|
| Book | 4104 | 219 | 62 | 46 | 569 |
| Electronics | 3567 | 770 | 94 | 51 | 518 |
| Entertainment | 2485 | 1062 | 797 | 271 | 385 |
| Grocery | 3402 | 683 | 134 | 104 | 677 |
| Health Care | 3014 | 910 | 263 | 196 | 617 |
| Personal Care | 3287 | 338 | 641 | 200 | 534 |
| Pharmaceutical | 3190 | 855 | 184 | 114 | 657 |
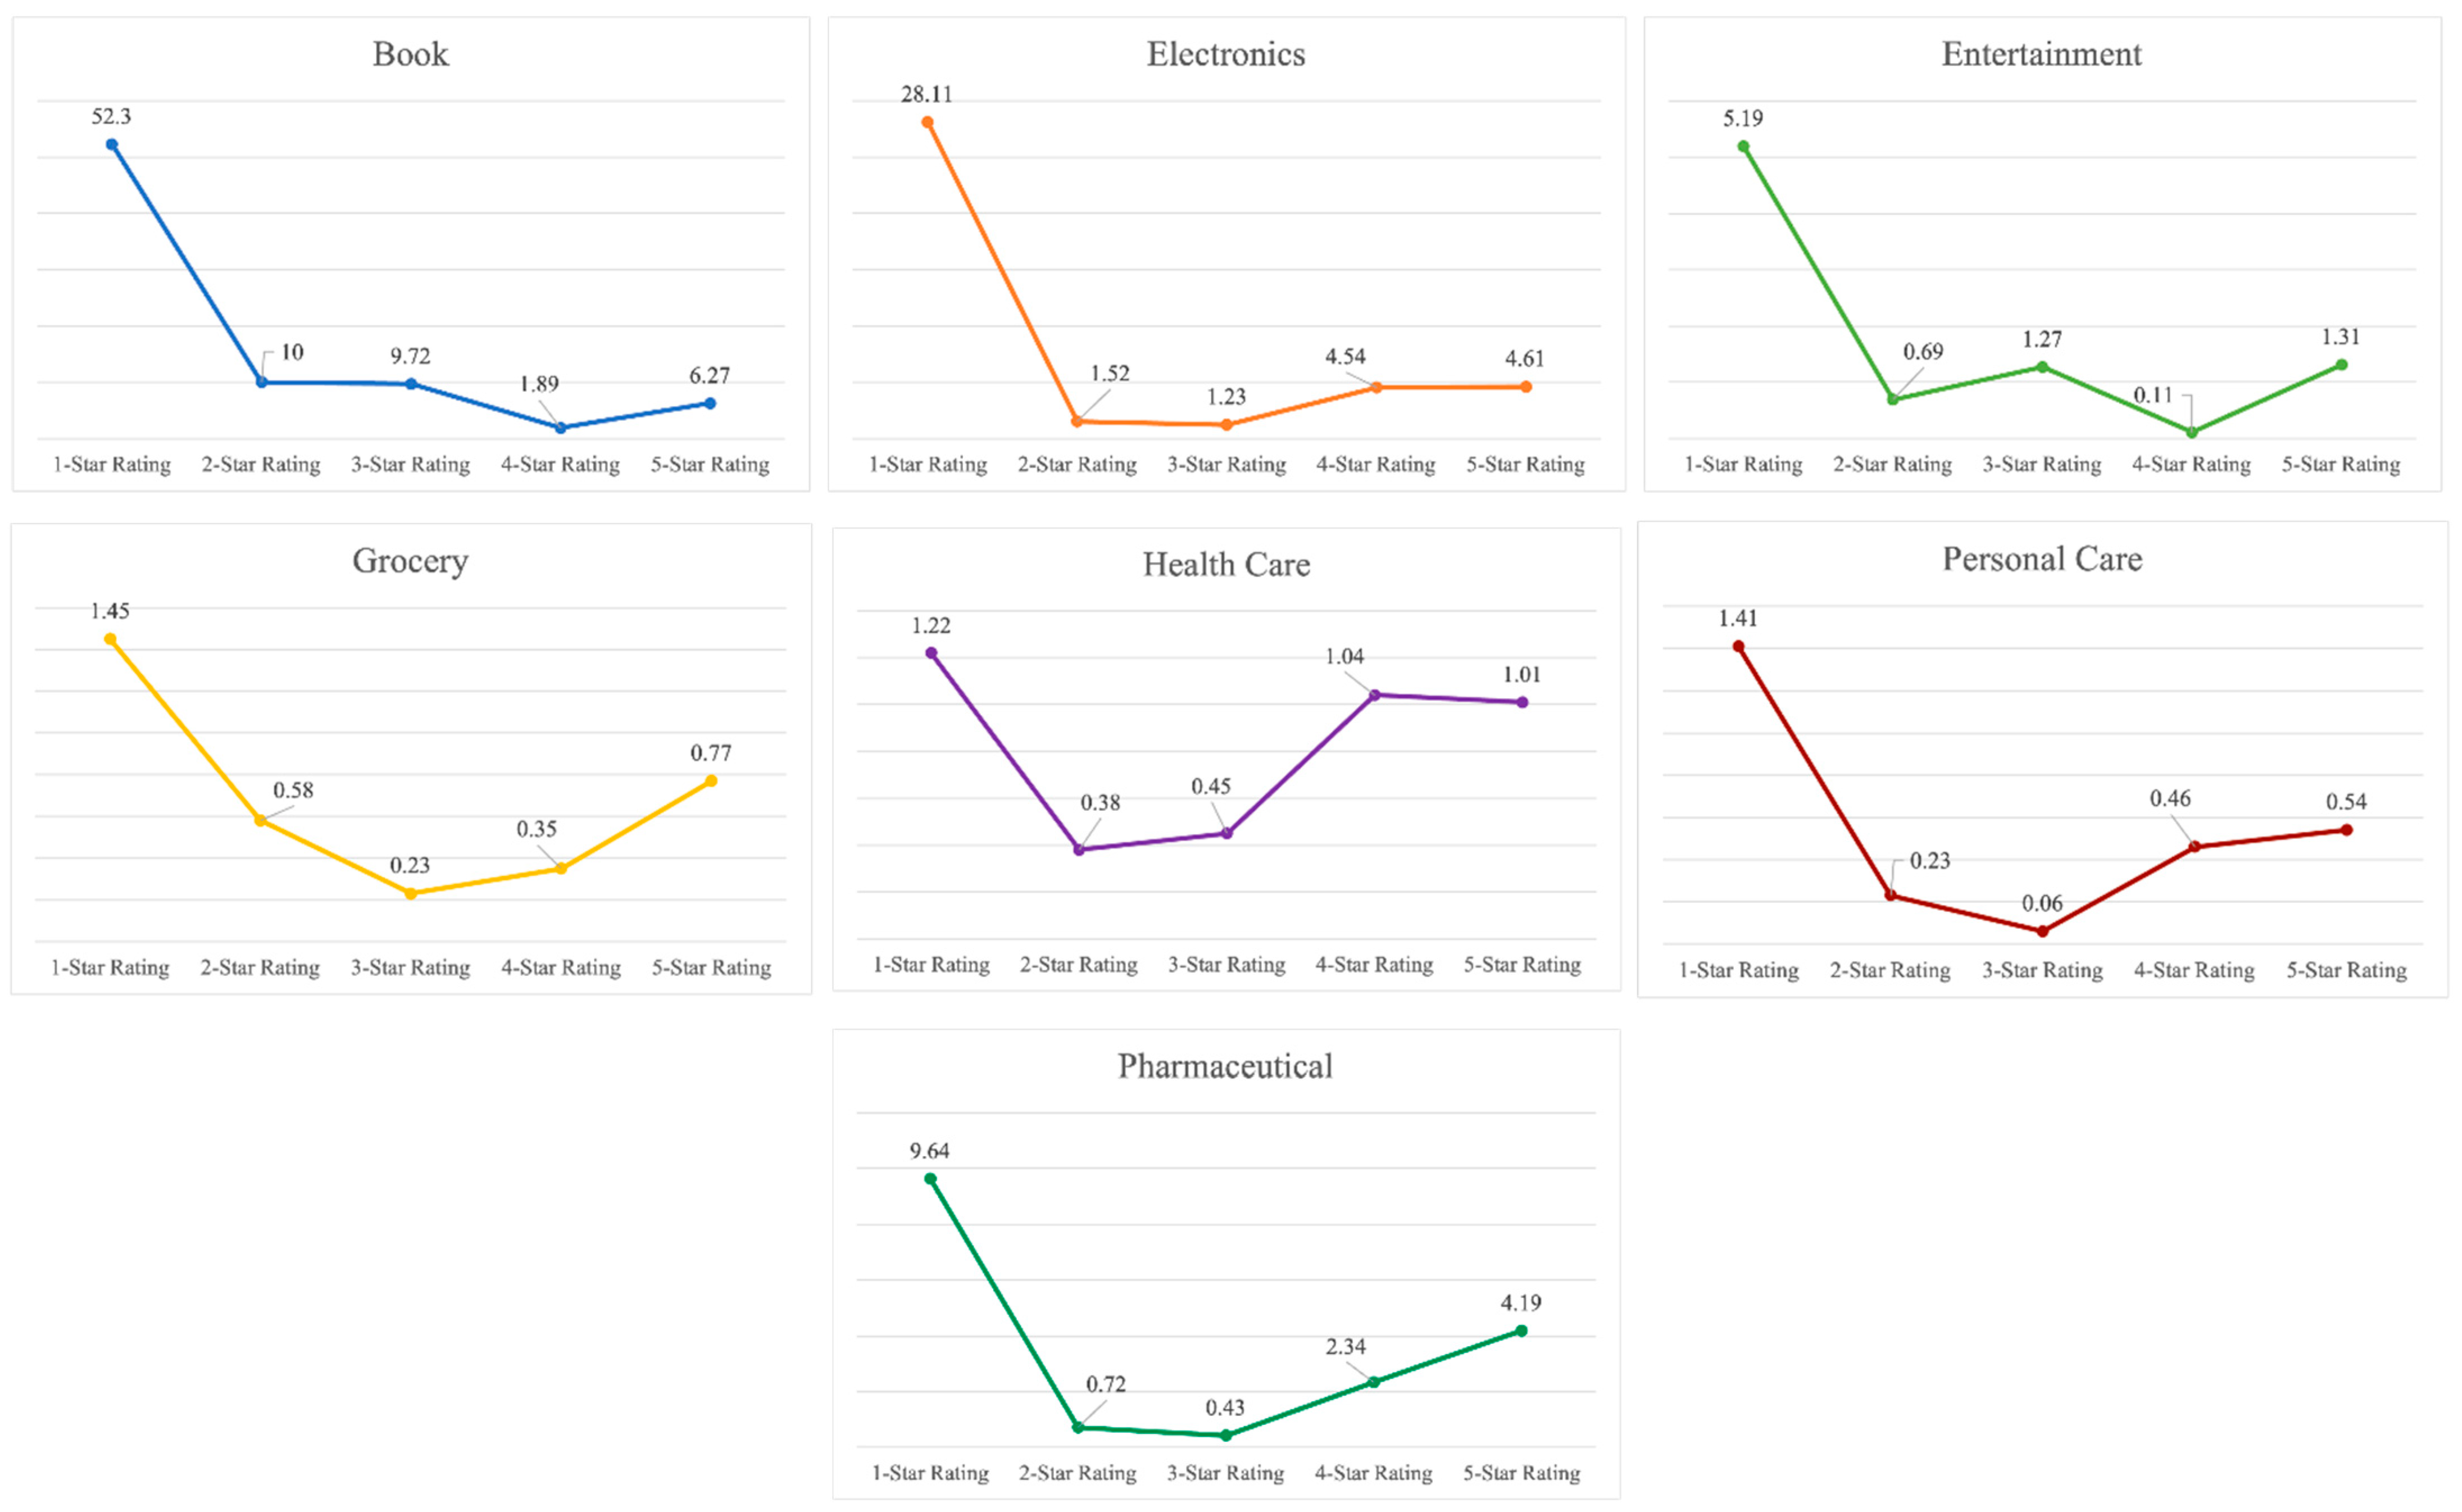
| Dataset | 5-Star Rating | 4-Star Rating | 3-Star Rating | 2-Star Rating | 1-Star Rating |
|---|---|---|---|---|---|
| Book | 6.27 | 1.89 | 9.72 | 10 | 52.3 |
| Electronics | 4.61 | 4.54 | 1.23 | 1.52 | 28.11 |
| Entertainment | 1.31 | 0.11 | 1.27 | 0.69 | 5.19 |
| Grocery | 0.77 | 0.35 | 0.23 | 0.58 | 1.45 |
| Health Care | 1.01 | 1.04 | 0.45 | 0.38 | 1.22 |
| Personal Care | 0.54 | 0.46 | 0.06 | 0.23 | 1.41 |
| Pharmaceutical | 4.19 | 2.34 | 0.43 | 0.72 | 9.64 |
| Dataset | Methods | Accuracy% | Recall% | |
|---|---|---|---|---|
| Book | SODCM | 96.9 | 98.4 | 75 |
| [55] | 84.1 | 52.2 | 410 | |
| [56] | 86.1 | 50.2 | 955 | |
| Electronics | SODCM | 93.1 | 96.5 | 60 |
| [55] | 67.3 | 49.8 | 193 | |
| [56] | 71.3 | 48.5 | 638 | |
| Entertainment | SODCM | 87.6 | 93.8 | 23 |
| [55] | 67.7 | 51.8 | 158 | |
| [56] | 79.1 | 48.9 | 1434 | |
| Grocery | SODCM | 92.3 | 96.1 | 31 |
| [55] | 75.7 | 49.7 | 406 | |
| [56] | 85.8 | 48.1 | 1194 | |
| Health Care | SODCM | 93.1 | 96.5 | 43 |
| [55] | 74.8 | 51.1 | 99 | |
| [56] | 86.2 | 49.1 | 1025 | |
| Personal Care | SODCM | 93.3 | 96.6 | 31 |
| [55] | 76.3 | 50.9 | 717 | |
| [56] | 86.2 | 48.9 | 1177 | |
| Pharmaceutical | SODCM | 89.4 | 94.7 | 17 |
| [55] | 78.7 | 51.0 | 239 | |
| [56] | 77.3 | 47.2 | 971 |
| Dataset | Methods | Accuracy% | Recall% | |
|---|---|---|---|---|
| Apparel | SODCM | 89.1 | 94.5 | 809 |
| [55] | 78.8 | 65.3 | 6404 | |
| [56] | 80.1 | 65.3 | 585 | |
| Beauty | SODCM | 90.4 | 95.1 | 936 |
| [55] | 81.2 | 65.4 | 9501 | |
| [56] | 83.1 | 65.5 | 643 | |
| Fashion | SODCM | 92.3 | 96.1 | 1061 |
| [55] | 81.6 | 62.2 | 3257 | |
| [56] | 81.4 | 62.1 | 604 | |
| Furniture | SODCM | 90.8 | 95.3 | 922 |
| [55] | 80.4 | 64.8 | 3743 | |
| [56] | 81.2 | 64.1 | 675 | |
| Jewelry | SODCM | 91.3 | 95.6 | 700 |
| [55] | 81.2 | 64.4 | 6345 | |
| [56] | 82.4 | 64.4 | 562 | |
| Luggage | SODCM | 92.1 | 96.2 | 831 |
| [55] | 82.1 | 63.6 | 4000 | |
| [56] | 83.3 | 63.8 | 599 | |
| Toy | SODCM | 90.2 | 95.1 | 662 |
| [55] | 83.2 | 65.7 | 9444 | |
| [56] | 84.1 | 65.2 | 634 |
| Dataset | p-Value | T-Score | CI |
|---|---|---|---|
| Book | 1.77 × 10⁻⁹ | 9.05 | [0.02, 0.04] |
| Electronics | 1.43 × 10⁻⁶ | 16.67 | [0.06, 0.08] |
| Entertainment | 8.46 × 10⁻⁸ | 25.67 | [0.11, 0.13] |
| Grocery | 1.48 × 10⁻⁷ | 18.93 | [0.07, 0.08] |
| Health Care | 7.26 × 10⁻⁶ | 17.27 | [0.06, 0.08] |
| Personal Care | 1.08 × 10⁻⁶ | 17.38 | [0.06, 0.07] |
| Pharmaceutical | 3.62 × 10⁻⁹ | 23.63 | [0.10, 0.12] |
Publisher’s Note: MDPI stays neutral with regard to jurisdictional claims in published maps and institutional affiliations. |
© 2021 by the authors. Licensee MDPI, Basel, Switzerland. This article is an open access article distributed under the terms and conditions of the Creative Commons Attribution (CC BY) license (https://creativecommons.org/licenses/by/4.0/).
Share and Cite
Chatterjee, I.; Zhou, M.; Abusorrah, A.; Sedraoui, K.; Alabdulwahab, A. Statistics-Based Outlier Detection and Correction Method for Amazon Customer Reviews. Entropy 2021, 23, 1645. https://doi.org/10.3390/e23121645
Chatterjee I, Zhou M, Abusorrah A, Sedraoui K, Alabdulwahab A. Statistics-Based Outlier Detection and Correction Method for Amazon Customer Reviews. Entropy. 2021; 23(12):1645. https://doi.org/10.3390/e23121645
Chicago/Turabian StyleChatterjee, Ishani, Mengchu Zhou, Abdullah Abusorrah, Khaled Sedraoui, and Ahmed Alabdulwahab. 2021. "Statistics-Based Outlier Detection and Correction Method for Amazon Customer Reviews" Entropy 23, no. 12: 1645. https://doi.org/10.3390/e23121645
APA StyleChatterjee, I., Zhou, M., Abusorrah, A., Sedraoui, K., & Alabdulwahab, A. (2021). Statistics-Based Outlier Detection and Correction Method for Amazon Customer Reviews. Entropy, 23(12), 1645. https://doi.org/10.3390/e23121645