
An Adaptive Deblurring Vehicle Detection Method for High-Speed Moving Drones: Resistance to Shake


Abstract
:1. Introduction
- A dataset consisting of blurred and sharp image pairs is provided in this article.
- A clarity evaluation (CE) module based on information entropy is introduced to discriminate whether an image is blurred or not.
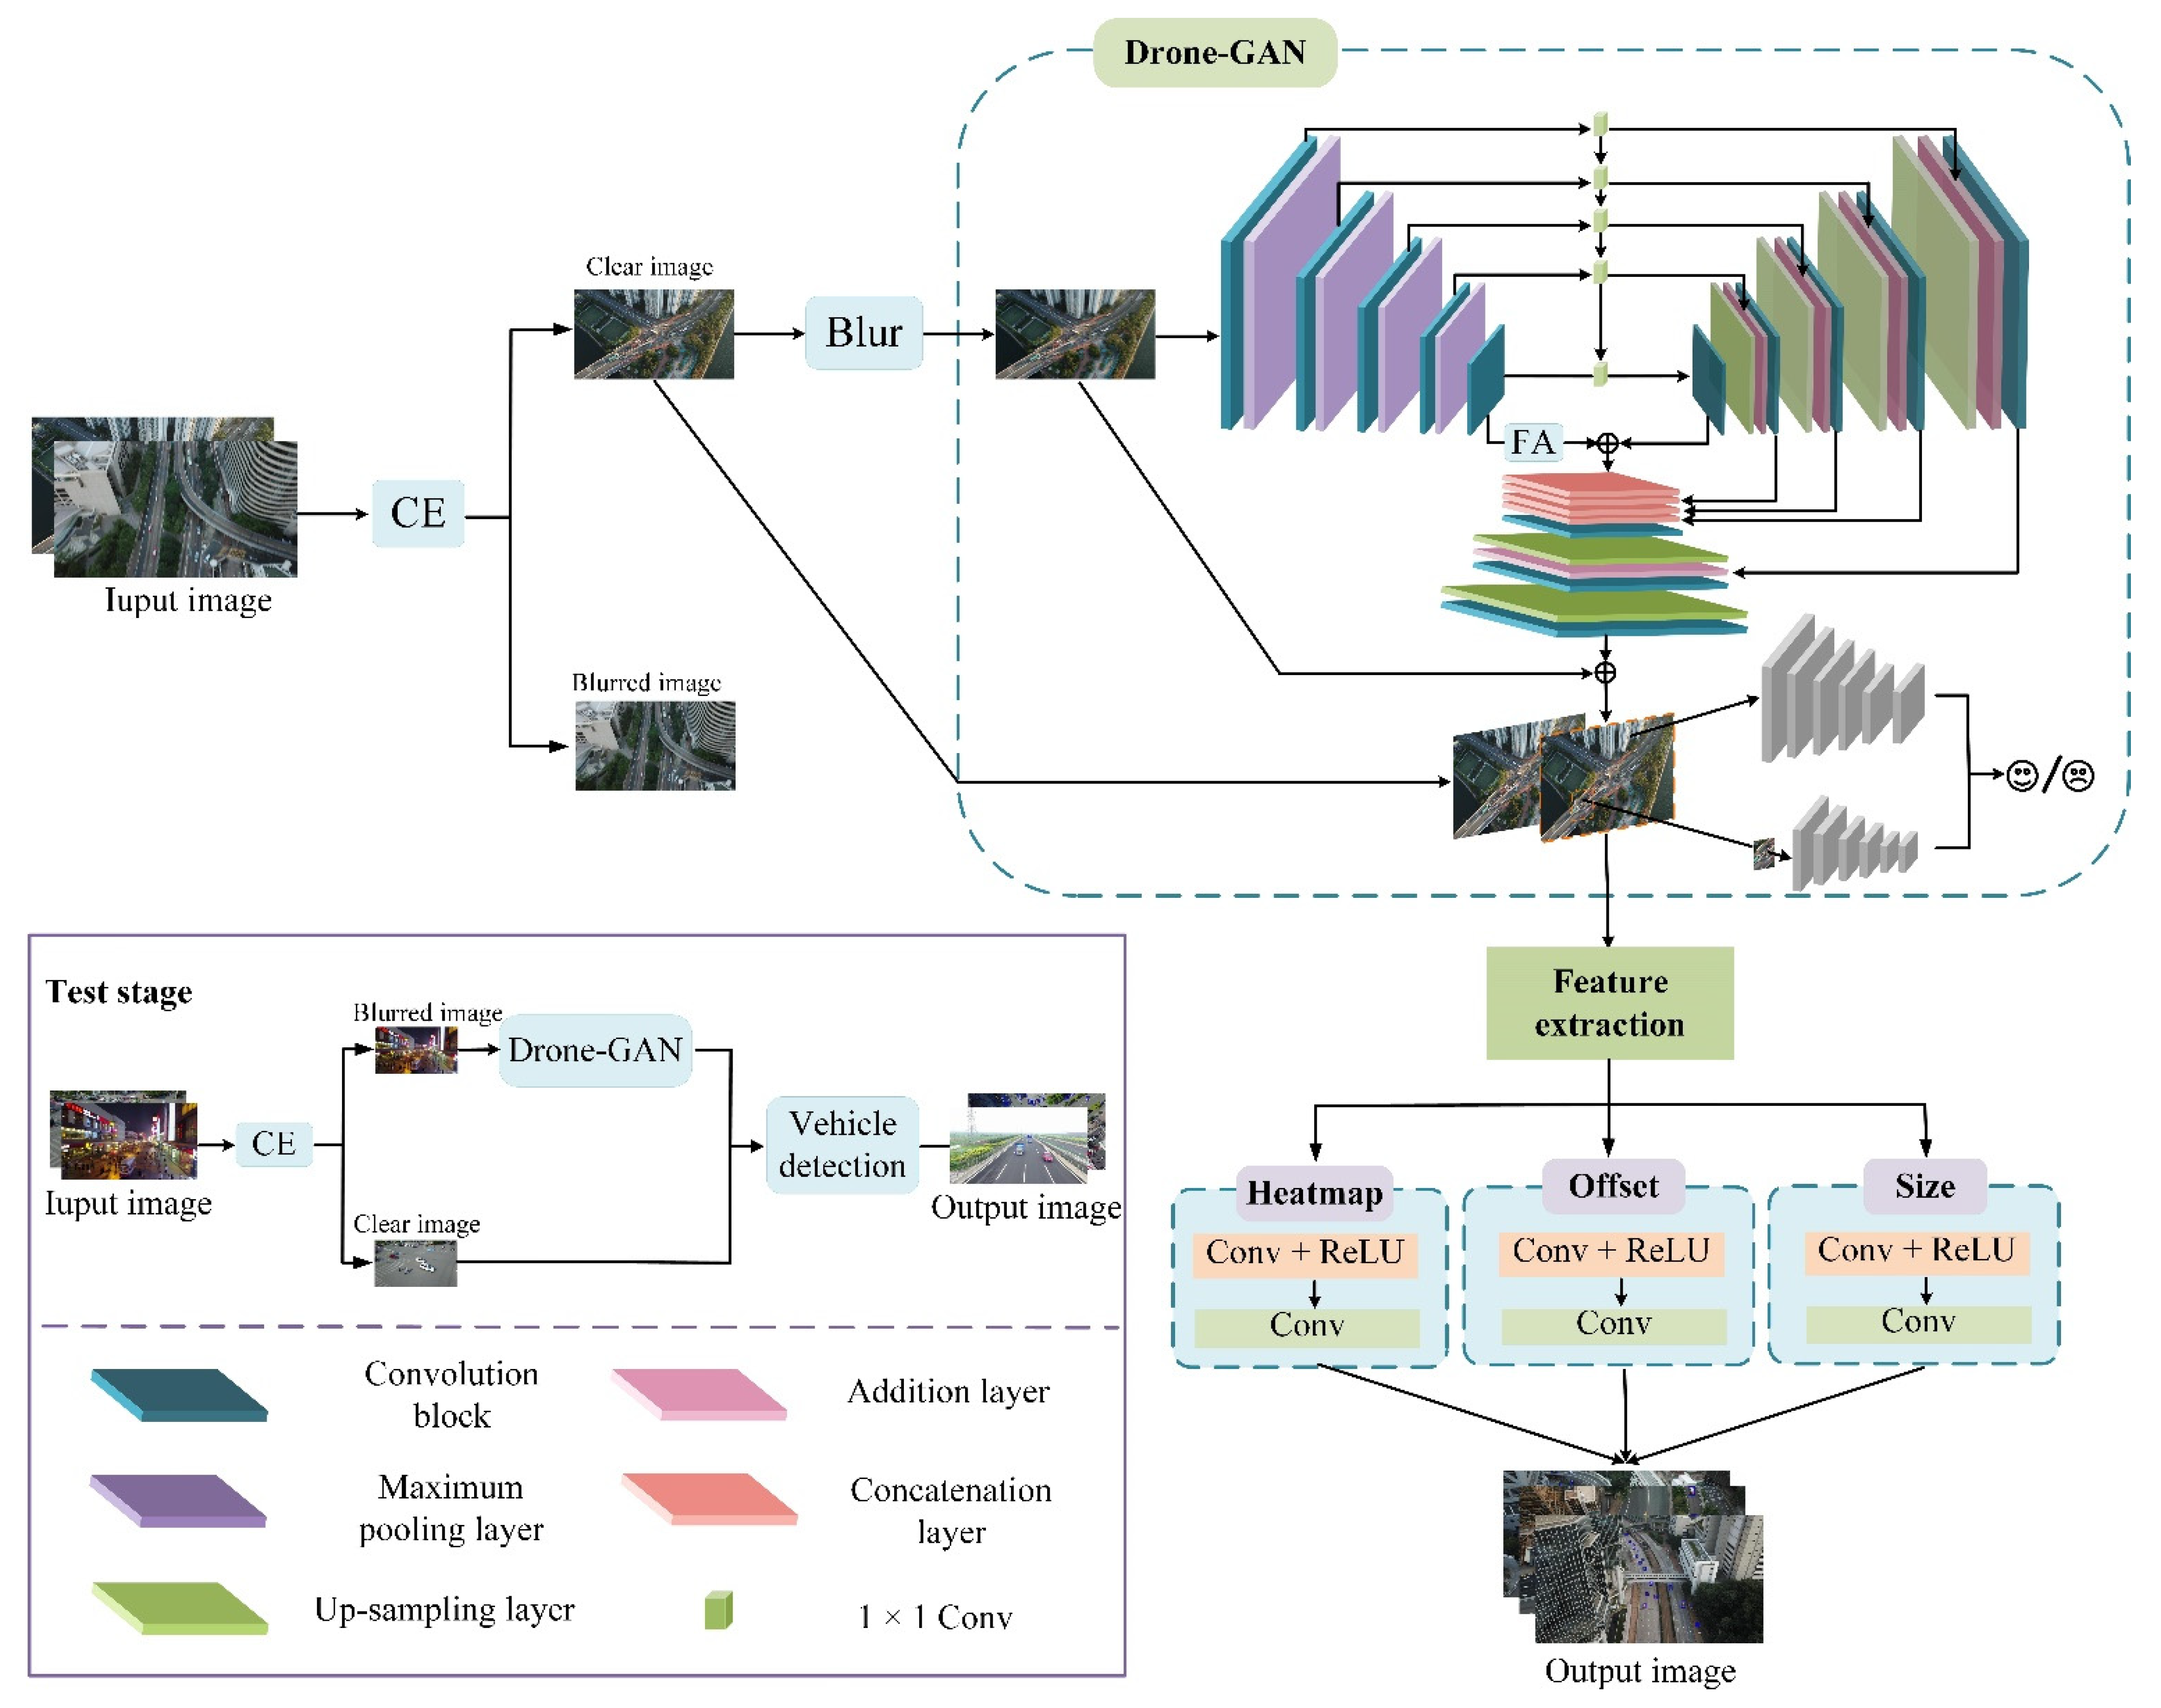
- An improved GAN called Drone-GAN is proposed to improve the detection accuracy of blurred aerial images.
- The algorithm proposed can be applied to the target detection task with a high-speed camera platform.
2. Related Works
3. Method
3.1. CE
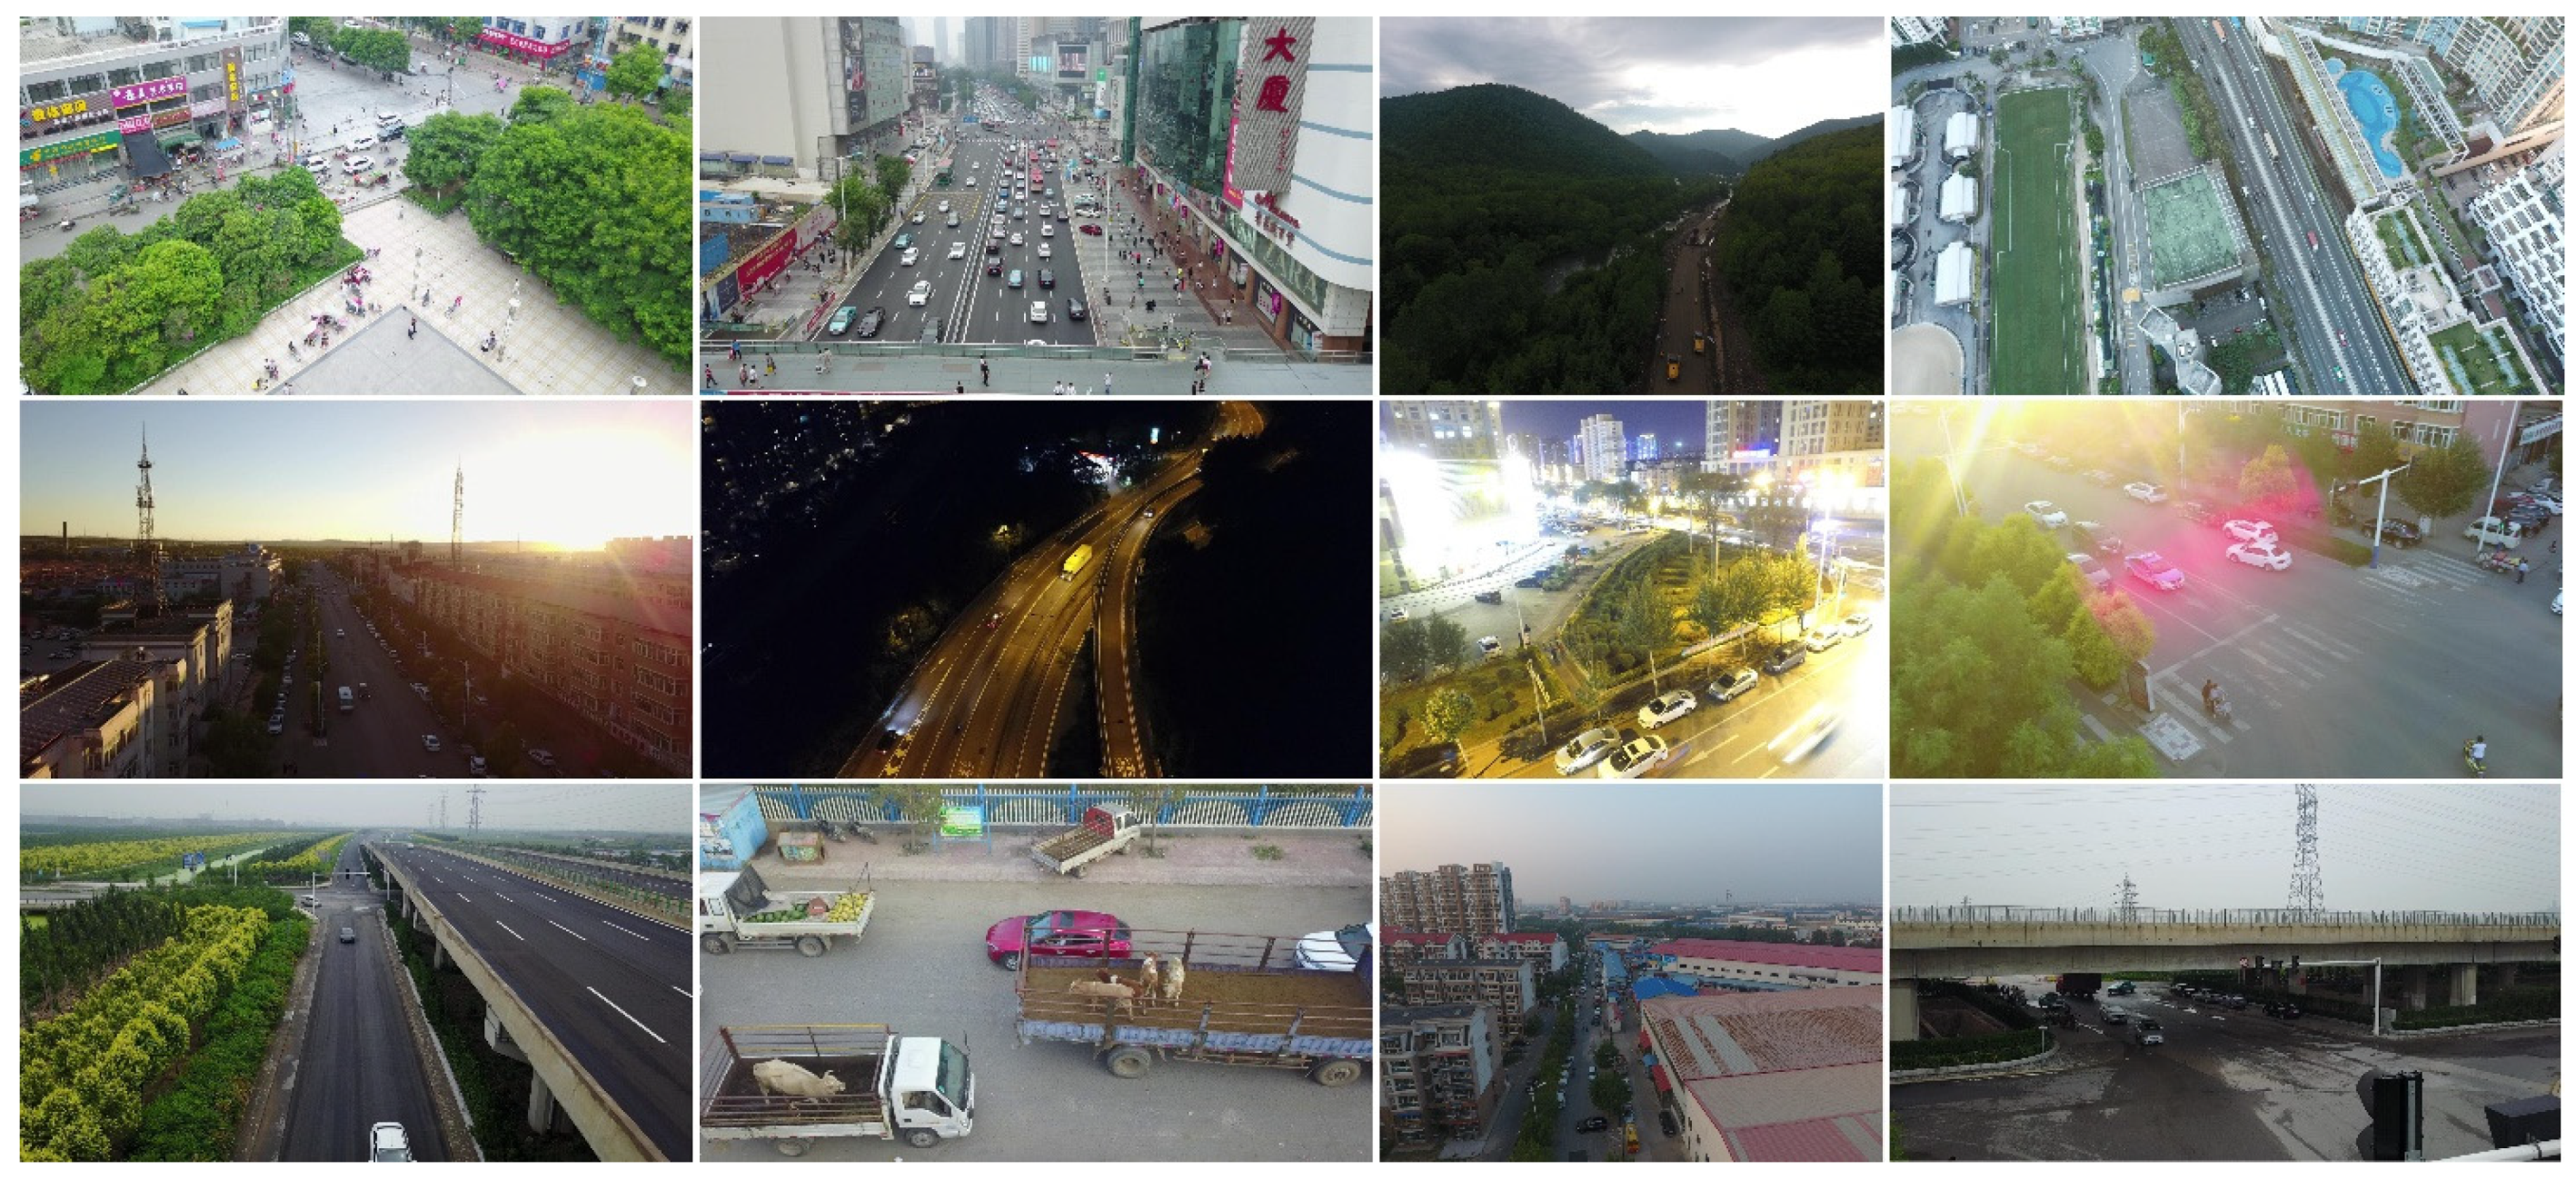
3.2. Blurred Image Dataset
3.3. Drone-GAN
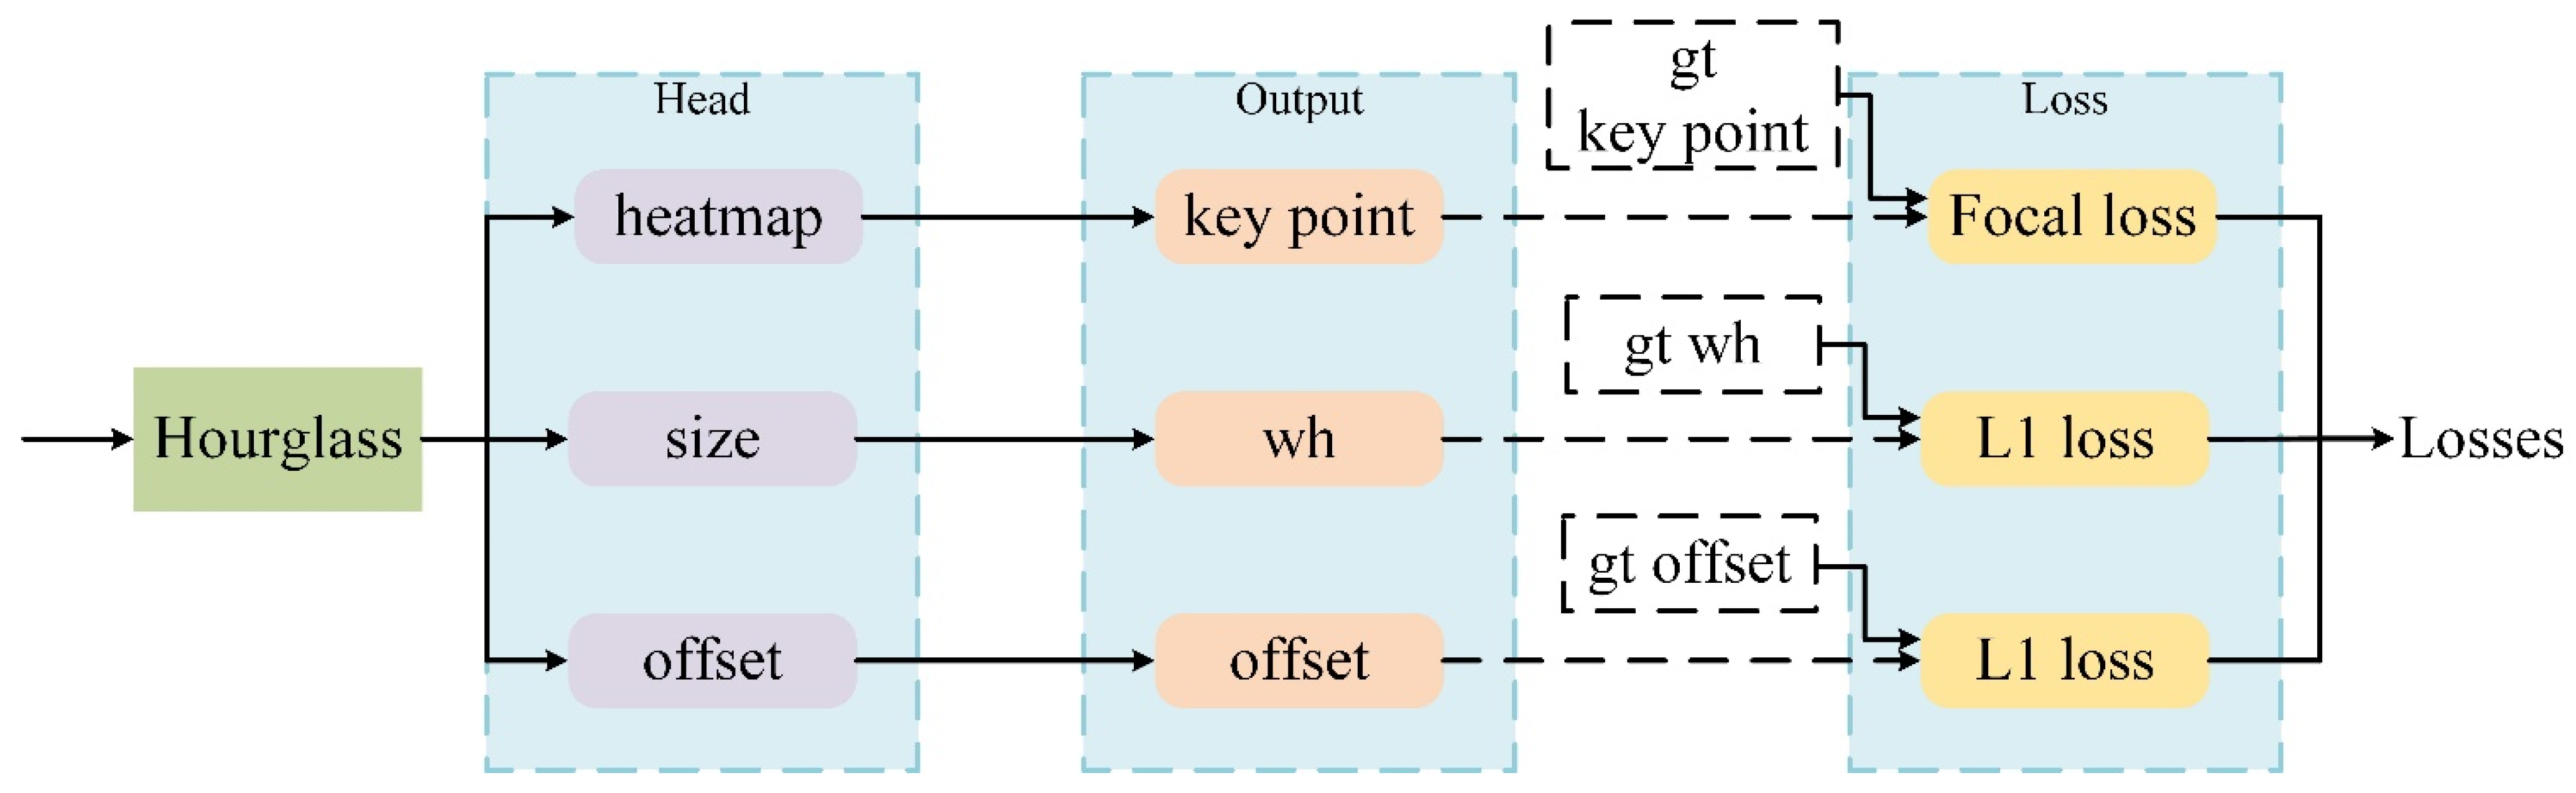
3.4. Vehicle Detection
3.5. Implementation
4. Experiments
4.1. Datasets and Evaluation Metrics
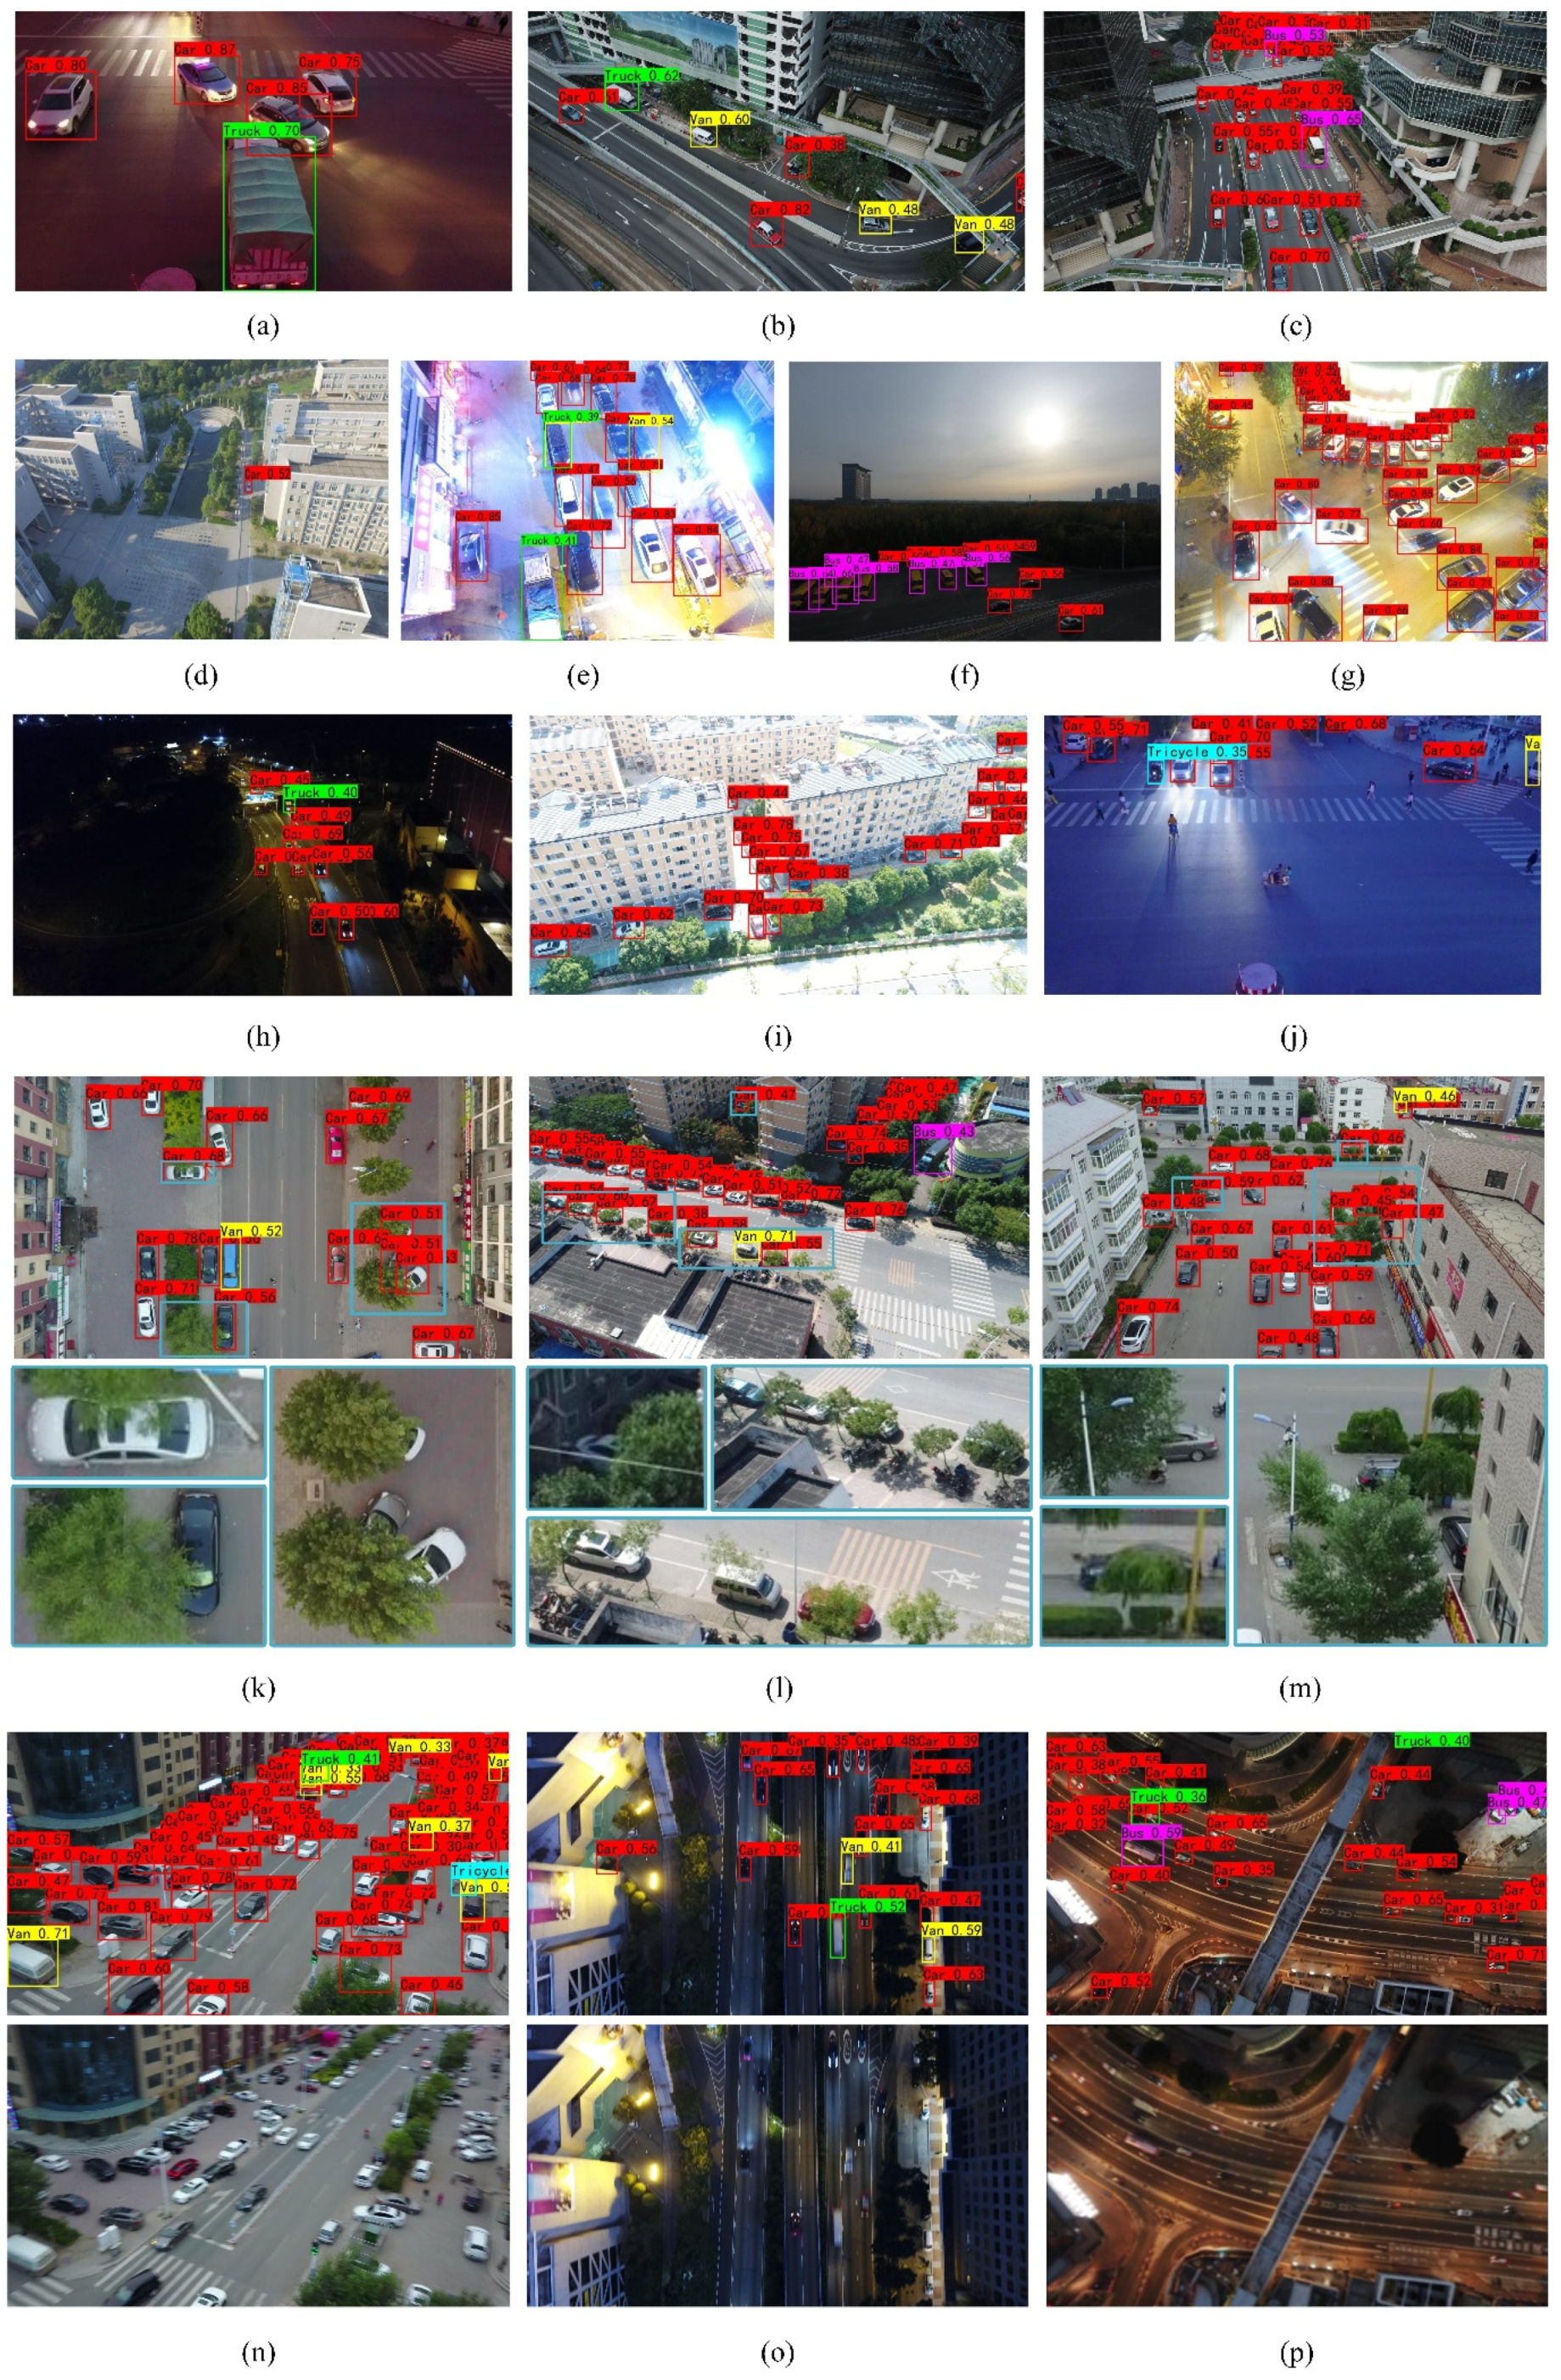
4.2. Experimental Results
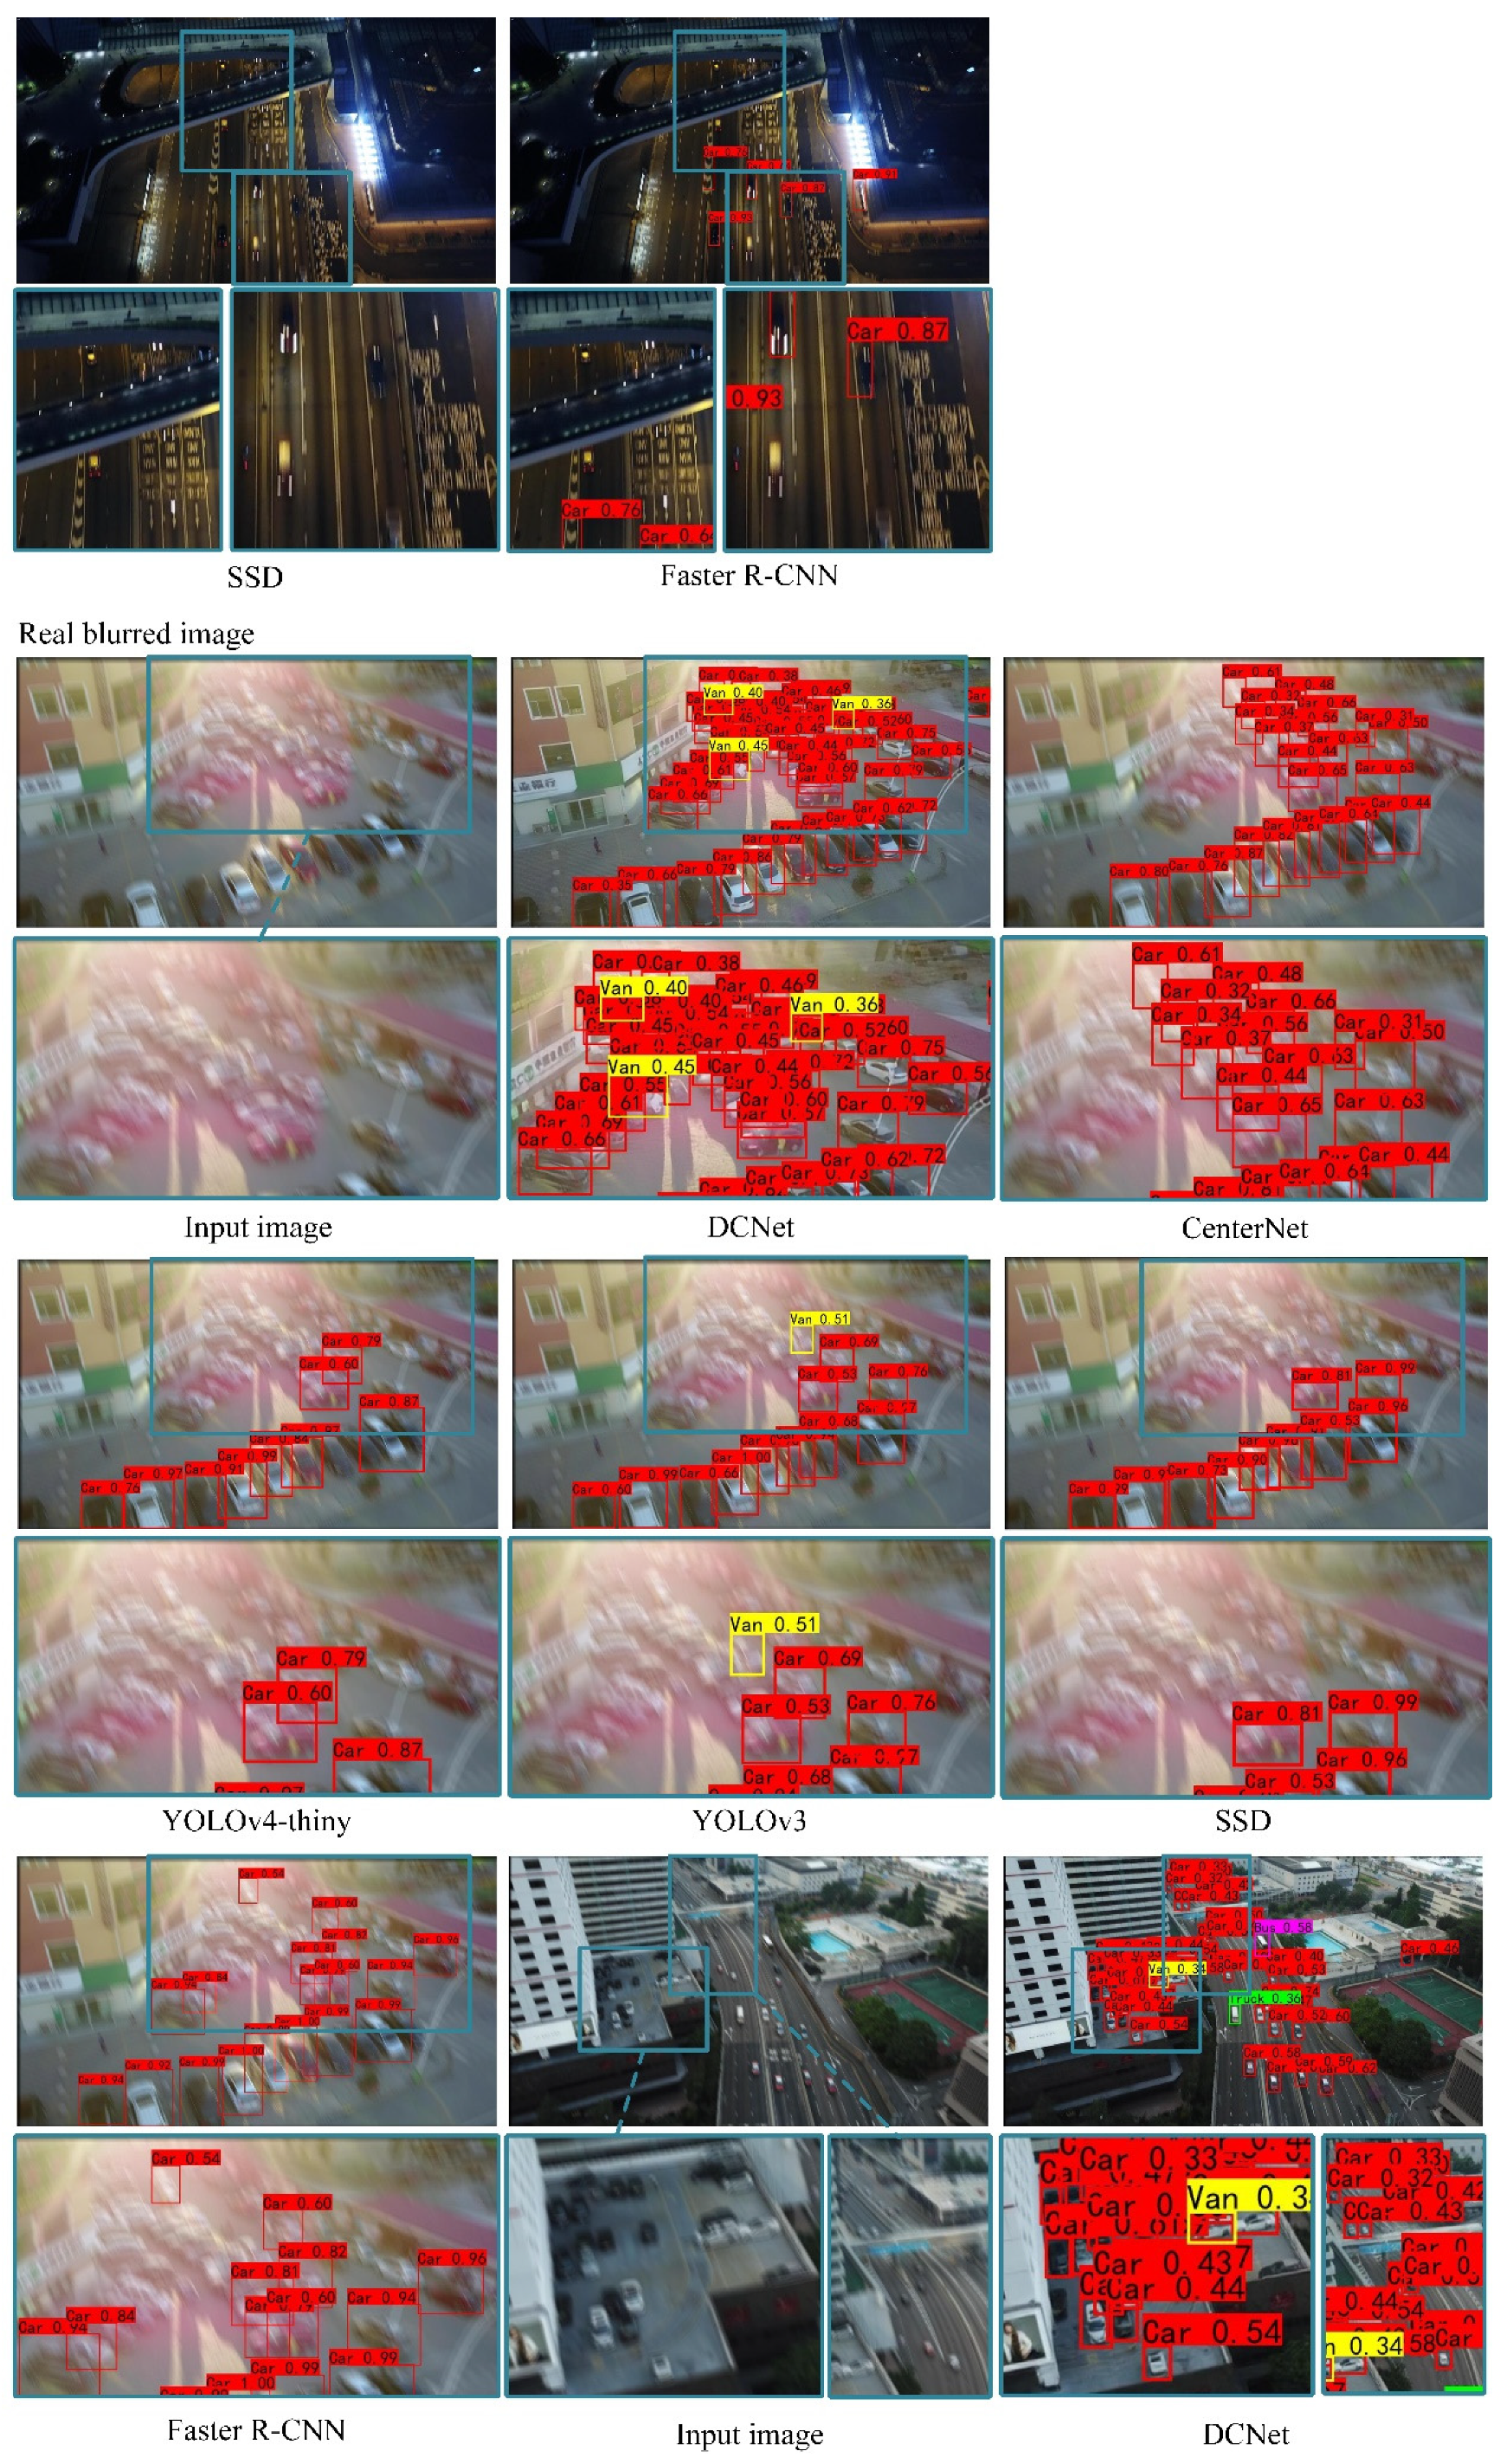
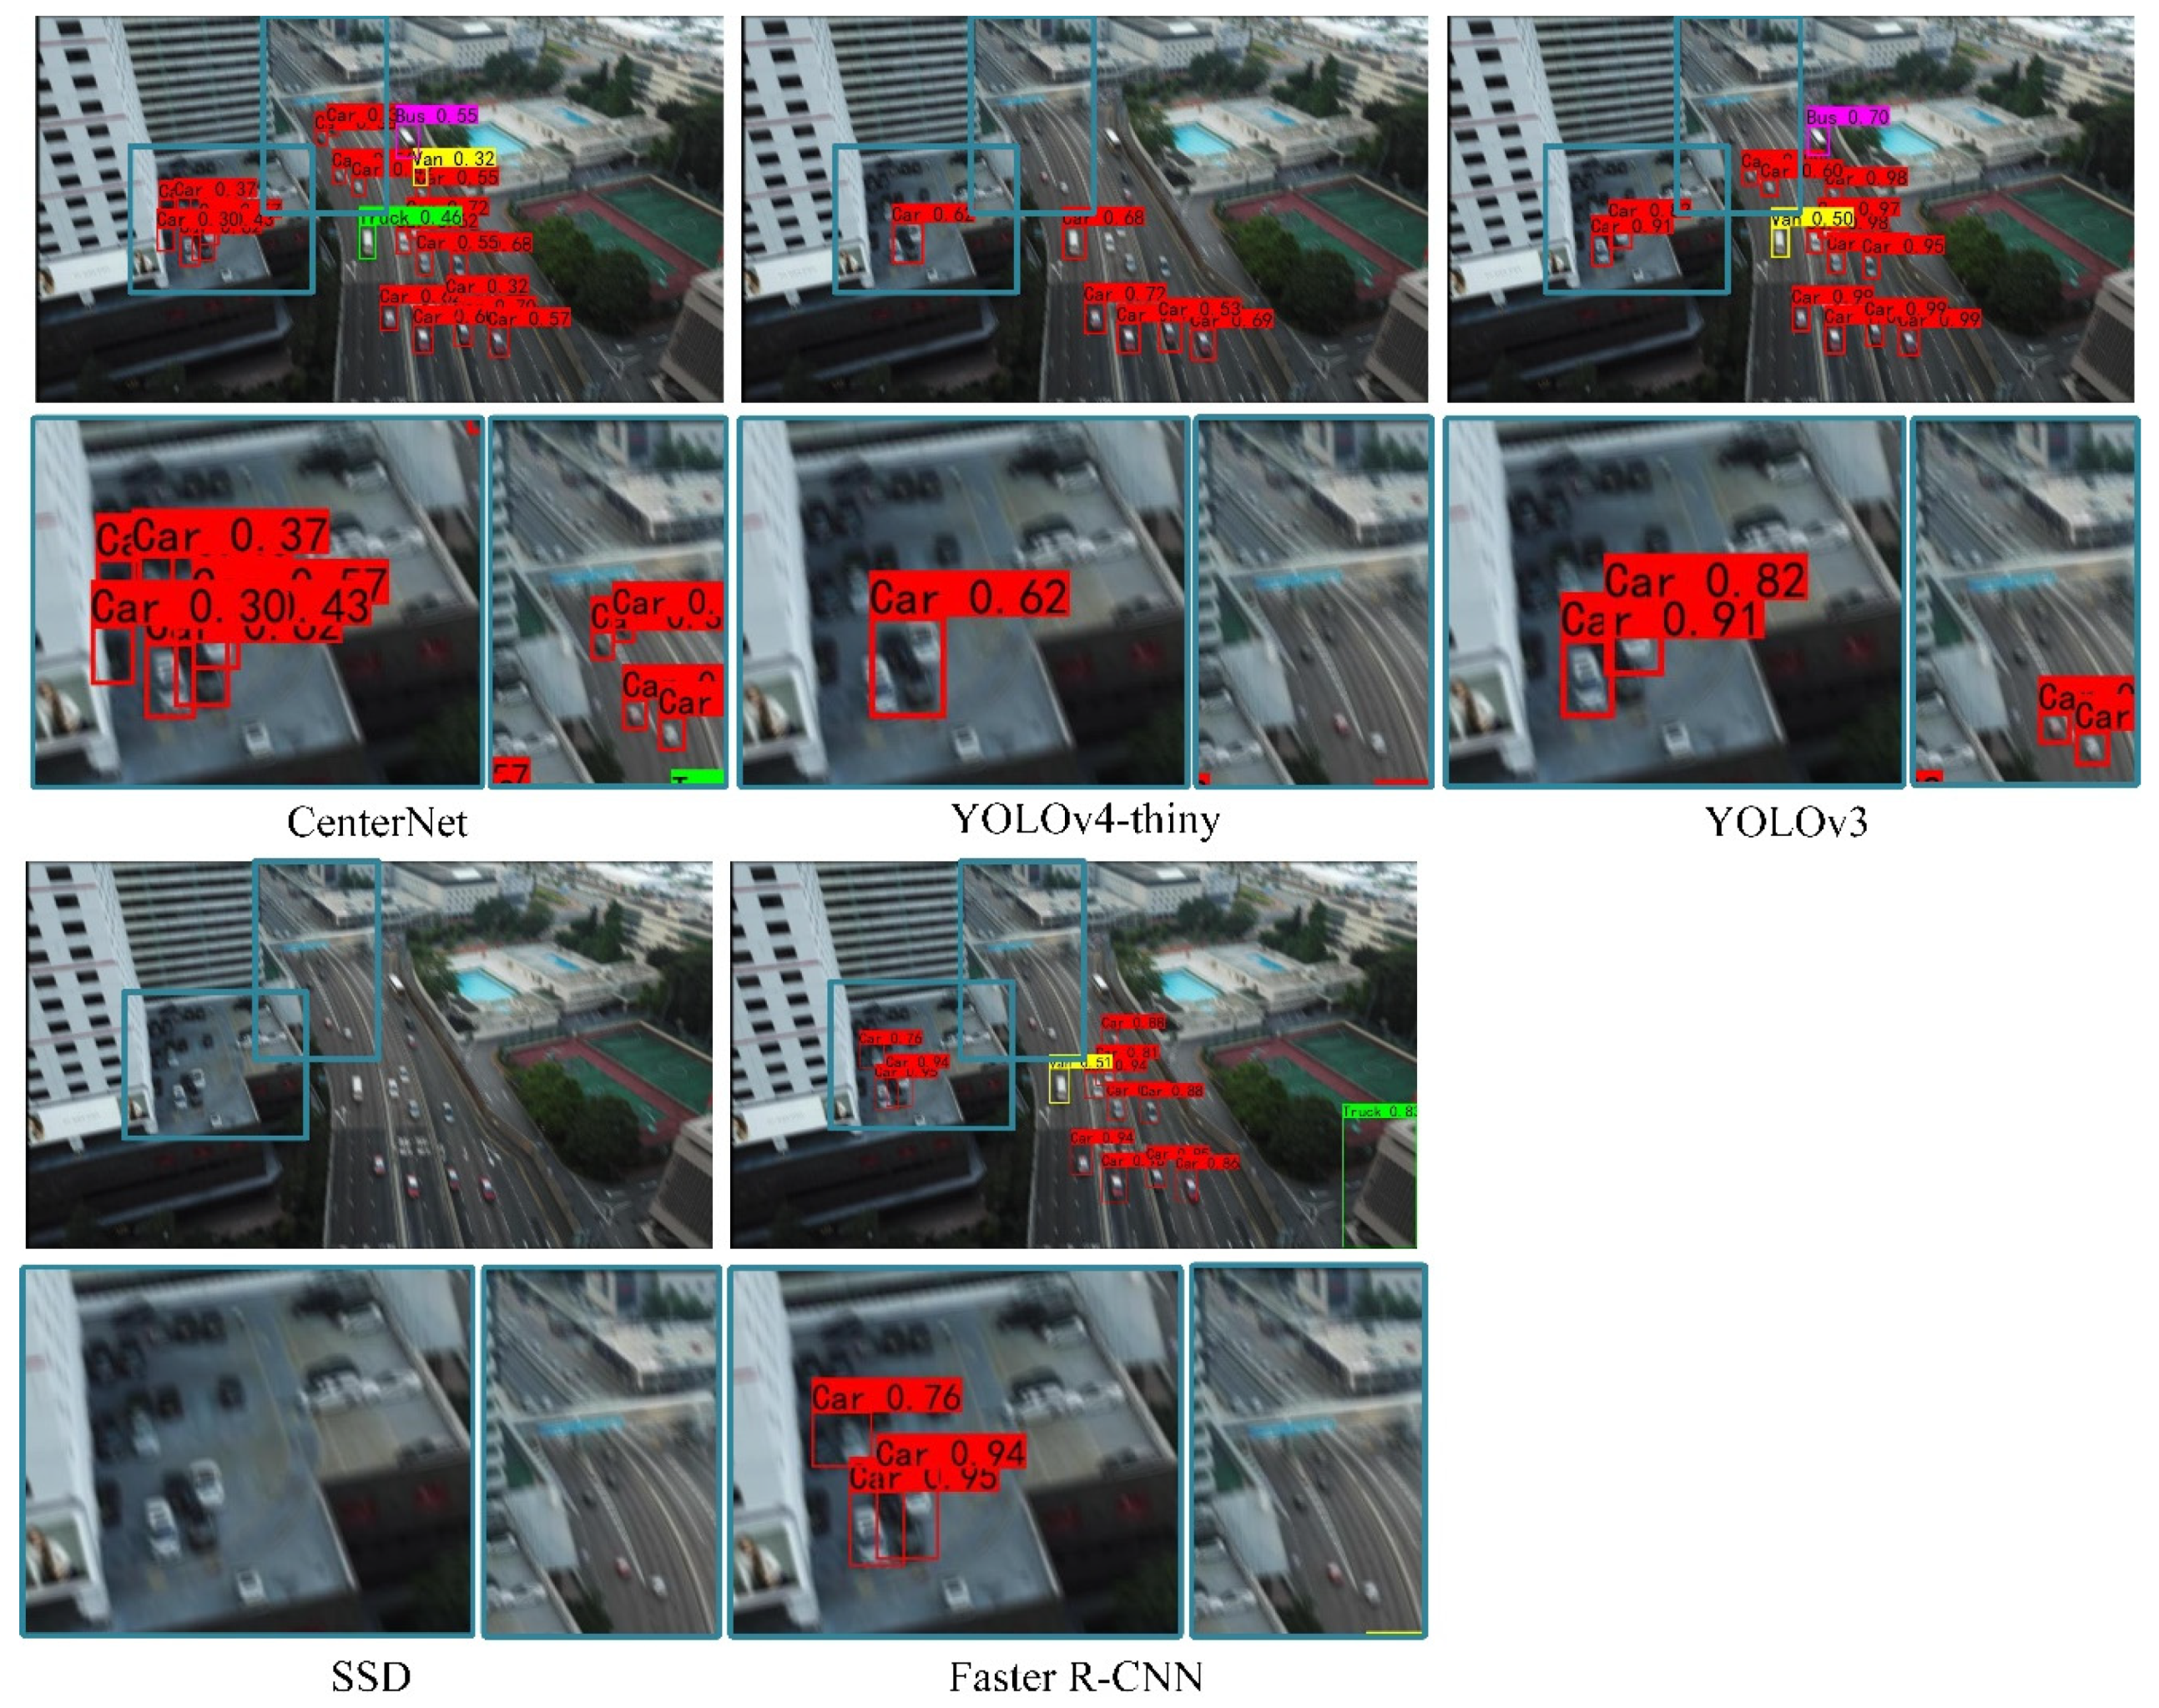
4.3. Comparisons with State-of-the-Art Detectors
4.4. Ablation Experiments
5. Discussion
6. Conclusions
Author Contributions
Funding
Institutional Review Board Statement
Informed Consent Statement
Data Availability Statement
Acknowledgments
Conflicts of Interest
Abbreviations
| SOTA | State of the art |
| UAV | Unmanned aerial vehicles |
| GAN | Generative adversarial networks |
| FOV | Field of view |
| ICN | Image cascade network |
| CNN | Convolutional neural network |
| RPN | Region proposal network |
| CE | Clarity evaluation |
| FPN | Feature pyramid network |
| FA | Feature augmentation |
| NMS | Non-maximum suppression |
| YOLO | You only look once |
| SSD | Single-shot MultiBox detector |
| VGG | Visual geometry group |
| GT | Ground truth |
| ResNet | Residual network |
| AP | Average precision |
| mAP | Mean average precision |
| TP | True-positive |
| FP | False-positive |
| FN | False-negative |
| TN | True-negative |
References
- Hua, L.; Zhang, J.; Li, D.; Xi, X. Fault-Tolerant Active Disturbance Rejection Control of Plant Protection of Unmanned Aerial Vehicles Based on a Spatio-Temporal RBF Neural Network. Appl. Sci. 2021, 11, 4084. [Google Scholar] [CrossRef]
- Rajan, J.; Shriwastav, S.; Kashyap, A.; Ratnoo, A.; Ghose, D. Disaster management using unmanned aerial vehicles. In Unmanned Aerial Systems; Academic Press: Cambridge, MA, USA, 2021; pp. 129–155. [Google Scholar]
- Shrestha, R.; Bajracharya, R.; Kim, S. 6G Enabled Unmanned Aerial Vehicle Traffic Management: A Perspective. IEEE Access 2021, 9, 1. [Google Scholar] [CrossRef]
- Lee, G.; Hwang, J.; Cho, S. A Novel Index to Detect Vegetation in Urban Areas Using UAV-Based Multispectral Images. Appl. Sci. 2021, 11, 3472. [Google Scholar] [CrossRef]
- Ko, Y.D.; Song, B.D. Application of UAVs for tourism security and safety. Asia Pac. J. Mark. Logist. 2021, 33, 1829–1843. [Google Scholar] [CrossRef]
- Delavarpour, N.; Koparan, C.; Nowatzki, J.; Bajwa, S.; Sun, X. A Technical Study on UAV Characteristics for Precision Agriculture Applications and Associated Practical Challenges. Remote Sens. 2021, 13, 1204. [Google Scholar] [CrossRef]
- Barbosa, B.; Ferraz, G.A.E.S.; dos Santos, L.M.; Santana, L.; Marin, D.B.; Rossi, G.; Conti, L. Application of RGB Images Obtained by UAV in Coffee Farming. Remote Sens. 2021, 13, 2397. [Google Scholar] [CrossRef]
- Yahia, C.N.; Scott, S.E.; Boyles, S.D.; Claudel, C.G. Unmanned aerial vehicle path planning for trafc estimation and detection of non-recurrent congestion. Transp. Lett. 2021, 15, 1–14. [Google Scholar] [CrossRef]
- Anagnostopoulos, A.; Kehagia, F. Utilizing UAVs Technology on Microscopic Traffic Naturalistic Data Acquirement. Infrastructures 2021, 6, 89. [Google Scholar] [CrossRef]
- Lin, T.Y.; Dollár, P.; Girshick, R.; He, K.; Hariharan, B.; Belongie, S. Feature pyramid networks for object detection. In Proceedings of the IEEE Conference on Computer Vision and Pattern Recognition, Honolulu, HI, USA, 21–26 July 2017; pp. 2117–2125. [Google Scholar] [CrossRef] [Green Version]
- Azimi, S.M.; Vig, E.; Bahmanyar, R.; Körner, M.; Reinartz, P. Towards Multi-Class Object Detection in Unconstrained Remote Sensing Imagery; Springer: Cham, Switzerland, 2019; pp. 150–165. [Google Scholar]
- LaLonde, R.; Zhang, D.; Shah, M. ClusterNet: Detecting Small Objects in Large Scenes by Exploiting Spatio-Temporal Information. In Proceedings of the 2018 IEEE/CVF Conference on Computer Vision and Pattern Recognition, Salt Lake City, UT, USA, 18–23 June 2018; pp. 4003–4012. [Google Scholar]
- Yang, F.; Fan, H.; Chu, P.; Blasch, E.; Ling, H. Clustered Object Detection in Aerial Images. In Proceedings of the 2019 IEEE/CVF International Conference on Computer Vision (ICCV), Seoul, Korea, 27 October–2 November 2019; pp. 8310–8319. [Google Scholar]
- Regester, A.; Paruchuri, V. Using Computer Vision Techniques for Parking Space Detection in Aerial Imagery. In Proceedings of the Advances in Intelligent Systems and Computing, Lviv, Ukraine, 17–20 September 2019; pp. 190–204. [Google Scholar]
- Guido, G.; Gallelli, V.; Rogano, D.; Vitale, A. Evaluating the accuracy of vehicle tracking data obtained from Unmanned Aerial Vehicles. Int. J. Transp. Sci. Technol. 2016, 5, 136–151. [Google Scholar] [CrossRef]
- Sakai, K.; Seo, T.; Fuse, T. Traffic density estimation method from small satellite imagery: Towards frequent remote sensing of car traffic. In Proceedings of the 2019 IEEE Intelligent Transportation Systems Conference (ITSC), Auckland, NZ, USA, 27–30 October 2019; pp. 1776–1781. [Google Scholar]
- Moranduzzo, T.; Melgani, F. A SIFT-SVM method for detecting cars in UAV images. In Proceedings of the 2012 IEEE International Geoscience and Remote Sensing Symposium, Munich, Germany, 22–27 July 2012; pp. 6868–6871. [Google Scholar]
- Kembhavi, A.; Harwood, D.; Davis, L.S. Vehicle Detection Using Partial Least Squares. IEEE Trans. Pattern Anal. Mach. Intell. 2010, 33, 1250–1265. [Google Scholar] [CrossRef]
- Cao, X.; Wu, C.; Yan, P.; Li, X. Linear SVM classification using boosting HOG features for vehicle detection in low-altitude airborne videos. In Proceedings of the 2011 18th IEEE International Conference on Image Processing, Brussels, Belgium, 11–14 September 2011; pp. 2421–2424. [Google Scholar]
- Moranduzzo, T.; Melgani, F. Detecting Cars in UAV Images with a Catalog-Based Approach. IEEE Trans. Geosci. Remote Sens. 2014, 52, 6356–6367. [Google Scholar] [CrossRef]
- Zhou, H.; Wei, L.; Lim, C.P.; Creighton, D.; Nahavandi, S. Robust Vehicle Detection in Aerial Images Using Bag-of-Words and Orientation Aware Scanning. IEEE Trans. Geosci. Remote Sens. 2018, 56, 7074–7085. [Google Scholar] [CrossRef]
- Moranduzzo, T.; Melgani, F. Comparison of different feature detectors and descriptors for car classification in UAV images. In Proceedings of the 2013 IEEE International Geoscience and Remote Sensing Symposium—IGARSS, Melbourne, Australia, 21–26 July 2013; pp. 204–207. [Google Scholar]
- Shao, W.; Yang, W.; Liu, G.; Liu, J. Car detection from high-resolution aerial imagery using multiple features. In Proceedings of the Geoscience and Remote Sensing Symposium (IGARSS), 2012 IEEE International, Munich, Germany, 22–27 July 2012. [Google Scholar]
- Liang, P.; Teodoro, G.; Ling, H.; Blasch, E.; Chen, G.; Bai, L. Multiple kernel learning for vehicle detection in wide area motion imagery. In Proceedings of the 2012 15th International Conference on Information Fusion, Singapore, 9–12 July 2012. [Google Scholar]
- Cheng, H.-Y.; Weng, C.-C.; Chen, Y.-Y. Vehicle Detection in Aerial Surveillance Using Dynamic Bayesian Networks. IEEE Trans. Image Process. 2011, 21, 2152–2159. [Google Scholar] [CrossRef]
- Girshick, R.; Donahue, J.; Darrell, T.; Malik, J. Rich feature hierarchies for accurate object detection and semantic segmentation. In Proceedings of the IEEE Conference on Computer Vision and Pattern Recognition, Columbus, OH, USA, 23–28 June 2014; pp. 580–587. [Google Scholar] [CrossRef] [Green Version]
- Girshick, R.J.C.S. Fast R-CNN. In Proceedings of the IEEE International Conference on Computer Vision, Boston, MA, USA, 7–12 June 2015. [Google Scholar]
- Ren, S.; He, K.; Girshick, R.; Sun, J. Faster R-CNN: Towards real-time object detection with region proposal networks. IEEE Trans. Pattern Anal. Mach. Intell. 2017, 39, 1137–1149. [Google Scholar] [CrossRef] [Green Version]
- Redmon, J.; Divvala, S.; Girshick, R.; Farhadi, A. You Only Look Once: Unified, Real-Time Object Detection. In Proceedings of the IEEE Conference on Computer Vision and Pattern Recognition (CVPR), Las Vegas, NV, USA, 27–30 June 2016; pp. 779–788. [Google Scholar] [CrossRef] [Green Version]
- Liu, W.; Anguelov, D.; Erhan, D.; Szegedy, C.; Reed, S.; Fu, C.Y.; Berg, A.C. SSD: Single Shot MultiBox Detector. In European Conference on Computer Vision; Springer: Cham, Switzerland, 2016. [Google Scholar]
- Redmon, J.; Farhadi, A. YOLOv3: An Incremental Improvement. arXiv 2018, arXiv:1804.02767. [Google Scholar]
- Wang, C.Y.; Bochkovskiy, A.; Liao, H.Y.M. Scaled-YOLOv4: Scaling Cross Stage Partial Network. In Proceedings of the IEEE/CVF Conference on Computer Vision and Pattern Recognition Virtual, Seattle, WA, USA, 14–19 June 2020. [Google Scholar]
- Ji, H.; Gao, Z.; Mei, T.; Ramesh, B. Vehicle Detection in Remote Sensing Images Leveraging on Simultaneous Super-Resolution. IEEE Geosci. Remote Sens. Lett. 2020, 17, 676–680. [Google Scholar] [CrossRef]
- Rabbi, J.; Ray, N.; Schubert, M.; Chowdhury, S.; Chao, D. Small-Object Detection in Remote Sensing Images with End-to-End Edge-Enhanced GAN and Object Detector Network. Remote Sens. 2020, 12, 1432. [Google Scholar] [CrossRef]
- Singh, B.; Davis, L.S. An Analysis of Scale Invariance in Object Detection—SNIP. In Proceedings of the 2018 IEEE/CVF Conference on Computer Vision and Pattern Recognition, Salt Lake City, UT, USA, 18–23 June 2018; pp. 3578–3587. [Google Scholar]
- Mostofa, M.; Ferdous, S.N.; Riggan, B.S.; Nasrabadi, N.M. Joint-SRVDNet: Joint Super Resolution and Vehicle Detection Network. IEEE Access 2020, 8, 82306–82319. [Google Scholar] [CrossRef]
- Mandal, M.; Shah, M.; Meena, P.; Devi, S.; Vipparthi, S.K. AVDNet: A Small-Sized Vehicle Detection Network for Aerial Visual Data. IEEE Geosci. Remote Sens. Lett. 2019, 17, 494–498. [Google Scholar] [CrossRef] [Green Version]
- Bai, J.J.; Hong, C.Y. Edge Detect Based on Sobel. Comput. Knowl. Technol. 2009, 5, 5847–5849. [Google Scholar]
- Qi, L.; Huajun, F.; Zhihai, X.; Meijuan, B.; Su, S.; Ruichun, D. Digital image sharpness evaluation function. Acta Photonica Sin. 2002, 31, 736–738. [Google Scholar]
- Kupyn, O.; Budzan, V.; Mykhailych, M.; Mishkin, D.; Matas, J. DeblurGAN: Blind Motion Deblurring Using Conditional Adversarial Networks. In Proceedings of the 2018 IEEE/CVF Conference on Computer Vision and Pattern Recognition, Salt Lake City, UT, USA, 18–22 June 2018; pp. 8183–8192. [Google Scholar]
- Boracchi, G.; Foi, A. Modeling the Performance of Image Restoration From Motion Blur. IEEE Trans. Image Process. 2012, 21, 3502–3517. [Google Scholar] [CrossRef] [PubMed] [Green Version]
- Goodfellow, I.J.; Pouget-Abadie, J.; Mirza, M.; Xu, B.; Warde-Farley, D.; Ozair, S.; Courville, A.; Bengio, Y. Generative Adversarial Networks. In Proceedings the 27th International Conference on Neural Information Processing Systems, Palais des Congrès de Montréal, Montréal, QC, Canada, 8–13 December 2014; Volume 3, pp. 2672–2680. [Google Scholar]
- Szegedy, C.; Ioffe, S.; Vanhoucke, V.; Alemi, A.A. Inception-v4, Inception-ResNet and the Impact of Residual Connections on Learning. In Proceedings of the Thirty-First AAAI Conference on Artificial Intelligence, San Francisco, CA, USA, 4–9 February 2017. [Google Scholar]
- Jolicoeur-Martineau, A. The relativistic discriminator: A key element missing from standard GAN. arXiv 2018, arXiv:1807.00734. [Google Scholar]
- Mao, X.; Li, Q.; Xie, H.; Lau, R.Y.K.; Wang, Z.; Smolley, S.P. On the Effectiveness of Least Squares Generative Adversarial Networks. IEEE Trans. Pattern Anal. Mach. Intell. 2019, 41, 2947–2960. [Google Scholar] [CrossRef] [PubMed] [Green Version]
- Isola, P.; Zhu, J.-Y.; Zhou, T.; Efros, A.A. Image-to-Image Translation with Conditional Adversarial Networks. In Proceedings of the 2017 IEEE Conference on Computer Vision and Pattern Recognition (CVPR), Honolulu, HI, USA, 21–26 July 2017; pp. 5967–5976. [Google Scholar] [CrossRef] [Green Version]
- Zhou, X.; Wang, D.; Krähenbühl, P. Objects as points. arXiv 2019, arXiv:1904.07850. [Google Scholar]
- Neubeck, A.; Van Gool, L. Efficient non-maximum suppression. In Proceeding of the 18th International Conference on Pattern Recognition (ICPR’06), Hong Kong, China, 20–24 August 2006; pp. 850–855. [Google Scholar]
- Newell, A.; Yang, K.; Deng, J. Stacked Hourglass Networks for Human Pose Estimation. In European Conference on Computer Vision; Springer: Cham, Switzerland, 2016. [Google Scholar]
- Lin, T.Y.; Goyal, P.; Girshick, R.; He, K.; Dollár, P. Focal Loss for Dense Object Detection. In Proceedings of the IEEE International Conference on Computer Vision, Venice, Italy, 22–29 October 2017; pp. 2999–3007. [Google Scholar]
- Zhu, P.; Du, D.; Wen, L.; Bian, X.; Ling, H.; Hu, Q.; Peng, T.; Zheng, J.; Wang, X.; Zhang, Y. VisDrone-VID2019: The Vision Meets Drone Object Detection in Video Challenge Results. In Proceedings of the IEEE/CVF International Conference on Computer Vision Workshops, Seoul, Korea, 27–28 October 2019. [Google Scholar]
- Wu, Y.; Zhang, H.; Li, Y.; Yang, Y.; Yuan, D. Video Object Detection Guided by Object Blur Evaluation. IEEE Access 2020, 8, 208554–208565. [Google Scholar] [CrossRef]


| Clear Image | Entropy Value | Blurred Image | Entropy Value |
|---|---|---|---|
 | 7.15 |  | 4.85 |
 | 6.19 |  | 5.31 |
| Methods | Backbone | Car | Bus | Van | Truck | Tricycle | Tricycle with an Awning | mAP (%) |
|---|---|---|---|---|---|---|---|---|
| Faster R-CNN [28] | ResNet-50 | 25.68 | 25.80 | 8.87 | 14.69 | 1.16 | 1.83 | 13.00 |
| SSD [30] | VGG-16 | 26.05 | 30.44 | 8.40 | 17.09 | 2.55 | 2.97 | 14.58 |
| YOLOv3 [31] | Darknet53 | 60.68 | 41.87 | 20.37 | 26.22 | 12.98 | 6.20 | 28.05 |
| YOLOv4-thiny [32] | CSPDarknet-thiny | 24.67 | 29.62 | 5.71 | 13.73 | 3.07 | 1.34 | 13.02 |
| CenterNet [47] | Hourglass | 61.61 | 40.45 | 23.01 | 26.90 | 11.38 | 8.42 | 28.63 |
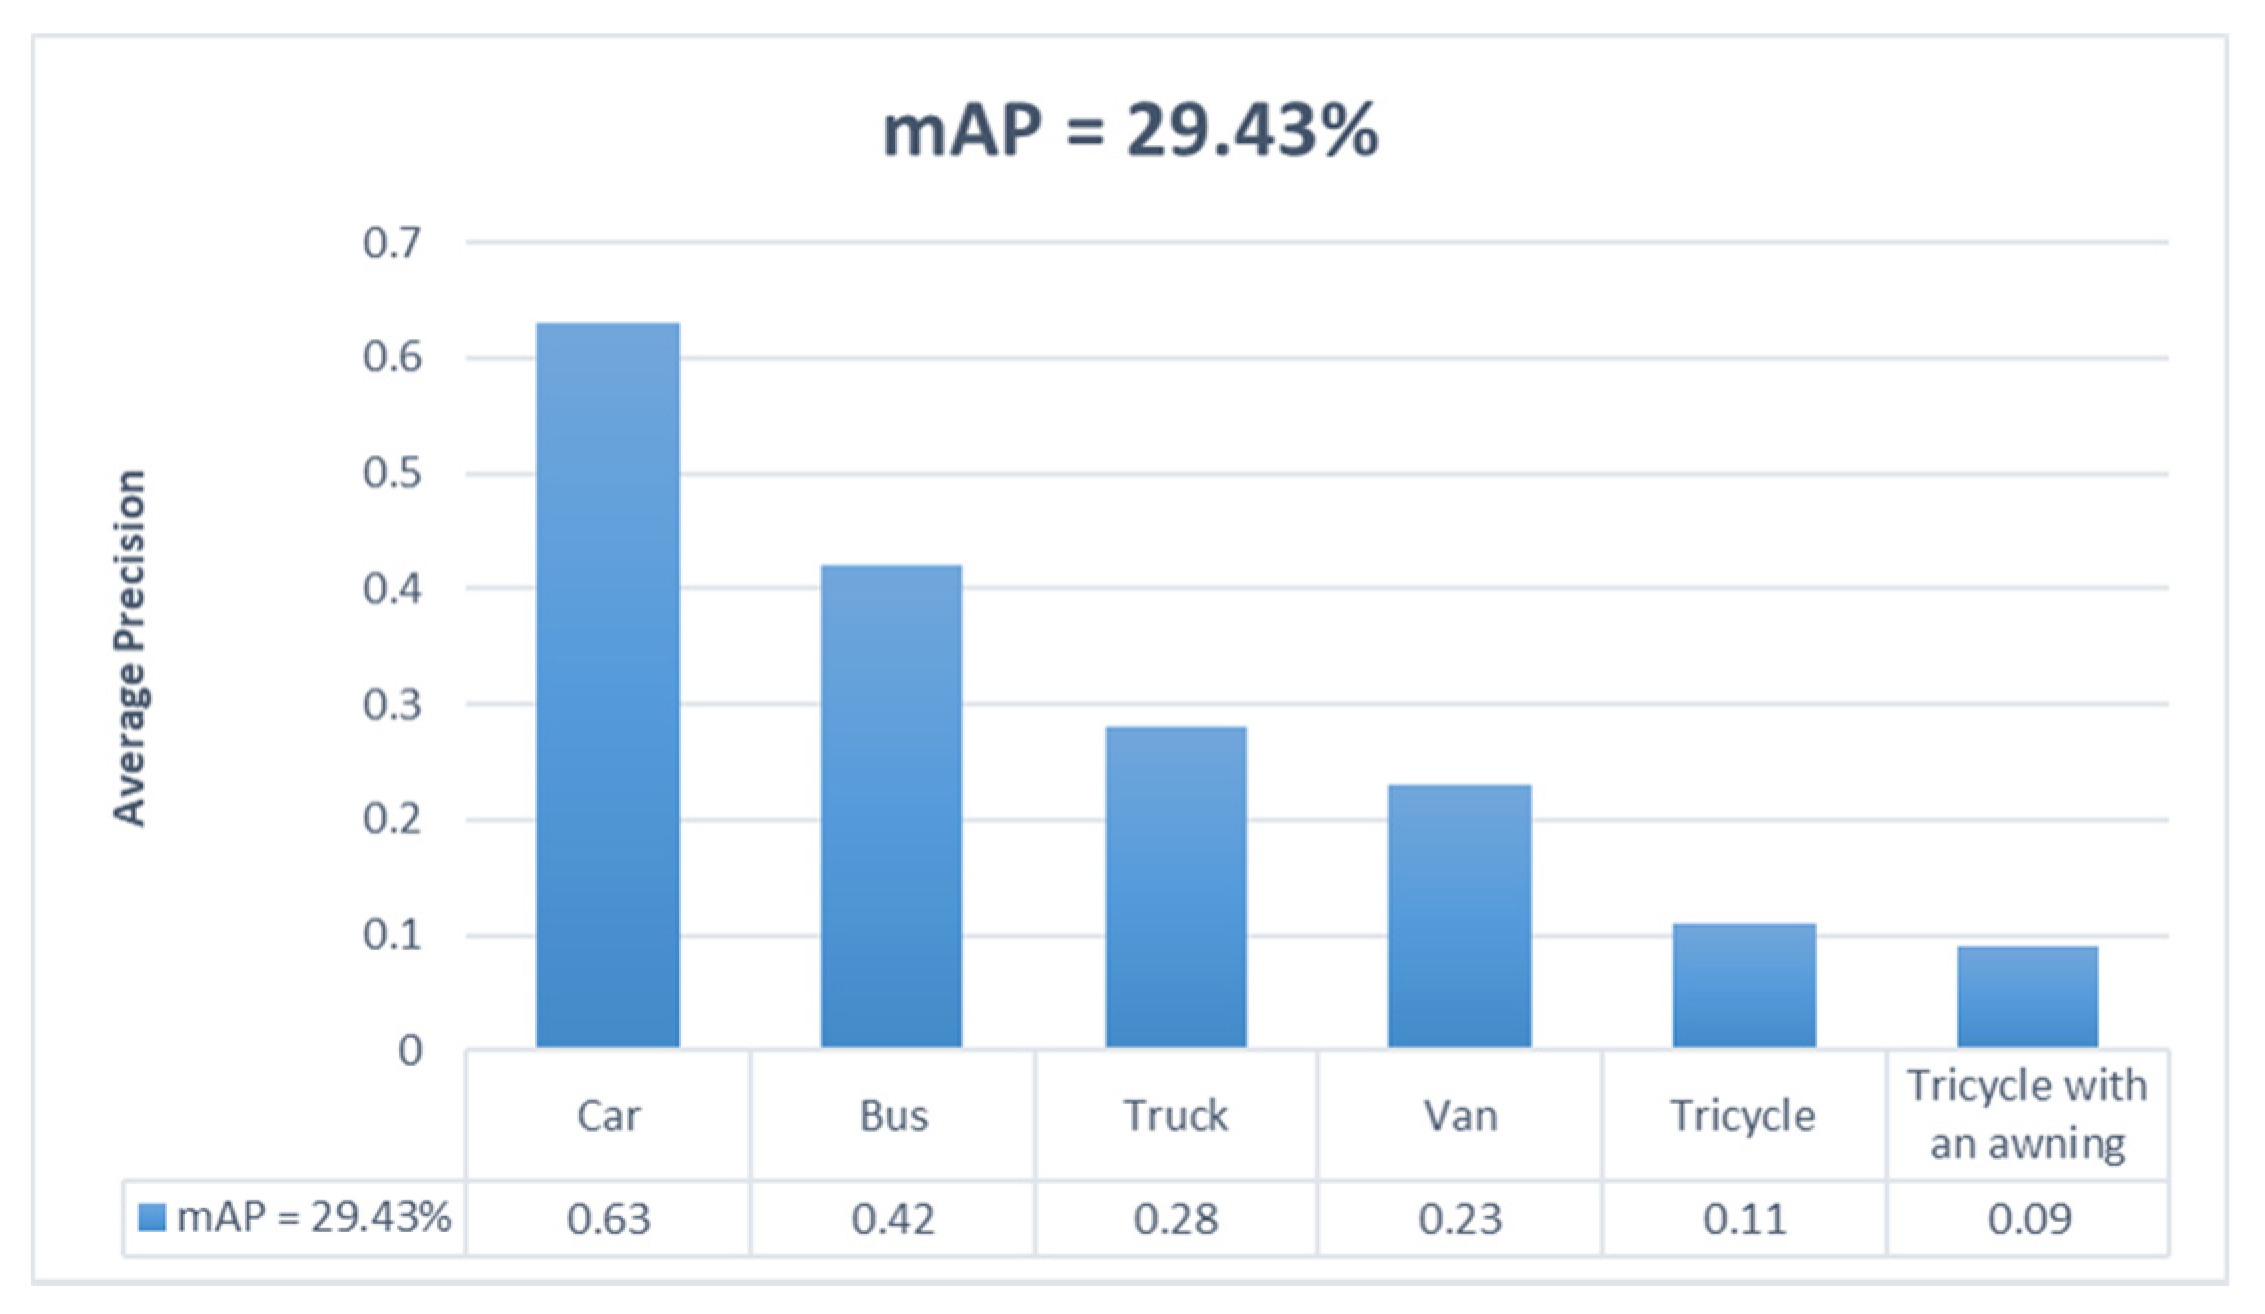
| DCNet | Hourglass | 62.70 | 42.19 | 23.42 | 28.39 | 11.18 | 8.72 | 29.43 |
| Methods | mAP | F1 Score |
|---|---|---|
| Centernet | 28.63 | 28.83 |
| Drone-GAN + CenterNet | 29.43 | 29.50 |
Publisher’s Note: MDPI stays neutral with regard to jurisdictional claims in published maps and institutional affiliations. |
© 2021 by the authors. Licensee MDPI, Basel, Switzerland. This article is an open access article distributed under the terms and conditions of the Creative Commons Attribution (CC BY) license (https://creativecommons.org/licenses/by/4.0/).
Share and Cite
Liu, Y.; Wang, J.; Qiu, T.; Qi, W. An Adaptive Deblurring Vehicle Detection Method for High-Speed Moving Drones: Resistance to Shake. Entropy 2021, 23, 1358. https://doi.org/10.3390/e23101358
Liu Y, Wang J, Qiu T, Qi W. An Adaptive Deblurring Vehicle Detection Method for High-Speed Moving Drones: Resistance to Shake. Entropy. 2021; 23(10):1358. https://doi.org/10.3390/e23101358
Chicago/Turabian StyleLiu, Yan, Jingwen Wang, Tiantian Qiu, and Wenting Qi. 2021. "An Adaptive Deblurring Vehicle Detection Method for High-Speed Moving Drones: Resistance to Shake" Entropy 23, no. 10: 1358. https://doi.org/10.3390/e23101358
APA StyleLiu, Y., Wang, J., Qiu, T., & Qi, W. (2021). An Adaptive Deblurring Vehicle Detection Method for High-Speed Moving Drones: Resistance to Shake. Entropy, 23(10), 1358. https://doi.org/10.3390/e23101358