Entropy-Based Approach for the Detection of Changes in Arabic Newspapers’ Content


Abstract
1. Introduction
2. Background Knowledge
3. Evolutionary Model of the Publishing Process
- Embedding step: At the outset, each word in all issues is transformed into a d-dimensional vector according to the appropriate column in the matrix . Subsequently, each issue is converted to a two-dimensional array by sequentially concatenating the corresponding vector representations of its words.
- Semantic issues’ pattern: As was mentioned, the intention of a word embedding procedure is to convert words with similar contexts to have close spatial shapes. A similarity measure between real-valued vectors (like cosine or the Euclidean distance) provides an accepted tool to quantify the words’ semantical relationship. As an issue is composed of words, the similarity between words can typify its semantical structure. The Euclidean distance takes into account a vector magnitude, while the cosine similarity depends on just the angle between the vectors. Therefore, this measure is more robust to changes in the frequencies of the semantically similar word, whereas the magnitude is sensible to occurrences and neighborhood diversity. For this reason, the resulting vectors of “semantically similar” terms produced, for example, by the Word2vec procedure may be close in cosine similarity, but still have a sizeable Euclidean distance between them.From this point of view, the -similarity between adjacent words can represent the desired semantic configuration. Keeping it up, each issue is represented by its pattern distribution being a distribution of the -similarities calculated within a window with size l sliding in the increment of h over the columns of the corresponding matrix .Semantic change model: The collection of the pattern distributions of the -similarities found for neighboring terms represents the daily under consideration. For a given issue , introduce:where T denotes the number of several “precursors” involved in the assessment. According to the model under consideration, a semantic change does not occur if two collections and are identically distributed, i.e., the connection between contiguous words is kept. Thus, the model deals with the classical hypothesis testing to determine if two underlying distributions are equal. An essential tool to verify this is a two-sample test intended to check if two samples are drawn from the same population. However, we compare two substantially differently-sized sets. Obviously, the size of is expected to be approximately T times larger than . To overcome this problem, the multiple testing metrology can be applied. Specifically, let us select a natural number N and a two-sample test H returning within its output parameters the resulting p-value. A multiple-test procedure consists of the following steps presented in Algorithm 1.
Algorithm 1 Constructing representative sets: Input: - : two sets to be tested;
- H: two-sample test;
- : sample size;
- N: number of samples drawn.
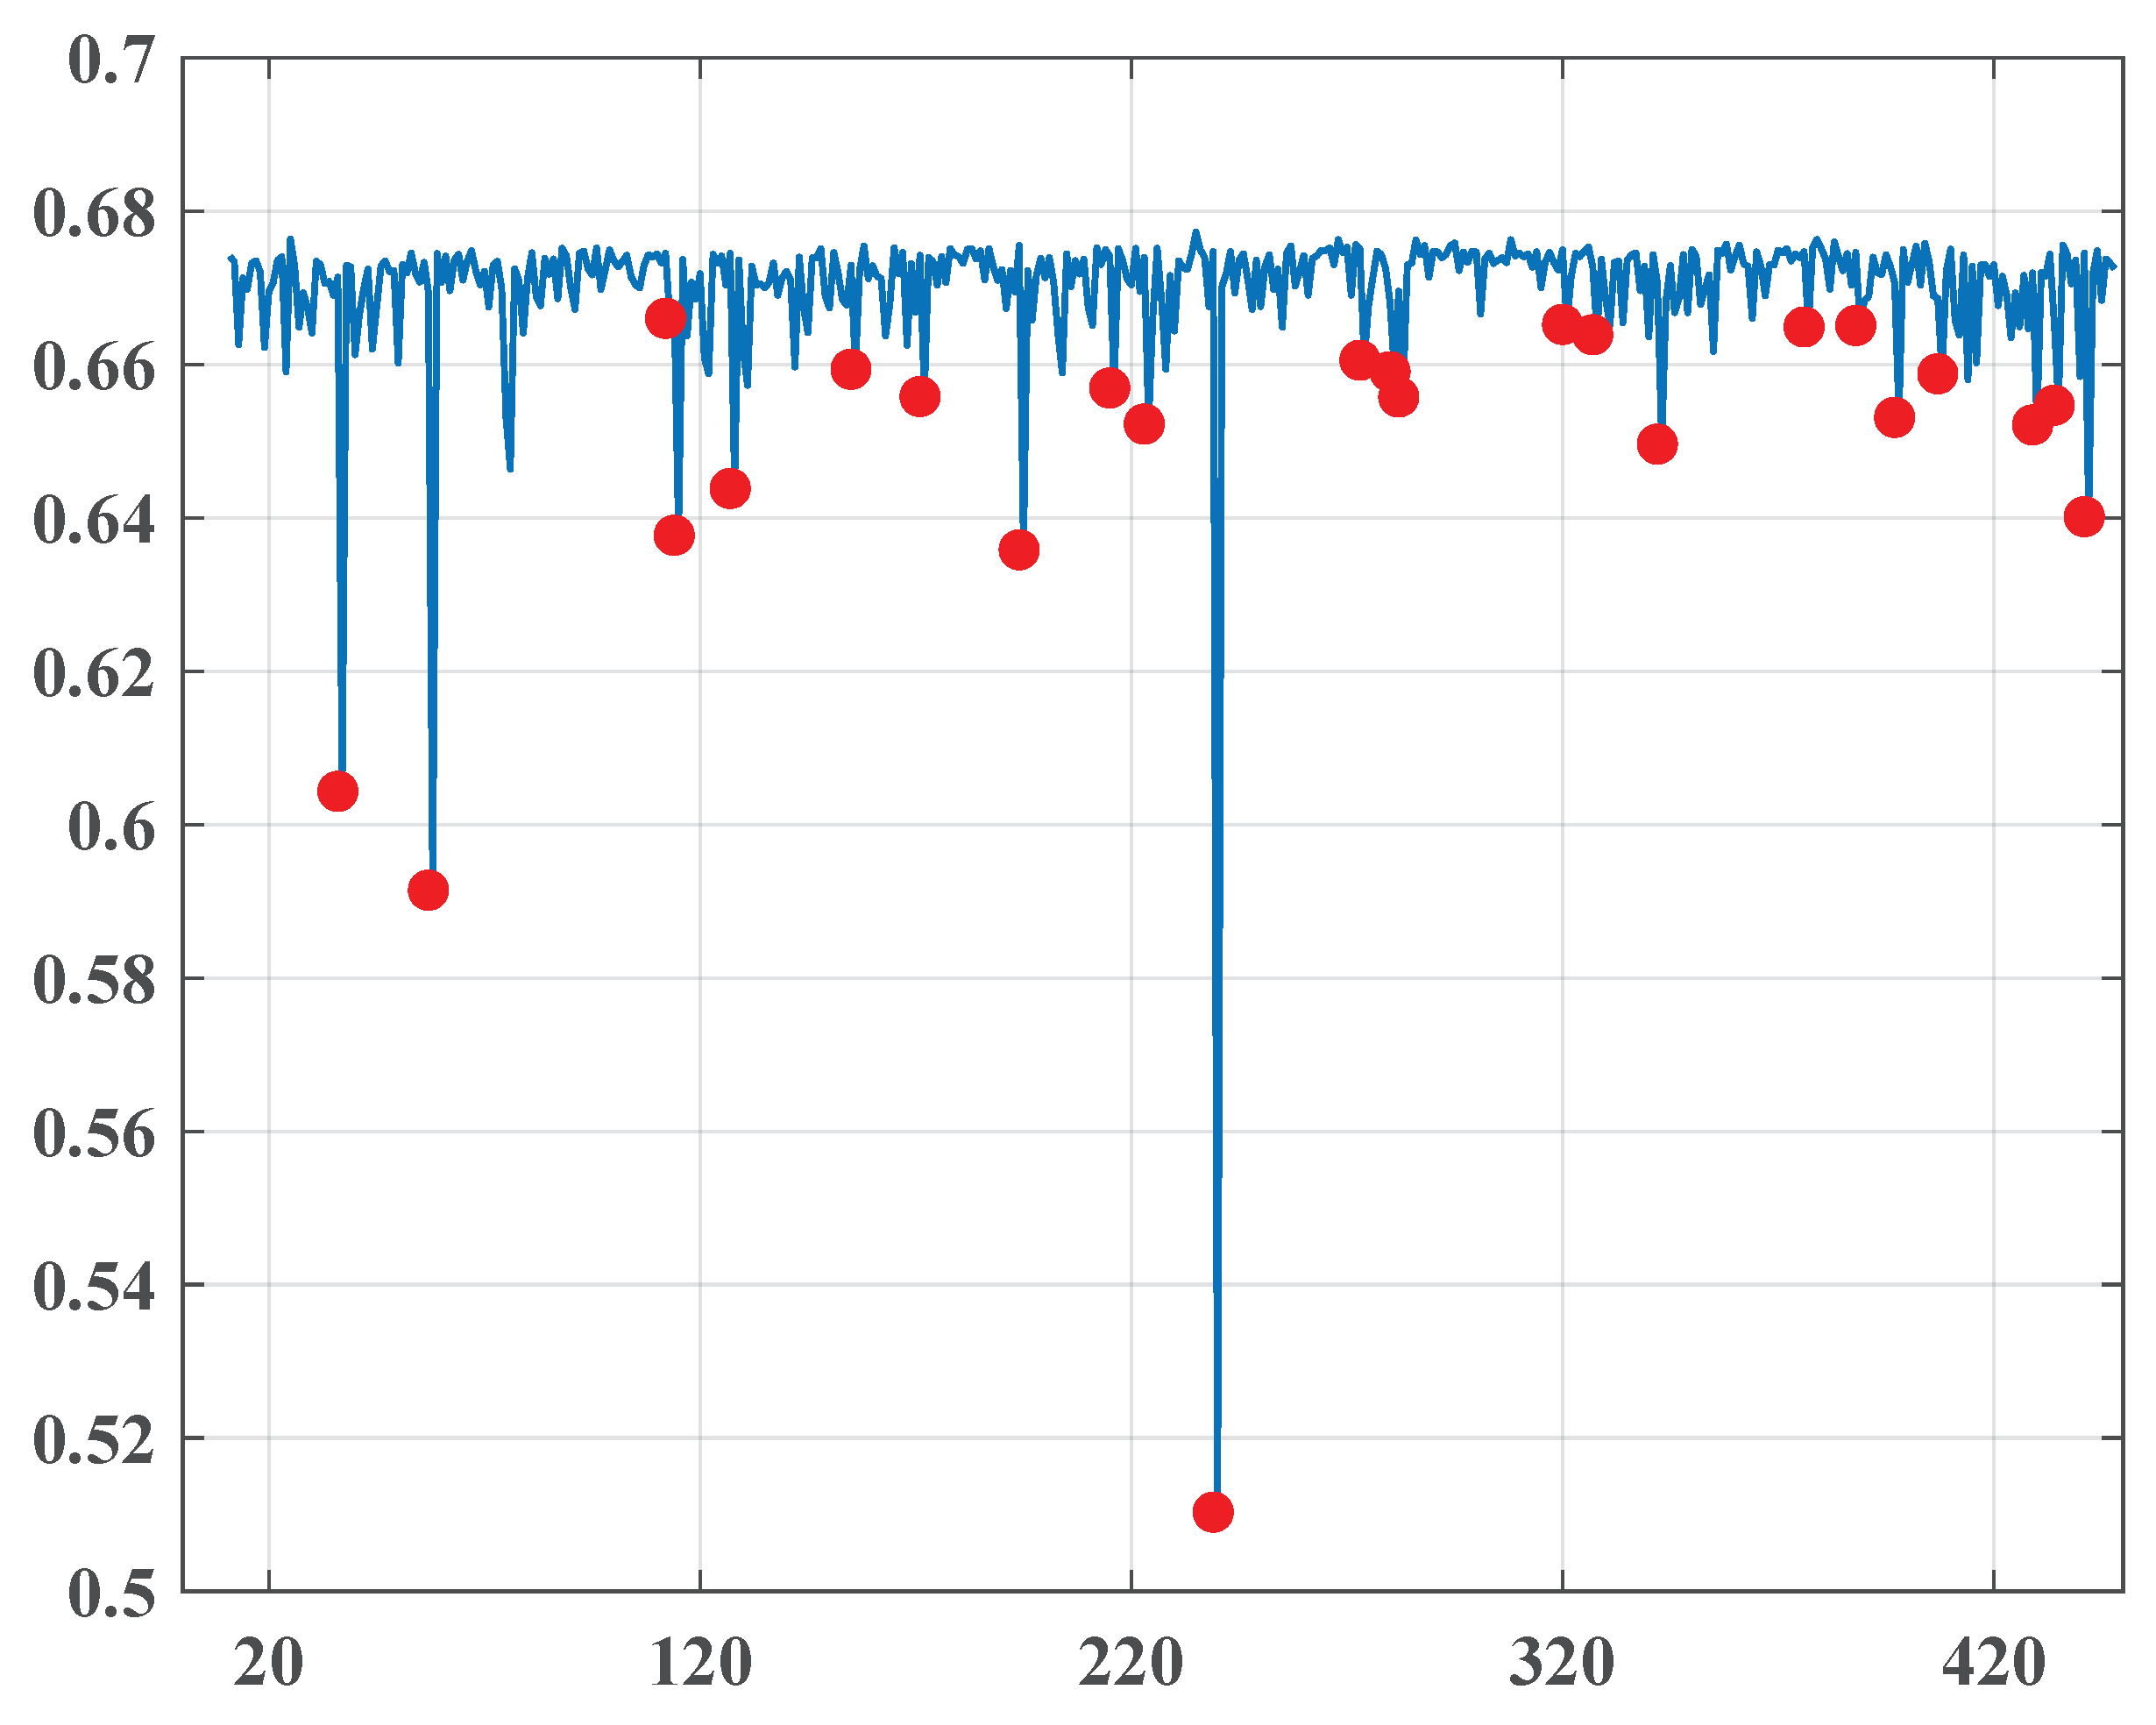
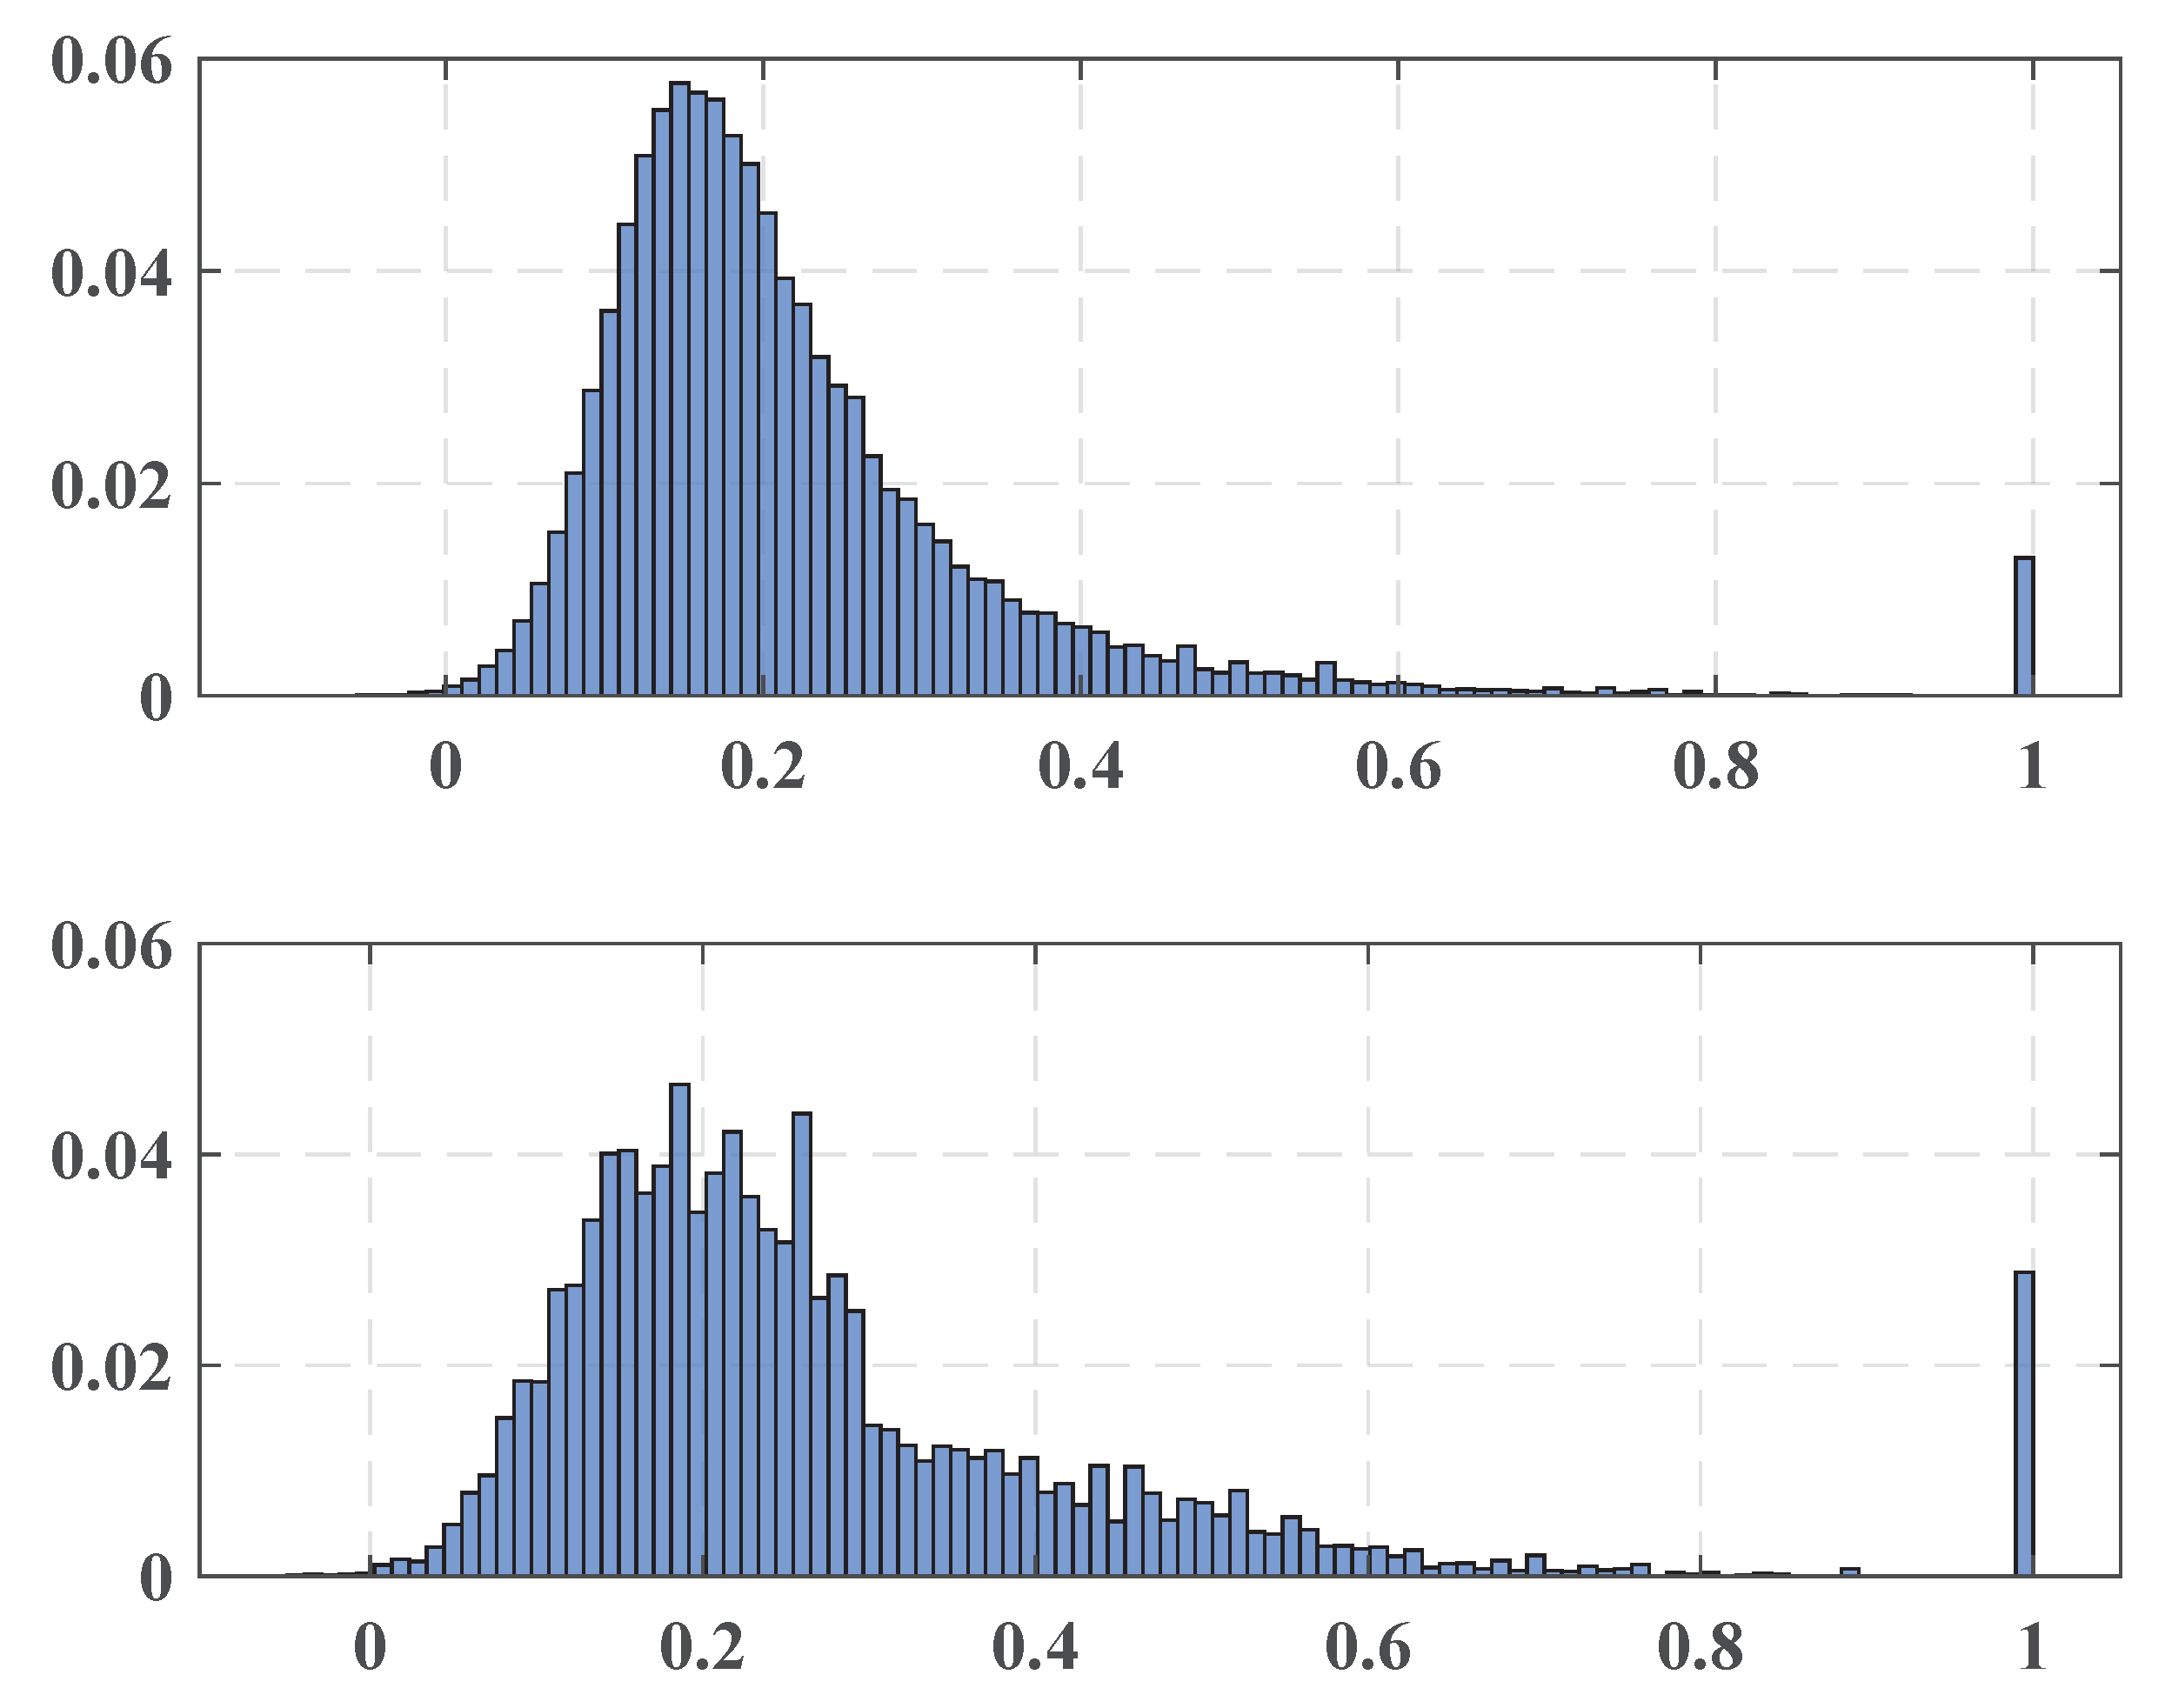
Procedure: Repeat N times: Draw random sample without replacement from with size. Apply H, and obtain the current p-value Return the array p Thus, the stylistic relationship between the issue and its T “precursors” is represented as a set:of the calculated p-values. - Entropic time series: In our approach, the null hypothesis about the equality of the primary distributions of and is tested against the alternative hypothesis stating the difference of the distributions. As was mentioned in Section 2, the distribution of the p-values found here is uniform in if the null hypothesis is true. As a result, the stationary behavior of semantic sets is characterized by their sufficiently high entropy, and a reduction of the entropy value indicates a change in the language content and probably a change in the social state. Consecutive assessment of such entropy values leads to the following time series (one-dimensional signal):exposing the semantic evolution of the newspaper. Normalization by the maximal entropy value is provided, aiming to standardize the entropy behavior for different sample sizes. Therefore, the stable signal corresponds to the steady linguistic content of the newspaper, and its acute falling indicate changes in one.
- Anomaly detection: Anomalous falls of a signal may specify the desired change points, and therefore, an anomaly detection method is an essential tool for this purpose. In this paper, the standard modified Thompson Tau test [19] is applied. The mentioned method is a famous process intended to recognize outliers in a set. The approach supplies a statistically clarified rejection zone to decide if a data point is an outlier resting upon the standard data deviation and the average. This method consists of the following: Let X be a vector of size n. Denote by the average of X and by the standard deviation of X. The rejection threshold is determined using the formula:where is the critical value from the Student distribution based on significance level and degree of freedom . For each data point , the value is calculated as:and then, if , a data point is recognized as an outlier, else (if ) a data point is not considered as an outlier.The described procedure is applied in our model in the following manner. Locating at the position i corresponding to the current issue , we construct a sequence containing “precursors” of and this value itself. In the following step, the standard modified Thompson Tau test checks if is an outlier in the constructed series.
| Algorithm 2 |
| Input: |
|
| Procedure: |
|
4. Numerical Experiments
4.1. Material
- “Al-Ahraam”, (“The Pyramids, Egypt”);
- “Akhbaar Al-Khaleej”, (“The News of the Gulf Bahrain”);
- “Al-Ghad”, (“The Tomorrow Jordan”).
4.2. Parameters’ Selection
4.3. Results
4.3.1. “Al-Ahraam”
- 1.1.2010–31.12.2011.
- 1.1.2014–30.6.2014.
- October, November-2010
- October 27, 2010
- November 17, 2010
Note that the points are quite far from each other, so their occurrence may not be directly associated with significant social changes, although they are located quite close to the date of the parliamentary elections in Egypt on 28.11.2010 and may correspond to the expectations of possible changes. Demonstrations and uprisings swept across the whole country as citizens complained of suspected fraud in parliamentary elections. The protests were sustained by local and international human rights groups. - January-2011
- January 11, 2011
- January 13, 2011
- January 26, 2011
This quite dense group of change points very well predicts 25.1.2011 (the “Day of Revolt”) of the famous January 25 Revolution, which began on 25.1.2011 and unfolded across Egypt. Abundant, mainly non-violent demonstrations, apparently encouraged by Tunisian street protests, exploded throughout the country, demanding the resignation of President Hosni Mubarak and led to his resignation on the night of 11.2.2011. - February, March-2011
- February 23, 2011
- March 11, 2011
The interim Cabinet of Ministers was sworn in on 22.2.2010. This cabinet incorporated the opposition delegates, but Mubarak’s appointees still held some critical positions that caused new demonstrations demanding their removal. The event is visibly connected to the first point set on 23.2.2011.The second point is clearly associated with the events that followed. On 3.3.2011 and 7.3.2011, Prime Minister Ahmed Shafiq retained by Mubarak resigned and was replaced by Essam Sharaf, known as a Mubarak’s opponent. Moreover, the new government did not contain persons closely associated with Mubarak. - April-2011
- April 3, 2011
- April 24, 2011
On Friday, 1.4.2011, a large number of demonstrators filled Tahrir Square after prayers with the demand to “Save the Revolution” to the governing military council. On 9.4.2011, the army applied force to expel people, killing two and wounding many. Finally, on 13.4.20111, Egypt’s State Prosecutor ordered that Mubarak and his sons Alaa and Gamal be detained for 15 days for questioning. - May-2011
- May 2, 2011
- May 18, 2011
On 5.5.2011, former Egyptian Interior Minister Habib al-Adli was sentenced to 12 years in prison for corruption. He was convicted after removing Mubarak from his post and was awaiting trial for allegedly ordering security forces to fire at protestants. On 24.5.2011, Egypt’s Public Prosecutor declared that Mubarak and his sons Alaa and Gamal would stand trial for ordering security forces to shoot protesters and for corruption. Apparently, these dramatic changes in the political status of the elite associated with the former President caused a great change in the pro-government media. This fact is reflected by the sharpest fall of the entropy (0.512) in the whole considered period on 18.5.2011. - June-2011
- June 21, 2011
- June 28, 2011
- June 30, 2011
These change points are precisely associated with a exciting social explosion in the summer of 2011. Thousands of black-dressed Egyptians took part in marches on 6.6.2011 to honor Khaled Saeed. The protests continued so that on 28.6.2011, a bloody clash resulting in numerous victims happened in central Cairo between demonstrators and security forces. Further, the “Friday of Retribution” took place on 1.7.2011 when crowds in Suez, Alexandria, and Tahrir Square in Cairo expressed deep disappointment with the governing of the Supreme Council of the Armed Forces. Similar rallies, named the “Friday of Determination” and the “March of the Million”, happened on 8.7.2011 in Suez, Alexandria, Cairo, and other cities. - August-2011
- August 7, 2011
- August 21, 2011
Apparently, each one of the occurred points related to different events. The first one could be associated with the first time Mubarak had a public appearing as his trial commenced in Cairo amid heavy security. Due to a large number of lawyers in court representing the families of slain protesters, the media desperately covered the process that is expressed by the first change point. Eight people were killed on 18.8.2011 in a shooting attack on an Israeli bus near the Egyptian border. During the incident, five Egyptian police officers were also killed by the Israeli side, which caused public outrage in Egypt. As a result, Egypt declared that it would withdraw its ambassador to Israel. Protests happened at the Israeli Embassy in Egypt. The crisis produced by the attack was understood as a signal for worsening relations between the two countries in the post-Mubarak era and reflected by the content change on 21.8.2011. - October-2011
- October 2, 2011
- October 14, 2011
- October 23, 2011
On the evening of 9.10.2011, Coptic Christians mobilized in Cairo to protest the burning of a church in Upper Egypt and to demand the resignation the Supreme Council of the Armed Forces together with the chairman, Field Marshal Mohamed Tantawi, and the superintendent of Aswan province. In the attack undertaken by policy, about 25 people were killed and about 200 injured. Moreover, the army forces also captured “Al-Hurra TV” station and “25 January TV stations”. The State Media was requested to cover these events in a benevolent manner for the military junta. A change points group seemingly appeared as a response to this request. - November-2011
- November 24, 2011
- November 29, 2011
The second half of November symbolized the resumption of a harsh confrontation between demonstrators and the authorities in reaction to the military power unilaterally announcing a super-constitution. As a result, on Saturday 19.11.2011, many people suffered during the demonstration crackdown. This notwithstanding it, the Supreme Council asserted that the parliamentary elections would start as planned on 28.11.2011. The cabinet headed by Prime Minister Essam Sharaf walked out as a protest against this decision and the decision to use force against the protesters. An agreement for a new interim government was achieved on the following day 22.11.2011. - December-2011
- December 6, 2011
It is doubtful that this fairly isolated point reflected a significant change in style. Supposedly, this could be associated with a local style fluctuation as a reaction to the continuing civil protests and the results published on 30.11.2011 of the first round of the parliamentary elections, demonstrating the overwhelming advantage of the Muslim Brotherhood’s Freedom and Justice Party and another hard-line Islamist party, the Nūr Party.
- January-2014
- January 11, 2014
- January 12, 2014
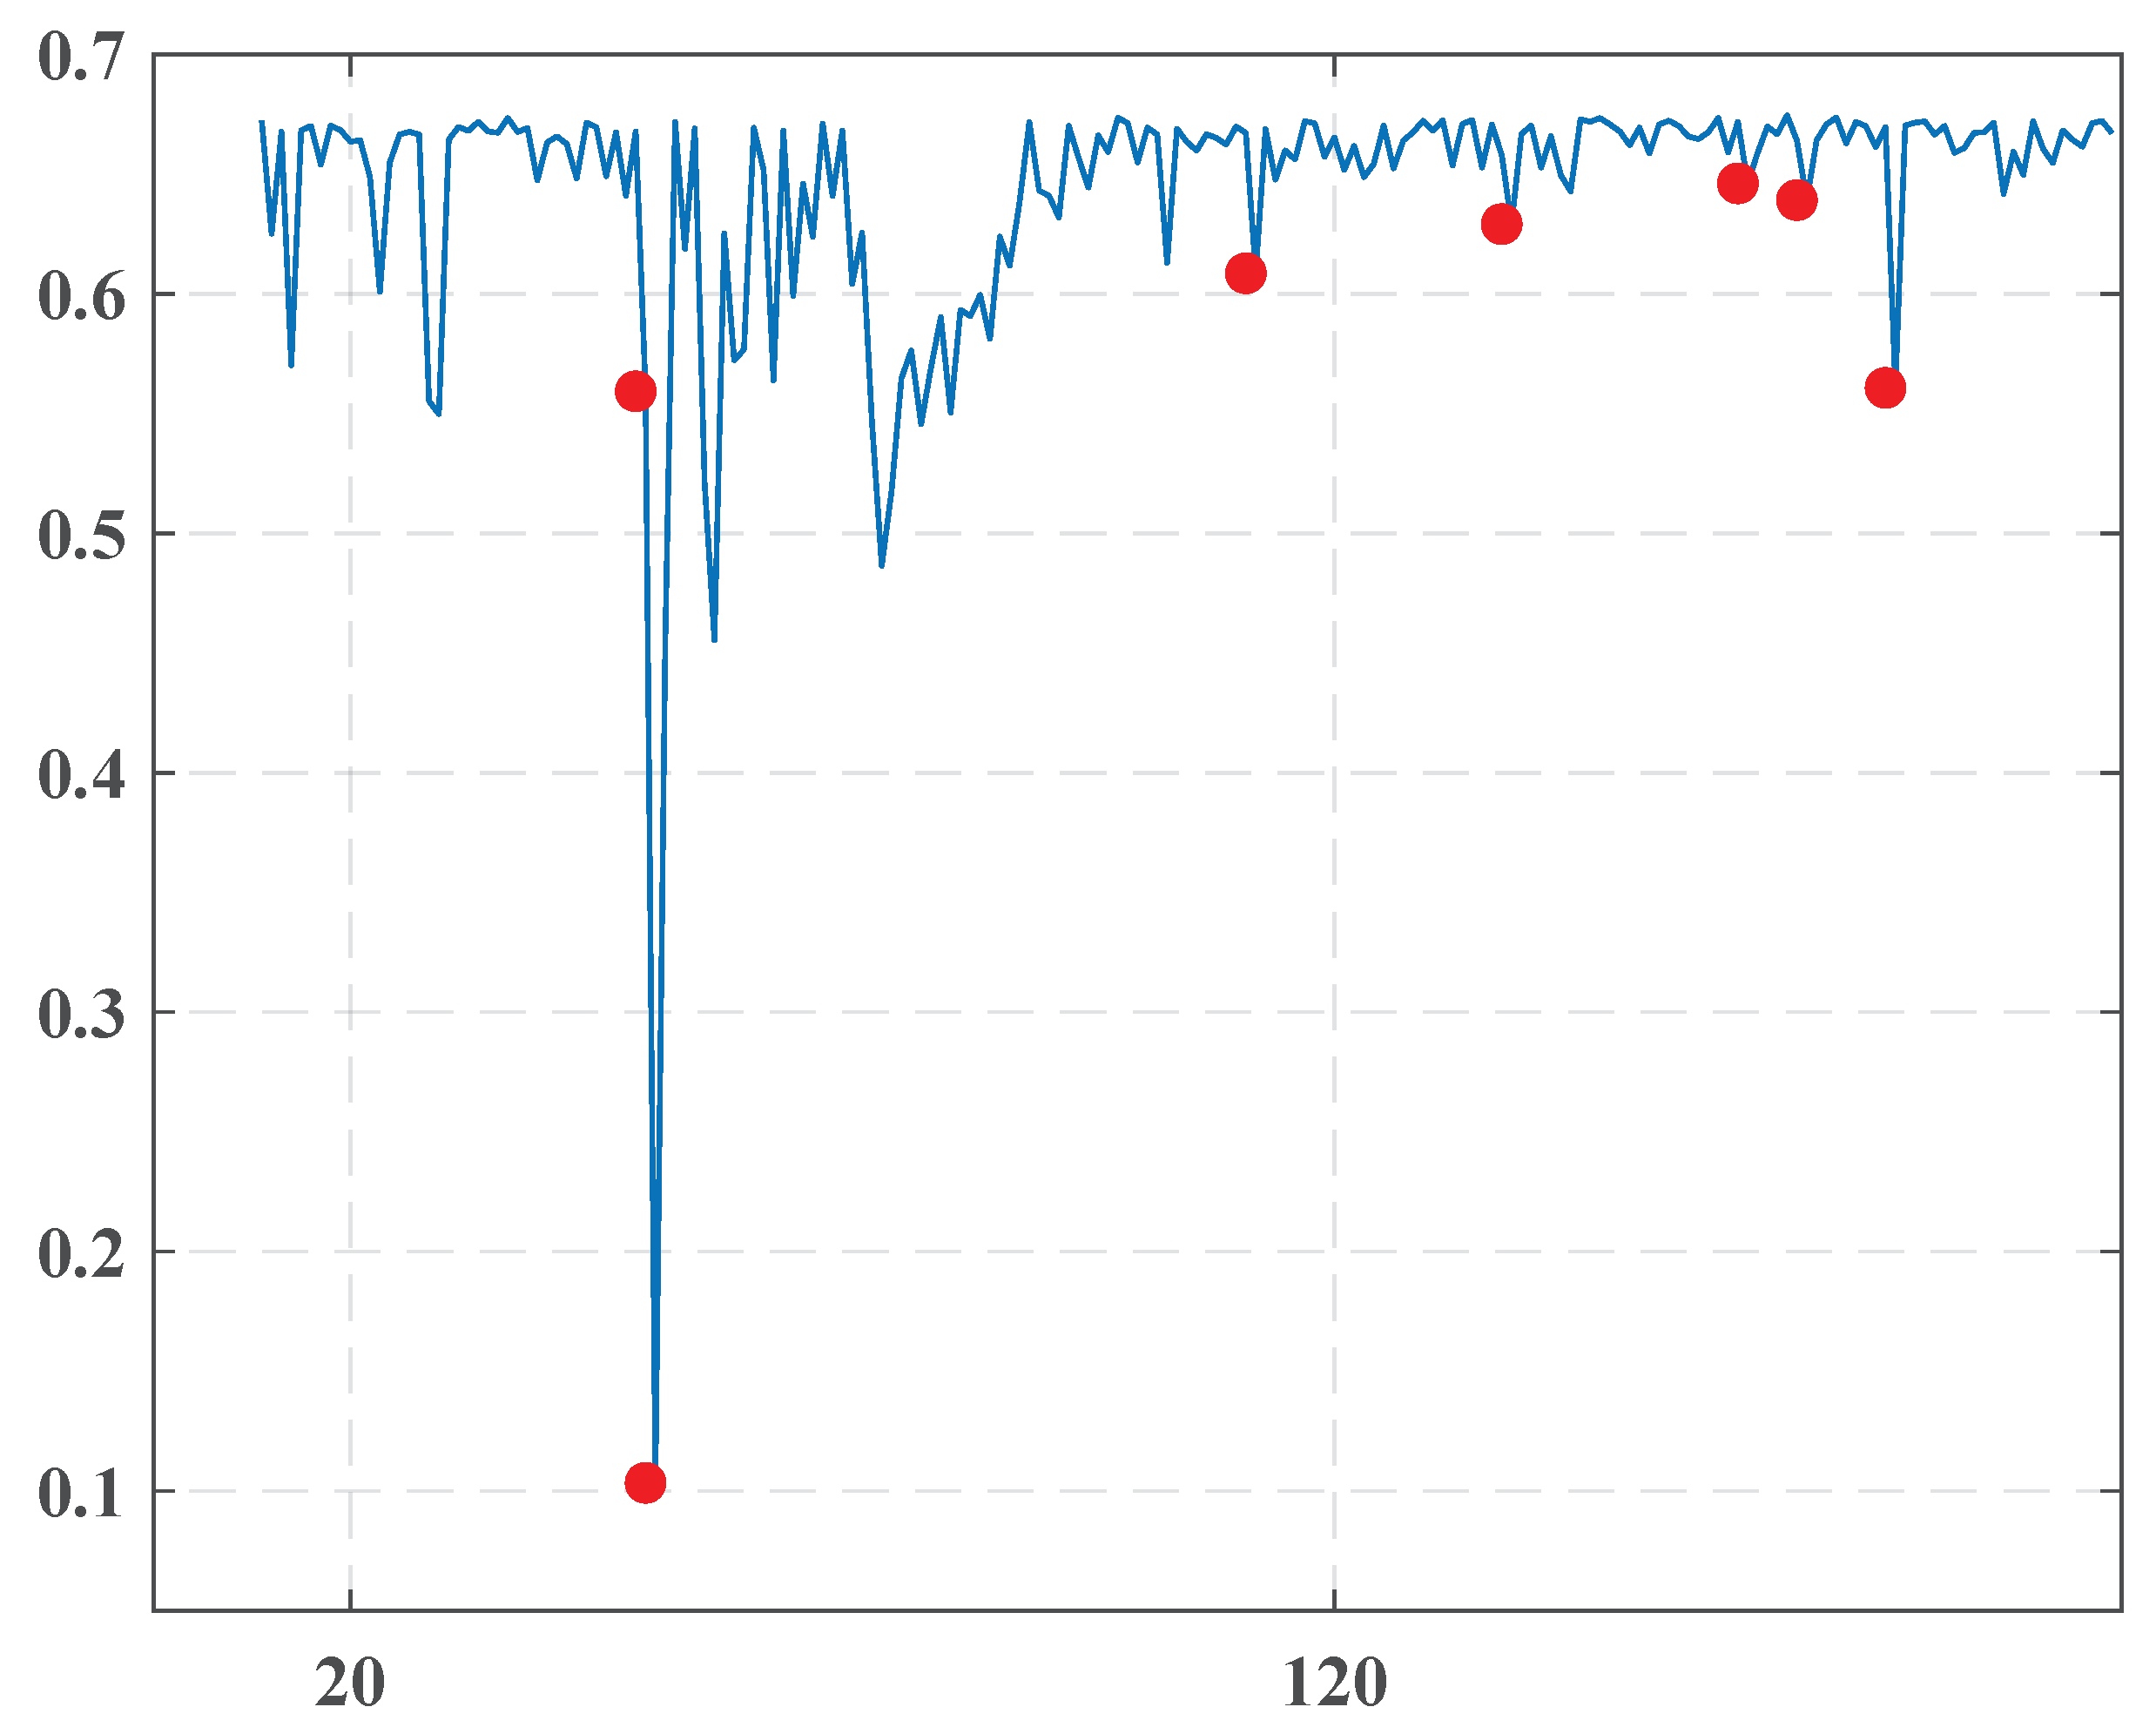
This dense group with a very sharp drop of the entropy on 12.1.2014 is naturally connected to a constitutional referendum in Egypt held on 14.1.2014 and 15.1.2014, where 98.1% of voters approved the new constitution. The nomination of the new Editor and Editor-in-Chief of “Al-Ahraam” happened on 2.1.2014 completely changed the pro-government coverage of the political situation and really predicted the results of the plebiscite. - March-2014
- March 16, 2014
Presumably, this isolated change point foresaw a verdict of an Egyptian court, which condemned 529 followers of the Muslim Brotherhood to death on 24.3.2014. - April-2014
- April 11, 2014
It is difficult to interpret this isolated point with certainty. Perhaps its occurrence could be associated with the violent clashes that took place in Egypt in April 2014. However, there probably is no direct link. - May-2014
- May 5, 2014
- May 11, 2014
- May 20, 2014
These points are undoubtedly related to a presidential election in Egypt in the period from 26.5.2014 to 28.5.2014. Abdel Fattah al-Sisi was voted in with 97% of the electors, consistent with the Egyptian official declaration. The President was sworn into office on 8.6.2014.
4.3.2. “Akhbaar Al-Khaleej ”
- December-2010
- December 5, 2010
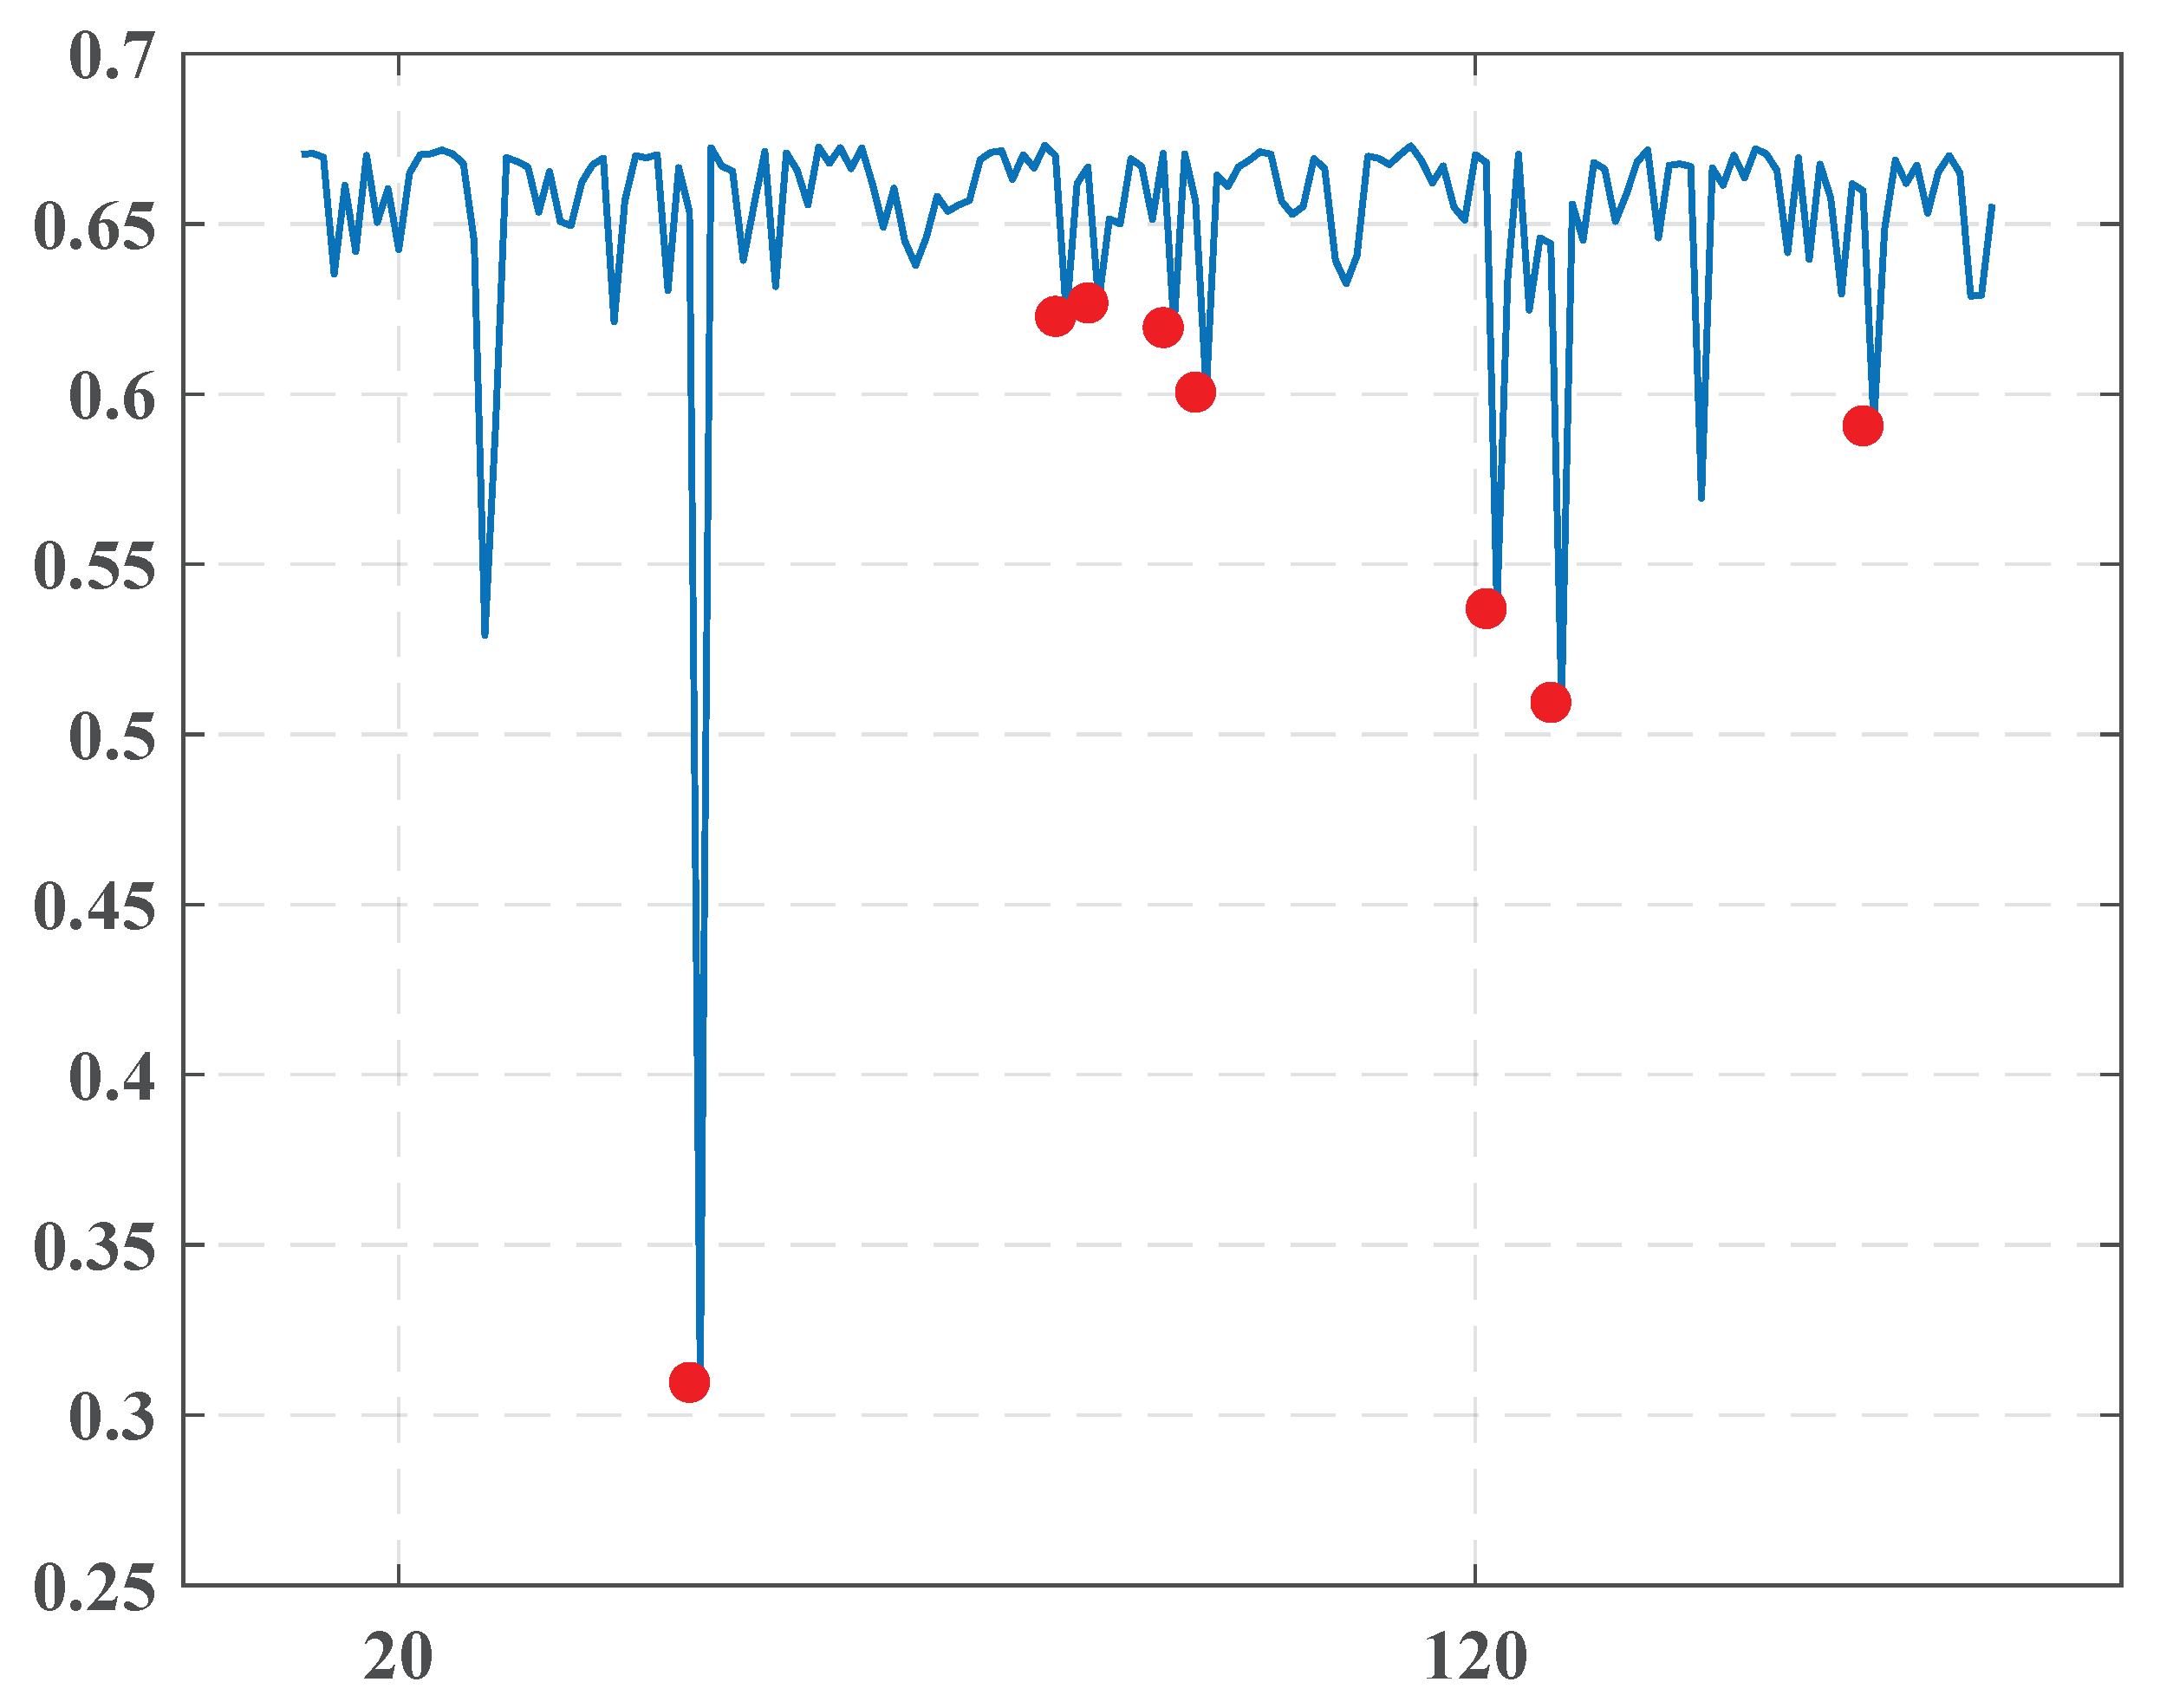
Although a significant entropy drop characterized this point, we have not found any critical event connected to this date. We could suppose that this occurred due to internal changes in the newspaper’s management. - February-2011
- February 17, 2011
- February 23, 2011
The presented group is obviously related to the protests that began on 14.2.2011. They led to a violent reaction from security forces with many victims within the Shia Muslim protesters.Uprisings extended to March with growing aggression from both sides. The Saudi-led intervention in Bahrain on 14.3.2011 was intended to support the Bahraini government in suppressing an anti-government revolt. The famous 16.3.20 crackdowns started from the capture of the government supporters, the University of Bahrain, and continued as a big media company aimed to chastise and discredit the protesting process. All these events are reflected by a change point arising in March 2011. - March-2011
- March 25, 2011
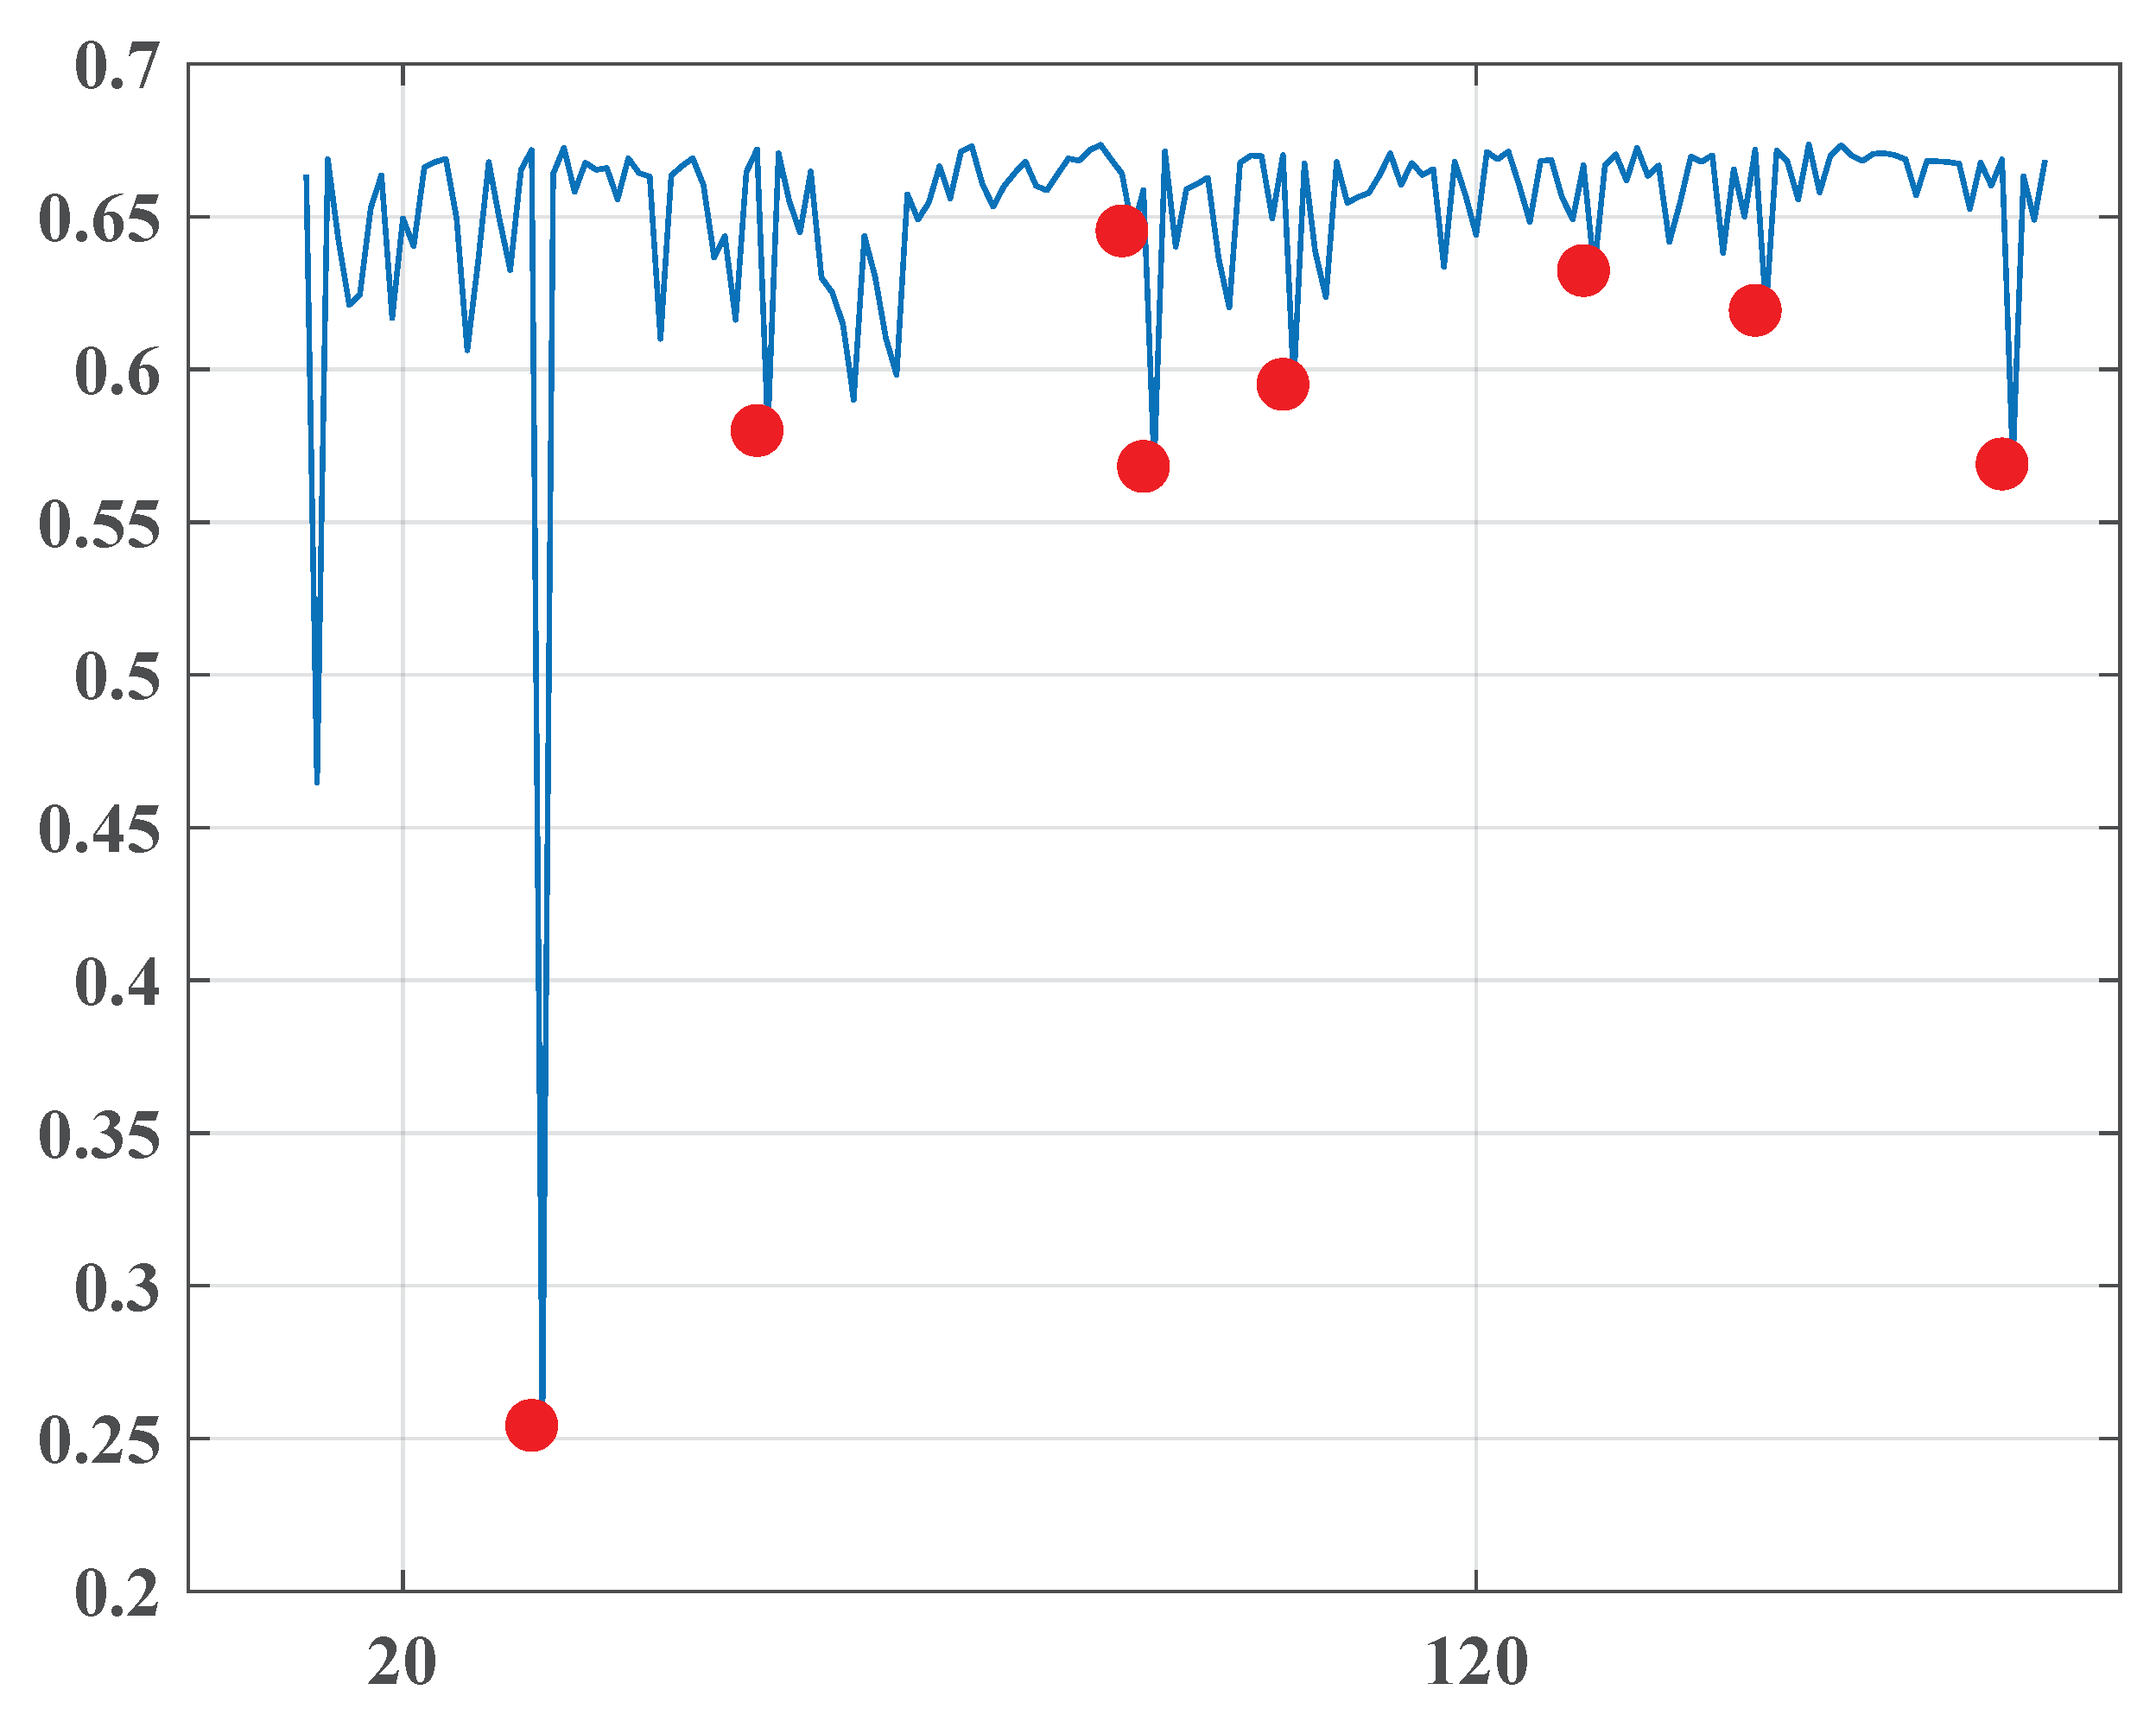
4.3.3. “Al-Ghad”
- November, December-2010
- November 17, 2010
- December 8, 2010
There seemed to be a reaction to the 2010 Jordanian general election, which took place on 9.11.2010 behind the suspension of the previous parliament by King Abdullah II in November 2009. A wide range of parties boycotted the voting. - January-2011
- January 11, 2011
- January 13, 2011
- January 26, 2011
These dates correlated very well to the events of the Arab Spring in Jordan. The first demonstration was in Dhiban village on 7.1.2011 and was echoed in the capital city of Amman on 14.1.2011. On 28.1.2011, about 3500 protestors organized a demonstration with intense demands to improve significantly the economic situation in the State and make Prime Minister Samir Rifai step down. - March, April-2011
- March 11, 2011
- April 8, 2011
Like the first group, it could be connected to the continuing protests in Jordan.
5. Conclusions and Discussion
Author Contributions
Funding
Conflicts of Interest
References
- Franch, F. (Wisdom of the Crowds)2: 2010 UK Election Prediction with Social Media. J. Inf. Technol. Politics 2013, 10, 57–71. [Google Scholar] [CrossRef]
- Leiter, D.; Murr, A.; Ramrez, E.R.; Stegmaier, M. Social networks and citizen election forecasting: The more friends the better. Int. J. Forecast. 2018, 34, 235–248. [Google Scholar] [CrossRef]
- Wang, X.; Brown, D.E.; Gerber, M.S. Spatio-temporal modeling of criminal incidents using geographic, demographic, and twitter-derived information. In Proceedings of the 2012 IEEE International Conference on Intelligence and Security Informatics, Arlington, VA, USA, 11–14 June 2012. [Google Scholar]
- Gerber, M. Predicting Crime using Twitter and Kernel Density Estimation. Decis. Support Syst. 2014, 61, 115–125. [Google Scholar] [CrossRef]
- Korolov, R.; Lu, D.; Wang, J.; Zhou, G.; Bonial, C.; Voss, C.; Kaplan, L.; Wallace, W.; Han, J.; Ji, H. On predicting social unrest using social media. In Proceedings of the 2016 IEEE/ACM International Conference on Advances in Social Networks Analysis and Mining, ASONAM 2016, San Francisco, CA, USA, 18–21 August 2016; pp. 89–95. [Google Scholar]
- Kalyanam, J.; Quezada, M.; Poblete, B.; Lanckriet, G. Prediction and Characterization of High-Activity Events in Social Media Triggered by Real-World News. PLoS ONE 2016, 11, 1–13. [Google Scholar] [CrossRef] [PubMed]
- Kerr, N.L.; Tindale, R.S. Group-based forecasting?: A social psychological analysis. Int. J. Forecast. 2011, 27, 14–40. [Google Scholar] [CrossRef]
- El-Issawi, F. Arab National Media and Political Change, “Recording the Transition”; Springer: Berlin/Heidelberg, Germany, 2016; pp. 89–95. [Google Scholar]
- Volkovich, Z.; Granichin, O.; Redkin, O.; Bernikova, O. Modeling and visualization of media in Arabic. J. Informetr. 2016, 10, 439–453. [Google Scholar] [CrossRef]
- Mikolov, T.; Chen, K.; Corrado, G.; Dean, J. Efficient Estimation of Word Representations in Vector Space. In Proceedings of the 1st International Conference on Learning Representations, ICLR 2013, Scottsdale, AZ, USA, 2–4 May 2013. [Google Scholar]
- Pennington, J.; Socher, R.; Manning, C.D. Glove: Global vectors for word representation. In Proceedings of the 2014 conference on empirical methods in natural language processing (EMNLP), Doha, Qatar, 26–28 October 2014. [Google Scholar]
- Joulin, A.; Grave, E.; Bojanowski, P.; Douze, M.; Jégou, H.; Mikolov, T. FastText.zip: Compressing text classification models. arXiv 2016, arXiv:1612.03651. [Google Scholar]
- Peters, M.; Neumann, M.; Iyyer, M.; Gardner, M.; Clark, C.; Lee, K.; Zettlemoyer, L. Deep Contextualized Word Representations. In Proceedings of the 2018 Conference of the North American Chapter of the Association for Computational Linguistics: Human Language Technologies, New Orleans, LA, USA, 1–6 June 2018; pp. 2227–2237. [Google Scholar]
- Lehmann, E.L.; Romano, J.P. Testing Statistical Hypotheses; Springer: Berlin/Heidelberg, Germany, 2005. [Google Scholar]
- Granichin, O.; Volkovich, V.; Toledano-Kitai, D. Randomized Algorithms in Automatic Control and Data Mining, Intelligent Systems Reference Library, vol. 67; Springer: Berlin/Heidelberg, Germany, 2015. [Google Scholar]
- Kolmogorov, A. Sulla determinazione empirica di una legge di distribuzione. Giornale dell’Istituto Italiano degli Attuari 1933, 4, 83–91. [Google Scholar]
- Smirnov, N. Table for estimating the goodness of fit of empirical distributions. Ann. Math. Statist. 1948, 19, 279–281. [Google Scholar] [CrossRef]
- Harmer, J. How to Teach Writing; Pearson Education: London, UK, 2006. [Google Scholar]
- Thompson, R. A Note on Restricted Maximum Likelihood Estimation with an Alternative Outlier Model. J. R. Stat. Soc. Series B Stat. Methodol. 1985, 47, 53–55. [Google Scholar] [CrossRef]
- Soliman, A.B.; Eissa, K.; El-Beltagy, S.R. AraVec: A set of Arabic Word Embedding Models for use in Arabic NLP. In Third International Conference On Arabic Computational Linguistics, ACLING 2017, Dubai, United Arab, 5–6 November 2017; Shaalan, K., El-Beltagy, S.R., Eds.; Elsevier: Amsterdam, The Netherlands, 2017; Volume 117, pp. 256–265. [Google Scholar]


| 1 | October 27, 2010 | 0.608 |
| 2 | November 17, 2010 | 0.593 |
| 3 | January 11, 2011 | 0.665 |
| 4 | January 13, 2011 | 0.637 |
| 5 | January 26, 2011 | 0.644 |
| 6 | February 23, 2011 | 0.66 |
| 7 | March 11, 2011 | 0.654 |
| 8 | April 3, 2011 | 0.637 |
| 9 | April 24, 2011 | 0.658 |
| 10 | May 2, 2011 | 0.652 |
| 11 | May 18, 2011 | 0.512 |
| 12 | June 21, 2011 | 0.661 |
| 13 | June 28, 2011 | 0.66 |
| 14 | June 30, 2011 | 0.657 |
| 15 | August 7, 2011 | 0.664 |
| 16 | August 21, 2011 | 0.665 |
| 17 | October 2, 2011 | 0.667 |
| 18 | October 14, 2011 | 0.667 |
| 19 | October 23, 2011 | 0.653 |
| 20 | November 24, 2011 | 0.654 |
| 21 | November 29, 2011 | 0.655 |
| 22 | December 6, 2011 | 0.641 |
| 1 | January 11, 2014 | 0.559 |
| 2 | January 12, 2014 | 0.103 |
| 3 | March 16, 2014 | 0.609 |
| 4 | April 11, 2014 | 0.629 |
| 5 | May 5, 2014 | 0.646 |
| 6 | May 11, 2014 | 0.639 |
| 7 | May 20, 2014 | 0.561 |
| 1 | December 5, 2010 | 0.31 |
| 2 | January 8, 2011 | 0.623 |
| 3 | January 11, 2011 | 0.627 |
| 4 | January 18, 2011 | 0.62 |
| 5 | January 21, 2011 | 0.601 |
| 6 | February 17, 2011 | 0.537 |
| 7 | February 23, 2011 | 0.509 |
| 8 | March 25, 2011 | 0.591 |
| 1 | November 17, 2010 | 0.254 |
| 2 | December 8, 2010 | 0.58 |
| 3 | January 11, 2011 | 0.645 |
| 4 | January 13, 2011 | 0.568 |
| 5 | January 26, 2011 | 0.595 |
| 6 | February 23, 2011 | 0.632 |
| 7 | March 11, 2011 | 0.619 |
| 8 | April 3, 2011 | 0.569 |
© 2020 by the authors. Licensee MDPI, Basel, Switzerland. This article is an open access article distributed under the terms and conditions of the Creative Commons Attribution (CC BY) license (http://creativecommons.org/licenses/by/4.0/).
Share and Cite
Bernikova, O.; Granichin, O.; Lemberg, D.; Redkin, O.; Volkovich, Z. Entropy-Based Approach for the Detection of Changes in Arabic Newspapers’ Content. Entropy 2020, 22, 441. https://doi.org/10.3390/e22040441
Bernikova O, Granichin O, Lemberg D, Redkin O, Volkovich Z. Entropy-Based Approach for the Detection of Changes in Arabic Newspapers’ Content. Entropy. 2020; 22(4):441. https://doi.org/10.3390/e22040441
Chicago/Turabian StyleBernikova, Olga, Oleg Granichin, Dan Lemberg, Oleg Redkin, and Zeev Volkovich. 2020. "Entropy-Based Approach for the Detection of Changes in Arabic Newspapers’ Content" Entropy 22, no. 4: 441. https://doi.org/10.3390/e22040441
APA StyleBernikova, O., Granichin, O., Lemberg, D., Redkin, O., & Volkovich, Z. (2020). Entropy-Based Approach for the Detection of Changes in Arabic Newspapers’ Content. Entropy, 22(4), 441. https://doi.org/10.3390/e22040441