Article

Structural Change and Dynamics of Pakistan Stock Market during Crisis: A Complex Network Perspective

School of Finance and Economics, Jiangsu University, Zhenjiang 212013, China
*
Author to whom correspondence should be addressed.
Entropy 2019, 21(3), 248; https://doi.org/10.3390/e21030248
Submission received: 1 February 2019 / Revised: 1 March 2019 / Accepted: 3 March 2019 / Published: 5 March 2019
(This article belongs to the Section Complexity)

Abstract

:
We studied the cross-correlations in the daily closing prices of 181 stocks listed on the Pakistan stock exchange (PSX) covering a time period of 2007–2017 to compute the threshold networks and minimum spanning trees. In addition to the full sample analysis, our study uses three subsamples to examine the structural change and topological evolution before, during, and after the global financial crisis of 2008. We also apply Shannon entropy on the overall sample to measure the volatility of individual stocks. Our results find substantial clustering and a crisis-like less stable overall market structure, given the external and internal events of terrorism, political, financial, and economic crisis for Pakistan. The subsample results further reveal hierarchal scale-free structures and a reconfigured metastable market structure during a postcrisis period. In addition, time varying topological measures confirm the evidence of the presence of several star-like structures, the shrinkage of tree length due to crisis-related shocks, and an expansion in the recovery phase. Finally, changes of the central node of minimum spanning trees (MSTs), the volatile stock recognition using Shannon entropy, and the topology of threshold networks will help local and international investors of Pakistan Stock Exchange limited (PSX) to manage their portfolios or regulators to monitor the important nodes to achieve stability and to predict an upcoming crisis.

1. Introduction

Due to globalization and financial integration, stock markets throughout the world are strongly interconnected. For example, the Global financial crisis (hereafter, GFC) that begun from the USA in 2 April 2007 has affected almost all of the financial markets of the world [1]. The propagation of risks and the complex nature of external and internal events to a local stock market require a thorough study of the stock correlation networks and their structural dynamics. Introduced by Mantegna [2], the correlation-based networks are widely used in the financial network literature to quantify the impact of various crisis events [3,4,5,6,7,8,9,10,11]. An extension of the Minimum spanning tree (MST) method for the correlation network was later on presented by Tumminello et al. [12], known as planar maximally filtered graph (PMFG), and Boginski et al. [13] formed a correlation threshold (CT) network. The uncertainty of the stock market and the volatility in stock market returns can be measured with entropy-based approaches, as suggested by previous studies [14,15,16,17,18,19]. Most importantly, a complex system such as the stock market presents its structure better when it is under stress.
While studying the US stock market, Onnela et al. [20] discover structural changes and a shrinkage in the tree length due to crises by using the correlation network of dynamic asset trees. In addition, Vandewalle et al. [21] and Nobi et al. [22] found a power-law degree distribution of the US stock market. Li et al. [23] show a star-like minimum spanning tree (MST) topology for the Euro Stoxx market during a crisis. Dimitrios and Vasileios [24] highlight the importance of a few stocks that can influence the entire Greek stock market. While examining the South African stock market, Majapa and Gossel [5] found a shrinkage in the tree length during a crisis and a growth afterwards. More interestingly, Kantar et al. [25], after applying MST, showed no impact of the global financial crisis 2008 on Turkish firms. Examining Asian capital markets, Bhattacharjee et al. [26] observed similar hubs and a decrease in the height of clusters during a crisis. Sensoy and Tabak [27] found a deteriorated network stability with the removal of the Hongkong stock market from the Asia Pacific spanning trees network. Using MST and a hierarchical tree, Yang et al. [28] mentioned the core nodes that should be monitored to maintain the stability and a slight increase in the clustering degree during a financial crisis for China’s stock market. Recently, Nie and Song [29] exhibited the integration of entropy and the dimension of financial correlation-based networks among stock markets of three countries: China, the UK, and the US. It is worth noticing that there are a lot of local stock markets that need to be explored via complex network methods, as past research is targeted at a few stock markets of the world.
In this article, we thoroughly analyze the correlation structure network and dynamics of N = 181 stocks from 33 sectors listed on the Pakistan stock exchange (PSX) over a wide period from 2007 to 2017. We observe that the Pakistan stock market experiences severe downward fluctuation due to a financial and trade contagion emerging from the GFC. Therefore, our main aim is to investigate the impact of GFC on the network structure of the Pakistan stock market by diving the timeline into three subperiods. The novelty of this research lies in the network analysis of an overall and period-wise comparison of the pre-financial crisis, the financial crisis, and the post-financial crisis of PSX; that, to best of our knowledge, has not been done in the literature. We first measure the individual stock volatility by applying Shannon entropy on all stocks. Thereafter, we construct the Pakistan stock market network using Pearson correlation coefficients and present the topological properties of nine threshold networks around the GFC. In addition, we apply a physics-derived technique of MST to the entire timeline and three targeted subperiods to study the overall and period-wise structures of PSX and to inspect the scale-free properties of four MST networks. Finally, we present time varying topological measures of the Pakistan stock market to inspect the dynamic evolution of the network.
The paper is organized as follows: Section 2 reviews the relevant prior work on financial market networks. In Section 3, we describe the data and methodology used in this work. Section 4 shows the empirical results and discusses the results. Finally, we conclude the paper in Section 5.

2. Literature Review

For a stock market, the network approach has appeared as a useful measure to analyze its static and dynamic properties [30,31,32,33]. With regards to the application of a network-based approach to examine the developed markets of the world, Bonanno et al. [34] applied an MST and hierarchical tree (HT) to investigate the major 100 stocks listed in the New York stock exchange (NYSE) over the period of 1995 to 1998. Their results showed clusters of stocks in their respective economic sector, and information on the tree topology led to a portfolio optimization. Similarly, Ulusoy et al. [35] used MST and HT on the top 40 companies of UK listed on the London stock exchange between January 2006 and November 2010. In addition to identifying the common clusters, their results also represented an important role of the economic factors influencing a special group of stocks. Onnela et al. [7] investigated the impact of the black Monday crisis on 116 companies of S&P 500 between 1982 and 2000, using the MST methodology. Their results showed a decrease in the normalized tree length and a reconfiguration of the stocks during the crisis time. Brida and Risso [36] analyzed 29 main German companies of the blue-chip DAX 30 index trading on the Frankfurt stock exchange between January 2003 and November 2008. After using MST and HT, their results revealed linkages among companies with the same branch of economy. Additionally, they found a structural break in the expansion of global distance after implementing bootstrap simulations. Lee et al. [37] examined the high-frequency data of 50 stocks listed in the Korean stock market over the period of January 2009 to December 2009. After constructing MST maps, their results found dense structures with a higher market volatility.
Regarding developing countries’ stock markets, Zhang et al. [38] found a power-law degree distribution and a small-world property of a high frequency time series of the Shanghai stock index between 5 March 2007 and 16 March 2007. Huang et al. [39] presented a structural and topological analysis of threshold networks among 1080 stocks listed in the Shanghai and Shenzhen stock markets of China between 2003 and 2007. Their results showed both a topological robustness and a fragility against random node failures. Nguyen et al. [40] examined companies listed on the Hochiminh Stock Exchange (HSX) of Vietnam over the period of 2008 to 2017. Their results showed star-like MST during a Vietnamese financial crisis period in the year 2011–2012. Bahaludin et al. [41] identified four highly dominant stocks of the Malaysian stock market by using the MST method on the top 100 companies from 2011 to 2013. Tabak et al. [42] applied MST on the Brazilian stock market and found a respective importance of various sectors by using the data of 47 stocks between January 2000 and February 2008.
To fix the distortion from correlation coefficients [43], Lyocsa et al. [32] constructed an MST from the dynamic conditional correlations (DCC) of the US stock market over various sample periods. With the exception of the oil and gas industry, their results revealed heterogeneity among various industry sectors. Additionally, they suggested the DCC approach over rolling correlations while describing the limitations of both methods. Examining nonstationary time series, Ferreira et al. [44] applied a detrended cross-correlation analysis (DCCA) method to study the financial integration among 10 Eurozone countries. Their results showed a dissimilar financial integration among a number of EU countries. Furthermore, Peron et al. [45] mentioned entropy-based methods to examine the topology and dynamic evolution of financial market networks, especially during crisis. However, we construct a network based on Pearson correlation coefficients because it is widely applied in the financial network literature. Additionally, a network based on the correlation of stock returns consists of all the information regarding the stock relationship, including investor expectations.

3. Data and Methodology

We analyze the daily closing prices for 181 stocks listed in the Pakistan stock market from 3 January 2007 to 29 December 2017, consisting of 2722 trading days. Previous studies mention a varied time period for GFC for Asian countries (see, for example, the Asian market Indices [46], Japan [47], China [48], Korea [22], and Malaysia [49]). However, the Pakistan stock market experienced severe turbulence and country’s benchmark Karachi stock exchange (KSE-100) index declined rapidly from 14,956.82 points on the first trading day of May 2008 to a plunge in the index value by almost 35.29% or by 5278 points within three months, representing a financial crisis hit. Thus, to capture the full essence of a topological evolution of GFC on PSX, we divide the overall time series into three subperiods: precrisis (8 March 2007 to 2 May 2008), crisis (5 May 2008 to 30 June 2009), and postcrisis (1 July 2009 to 19 August 2010); each subperiod comprises 285 trading days. Table 1 mentions 33 sectors under the investigation of the Pakistan stock market network. A complete list of 181 stocks acting as nodes of the PSX network in a chronical order and categorized by their respective industry sectors is mentioned in Appendix A.
A set of n stocks is represented by S = { i | i = 0 , 1 , , n } , where the individual stock corresponds to a numerical label i in S . We define { P i ( t ) } as the stock i closing price, the log return r i ( t ) of stock i after the time interval ( Δ t ) can be calculated as
r i ( t ) = ln ( P i ( t ) ) ln ( P i ( t 1 ) )
Since, the volatility of each stock is a latent variable, a proxy needs to be determined. A well-known proxy to examine stock market volatility has been the standard deviation σ. However, we apply the Shannon entropy [50], an alternative way commonly used in the statistical physics of complex dynamics. Given the probability distribution of occurrence P i , ( i = 1 , , N ) , the Shannon entropy H ( p 1 , p 2 , , p n ) , reads
H = i = 1 N p i log 2 p i
where 0 log 0 is described as 0 and the normalized related probabilities is i = 1 N p i = 1 . The base 2 for l o g is drawn so that the computation is given concerning bits of information. We divide the log return r i ( t ) of the stock into N different bins and then compute the probabilities of each state i divided by the total number of values of stock S . We then apply the Shannon entropy depending upon the number of selected bins for each stock to measure the uncertainty and volatility (for a detailed study, please see Reference [51]).
Thereafter, we calculate the Pearson correlation coefficient among all pairs of daily returns of stock i and j in set S , given as
C i j = r i r j r i r j ( r i 2 r i 2 ) ( r j 2 r j 2 )
where r i and r j are the returns of stock i and j and the notation represents the mean value over the period of investigation. Following this method, we can obtain ( 181 × 181 ) cross-correlation symmetric matrices among all nodes that vary from −1 (negatively correlated) to +1 (positively correlated). We obtain threshold network θ by assigning a certain value to θ , ( 1 θ 1 ) , from the cross-correlation coefficients. If C i j between two stocks is greater than θ , we build an undirected link between stocks i and j . Perhaps, with same number of nodes for a certain θ , we obtain different set of links [39,52].
In order to construct a minimum spanning tree (MST), we further transform the correlation matrix of ( 181 × 181 ) stocks to a matrix that apprehends the distance in the tree network, as proposed by Mantegna [2] and by Mantegna and Stanley [53]. It is defined as
d i j = 2 ( 1 C i j )
The distance d i j among stocks i and j , the MST, denoted as T , is then computed from a data metric of N × ( N 1 ) / 2 links to a minimized total weight of V 1 isolated edges, using the Kruskal algorithm [54].
T = ( i , j ) ϵ T d i j

4. Results and Discussion

In this section, we present findings of the Pakistan stock market correlation network of 181 stocks from 33 industry sectors between January 2007 to December 2017 measured by logarithmic returns.

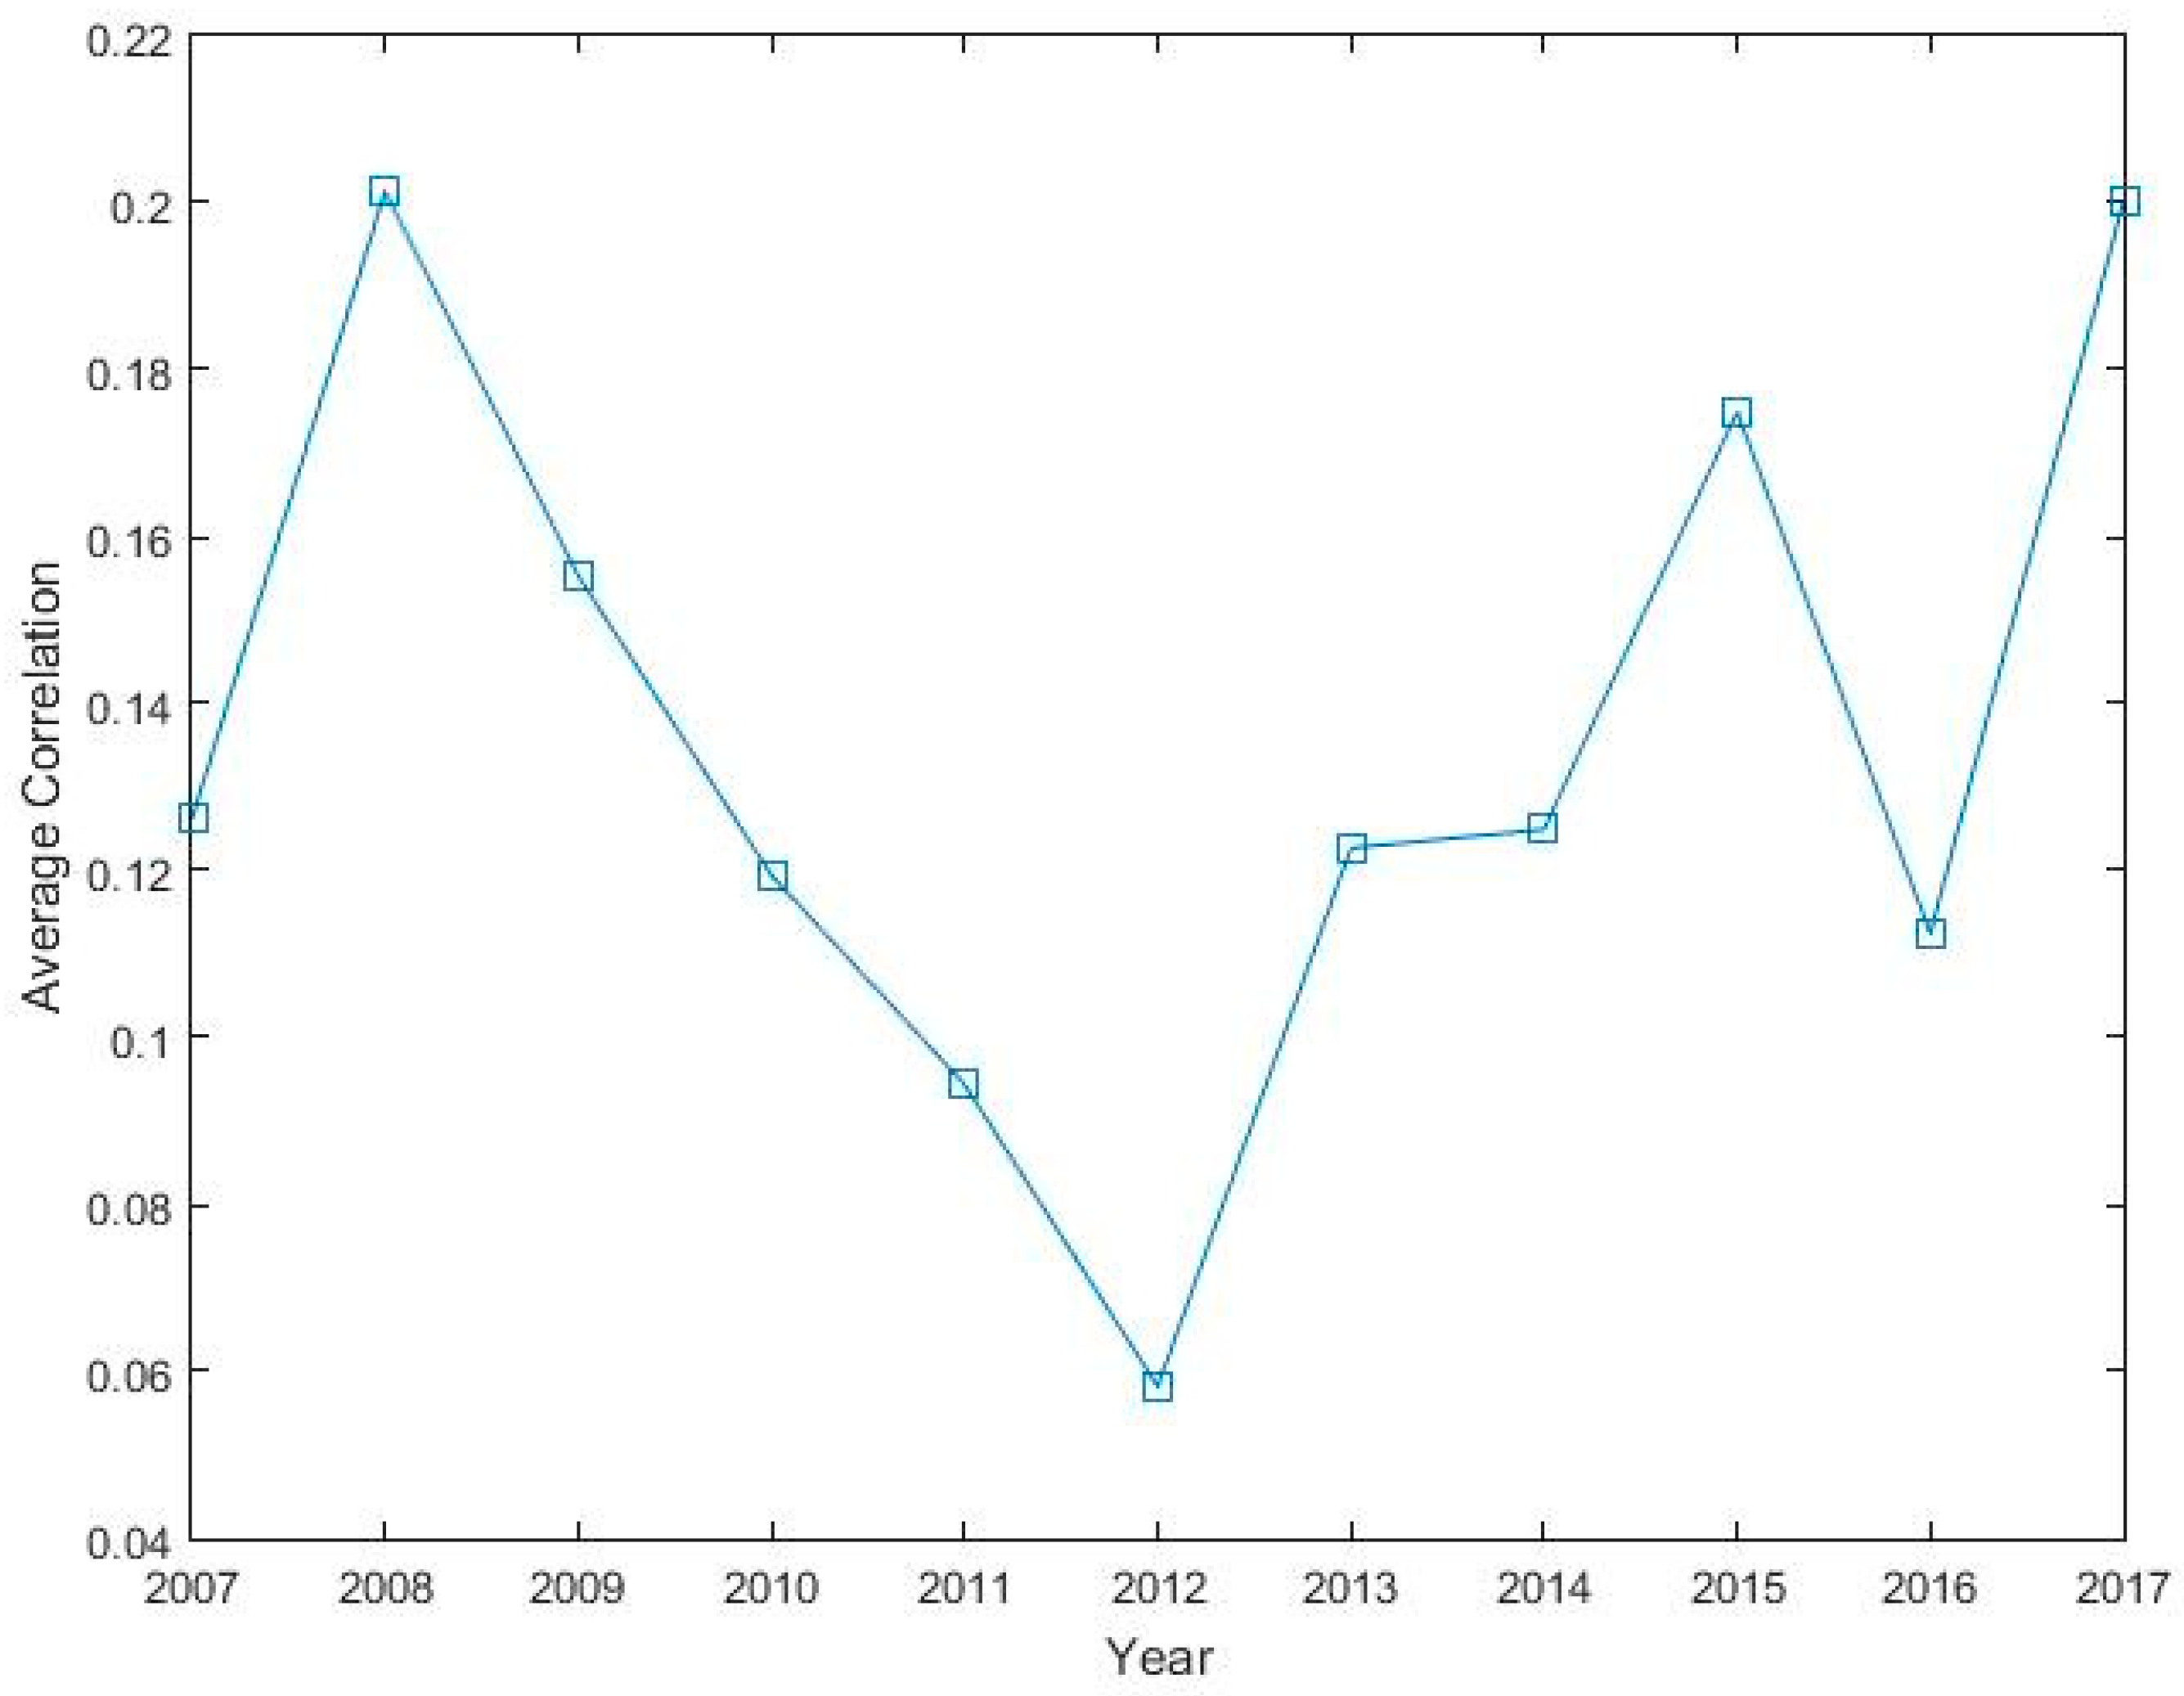
4.1. Correlation Coefficients and Distance Matrices

Figure 1 presents a graph of the average cross-correlation coefficients (CCC) for 181 stocks of the Pakistan stock market between 2007 and 2017. The average CCCs show a tremendous increase in the year 2008 when a GFC struck Pakistan and a decline abruptly after crisis. A local peak in the average CCC can be seen in the year 2017, when country experienced a severe political and economic crisis. The strong correlation among stocks is an indication that common shock was shared by all stocks during crisis period [55]. Pakistan’s economy was sternly hit due to GFC and the country’s GDP growth rate has shown a reduction from 4.833% in the year 2007 to 1.701% in the year 2008. Further, in Table 2, we mention statistics of the Pearson correlation and the distance metrics of the overall and three subperiods around the GFC of the Pakistan stock market. The full sample mean correlation among the stocks of PSX remain at 0.128 and the average distance remains at 1.319, which is marginally lower than the overall sample mean correlation of 0.145 for the South African stock market [5] and, therefore, shows a lower clustering and homogeneity on the Pakistan stock market compared to the South African stock market. In addition, the results reveal a lower mean correlation during the postcrisis period, thus showing comparatively weaker clusters. In contrast, the mean correlation among stocks increases around 39.42% during the crisis period compared to the precrisis period and stabilized to the mean correlation of 0.134 in the postcrisis period, moderately lower than the precrisis mean correlation of 0.137.

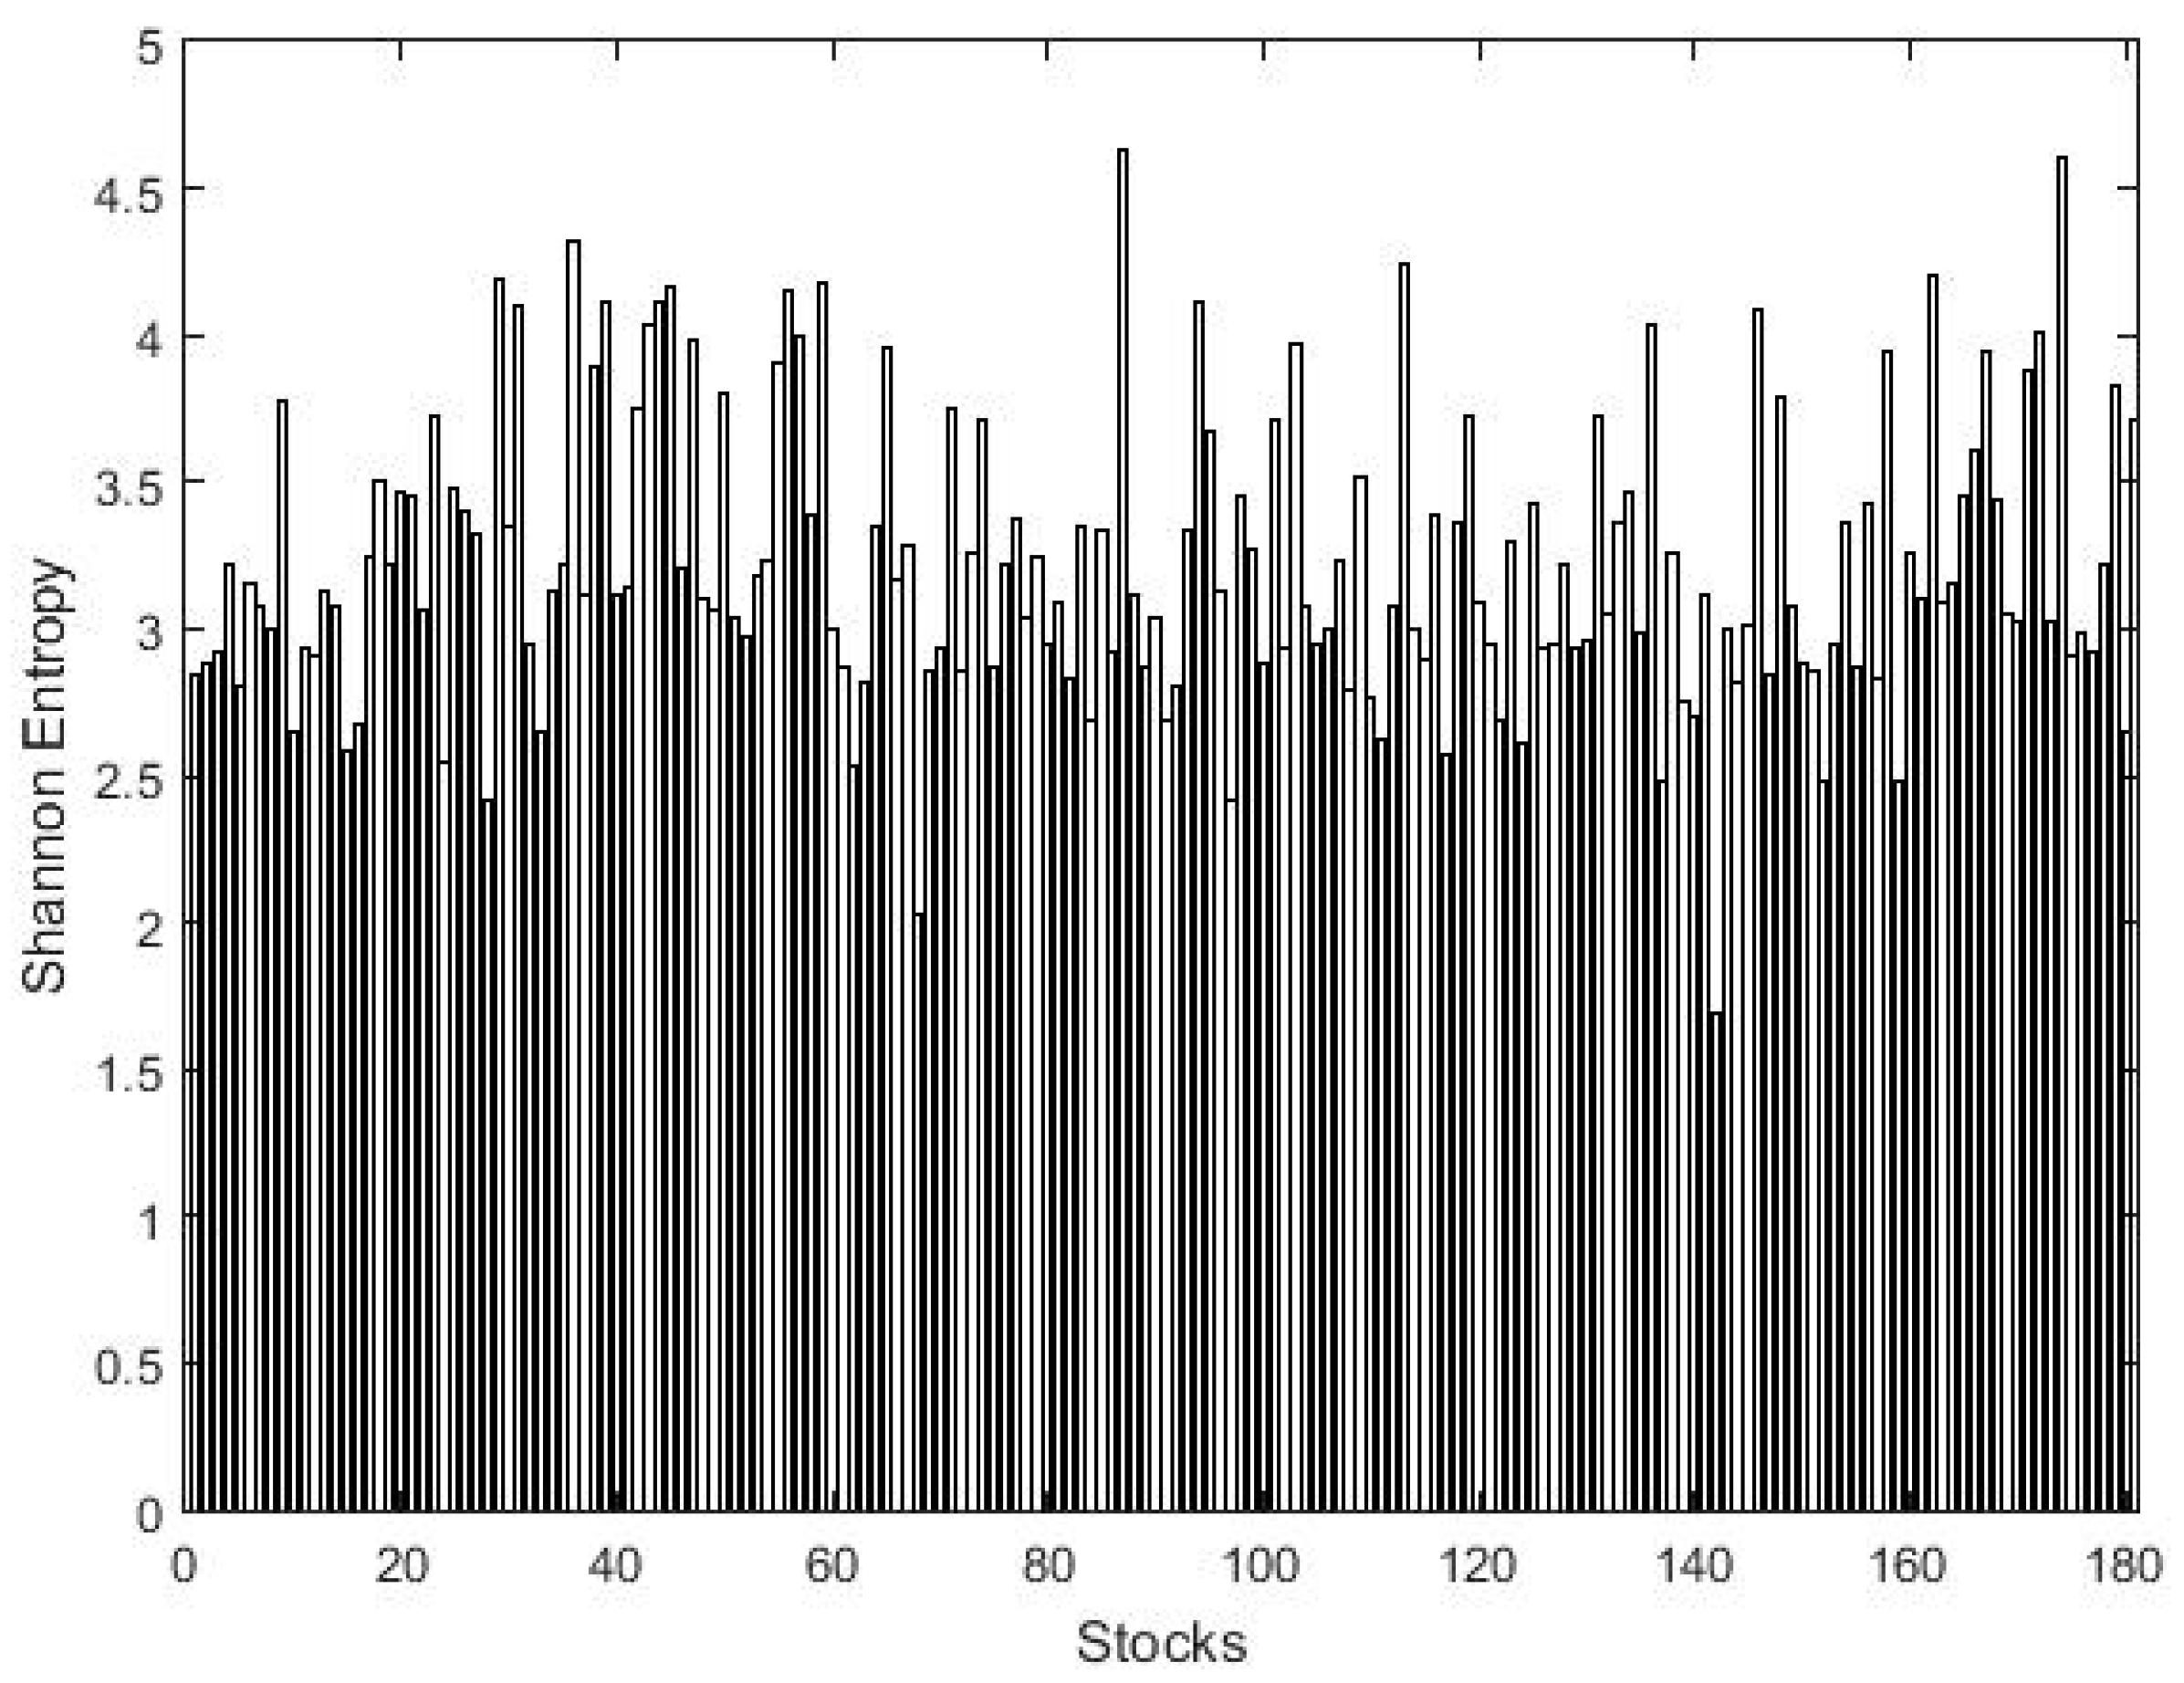
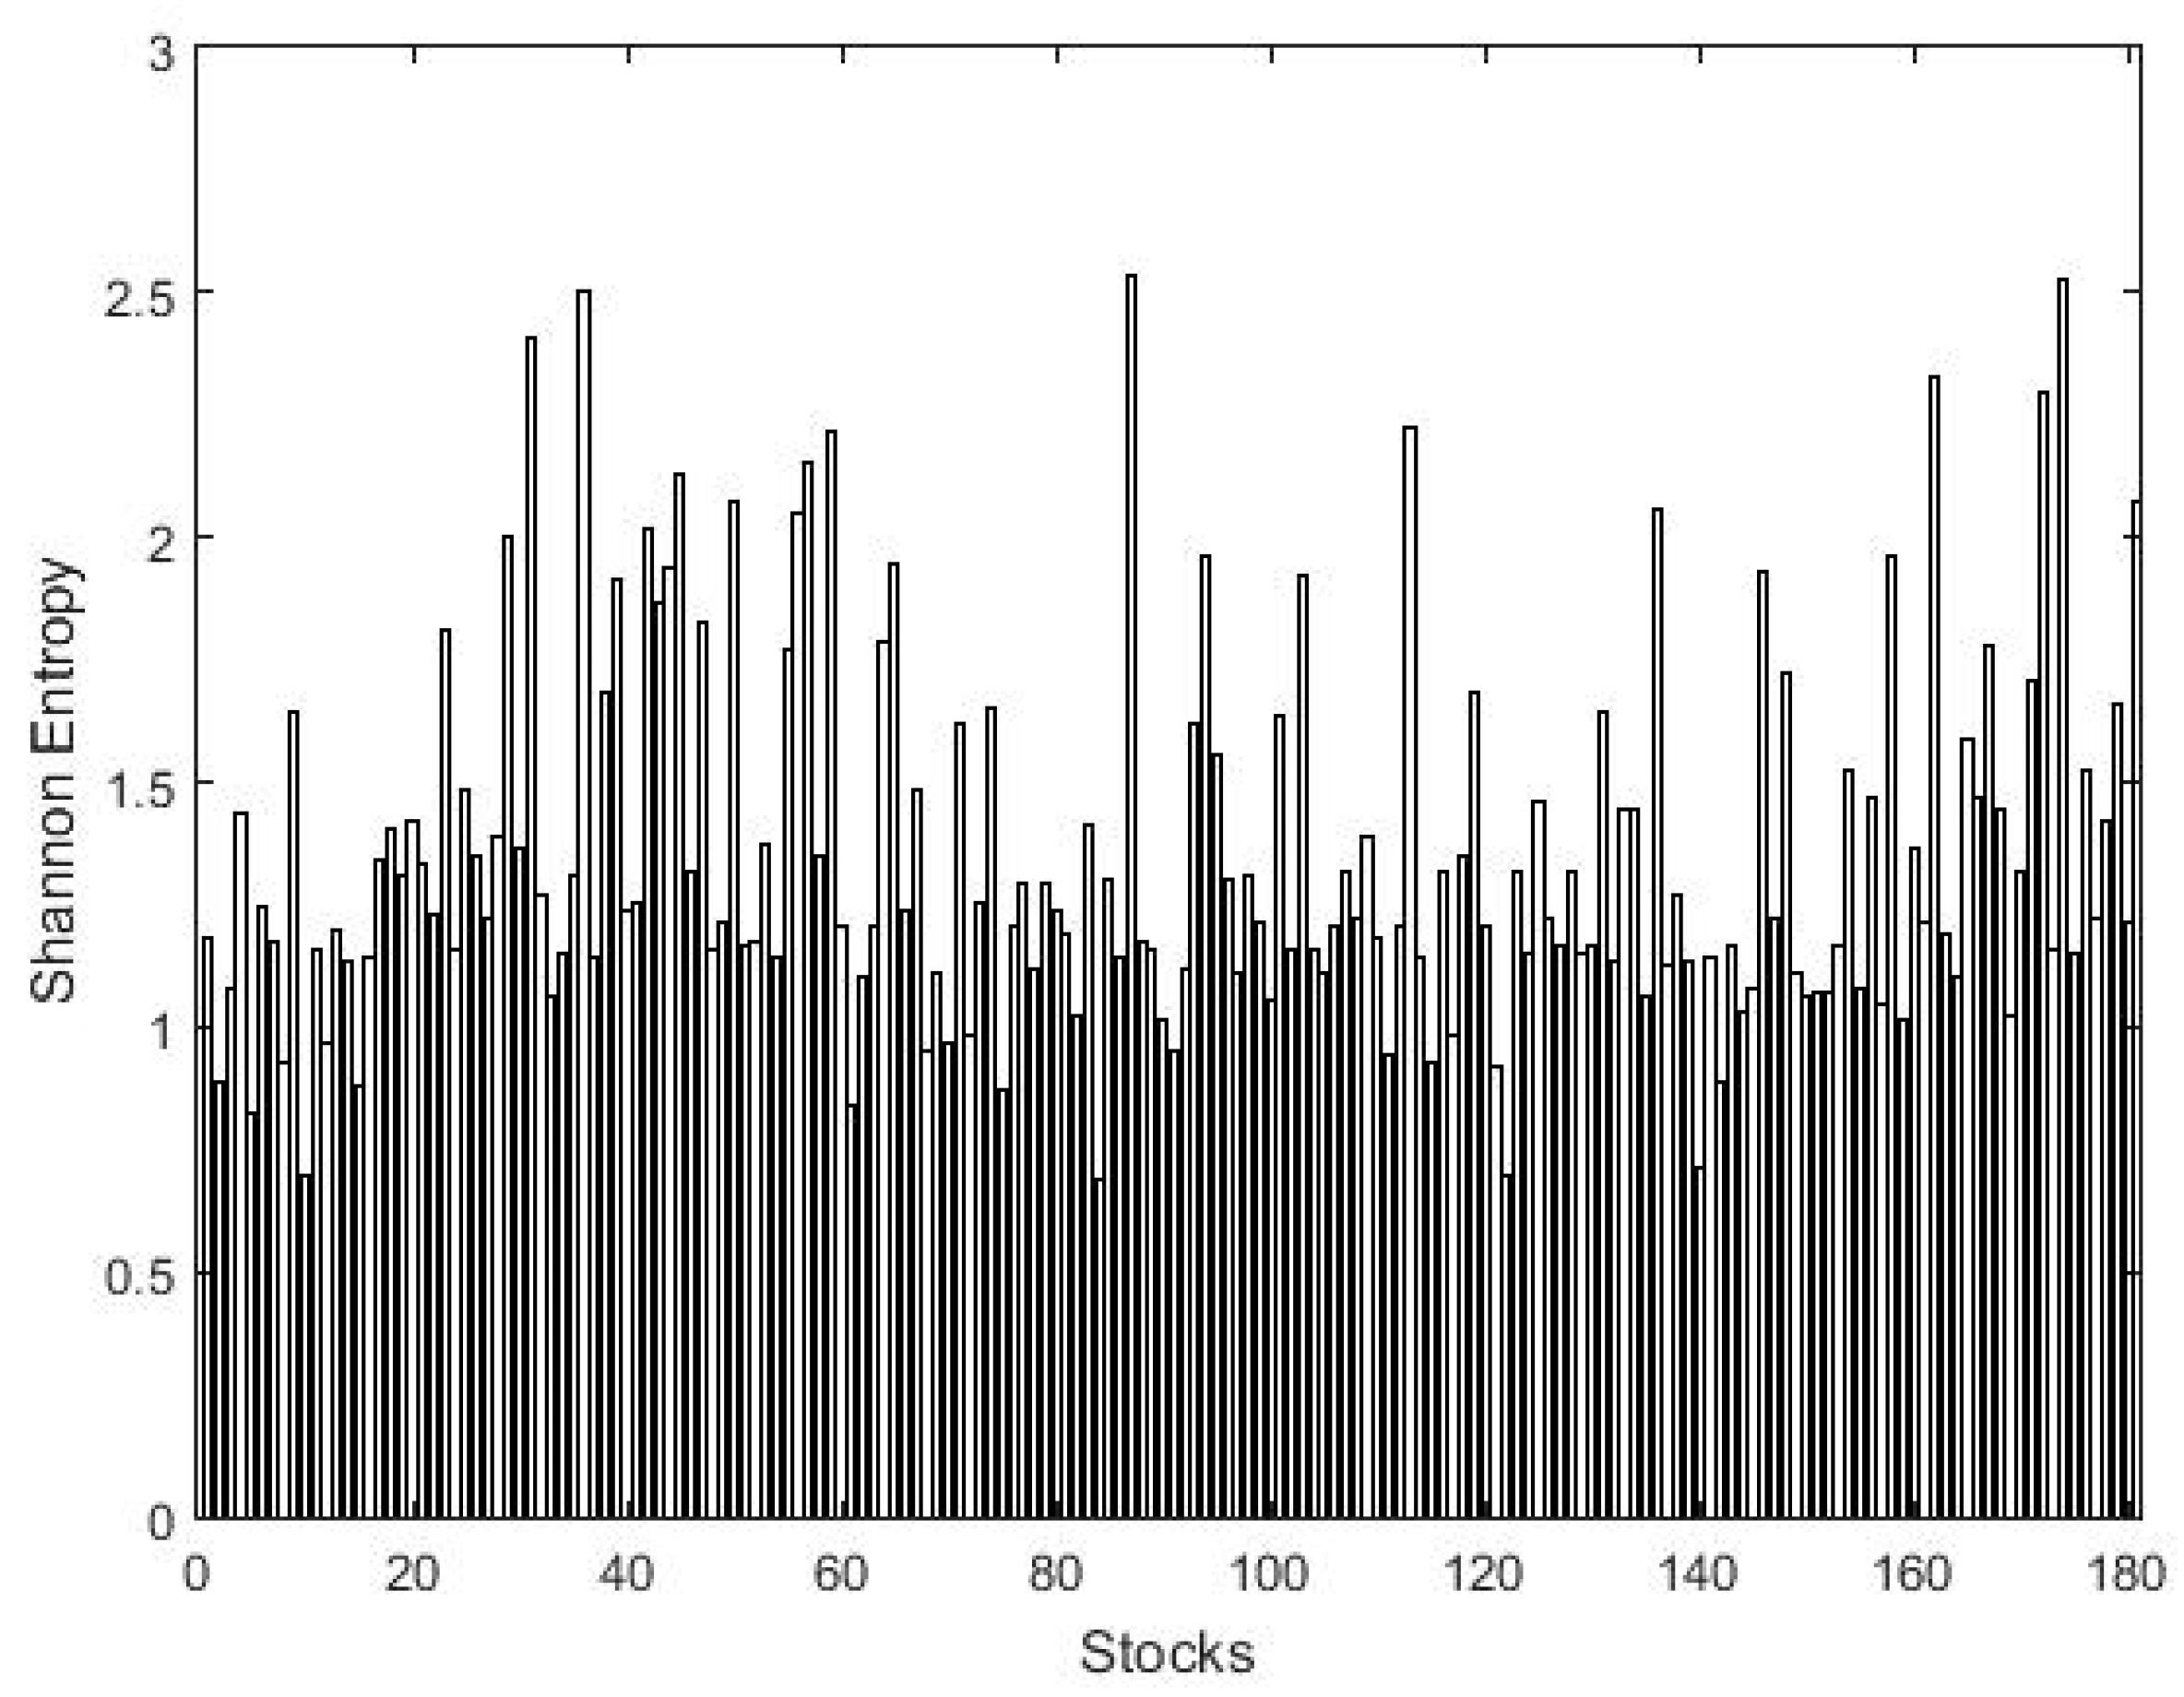
4.2. Shannon Entropy

We calculate the Shannon entropy of N = 181 stocks of PSX with two different bin choices of sizes 0.01 and 0.05. Obviously, the result of the first bin size of 0.01 will always be higher than of the other bin size of 0.05 and contains more information than the second bin size [51,56]. The result of the overall sample period is presented in Figure 2 and Figure 3, where a high value of the Shannon entropy represents the most volatile stocks. The results show prominent variation among stocks with a larger bin size; that is why it is preferred in literature. After ranking the entire sample based on the Shannon entropy score, we present the top five most and least volatile stocks of PSX in Table 3. The results show that Invest capital investment bank (ICIBL) carries the highest entropy score of 4.634 with a bin size of 0.01 and, therefore, is the most volatile stock in the PSX. Simultaneously, Pakistan services ltd. (PSEL) is the least volatile stock of PSX with a lowest Shannon entropy score of 1.694 among the entire sample. Furthermore, the average entropy of the investment and securities companies sector remains the highest among the entire sample, 3.923, with a bin size 0.01, followed by the textile weaving sector average entropy of 3.827, representing the most volatile sectors of the PSX.

4.3. Threshold Network

In this subsection, we present the topology of correlation threshold networks that have been achieved after analyzing three subperiod metrics (precrisis, crisis, and postcrisis). It means that a line is drawn acting as the undirected link for stocks at three different correlation θ values of C i j > 0.1 , C i j > 0.3 , and C i j > 0.5 and that nine adjacency matrices are created for three different subperiods. The results in Table 4 exhibit a dense network for all the subperiods at θ > 0.1 , particularly for the crisis period with a high network density of 0.674 and with 67.37% of the retaining edges in comparison with the other two periods. However, the density of the threshold network reduces significantly at θ > 0.5 , since a higher threshold value corresponds to fewer edges [57]. The density of the crisis period at θ > 0.5 remains high to 0.183 in comparison with the precrisis and postcrisis periods due to a tight correlation among stocks, which is a sign of instability because markets tend to act as one during crises [58]. In addition, a high number of 86 stocks acting as nodes in the threshold network are connected at θ > 0.5 for the crisis period in comparison with 37 stocks in the precrisis and 49 stocks in the postcrisis periods. Regarding sectoral influence, the cement sector nodes of Fauji cement company (FCCL) and DG Khan cement company (DGKC) are key nodes in the threshold network during the precrisis period. Whereas, DGKC dominates in the crisis period threshold network by forming a major cluster at a θ value of 0.3 and higher, along with the fertilizer sector important node of Engro corporation (ENGRO). However, the period after crisis presents important nodes with many links from three sectors of investment companies, cement, and fertilizers.

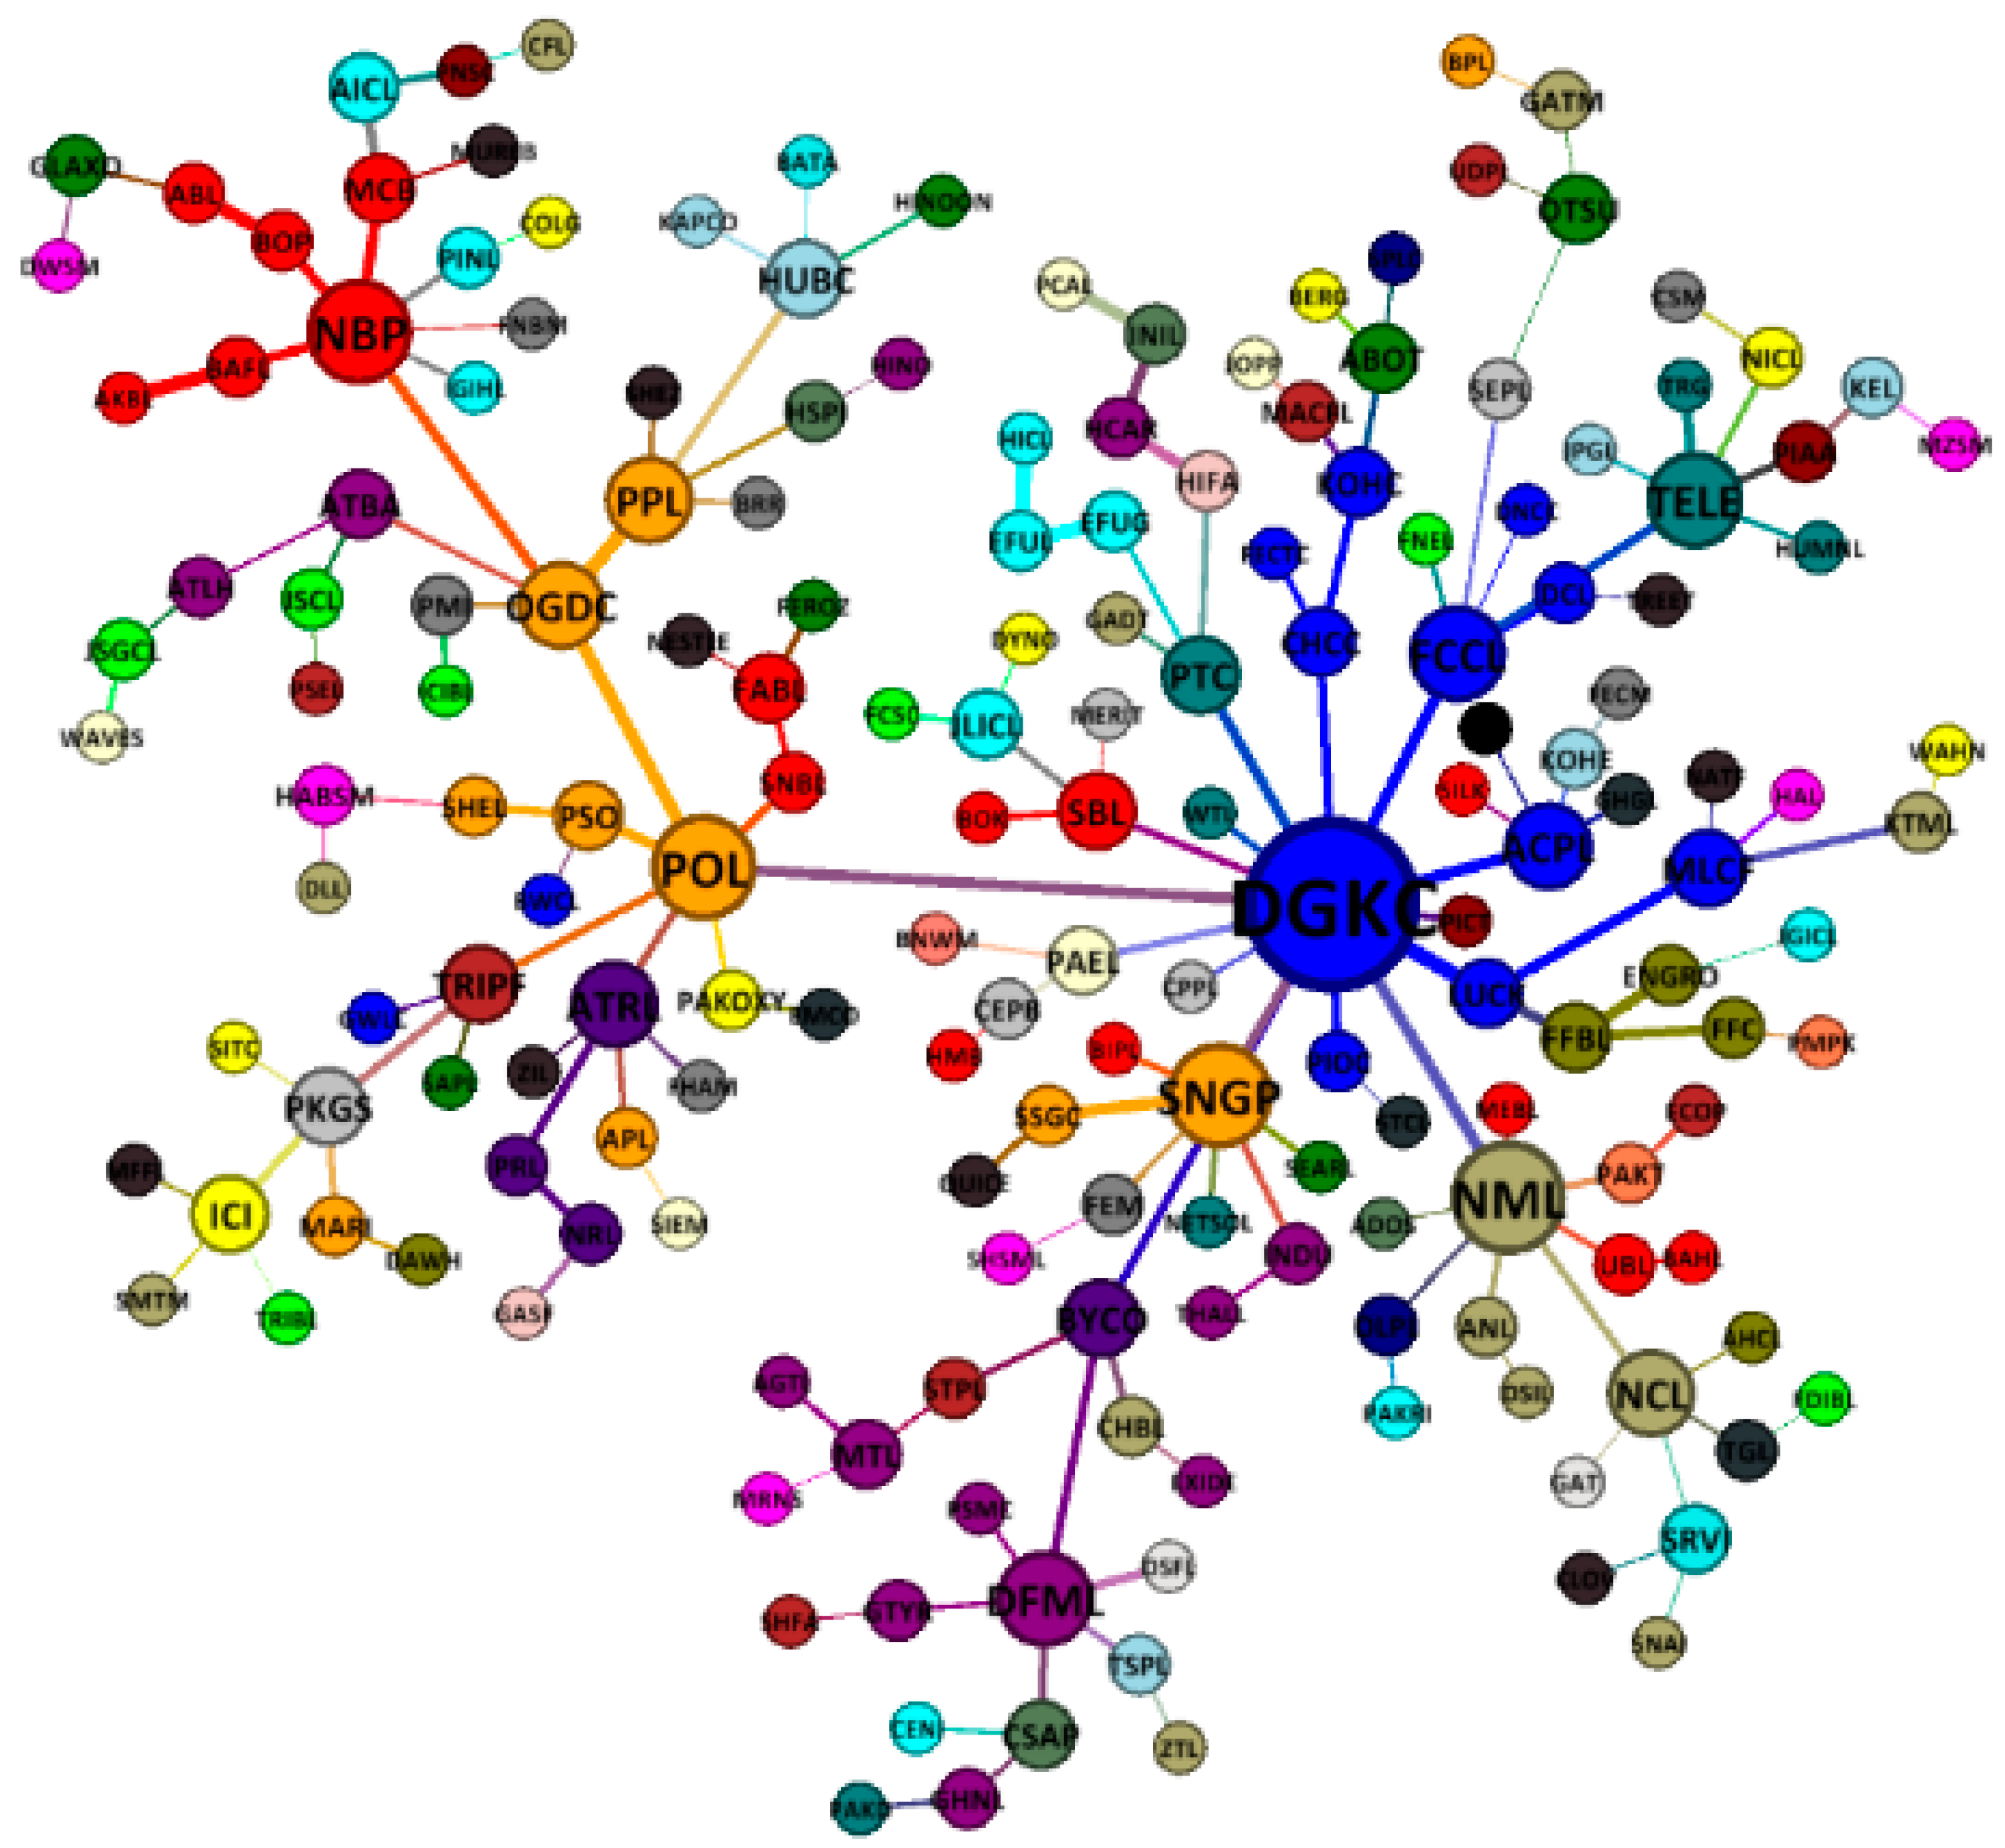
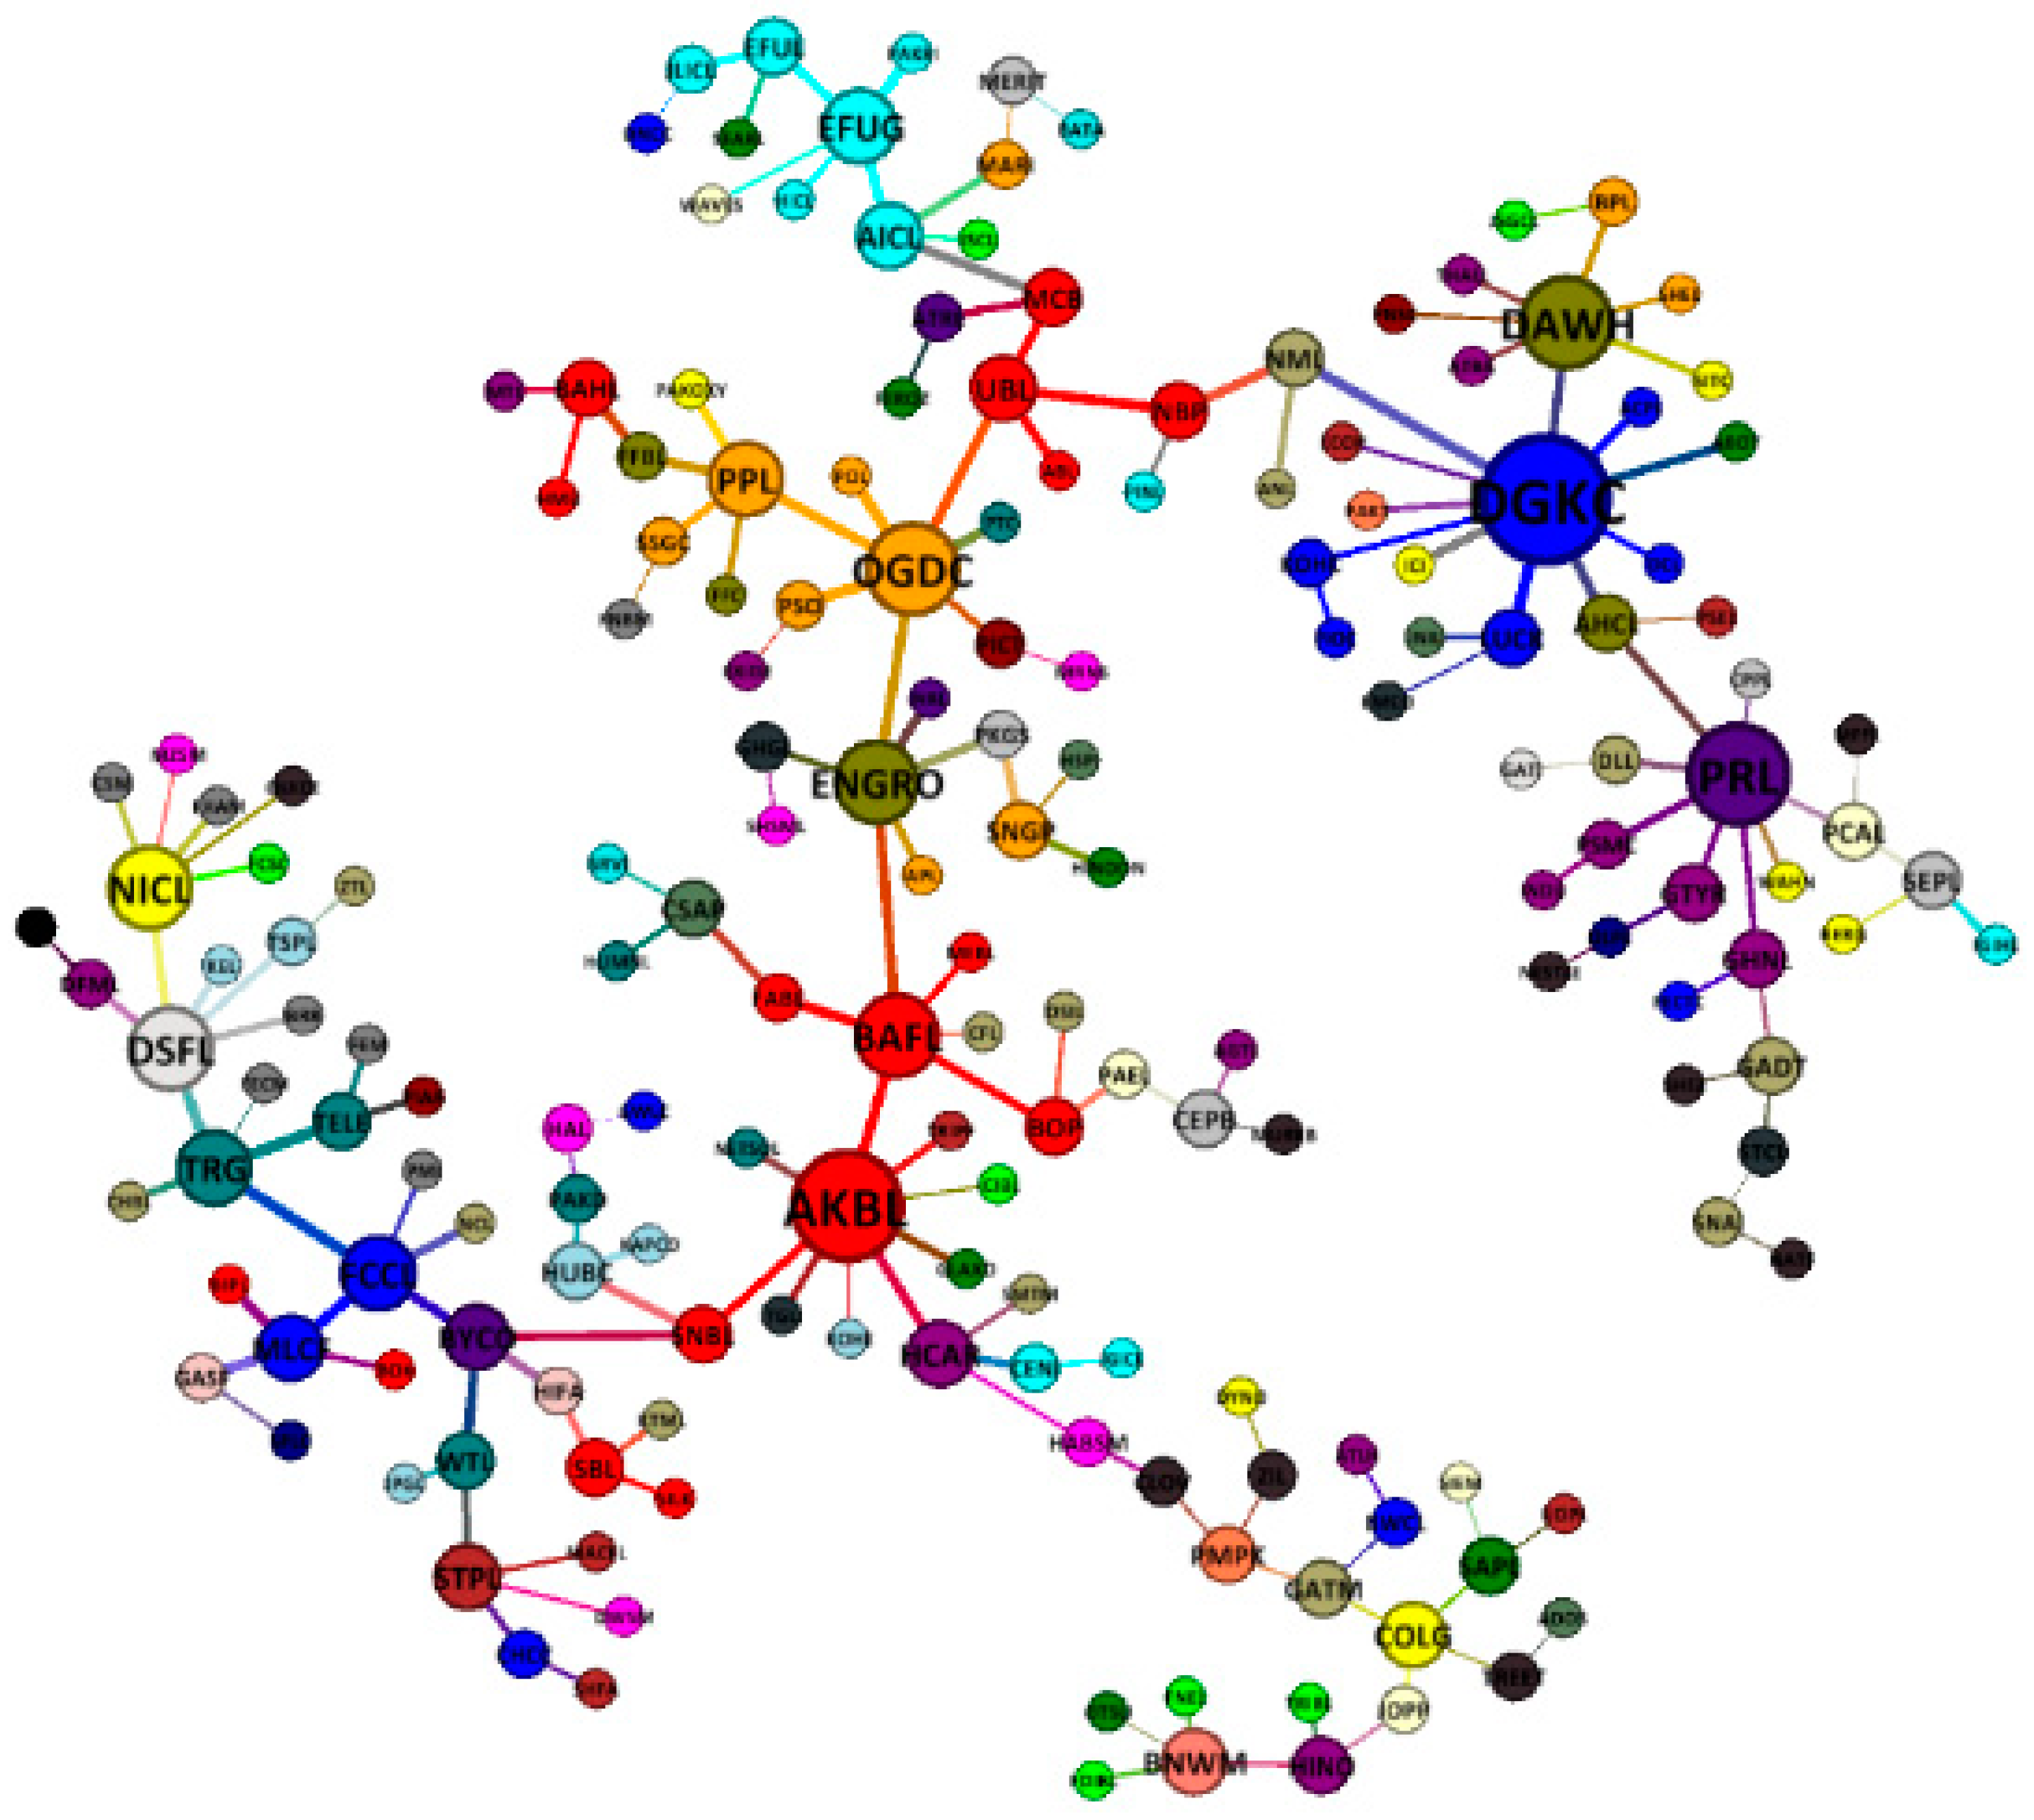
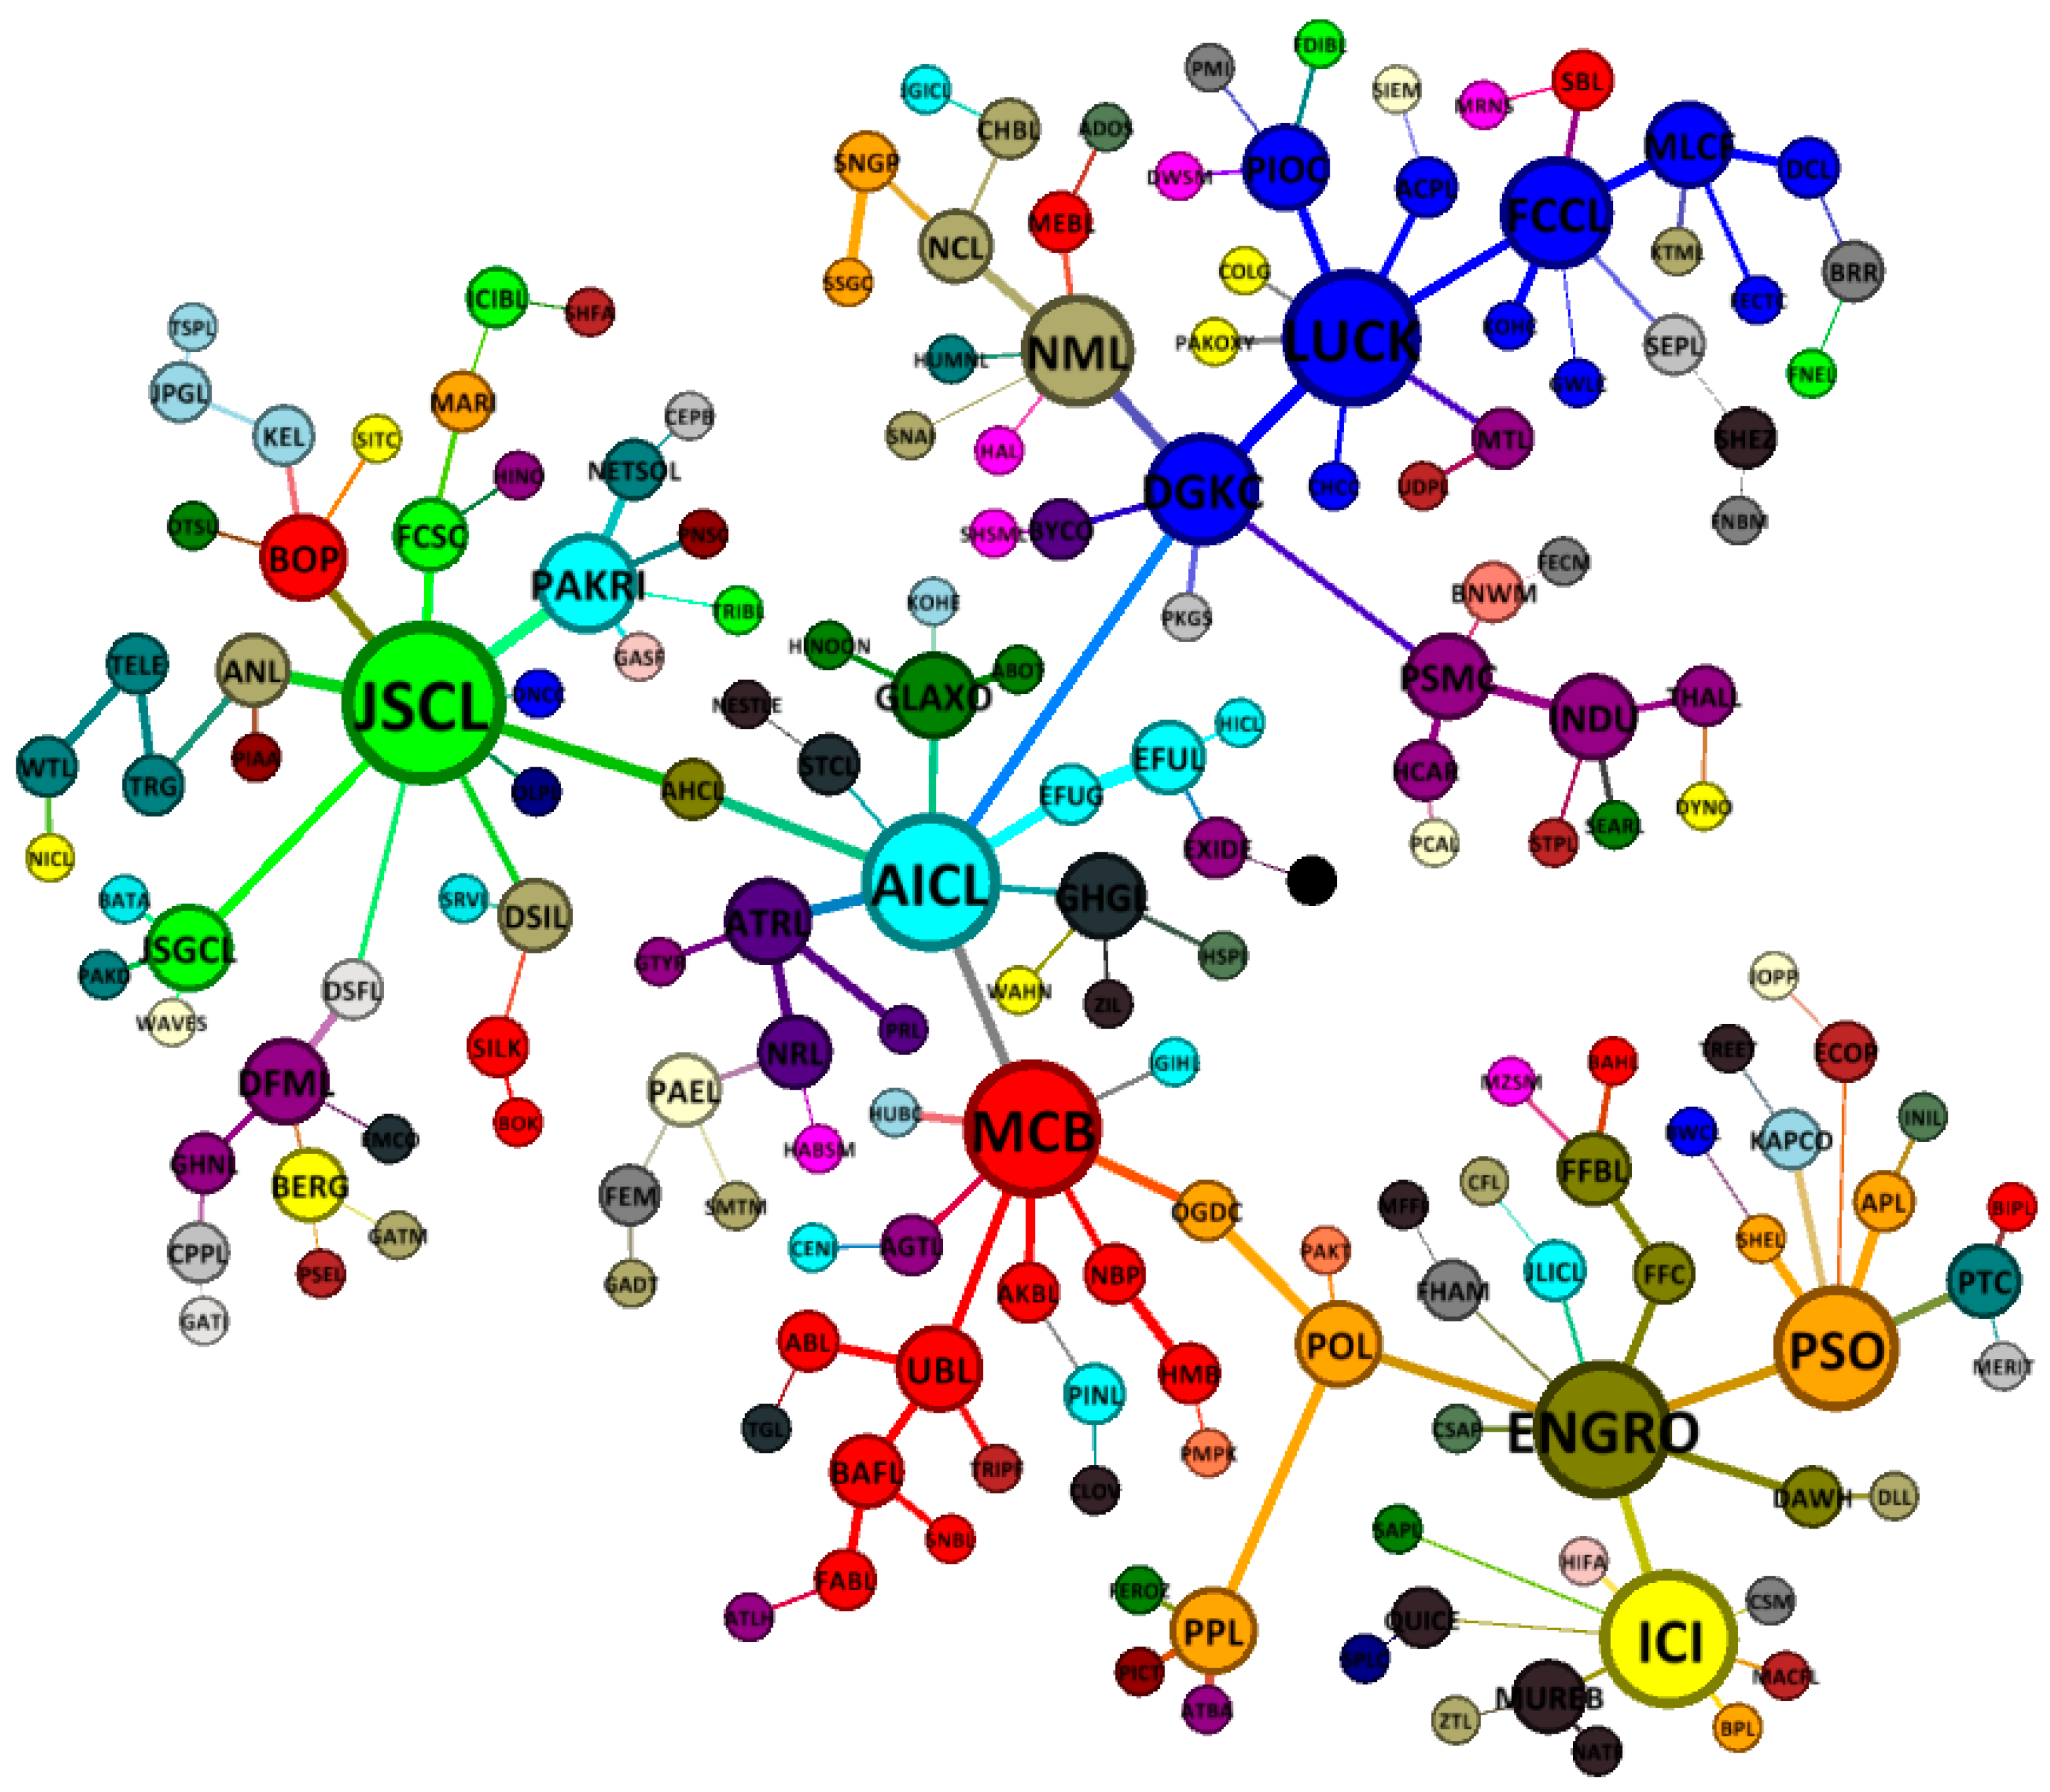
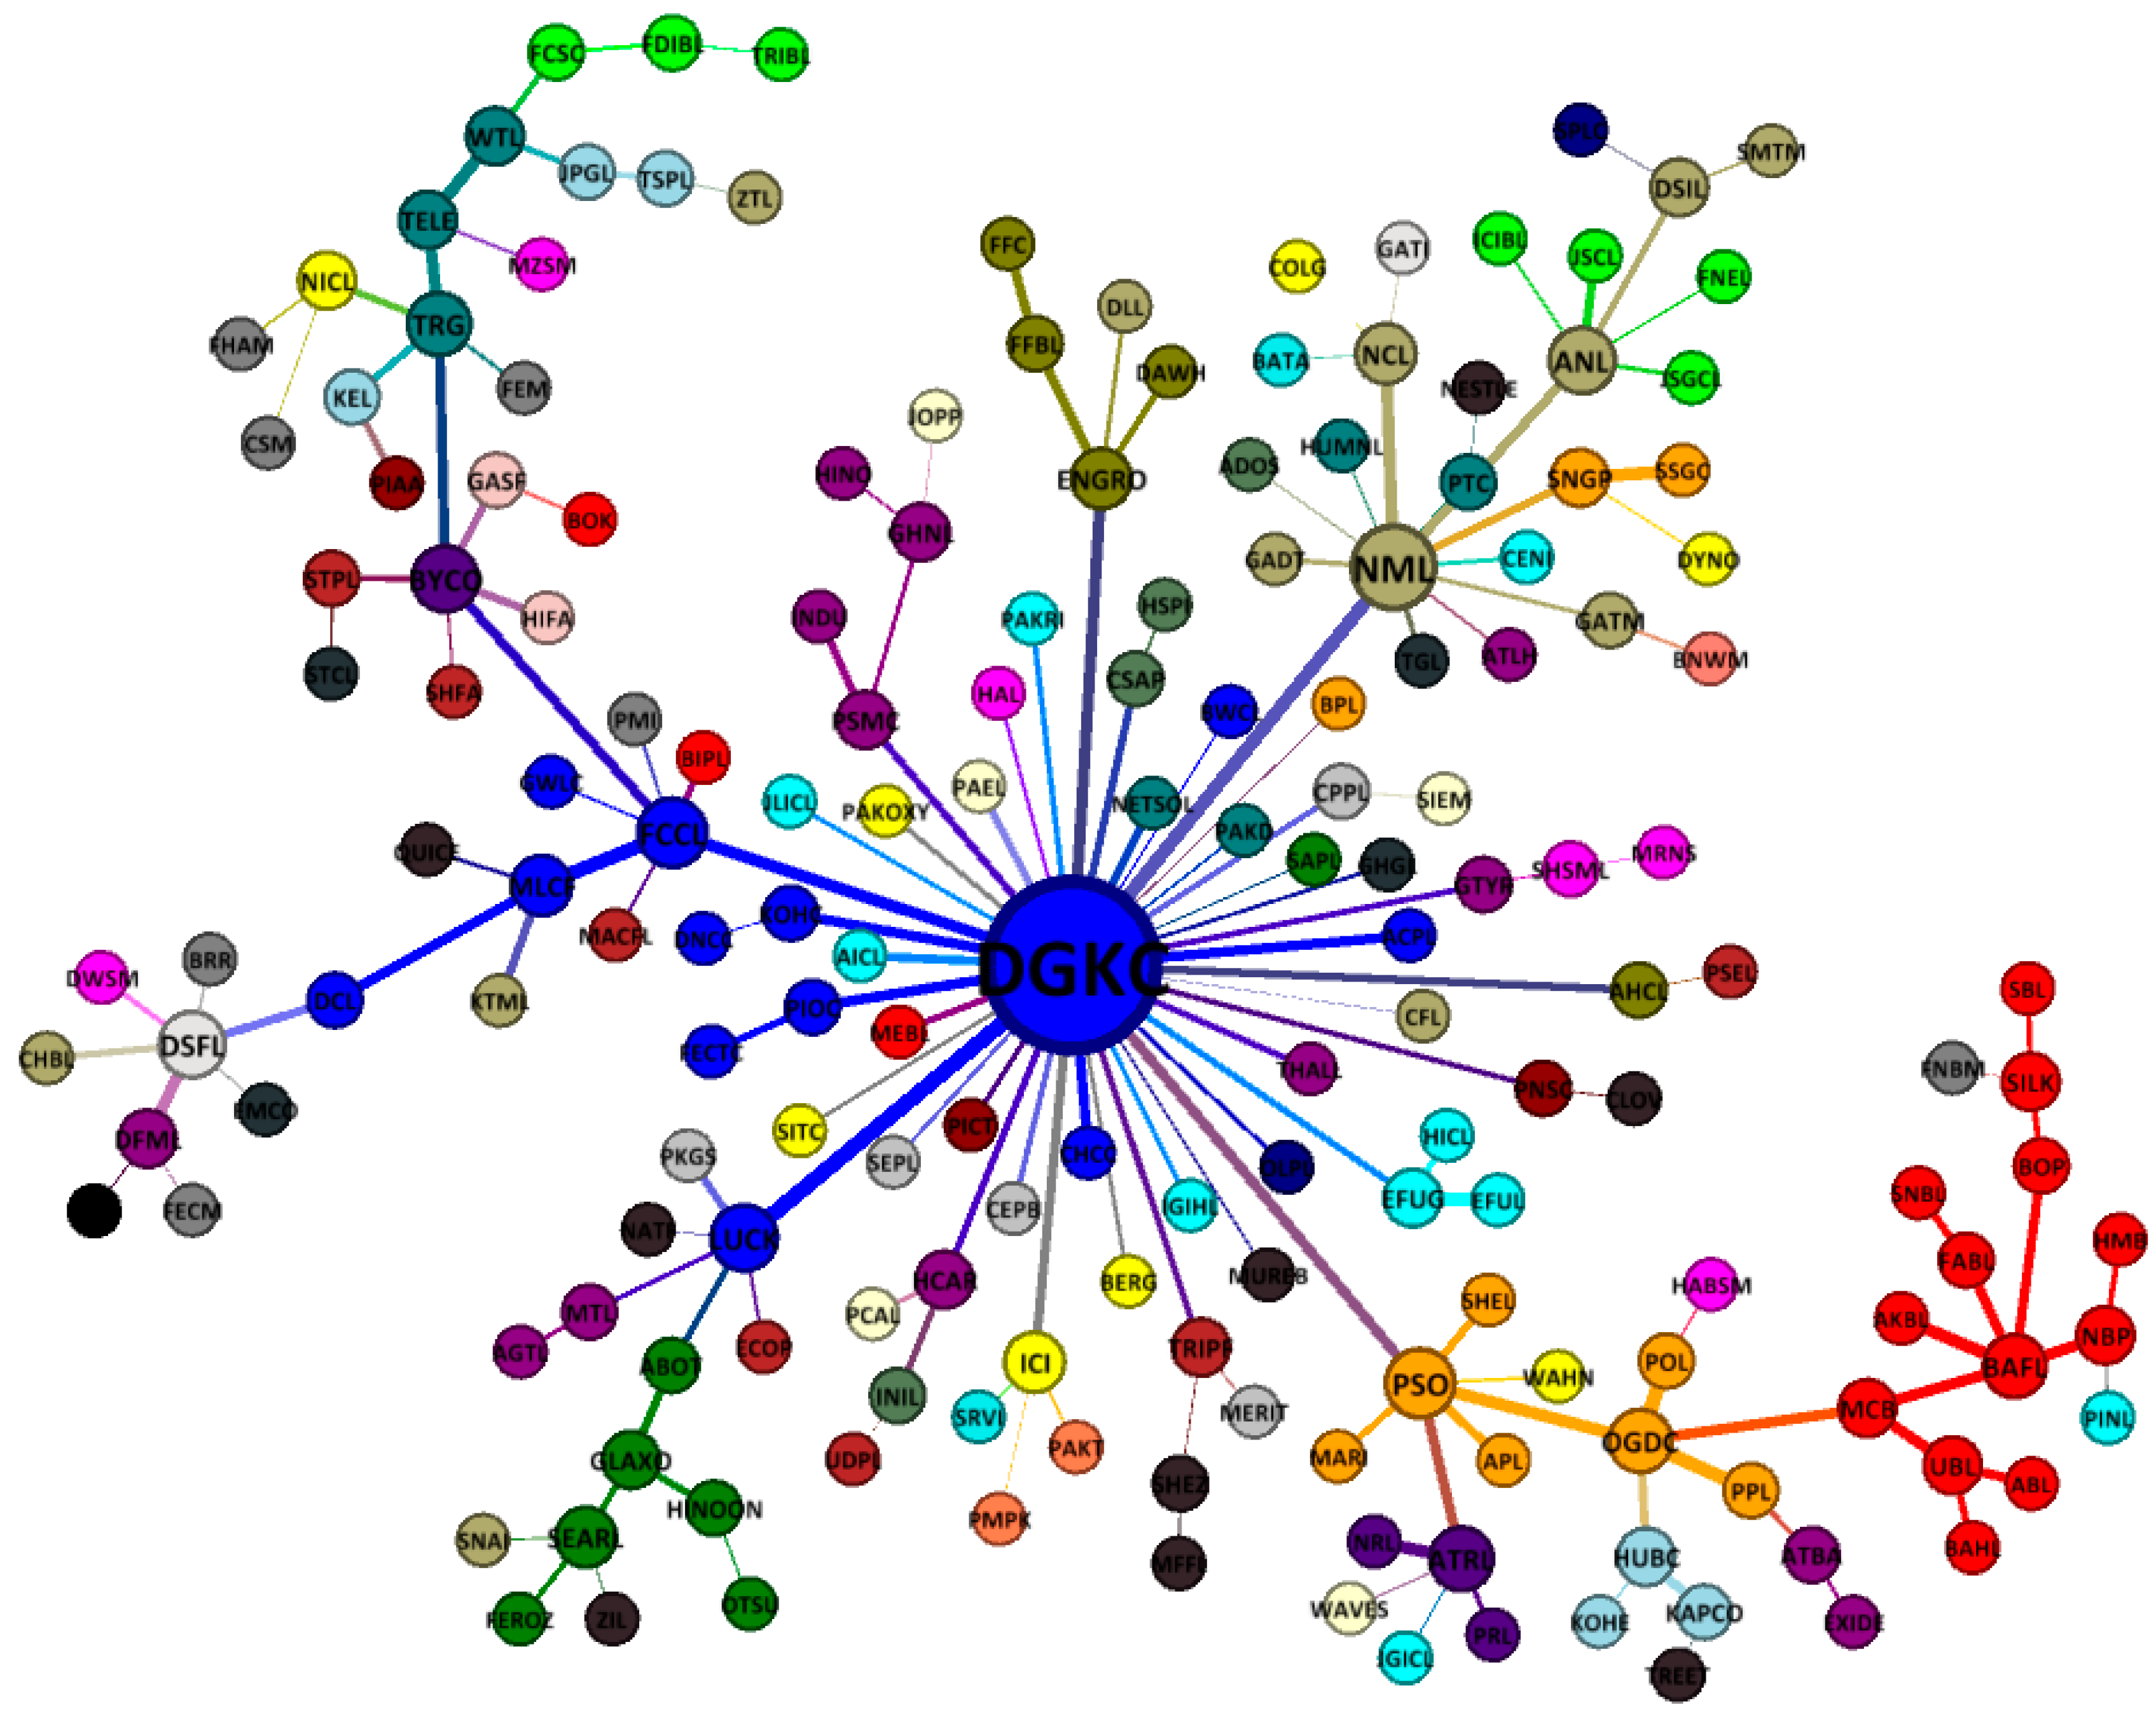
4.4. Minimum Spanning Tree

We construct four minimum spanning trees of the Pakistan stock exchange network for three subperiods around a GFC and a full sample period to study the evolving connectivity and efficacy of nodes (all nodes are colored according to their respective sector (please see Appendix A) and are sized based on their centrality score) in the network. The precrisis minimum spanning tree map of PSX is presented in Figure 4. The results show an emergence of three major clusters belonging to the cement sector (blue), the oil and gas sector (orange), and the commercial banks (red). In terms of connectivity (the number alongside each node represents its degree of connections), there is one major hub node of DG Khan cement company (DGKC, 15), along with four minor hub nodes, which are Nishat mills (NML, 8), National bank of Pakistan (NBP, 7), Pakistan oilfields (POL, 7), and Sui northern gas pipelines (SNGP, 7). We can observe the scattered role of commercial bank nodes in the MST such as Soneri bank (SNBL), which is connected to the oil and gas exploration sector node POL; Samba bank (SBL) and SILK Bank (SILK), which are connected to the cement sector key nodes of DGKC and ACPL; United Bank (UBL) and Meezan bank (MEBL), which are connected to the textile composite sector key node of Nishat mills (NML); and so on. This shows that the commercial banks sector plays a lead role in spreading the financial crisis to other sectors in the Pakistan stock market network.
A crisis period minimum spanning tree structure is presented in Figure 5. The results show the appearance of a similar major hub node of DG khan company (DGKC, 11) as in the precrisis period that plays a key role in resisting a crisis shock. Other key nodes with a high degree of connections in the MST are Askari bank (AKBL, 9), Pakistan refinery (PRL, 8), Dawood Hercules Corporation (DAWH, 7), and Oil and gas development company (OGDC, 7). Thus, a crisis MST of PSX reveals a weakening in the number of connections in comparison with the precrisis period, similar to the findings for the South African stock exchange network during crises [5]. In addition, the results also show the importance of the commercial banks sector node of Askari bank (AKBL) that holds the highest betweenness centrality score of 9464 in the crisis period MST of the Pakistan stock market, perhaps reflecting a strong intermediary role.
A postcrisis minimum spanning tree map of PSX network is presented in Figure 6. We can observe that DG khan company (DGKC, 6) is no longer a major hub node as observed in the precrisis and crisis period MST, possibly indicating a changing degree of diversification by the cement sector companies. In addition, there are seven principle nodes in the postcrisis MST, mainly Jahangir Siddiqui company (JSCL, 10), Adamjee insurance company (AICL, 8), ENGRO corporation (ENGRO, 8), ICI Pakistan (ICI, 8), Lucky cement company (LUCK, 8), Muslim commercial bank (MCB, 8), and Pakistan state oil (PSO, 7). The results also show an after-contagion effect in the form of rearrangement and reconfiguration in the MST structure, where commercial banks and cement sector nodes combine themselves among their respective clusters. Thus, a postcrisis MST reduces the impact of connectivity with the riskier sectors of the network. In addition, the results show a compact postcrisis MST structure mainly due to the presence of several hubs that indicate a metastable market structure in comparison with the crisis and precrisis period MSTs [11,59].
Figure 7 presents the overall MST structure of the Pakistan stock market. As can be seen, the whole structure of PSX network revolves around one super hub node of DG khan company having 42 connections, followed by the important nodes of Nishat mills (NML 12), Fauji cement company (FCCL 7), and Pakistan state oil (PSO 7). Hence, the rise and fall of DGKC will give a huge impact on the stability structure of the PSX network, as mentioned by Sharif et al. [60] for the HWAN and MRES nodes of the Malaysian stock market network. The results also reveal a star-like less stable market structure of PSX during the entire period of study, similar to the structures of the Vietnamese stock exchange [40] and German stock exchange [61] during crises. The crisis-like structure is well-suited, given the turbulent timeline of 11 years for Pakistan that posed various challenges and threats, among the major being GFC, terrorism, and economic and political crisis. Furthermore, the results show a substantial clustering on the Pakistan stock exchange network because stocks mostly tend to cluster based on their economic activity.

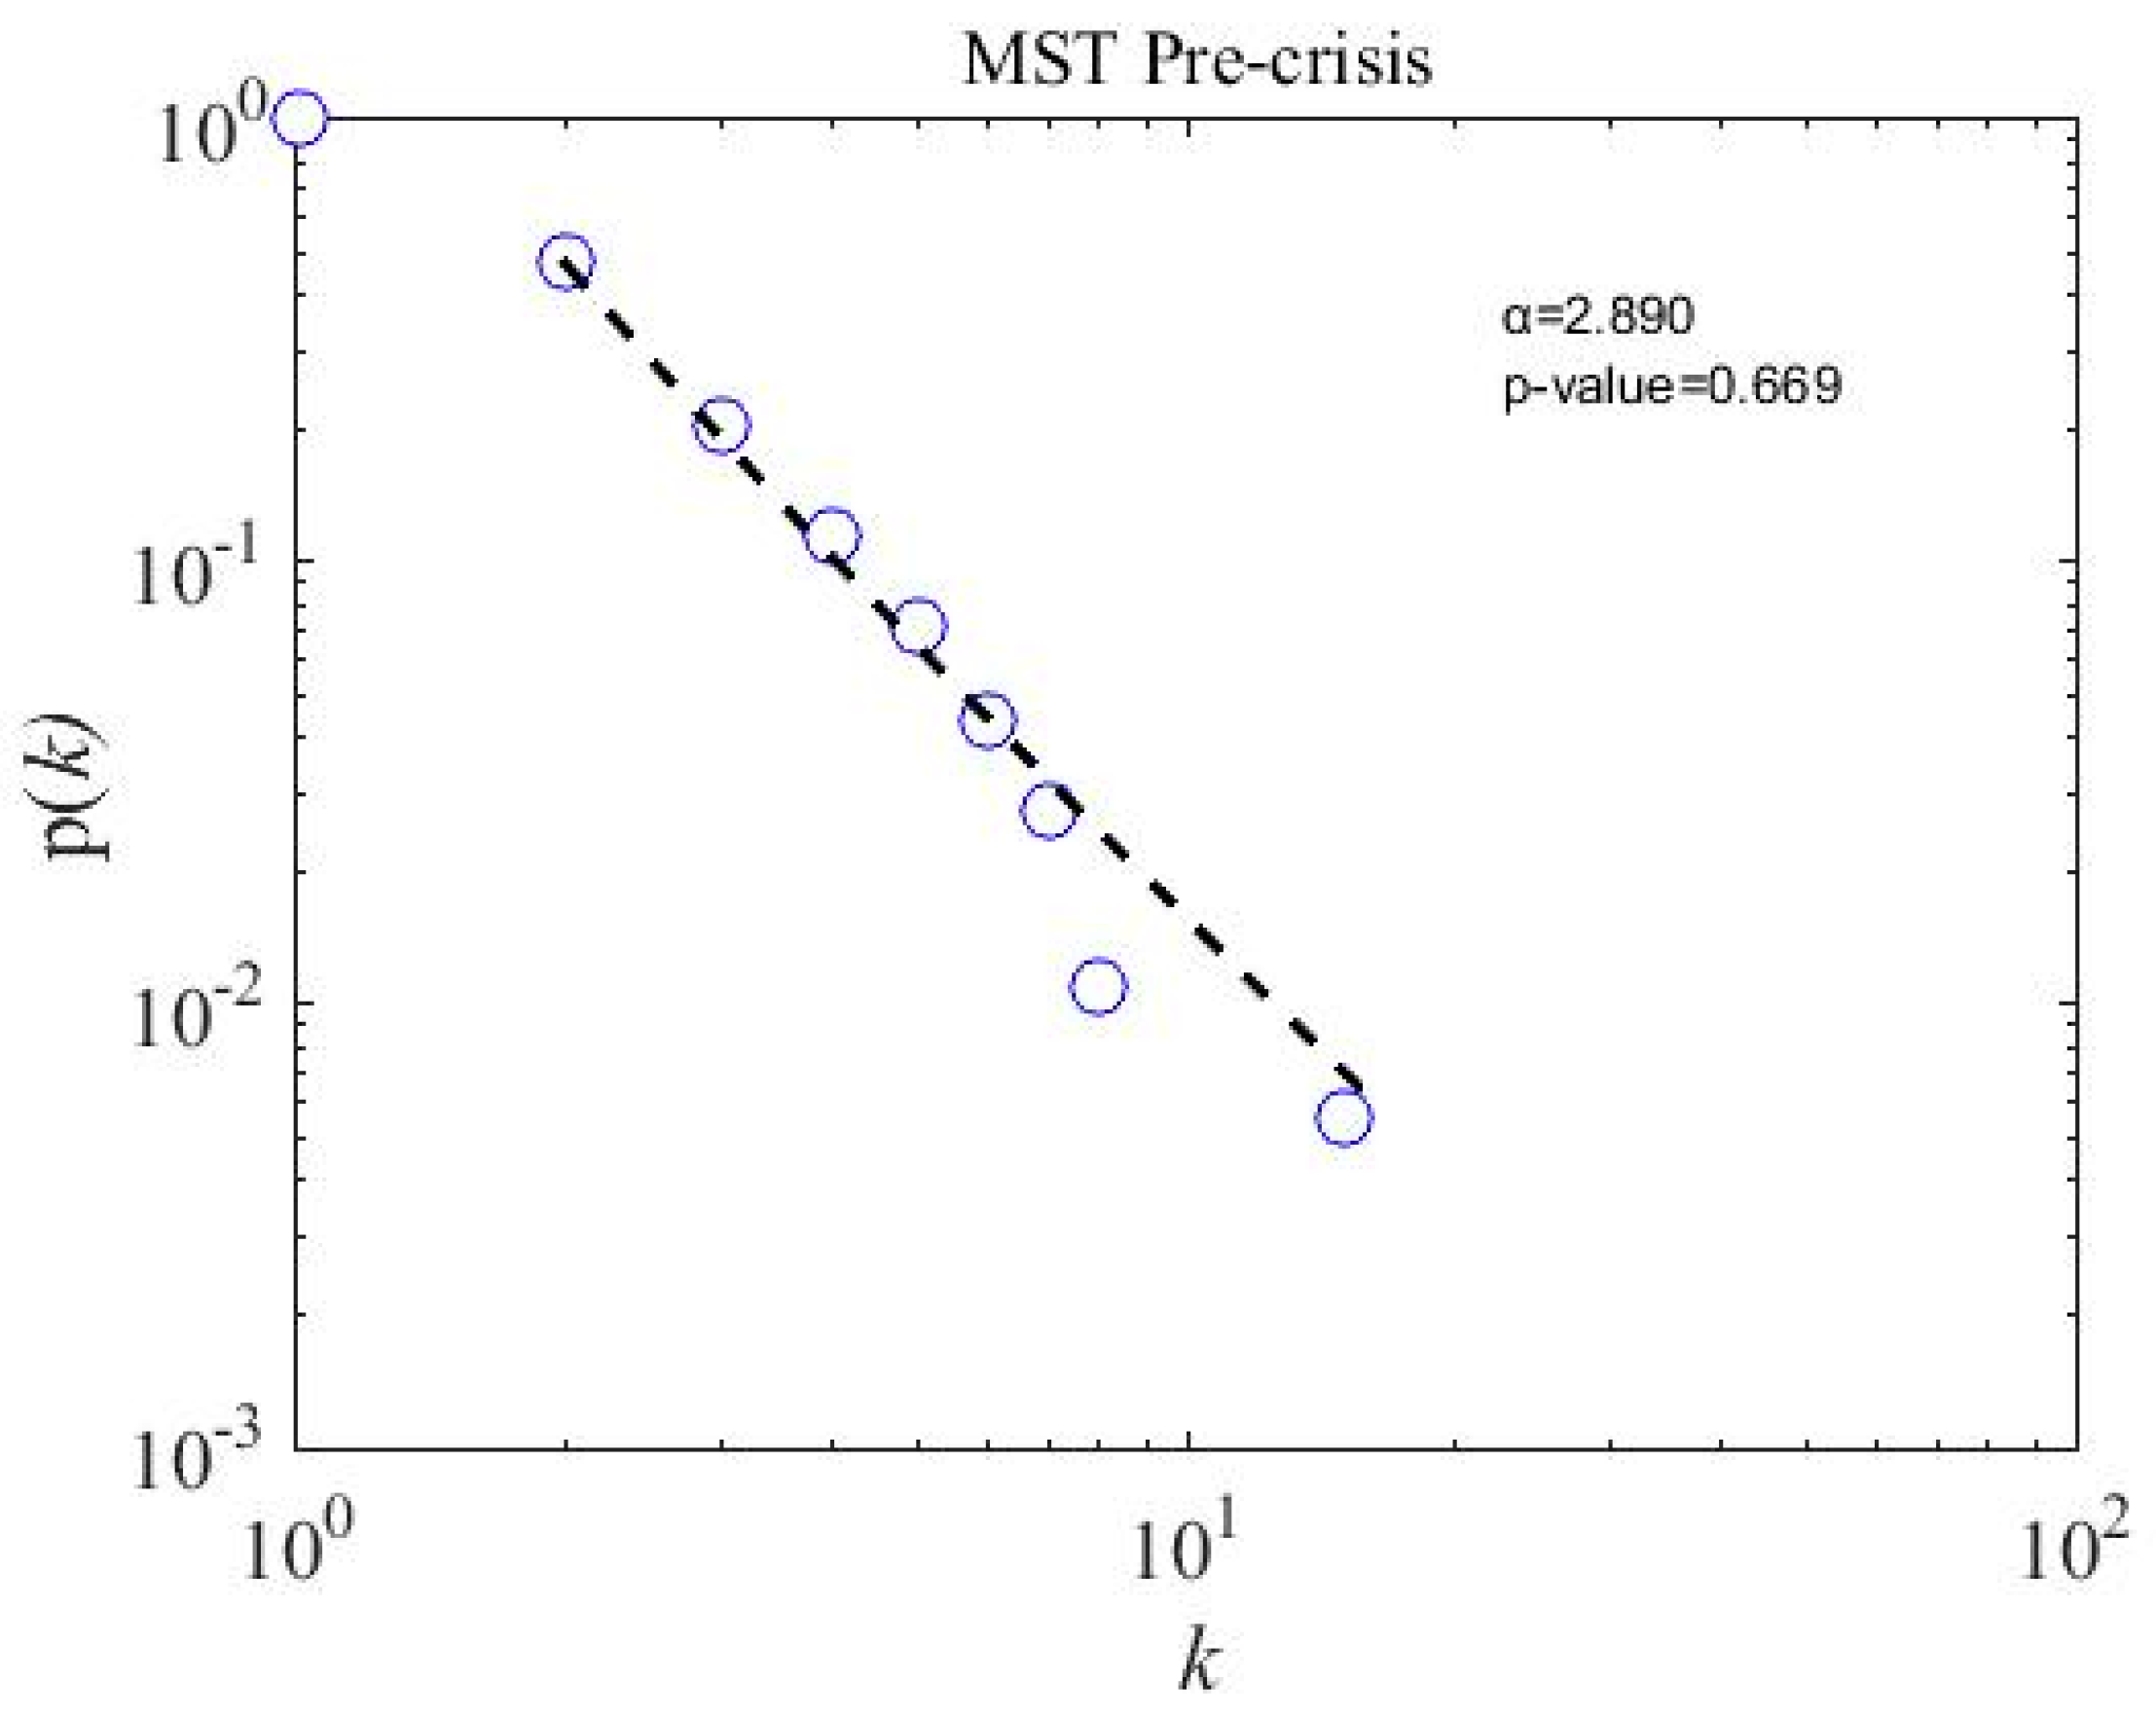
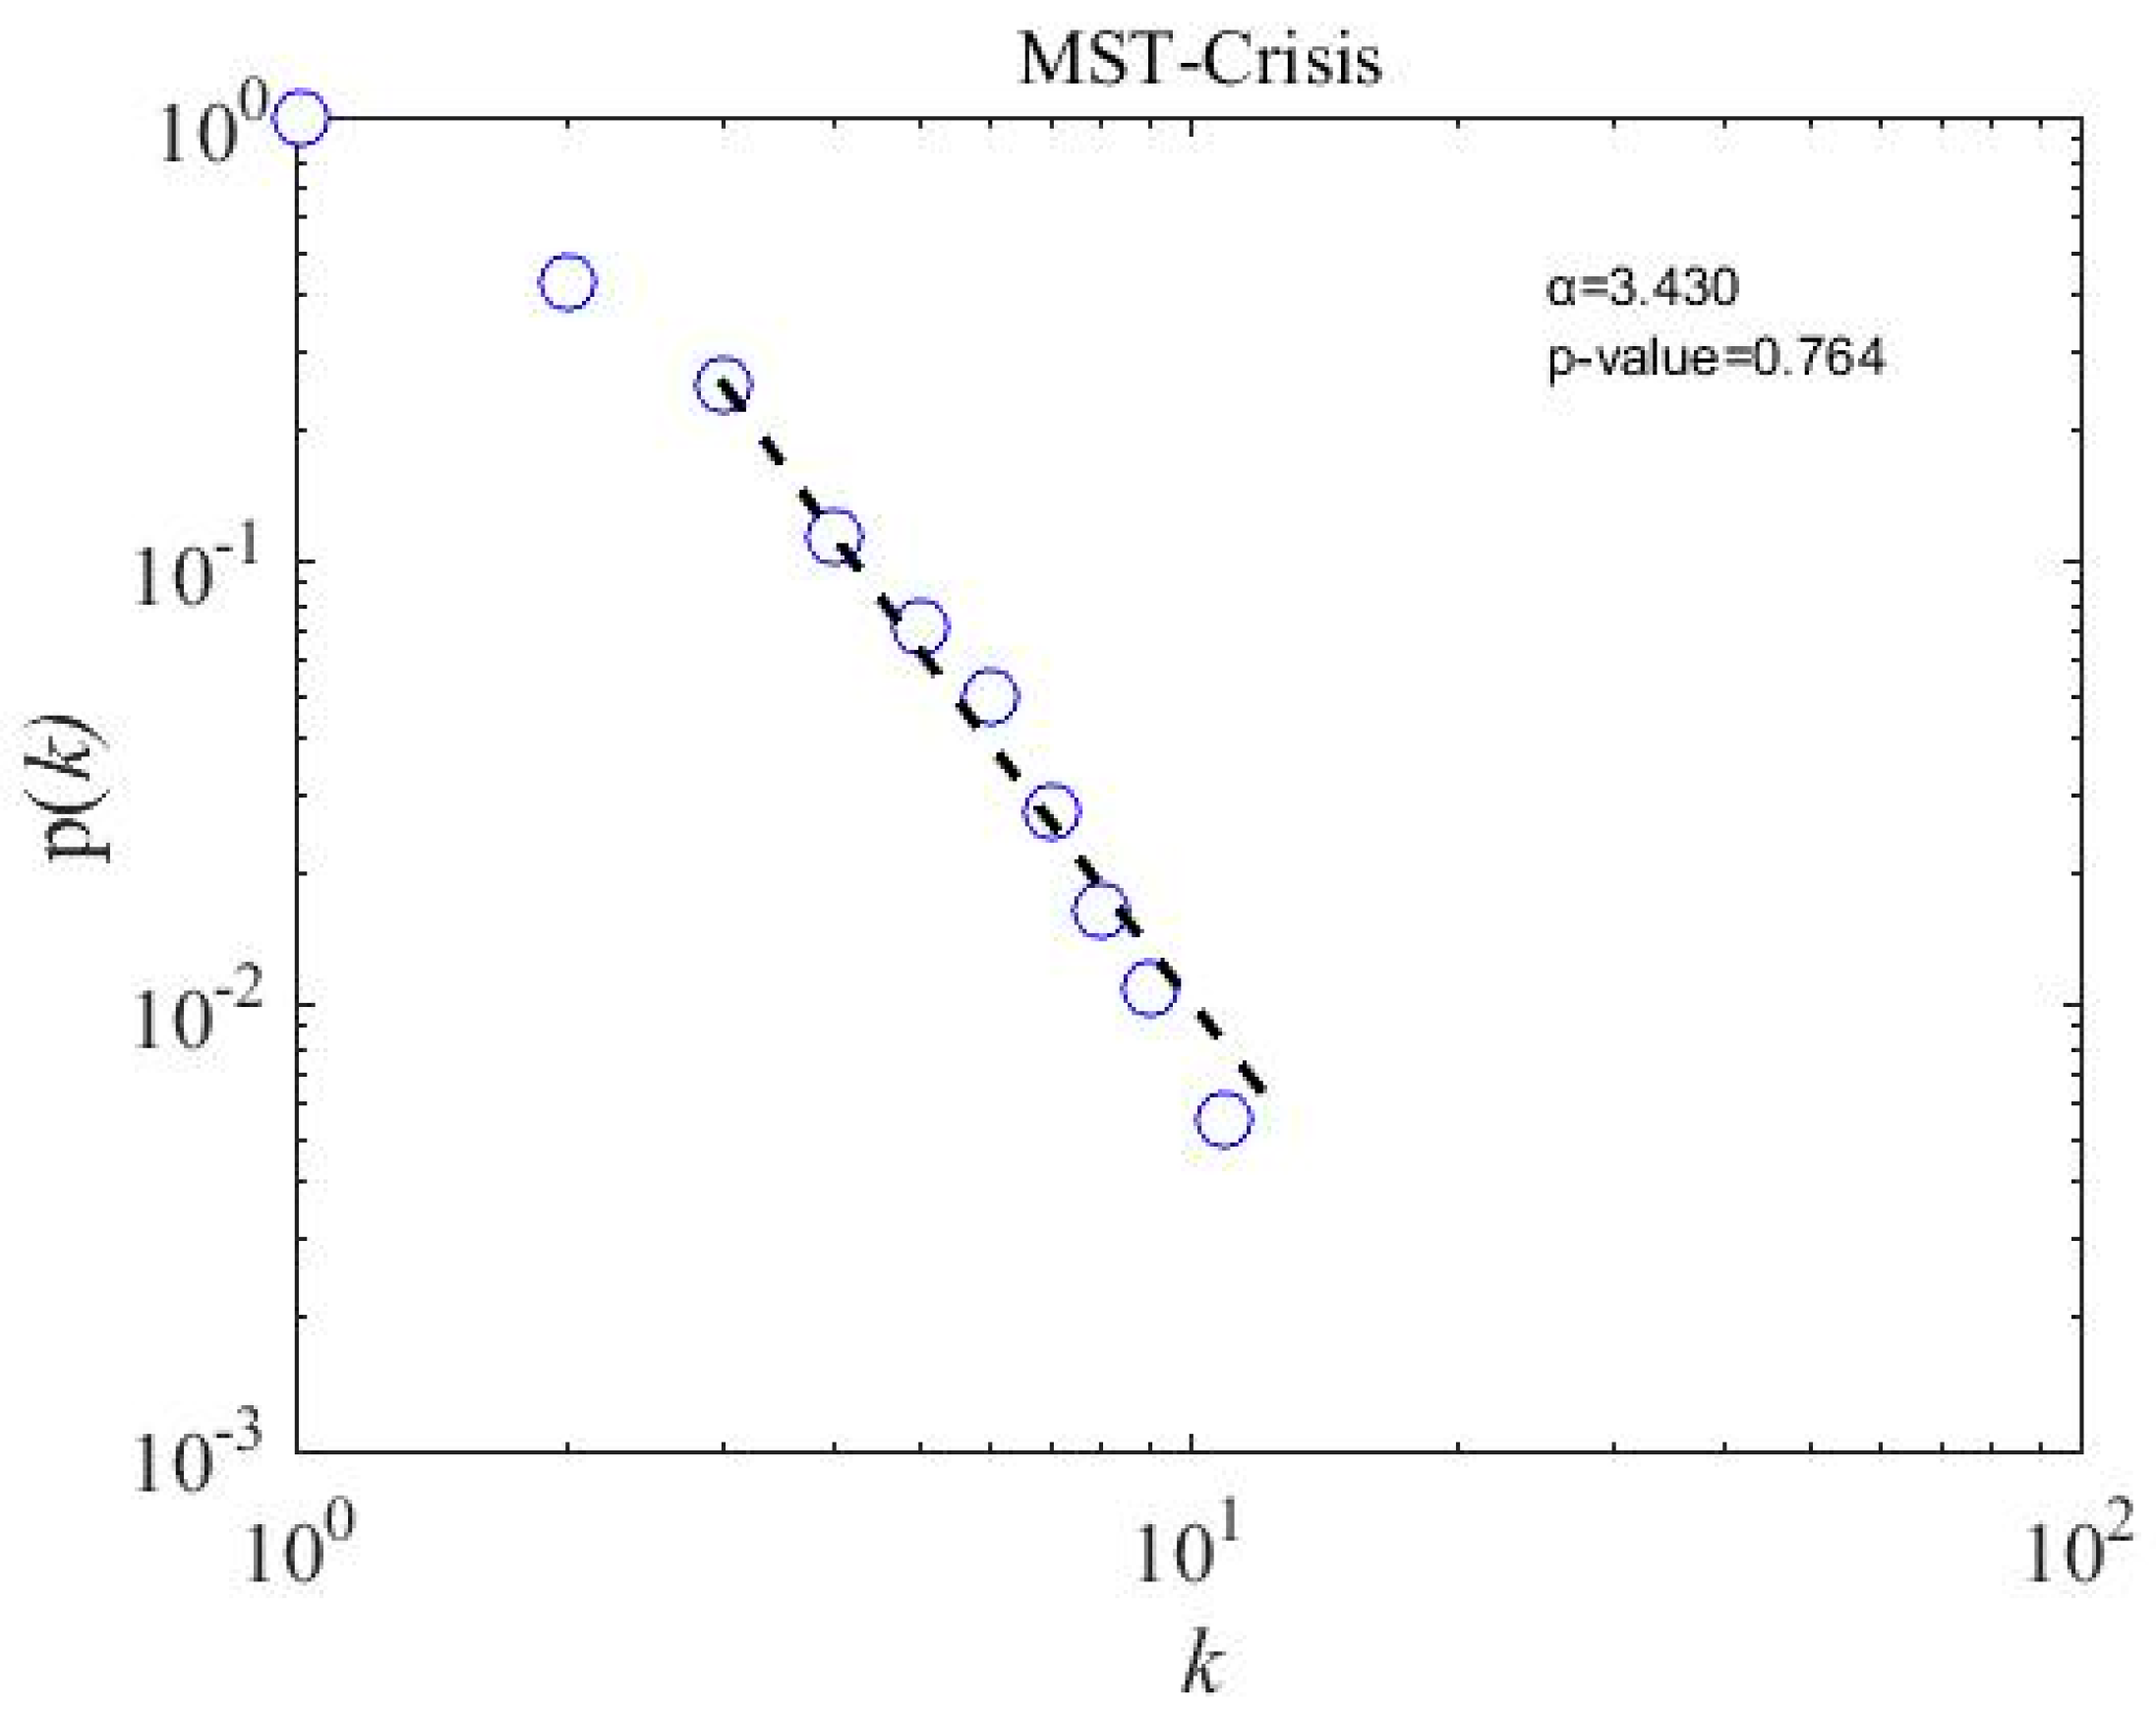
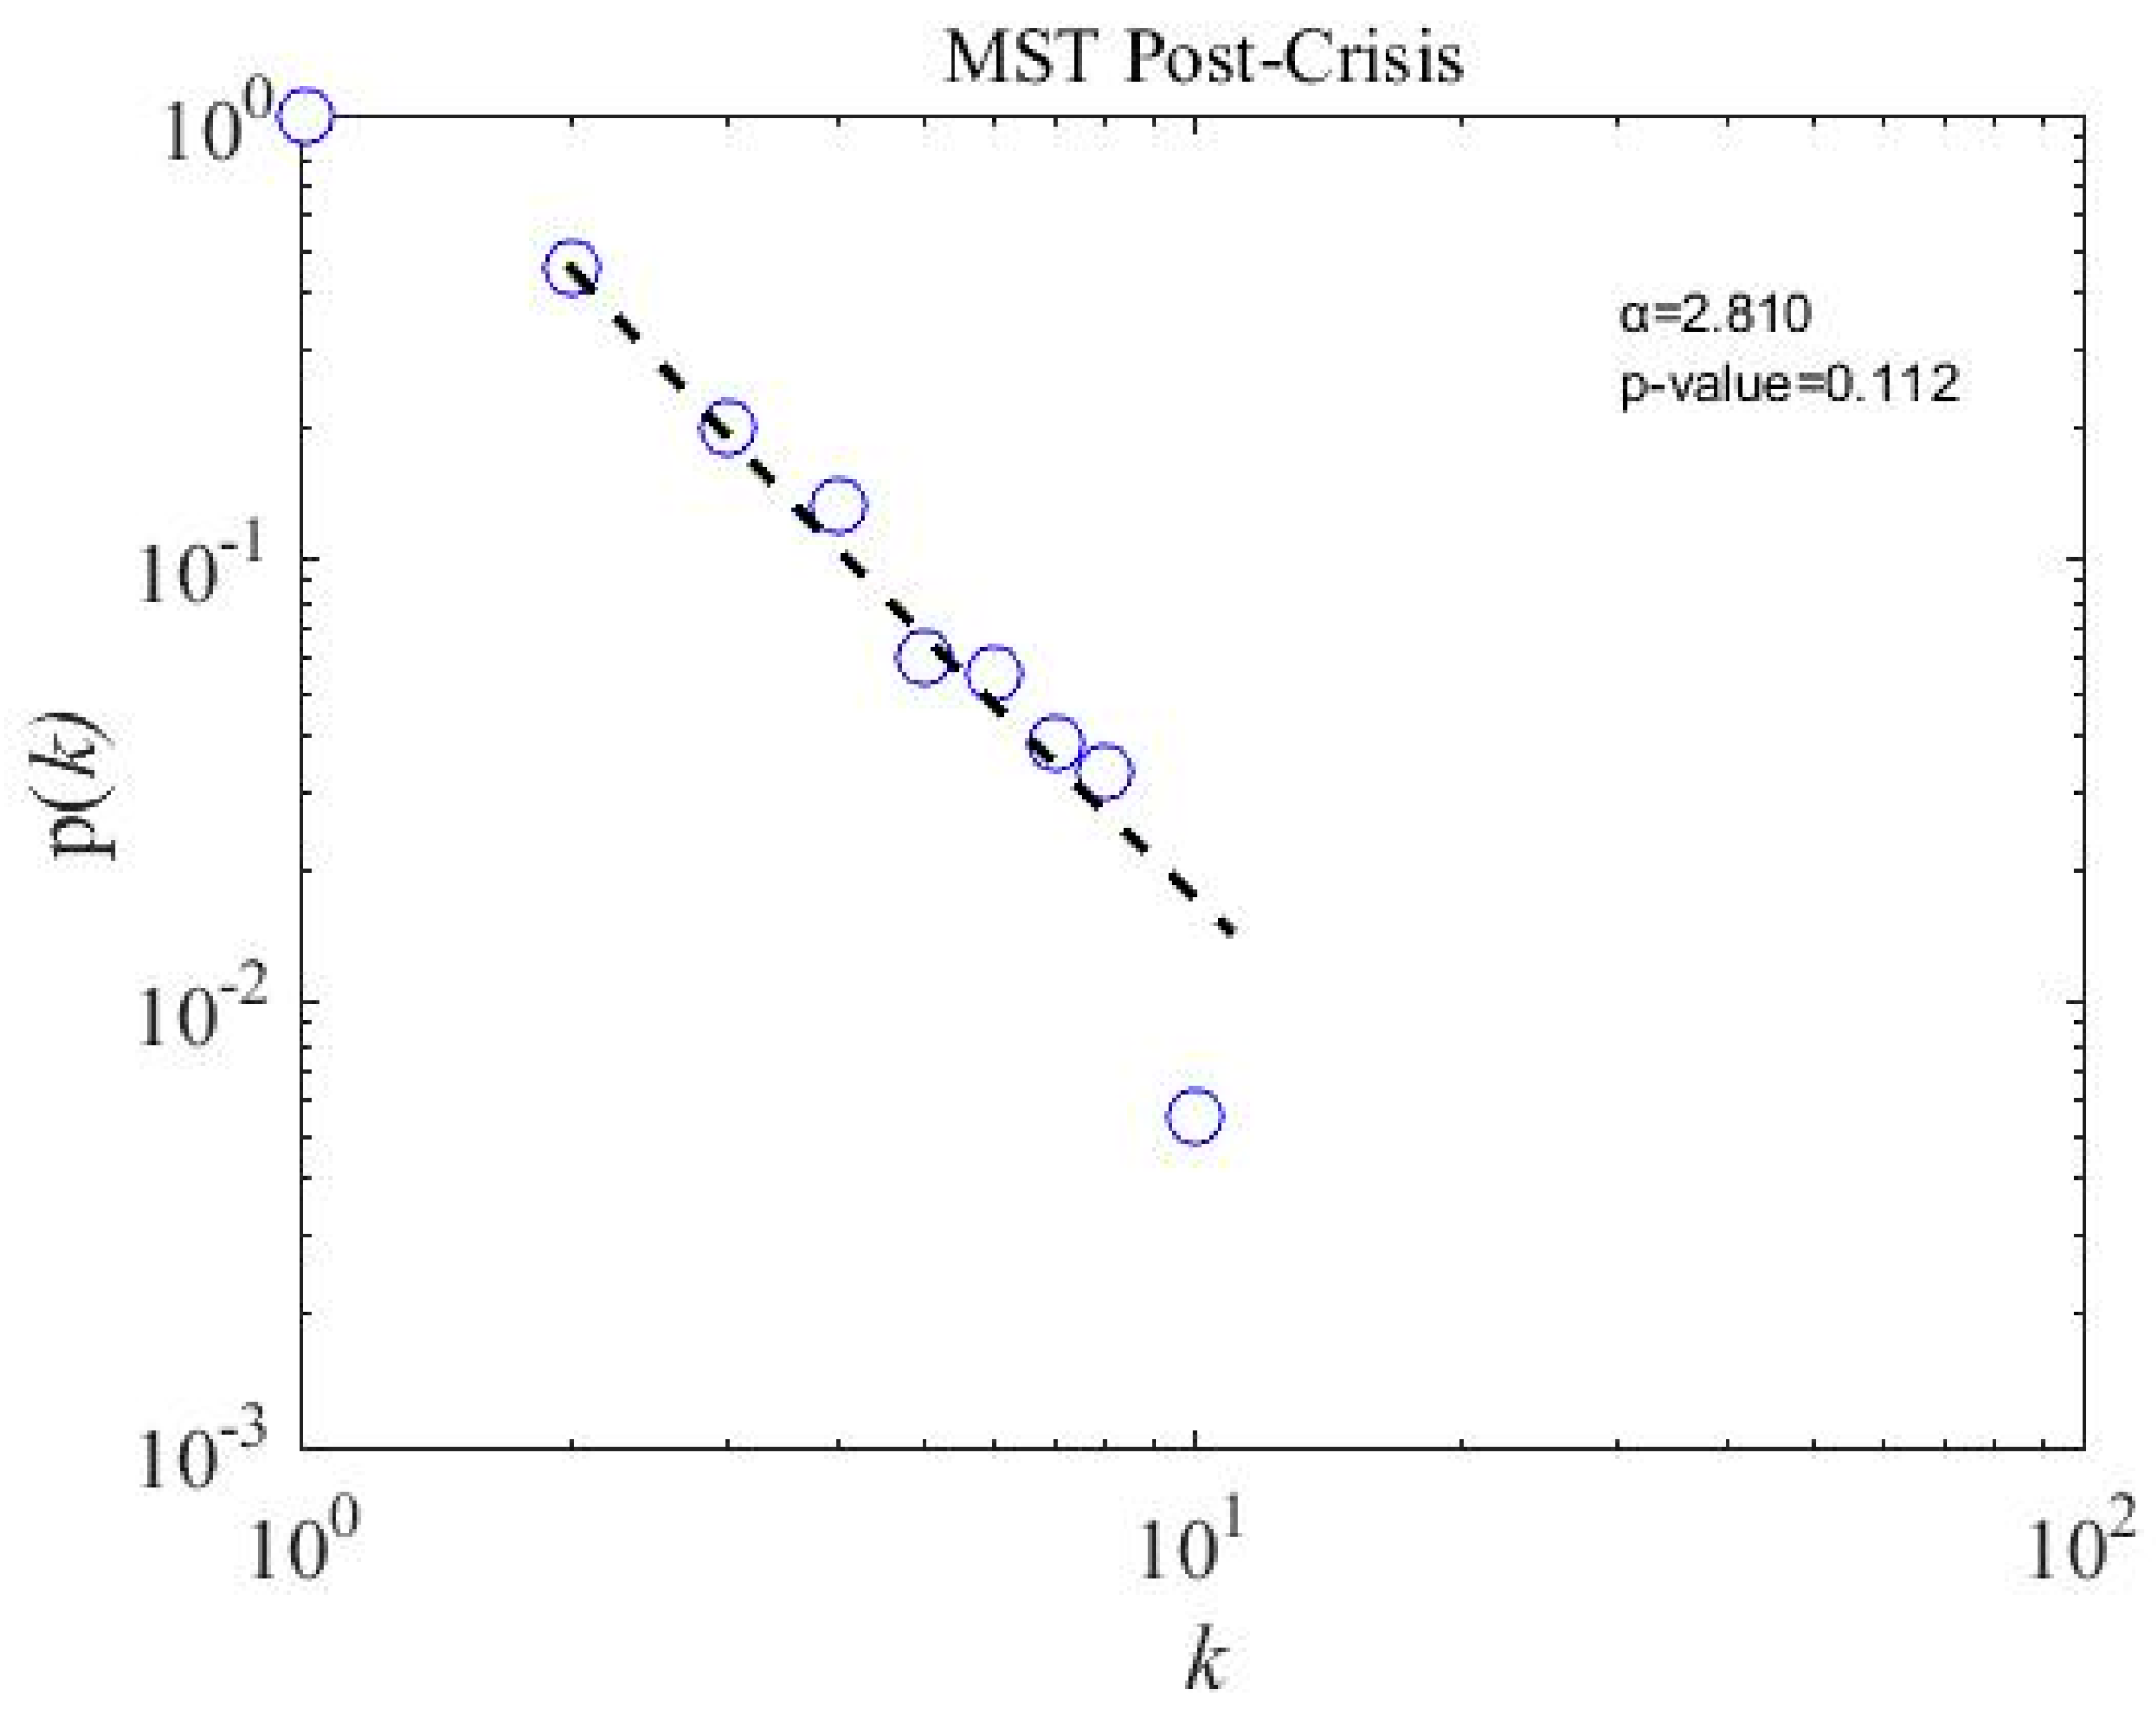
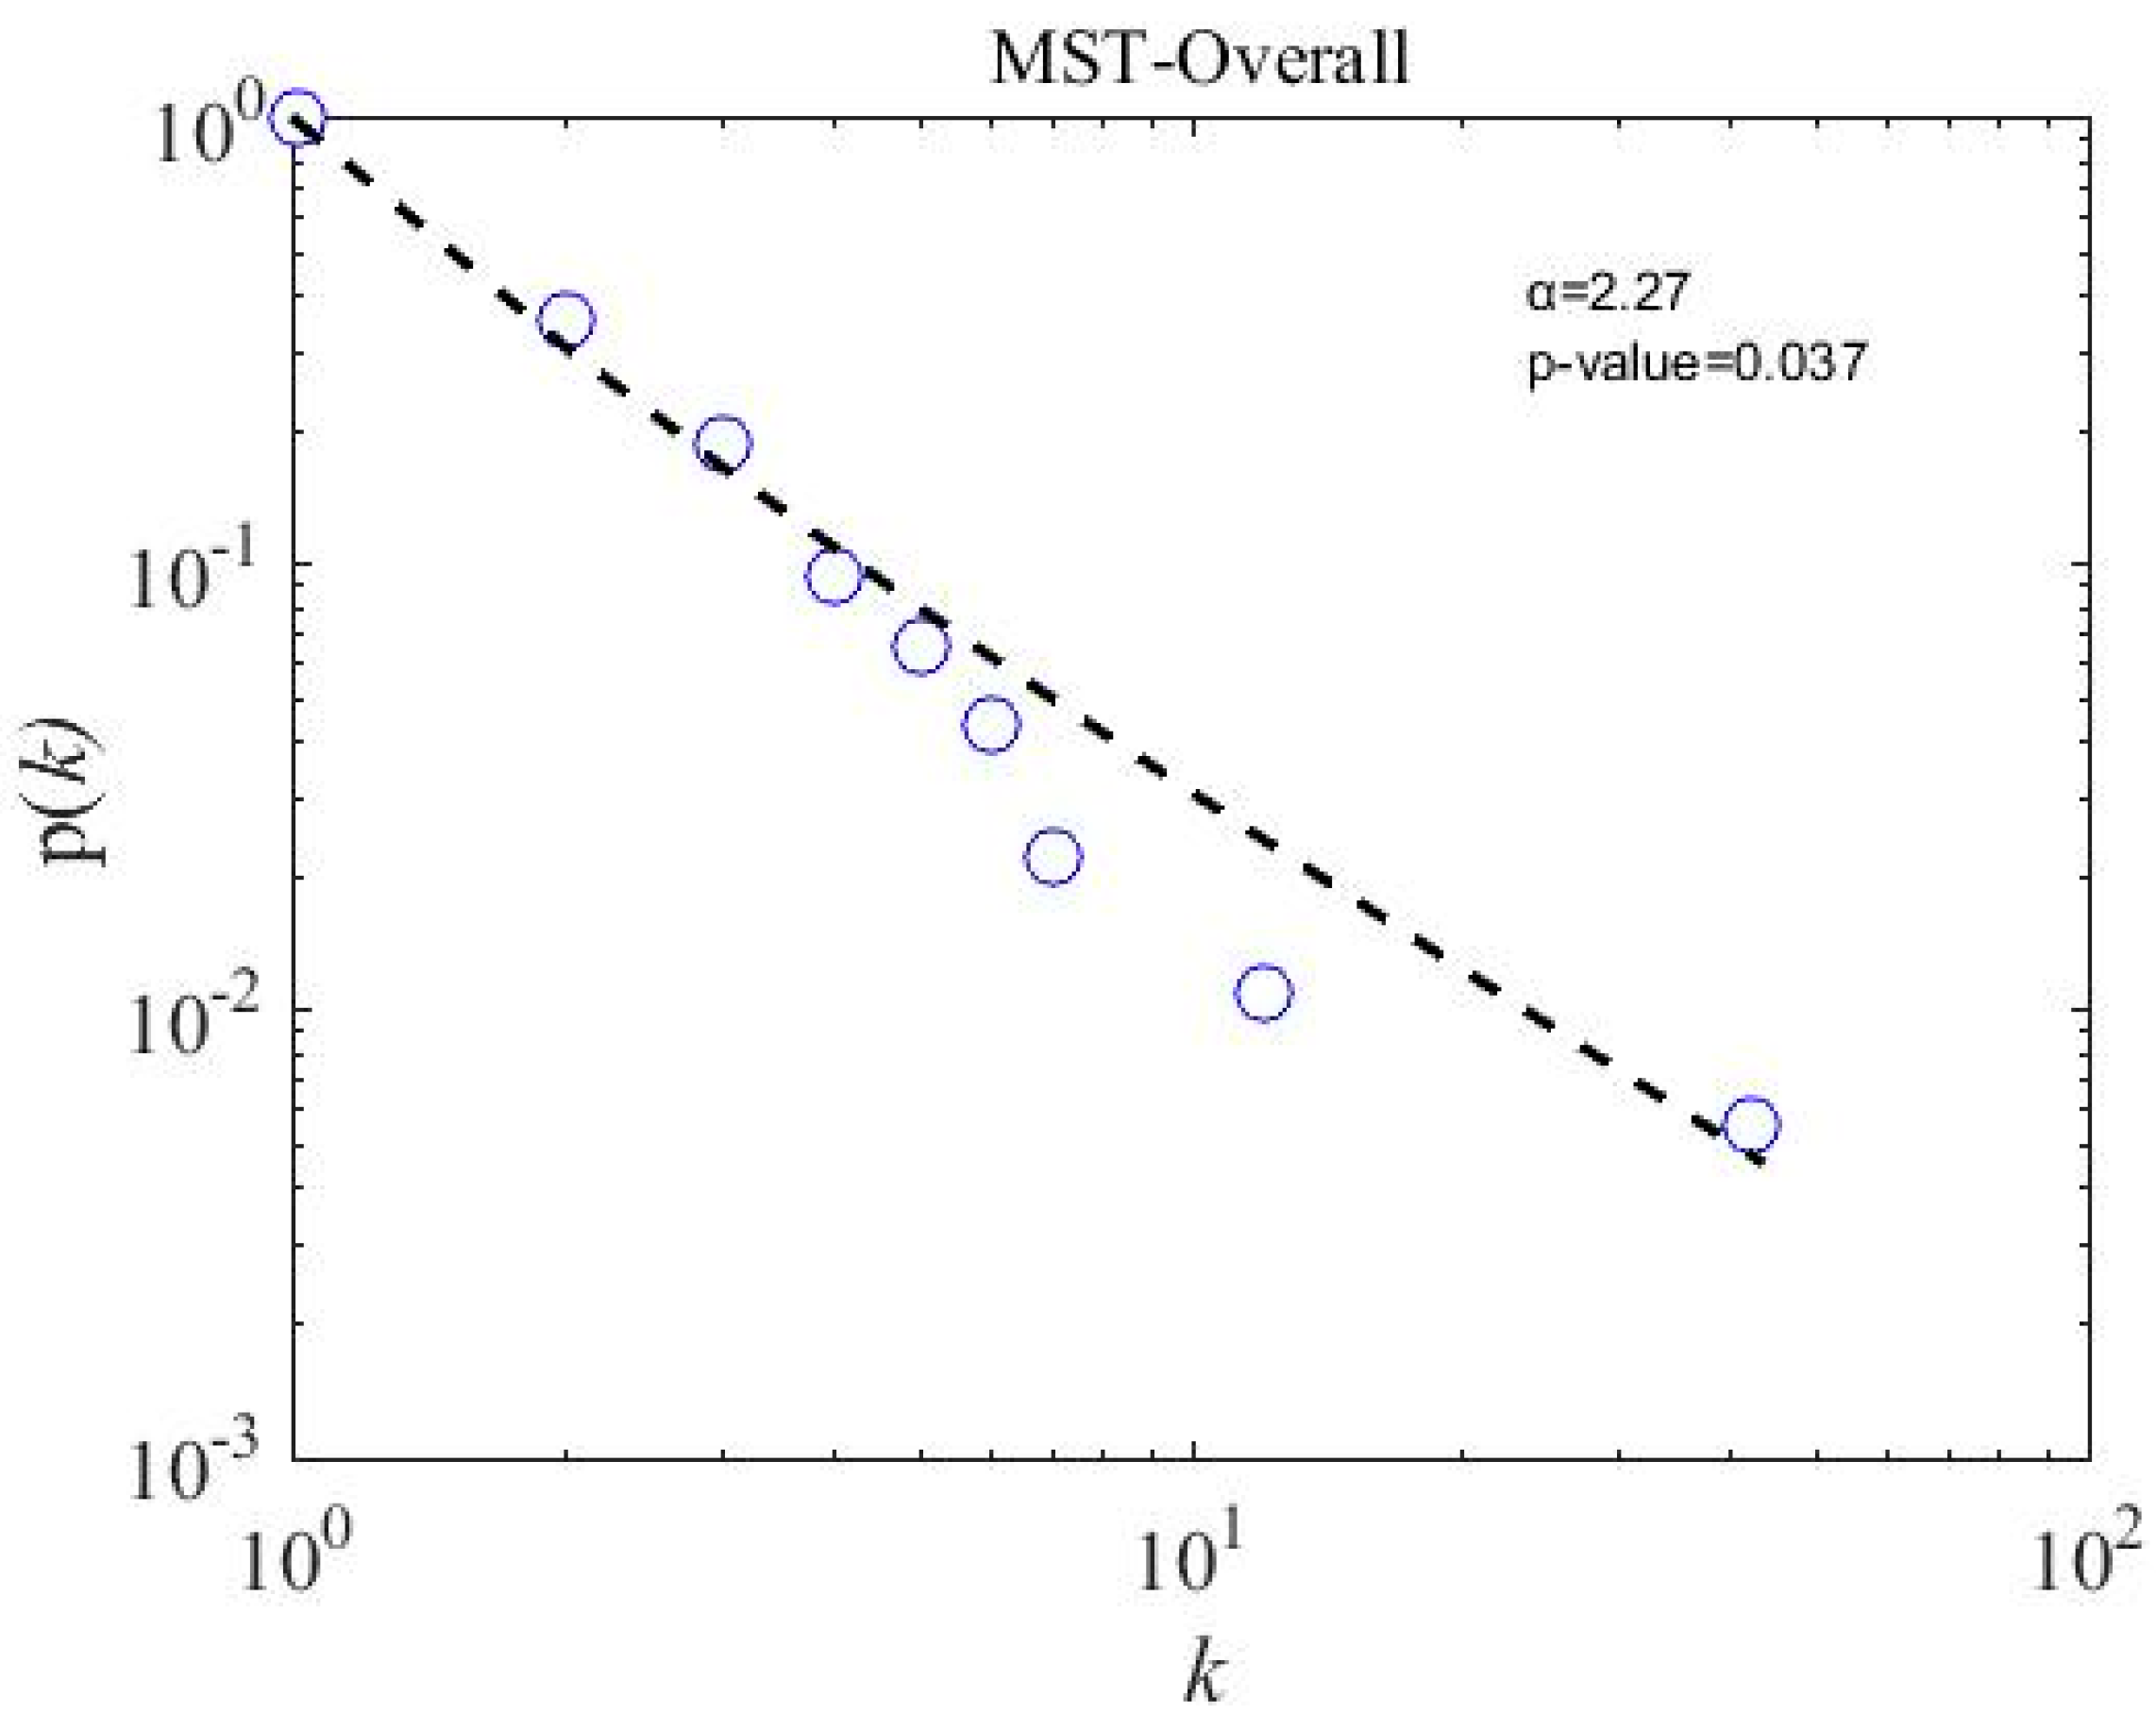
4.5. Scale-Free Strcuture of MSTs

We calculate the scale-free properties of the MST networks, a concept introduced by Barabasi and Albert in the year 1999 [62] and widely used in financial network literature [20,22,63,64]. The power-law degree distribution p ( k ) of node i and degree k has a power tail, such as p ( k ) ~ k α ; the network is said to be scale-free. We apply a powerful tool introduced by Clauset et al. [65] to observe the degree distribution of subsamples and overall MST networks. To accept the power-law hypothesis, the goodness-of-fit p -value must be larger than 0.1 [65]. The fitting results for three subsample periods are presented in Figure 8, Figure 9 and Figure 10. The p -value for three subsamples is larger than 0.1, which means that the degree distribution follows the power law. However, the p -value of the overall sample period stands at 0.037, shown in Figure 11, which implies not to accept the power-law hypothesis. Similarly, a star-like MST is also found by Nguyen et al. [40] for the Vietnamese stock market from the year 2011 to 2012, where the degree distribution does not fit with the power law distribution. In addition, the power-law exponent (the value of the power-law exponent α nearing 1.0 indicates the longer tail distribution) α for the crisis period is 3.430, which is higher than in the precrisis, α = 2.890 , and postcrisis, α = 2.810 , periods. Hence, a postcrisis degree distribution of MST has a longer tail distribution in comparison with the precrisis and crisis period MST networks. As can be seen in Figure 8, Figure 9 and Figure 10, the degree distribution of the postcrisis period is more compact than the pre- and crisis period.

4.6. Dynamic Structures of MSTs

In order to examine the consistency and dynamic evolution of the Pakistan stock market network, we divide the overall data sample into T = 11 rolling windows of width L (where L is the daily returns of N = 181 nodes starting from the first trading day of the year in the month of January and ending on the last trading day of the same year in the month of December) [66]. Thereafter, we construct yearly MSTs and present their finding of degree distribution and normalized tree lengths.

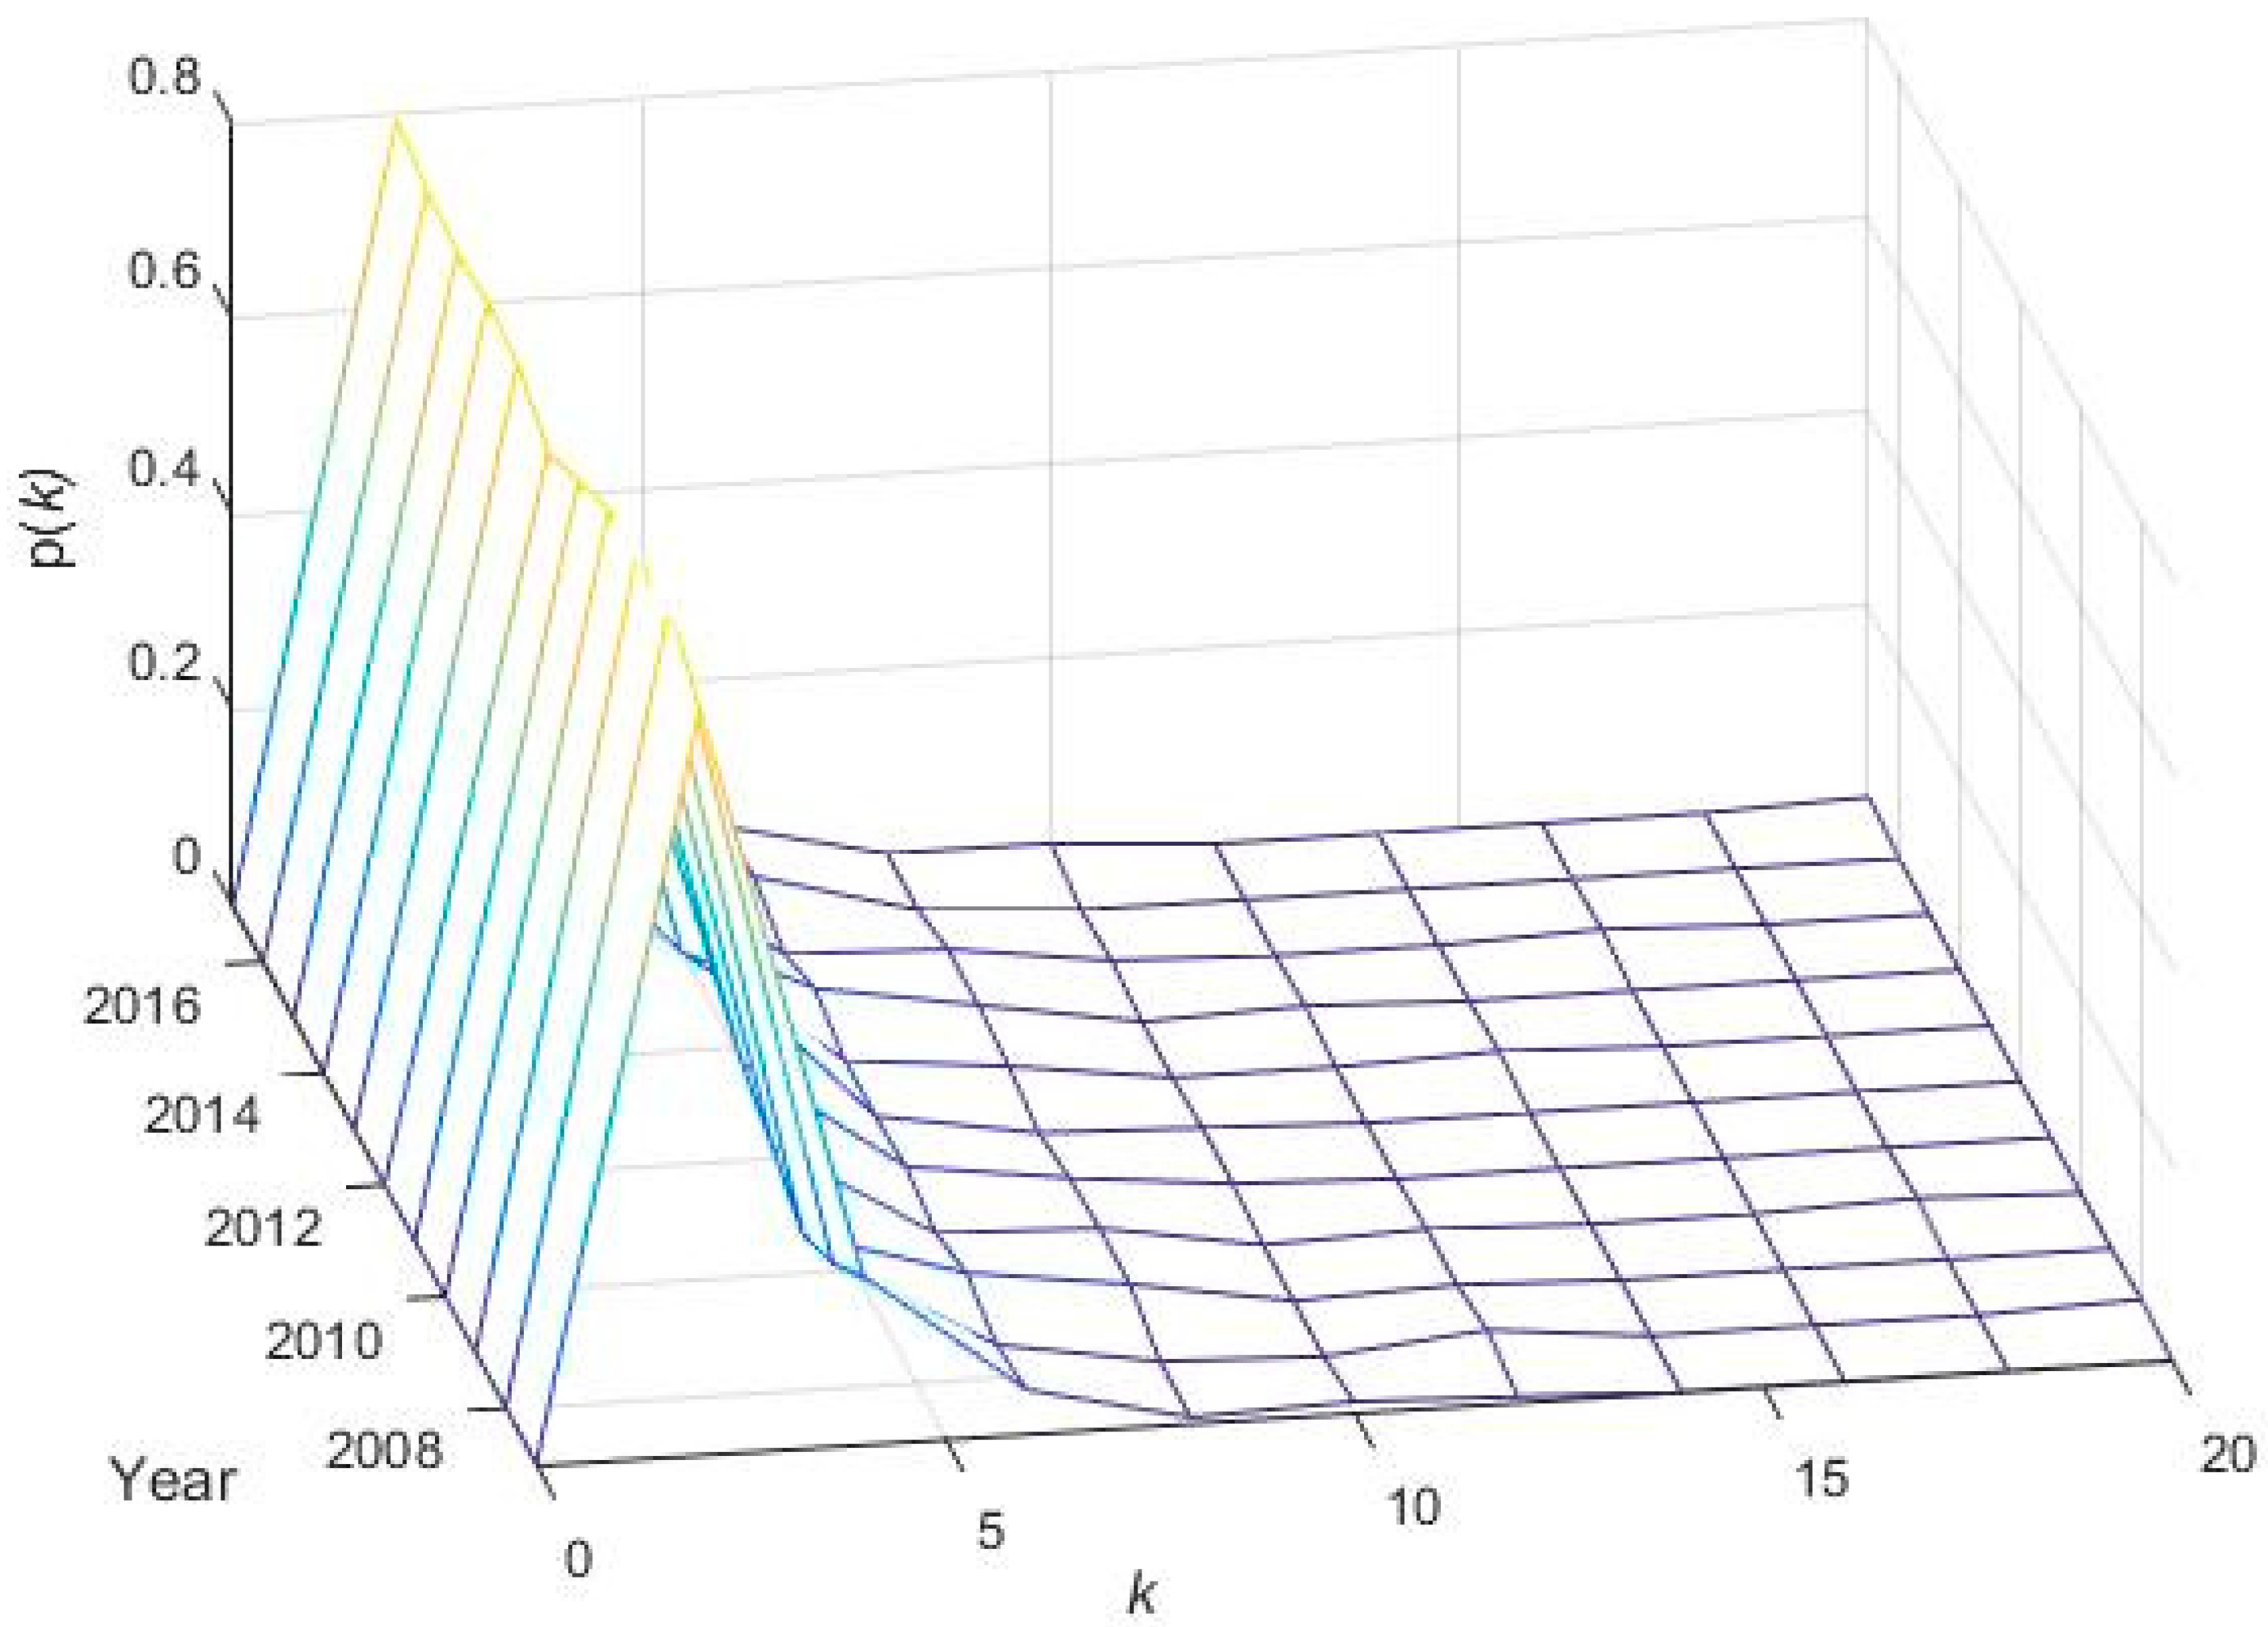
4.6.1. Degree Distribution

The degree distribution p ( k ) of dynamic MSTs of PSX is presented in Figure 12. We can observe a positively skewed degree distribution representing the heterogeneity of the system. However, the core nodes are largely interconnected in a minor portion, whereas a large number of peripheral nodes contain a relatively low number of linkages. This type of configuration represents several star-like MST structures, especially during the GFC in the year 2008 and the economic and political crisis in the year 2017 for the Pakistan stock market network.

4.6.2. Normalized Tree Length

According to Onnela et al. [67], the normalized tree length (NTL) of MST T = ( V , E ) can be calculated as follows:
L ( t ) = 1 n 1 ( i , j ) ϵ T d i j ( t )
where n is the nodes of the network in T and d i j is the distance among nodes i and j .
Figure 13 shows the time-varying result of a normalized tree length of the Pakistan stock market network. As can be seen, the lowest NTL curve during a GFC is observed for the PSX network in the year 2008 and implies a higher correlation among stocks. However, after getting a financial assistance package from the International monetary fund (IMF) to curb the GFC in the year 2008, the NTL curve shows a gradual increase and recovery that leads to expansion thereafter. In addition, the EU sovereign debt crisis appears to have no significant impact on the PSX network, and so, it is the flood and resultant property damages that affected 14 million people in the year 2010 [68]. To sum up, the results show that the crisis-related shocks of terrorism, politics, and economics resulted in the shrinkage of the PSX network.

5. Conclusions

In summary, we have investigated the structural change and dynamic evolution of the Pakistan stock market from January 2007 to December 2017. We applied the Shannon entropy on all 181 stocks acting as nodes in our study to calculate the stock market volatility with two different bins and listed the top five most and least volatile stocks. However, the main aim of our study was to examine the structural change in the Pakistan stock market network around a GFC; therefore, we divided the whole timeline into three different subperiods around a GFC. We show that the correlation among stocks of the Pakistan stock market are at the highest level during the time period of global financial crisis in the year 2008. The subsample results of correlation and distance matrices also reveal a higher mean correlation and resultant lower distances during a crisis period in comparison with the pre- and postcrisis periods. From the topology of nine threshold networks of subperiods, we noticed a comparatively high network density for the crisis period at low thresholds. Similarly, at a larger correlation threshold, a great number of nodes connect with each other during the crisis period, representing a tight correlation and instable market state in comparison with the pre- and postcrisis periods. In addition, we observed scale-free MSTs during the three subperiods and the scattered commercial banking sector in the precrisis, implying that financial crisis spread to other sectors of the Pakistan stock market through the commercial banking sector. The results further showed a metastable market state structure of MST and a recovery in the postcrisis period. Given the turbulent timeline of the overall period of study for Pakistan, the MST of the entire sample period of the Pakistan stock market revealed a crisis-like less stable market structure and the emergence of a super hub node: DG khan cement company (DGKC), belonging to the cement sector. However, a substantial clustering can be seen where nodes connect with each other based on their economic activity. To study the dynamic evolution of PSX, we presented a degree distribution and normalized tree length on 11 year rolling windows that showed several star-like positively skewed networks and a shrinkage of tree lengths due to the crisis-related shocks of terrorism, politics, economics, and finances.
All of these findings on the structural change and dynamic evolution will assist local and international investors of the Pakistan stock market in successfully managing their portfolios or to regulatory bodies to assess the stock market stability. In the future, we aim to explore the complexity and fractal dimensions of the PSX network.

Author Contributions

Conceptualization, B.A.M. and H.Y.; methodology, B.A.M.; software, B.A.M.; validation, B.A.M., and H.Y.; formal Analysis, B.A.M..; investigation, B.A.M.; resources, B.A.M. and H.Y.; data curation, B.A.M.; writing—original draft preparation, B.A.M.; writing—review and editing, H.Y. and B.A.M.; visualization, B.A.M.; supervision, H.Y.; project administration, B.A.M. and H.Y.; funding acquisition, H.Y.

Funding

This work was supported by the National Natural Science Foundation of China no. (71701082 and 71271103). This work would not have been possible without their support.

Conflicts of Interest

The authors declare no conflict of interest.

Appendix A

Table A1. A list of 181 stocks acting as nodes in the network of the Pakistan stock market classified by their respective industry sector and colored accordingly.
NodeTickerCompany NameSectorColor
1ABLAllied Bank LimitedCommercial BanksRED
2ABOTAbbot Laboatories (Pakistan) LimitedPharmaceuticalsGREEN
3ACPLAttock Cement (Pakistan) LimitedCementBLUE
4ADOSAdos Pakistan LimitedEngineeringHAZEL GREEN
5AGTLAl-Ghazi Tractors LimitedAutomobile AssemblerPURPLE
6AHCLArif Habib Corporation LimitedFertilizerOLIVE
7AICLAdamjee Insurance Company LimitedInsuranceCYAN
8AKBLAskari Bank LimitedCommercial BanksRED
9ANLAzgard Nine LimitedTextile CompositeKHAKI
10APLAttock Petroleum LimitedOil and Gas Marketing CompaniesORANGE
11ATBAAtlas Battery LimitedAutomobile Parts & AccessoriesPURPLE
12ATLHAtlas Honda LimitedAutomobile AssemblerPURPLE
13ATRLAttock Refinery LimitedRefineryINDIGO
14BAFLBank Al-Falah LimitedCommercial BanksRED
15BAHLBank Al-Habib LimitedCommercial BanksRED
16BATABata Pakistan LimitedLeather and TanneriesCELESTE
17BERGBerger Paints Pakistan LimitedChemicalYELLOW
18BIPLBankislami Pakistan LimitedCommercial BanksRED
19BNWMBannu Woollen Mills LimitedWoollenSALMON
20BOKBank of Khyber LimitedCommercial BanksRED
21BOPBank of Punjab LimitedCommercial BanksRED
22BPLBurshane LPG (Pakistan) LimitedOil and Gas Marketing CompaniesORANGE
23BRRB.R.R. Guardian ModarabaModarabasGREY
24BWCLBestway Cement LimitedCementBLUE
25BYCOByco Petroleum Pakistan LimitedRefineryINDIGO
26CENICentury Insurance Company LimitedInsuranceCYAN
27CEPBCentury Paper and Board Mills LimitedPaper and BoardSILVER
28CFLCrescent Fibres LimitedTextile SpinningKHAKI
29CHBLChenab LimitedTextile CompositeKHAKI
30CHCCCherat Cement Company LimitedCementBLUE
31CJPLCrescent Jute Proudcts LimitedJuteBLACK
32CLOVClover Pakistan LimitedFood and Personal Care ProductsCHARCOAL
33COLGColgate Palmolive (Pakistan) LimitedChemicalYELLOW
34CPPLCherat Packaging Limited.Paper and BoardSILVER
35CSAPCrescent Steel & Allied Products LimitedEngineeringHAZEL GREEN
36CSMCrescent Standard ModarabaModarabasGREY
37DAWHDawood Hercules Corporation LimitedFertilizerOLIVE
38DCLDewan Cement LimitedCementBLUE
39DFMLDewan Farooque Motors LimitedAutomobile AssemblerPURPLE
40DGKCD.G. Khan Cement Company LimitedCementBLUE
41DLLDawood Lawrancepur LimitedTextile CompositeKHAKI
42DNCCDandot Cement Company LimitedCementBLUE
43DSFLDewan Salman Fibre LimitedSynthetic and RayonPLATINUM
44DSILD.S. Industires LimitedTextile SpinningKHAKI
45DWSMDewan Sugar Mills LimitedSugar and Allied IndustriesMAGENTA
46DYNODynea Pakistan LimitedChemicalYELLOW
47ECOPEcopack LimitedMiscellaneousBROWN
48EFUGEFU General Insurance LimitedInsuranceCYAN
49EFULEFU Life Assurance LimitedInsuranceCYAN
50EMCOEmco Industries LimitedGlass and CeramicsGUNMETAL
51ENGROEngro Corporation LimitedFertilizerOLIVE
52EXIDEExide Pakistan LimitedAutomobile Parts and AccessoriesPURPLE
53FABLFaysal Bank LimitedCommercial BanksRED
54FCCLFauji Cement Company LimitedCementBLUE
55FCSCFirst Capital Securites Corporation LimitedInv. Banks/Inv. Cos./Securities Cos.LIME
56FDIBLFirst Dawood Investment Bank LimitedInv. Banks/Inv. Cos./Securities Cos.LIME
57FECMFirst Elite Capital ModarabaModarabasGREY
58FECTCFecto Cement LimitedCementBLUE
59FEMFirst Equity ModarbaModarabasGREY
60FEROZFerozsons Laboratories LimitedPharmaceuticalsGREEN
61FFBLFauji Fertilizer Bin Qasim LimitedFertilizerOLIVE
62FFCFauji Fertilizer Company LimitedFertilizerOLIVE
63FHAMFirst Habib Modarba LimitedModarabasGREY
64FNBMFirst National Bank ModarbaModarabasGREY
65FNELFirst National Equities LimitedInv. Banks/Inv. Cos./Securities Cos.LIME
66GADTGadoon Textile Mills LimitedTextile SpinningKHAKI
67GASFGolden Arrow Selected Funds LimitedClose-End Mutual FundROSEGOLD
68GATIGatron Industries LimitedSynthetic and RayonPLATINUM
69GATMGul Ahmed Textile Mills LimitedTextile CompositeKHAKI
70GHGLGhani Glass LimitedGlass and CeramicsGUNMETAL
71GHNLGhandara Nissan LimitedAutomobile AssemblerPURPLE
72GLAXOGlaxoSmithKline (Pakistan) LimitedPharmaceuticalsGREEN
73GTYRGeneral Tyre and Rubber Co. of Pakistan LimitedAutomobile Parts and AccessoriesPURPLE
74GWLCGharibwal Cement LimitedCementBLUE
75HABSMHabib Sugar Mills LimitedSugar and Allied IndustriesMAGENTA
76HALHabib-ADM LimitedSugar and Allied IndustriesMAGENTA
77HCARHonda Atlas Cars (Pakistan) LimitedAutomobile AssemblerPURPLE
78HICLHabib Insurance Company LimitedInsuranceCYAN
79HIFAHBL Investment FundClose-End Mutual FundROSEGOLD
80HINOHinoPak Motors LimitedAutomobile AssemblerPURPLE
81HINOONHighnoon Laboratories LimitedPharmaceuticalsGREEN
82HMBHabib Metropolitan Bank LimitedCommercial BanksRED
83HSPIHuffaz Seamless Pipe Industries LimitedEngineeringHAZEL GREEN
84HUBCHub Power Company LimitedPower Generation and DistributionLIGHTBLUE
85HUMNLHum Network LimitedTechnology and CommunicationTEAL
86ICII.C.I. Pakistan LimitedChemicalYELLOW
87ICIBLInvest Capital Investment Bank LimitedInv. Banks/Inv. Cos./Securities Cos.LIME
88IGIHLIGI Holdings LimitedInsuranceCYAN
89INDUIndus Motor Company LimitedAutomobile AssemblerPURPLE
90INILInternational Industries LimitedEngineeringHAZEL GREEN
91JGICLJubilee General Insurance Company LimitedInsuranceCYAN
92JLICLJubilee Life Insurance Company LimitedInsuranceCYAN
93JOPPJohnson and Phillips (Pakistan) LimitedCable and Electric GoodsCREAM
94JPGLJapan Power Generation LimitedPower Generation and DistributionLIGHTBLUE
95JSCLJahangir Siddiqui Company LimitedInv. Banks/Inv. Cos./Securities Cos.LIME
96JSGCLJS Global Capital LimitedInv. Banks/Inv. Cos./Securities Cos.LIME
97KAPCOKot Addu Power Company LimitedPower Generation and DistributionLIGHTBLUE
98KELK-Electric LimitedPower Generation and DistributionLIGHTBLUE
99KOHCKohat Cement LimitedCementBLUE
100KOHEKohinoor Energy LimitedPower Generation and DistributionLIGHTBLUE
101KTMLKohinoor Textile Mills LimitedTextile CompositeKHAKI
102LUCKLucky Cement LimitedCementBLUE
103MACFLMacpac Films LimitedMiscellaneousBROWN
104MARIMari Petroleum Company LimitedOil and Gas Exploration CompaniesORANGE
105MCBMCB Bank LimitedCommercial BanksRED
106MEBLMeezan Bank LimitedCommercial BanksRED
107MERITMerit Packaging LimitedPaper and BoardSILVER
108MFFLMitchells Fruit Farms LimitedFood and Personal Care ProductsCHARCOAL
109MLCFMaple Leaf Cement Factory LimitedCementBLUE
110MRNSMehran Sugar Mills LimitedSugar and Allied IndustriesMAGENTA
111MTLMillat Tractors LimitedAutomobile AssemblerPURPLE
112MUREBMurree Brewery Company LimitedFood and Personal Care ProductsCHARCOAL
113MZSMMirza Sugar Mills LimitedSugar and Allied IndustriesMAGENTA
114NATFNational Foods LimitedFood and Personal Care ProductsCHARCOAL
115NBPNational Bank of PakistanCommercial BanksRED
116NCLNishat Chunian LimitedTextile CompositeKHAKI
117NESTLENestle Pakistan LimitedFood and Personal Care ProductsCHARCOAL
118NETSOLNetSol Technologies LimitedTechnology and CommunicationTEAL
119NICLNimir Industrial Chemicals LimitedChemicalYELLOW
120NMLNishat Mills LimitedTextile CompositeKHAKI
121NRLNational Refinery LimitedRefineryINDIGO
122OGDCOil and Gas Development Company LimitedOil and Gas Exploration CompaniesORANGE
123OLPLOrix Leasing Pakistan LimitedLeasingNAVY
124OTSUOtsuka Pakistan LimitedPharmaceuticalsGREEN
125PAELPak Elektron LimitedCable and Electric GoodsCREAM
126PAKDPak Datacom LimitedTechnology and CommunicationTEAL
127PAKOXYPakistan Oxygen LimitedChemicalYELLOW
128PAKRIPakistan Reinsurance Company LimitedInsuranceCYAN
129PAKTPakistan Tobacco Company LimitedTobaccoCORAL
130PCALPakistan Cables LimitedCable and Electric GoodsCREAM
131PIAAPakistan International Airlines CorporationTransportMAROON
132PICTPakistan International Container Terminal LimitedTransportMAROON
133PINLPremier Insurance LimitedInsuranceCYAN
134PIOCPioneer Cement LimitedCementBLUE
135PKGSPackages LimitedPaper and BoardSILVER
136PMIFirst Prudential ModarbaModarabasGREY
137PMPKPhilip Morris (Pakistan) LimitedTobaccoCORAL
138PNSCPakistan National Shipping Corporation LimitedTransportMAROON
139POLPakistan Oilfields LimitedOil and Gas Exploration CompaniesORANGE
140PPLPakistan Petroleum LimitedOil and Gas Exploration CompaniesORANGE
141PRLPakistan Refinery LimitedRefineryINDIGO
142PSELPakistan Services LimitedMiscellaneousBROWN
143PSMCPak Suzuki Motor Company LimitedAutomobile AssemblerPURPLE
144PSOPakistan State Oil Company LimitedOil and Gas Marketing CompaniesORANGE
145PTCPakistan Telecommunication Company LimitedTechnology and CommunicationTEAL
146QUICEQuice Food LimitedFood and Personal Care ProductsCHARCOAL
147SAPLSanofi-Aventis Pakistan LimitedPharmaceuticalsGREEN
148SBLSamba Bank LimitedCommercial BanksRED
149SEARLThe Searle Company LimitedPharmaceuticalsGREEN
150SEPLSecurity Paper LimitedPaper and BoardSILVER
151SHELShell Pakistan LimitedOil and Gas Marketing CompaniesORANGE
152SHEZShezan International LimitedFood and Personal Care ProductsCHARCOAL
153SHFAShifa International Hospitals LimitedMiscellaneousBROWN
154SHSMLShahmurad Sugar Mills LimitedSugar and Allied IndustriesMAGENTA
155SIEMSiemens Pakistan Engineering Co. LimitedCable and Electric GoodsCREAM
156SILKSilkbank LimitedCommercial BanksRED
157SITCSitara Chemical Industries LimitedChemicalYELLOW
158SMTMSamin Textiles LimitedTextile WeavingKHAKI
159SNAISana Industries LimitedTextile SpinningKHAKI
160SNBLSoneri Bank LimitedCommercial BanksRED
161SNGPSui Northern Gas Pipelines LimitedOil and Gas Marketing CompaniesORANGE
162SPLCSaudi Pak Leasing Company LimitedLeasingNAVY
163SRVIService Industries LimitedLeather and TanneriesCELESTE
164SSGCSui Southern Gas Company LimitedOil and Gas Marketing CompaniesORANGE
165STCLShabbir Tiles and Ceramics LimitedGlass and CeramicsGUNMETAL
166STPLSiddiqsons Tin Plate LimitedMiscellaneousBROWN
167TELETelecard LimitedTechnology and CommunicationTEAL
168TGLTariq Glass Industries LimitedGlass and CeramicsGUNMETAL
169THALLThal LimitedAutomobile Parts and AccessoriesPURPLE
170TREETTreet Corporation LimitedFood and Personal Care ProductsCHARCOAL
171TRGTRG Pakistan LimitedTechnology and CommunicationTEAL
172TRIBLTrust Investment Bank LimitedInv. Banks/Inv. Cos./Securities Cos.LIME
173TRIPFTri-Pack Films LimitedMiscellaneousBROWN
174TSPLTri-Star Power LimitedPower Generation and DistributionLIGHTBLUE
175UBLUnited Bank LimitedCommercial BanksRED
176UDPLUnited Distributors Pakistan LimitedMiscellaneousBROWN
177WAHNWah Noble Chemicals LimitedChemicalYELLOW
178WAVESWaves Singer Pakistan LimitedCable and Electric GoodsCREAM
179WTLWorldCall Telecom LimitedTechnology and CommunicationTEAL
180ZILZIL LimitedFood and Personal Care ProductsCHARCOAL
181ZTLZephyr Textile LimitedTextile WeavingKHAKI

References

  1. Chen, Y.; Mantegna, R.N.; Pantelous, A.A.; Zuev, K.M. A dynamic analysis of S&P 500, FTSE 100 and EURO STOXX 50 indices under different exchange rates. PLoS ONE 2018, 13, e0194067. [Google Scholar] [PubMed]
  2. Mantegna, R.N. Hierarchical structure in financial markets. Eur. Phys. J. B 1999, 11, 193–197. [Google Scholar] [CrossRef]
  3. Dias, J. Spanning trees and the Eurozone crisis. Phys. A Stat. Mech. Its Appl. 2013, 392, 5974–5984. [Google Scholar] [CrossRef]
  4. Matesanz, D.; Ortega, G.J. Sovereign public debt crisis in Europe. A network analysis. Phys. A Stat. Mech. Its Appl. 2015, 436, 756–766. [Google Scholar] [CrossRef]
  5. Majapa, M.; Gossel, S.J. Topology of the South African stock market network across the 2008 financial crisis. Phys. A Stat. Mech. Its Appl. 2016, 445, 35–47. [Google Scholar] [CrossRef]
  6. Zhao, L.; Li, W.; Cai, X. Structure and dynamics of stock market in times of crisis. Phys. Lett. A 2016, 380, 654–666. [Google Scholar] [CrossRef]
  7. Onnela, J.P.; Chakraborti, A.; Kaski, K.; Kertész, J. Dynamic asset trees and Black Monday. Phys. A Stat. Mech. Its Appl. 2003, 324, 247–252. [Google Scholar] [CrossRef]
  8. Li, B.; Pi, D. Analysis of global stock index data during crisis period via complex network approach. PLoS ONE 2018, 13, e0200600. [Google Scholar] [CrossRef]
  9. Xia, L.; You, D.; Jiang, X.; Guo, Q. Comparison between global financial crisis and local stock disaster on top of Chinese stock network. Phys. A Stat. Mech. Its Appl. 2018, 490, 222–230. [Google Scholar] [CrossRef]
  10. Jang, W.; Lee, J.; Chang, W. Currency crises and the evolution of foreign exchange market: Evidence from minimum spanning tree. Phys. A Stat. Mech. Its Appl. 2011, 390, 707–718. [Google Scholar] [CrossRef]
  11. Nobi, A.; Maeng, S.E.; Ha, G.G.; Lee, J.W. Structural changes in the minimal spanning tree and the hierarchical network in the Korean stock market around the global financial crisis. J. Korean Phys. Soc. 2015, 66, 1153–1159. [Google Scholar] [CrossRef]
  12. Tumminello, M.; Aste, T.; Di Matteo, T.; Mantegna, R.N. A tool for filtering information in complex systems. Proc. Natl. Acad. Sci. USA 2005, 102, 10421–10426. [Google Scholar] [CrossRef] [PubMed]
  13. Boginski, V.; Butenko, S.; Pardalos, P.M. Statistical analysis of financial networks. Comput. Stat. Data Anal. 2005, 48, 431–443. [Google Scholar] [CrossRef]
  14. Risso, W.A. The informational efficiency and the financial crashes. Res. Int. Bus. Financ. 2008, 22, 396–408. [Google Scholar] [CrossRef]
  15. Sonia, R.B.; Rui, M. Entropy: A new measure of stock market volatility? J. Phys. Conf. Ser. 2012, 394, 012033. [Google Scholar]
  16. Sheraz, M.; Dedu, S.; Preda, V. Entropy Measures for Assessing Volatile Markets. Procedia Econ. Financ. 2015, 22, 655–662. [Google Scholar] [CrossRef]
  17. Sónia, R.B. An entropy-based approach to stock market volatility: Evidence from the G7’s market indices. Int. J. Ind. Syst. Eng. 2016, 24, 158–177. [Google Scholar]
  18. Oh, G.; Kim, H.-Y.; Ahn, S.-W.; Kwak, W. Analyzing the financial crisis using the entropy density function. Phys. A Stat. Mech. Its Appl. 2015, 419, 464–469. [Google Scholar] [CrossRef]
  19. Huang, J.; Shang, P.; Zhao, X. Multifractal diffusion entropy analysis on stock volatility in financial markets. Phys. A Stat. Mech. Its Appl. 2012, 391, 5739–5745. [Google Scholar] [CrossRef]
  20. Onnela, J.P.; Chakraborti, A.; Kaski, K.; Kertész, J.; Kanto, A. Dynamics of market correlations: Taxonomy and portfolio analysis. Phys. Rev. E 2003, 68, 056110. [Google Scholar] [CrossRef]
  21. Vandewalle, N.; Brisbois, F.; Tordoir, X. Non-random topology of stock markets. Quant. Financ. 2001, 1, 372–374. [Google Scholar] [CrossRef]
  22. Nobi, A.; Maeng, S.E.; Ha, G.G.; Lee, J.W. Effects of global financial crisis on network structure in a local stock market. Phys. A Stat. Mech. Its Appl. 2014, 407, 135–143. [Google Scholar] [CrossRef]
  23. Li, W.; Hommel, U.; Paterlini, S. Network topology and systemic risk: Evidence from the Euro Stoxx market. Financ. Res. Lett. 2018, 27, 105–112. [Google Scholar] [CrossRef]
  24. Dimitrios, K.; Vasileios, O. A Network Analysis of the Greek Stock Market. Procedia Econ. Financ. 2015, 33, 340–349. [Google Scholar] [CrossRef]
  25. Kantar, E.; Keskin, M.; Deviren, B. Analysis of the effects of the global financial crisis on the Turkish economy, using hierarchical methods. Phys. A Stat. Mech. Its Appl. 2012, 391, 2342–2352. [Google Scholar] [CrossRef]
  26. Bhattacharjee, B.; Shafi, M.; Acharjee, A. Network mining based elucidation of the dynamics of cross-market clustering and connectedness in Asian region: An MST and hierarchical clustering approach. J. King Saud Univ. Comput. Inf. Sci. 2017. [Google Scholar] [CrossRef]
  27. Sensoy, A.; Tabak, B.M. Dynamic spanning trees in stock market networks: The case of Asia-Pacific. Phys. A Stat. Mech. Its Appl. 2014, 414, 387–402. [Google Scholar] [CrossRef]
  28. Yang, R.; Li, X.; Zhang, T. Analysis of linkage effects among industry sectors in China’s stock market before and after the financial crisis. Phys. A Stat. Mech. Its Appl. 2014, 411, 12–20. [Google Scholar] [CrossRef]
  29. Nie, C.X.; Song, F.T. Relationship between Entropy and Dimension of Financial Correlation-Based Network. Entropy 2018, 20, 177. [Google Scholar] [CrossRef]
  30. Namaki, A.; Shirazi, A.H.; Raei, R.; Jafari, G.R. Network analysis of a financial market based on genuine correlation and threshold method. Phys. A Stat. Mech. Its Appl. 2011, 390, 3835–3841. [Google Scholar] [CrossRef]
  31. Onnela, J.-P.; Saramäki, J.; Kertész, J.; Kaski, K. Intensity and coherence of motifs in weighted complex networks. Phys. Rev. E 2005, 71, 065103. [Google Scholar] [CrossRef] [PubMed]
  32. Lyócsa, Š.; Výrost, T.; Baumöhl, E. Stock market networks: The dynamic conditional correlation approach. Phys. A Stat. Mech. Its Appl. 2012, 391, 4147–4158. [Google Scholar] [CrossRef]
  33. Brida, J.G.; Matesanz, D.; Seijas, M.N. Network analysis of returns and volume trading in stock markets: The Euro Stoxx case. Phys. A Stat. Mech. Its Appl. 2016, 444, 751–764. [Google Scholar] [CrossRef]
  34. Bonanno, G.; Lillo, F.; Mantegna, R.N. High-frequency cross-correlation in a set of stocks. Quant. Financ. 2001, 1, 96–104. [Google Scholar] [CrossRef]
  35. Ulusoy, T.; Keskin, M.; Shirvani, A.; Deviren, B.; Kantar, E.; Çaǧrı Dönmez, C. Complexity of major UK companies between 2006 and 2010: Hierarchical structure method approach. Phys. A Stat. Mech. Its Appl. 2012, 391, 5121–5131. [Google Scholar] [CrossRef]
  36. Brida, J.G.; Risso, W.A. Hierarchical structure of the German stock market. Expert Syst. Appl. 2010, 37, 3846–3852. [Google Scholar] [CrossRef]
  37. Lee, J.; Youn, J.; Chang, W. Intraday volatility and network topological properties in the Korean stock market. Phys. A Stat. Mech. Its Appl. 2012, 391, 1354–1360. [Google Scholar] [CrossRef]
  38. Zhang, J.; Zhou, H.; Jiang, L.; Wang, Y. Network topologies of Shanghai stock index. Phys. Procedia 2010, 3, 1733–1740. [Google Scholar] [CrossRef]
  39. Huang, W.-Q.; Zhuang, X.-T.; Yao, S. A network analysis of the Chinese stock market. Phys. A Stat. Mech. Its Appl. 2009, 388, 2956–2964. [Google Scholar] [CrossRef]
  40. Nguyen, Q.; Nguyen, N.K.K.; Nguyen, L.H.N. Dynamic topology and allometric scaling behavior on the Vietnamese stock market. Phys. A Stat. Mech. Its Appl. 2019, 514, 235–243. [Google Scholar] [CrossRef]
  41. Bahaludin, H.; Abdullah, M.H.; Salleh, S.M. Minimal spanning tree for 100 companies in Bursa Malaysia. AIP Conf. Proc. 2015, 1643, 609–615. [Google Scholar]
  42. Tabak, B.M.; Serra, T.R.; Cajueiro, D.O. Topological properties of stock market networks: The case of Brazil. Phys. A Stat. Mech. Its Appl. 2010, 389, 3240–3249. [Google Scholar] [CrossRef]
  43. Forbes, K.J.; Rigobon, R. No Contagion, Only Interdependence: Measuring Stock Market Comovements. J. Financ. 2002, 57, 2223–2261. [Google Scholar] [CrossRef]
  44. Ferreira, P.; Dionísio, A.; Zebende, G.F. Why does the Euro fail? The DCCA approach. Phys. A Stat. Mech. Its Appl. 2016, 443, 543–554. [Google Scholar] [CrossRef]
  45. Peron, T.K.D.M.; Costa, L.D.F.; Rodrigues, F.A. The structure and resilience of financial market networks. Chaos Interdiscip. J. Nonlinear Sci. 2012, 22, 013117. [Google Scholar] [CrossRef] [PubMed]
  46. Jin, X. The impact of 2008 financial crisis on the efficiency and contagion of Asian stock markets: A Hurst exponent approach. Financ. Res. Lett. 2016, 17, 167–175. [Google Scholar] [CrossRef]
  47. Okubo, T.; Kimura, F.; Teshima, N. Asian fragmentation in the Global Financial Crisis. Int. Rev. Econ. Financ. 2014, 31, 114–127. [Google Scholar] [CrossRef]
  48. Zhang, J.; Teng, F. Are China Stock Markets Efficient after the Global Financial Crisis? In Proceedings of the 2010 International Conference on Computational Intelligence and Software Engineering, Wuhan, China, 10–12 December 2010; pp. 1–4. [Google Scholar]
  49. Mustafa, N.N.S.; Samsudin, S.; Shahadan, F.; Yi, A.K.J. Flight-to-Quality between Stock and Bond Markets: Pre and Post Global Financial Crisis. Procedia Econ. Financ. 2015, 31, 846–855. [Google Scholar] [CrossRef]
  50. Shannon, C.E. A Mathematical Theory of Communication. Bell Syst. Tech. J. 1948, 27, 379–423. [Google Scholar] [CrossRef]
  51. Sandoval, L. Structure of a Global Network of Financial Companies Based on Transfer Entropy. Entropy 2014, 16, 4443–4482. [Google Scholar] [CrossRef]
  52. Lee, J.W.; Nobi, A. State and Network Structures of Stock Markets around the Global Financial Crisis. Comput. Econ. 2018, 51, 195–210. [Google Scholar] [CrossRef]
  53. Mantegna, R.N.; Stanley, H.E. An Introduction to Econophysics: Correlations and Complexity in Finance; Cambridge University Press: Cambridge, UK, 2000. [Google Scholar]
  54. Kruskal, J.B. On the Shortest Spanning Subtree of a Graph and the Traveling Salesman Problem. Proc. Am. Math. Soc. 1956, 7, 48–50. [Google Scholar] [CrossRef]
  55. Jiang, Y.; Yu, M.; Hashmi, S.M. The Financial Crisis and Co-Movement of Global Stock Markets—A Case of Six Major Economies. Sustainability 2017, 9, 260. [Google Scholar] [CrossRef]
  56. Pele, D.T.; Lazar, E.; Dufour, A. Information Entropy and Measures of Market Risk. Entropy 2017, 19, 226. [Google Scholar] [CrossRef]
  57. Xu, R.; Wong, W.-K.; Chen, G.; Huang, S. Topological Characteristics of the Hong Kong Stock Market: A Test-based P-threshold Approach to Understanding Network Complexity. Sci. Rep. 2017, 7, 41379. [Google Scholar] [CrossRef] [PubMed]
  58. Sandoval, L.; Franca, I.D.P. Correlation of financial markets in times of crisis. Phys. A Stat. Mech. Its Appl. 2012, 391, 187–208. [Google Scholar] [CrossRef]
  59. Heiberger, R.H. Stock network stability in times of crisis. Phys. A Stat. Mech. Its Appl. 2014, 393, 376–381. [Google Scholar] [CrossRef]
  60. Sharif, S.; Ismail, S.; Zurni, O.; Theng, L.H. Validation of Global Financial Crisis on Bursa Malaysia Stocks Market Companies via Covariance Structure. Am. J. Appl. Sci. 2016, 13, 1091–1095. [Google Scholar] [CrossRef]
  61. Wiliński, M.; Sienkiewicz, A.; Gubiec, T.; Kutner, R.; Struzik, Z.R. Structural and topological phase transitions on the German Stock Exchange. Phys. A Stat. Mech. Its Appl. 2013, 392, 5963–5973. [Google Scholar] [CrossRef]
  62. Barabási, A.-L.; Albert, R. Emergence of Scaling in Random Networks. Science 1999, 286, 509–512. [Google Scholar]
  63. Wang, G.-J.; Xie, C.; Chen, Y.-J.; Chen, S. Statistical Properties of the Foreign Exchange Network at Different Time Scales: Evidence from Detrended Cross-Correlation Coefficient and Minimum Spanning Tree. Entropy 2013, 15, 1643–1662. [Google Scholar] [CrossRef]
  64. Górski, A.Z.; Drożdż, S.; Kwapień, J. Scale free effects in world currency exchange network. Eur. Phys. J. B 2008, 66, 91–96. [Google Scholar] [CrossRef]
  65. Clauset, A.; Shalizi, C.R.; Newman, M.E.J. Power-Law Distributions in Empirical Data. SIAM Rev. 2009, 51, 661–703. [Google Scholar] [CrossRef]
  66. Wang, G.-J.; Xie, C. Correlation structure and dynamics of international real estate securities markets: A network perspective. Phys. A Stat. Mech. Its Appl. 2015, 424, 176–193. [Google Scholar] [CrossRef]
  67. Onnela, J.P.; Chakraborti, A.; Kaski, K.; Kertsz, J.; Kanto, A. Asset Trees and Asset Graphs in Financial Markets. Phys. Scr. 2003, T106, 48. [Google Scholar] [CrossRef]
  68. Gaurav, K.; Sinha, R.; Panda, P.K. The Indus flood of 2010 in Pakistan: A perspective analysis using remote sensing data. Nat. Hazards 2011, 59, 1815–1826. [Google Scholar] [CrossRef]
Figure 1. The average cross-correlation coefficients of 181 stocks of the Pakistan stock exchange (PSX).
Entropy 21 00248 g001
Figure 2. The Shannon entropies of 181 stocks on the PSX with bins of size 0.01.
Entropy 21 00248 g002
Figure 3. The Shannon entropies of 181 stocks on the PSX with bins of size 0.05.
Entropy 21 00248 g003
Figure 4. A precrisis minimum spanning tree map of 181 stocks on the PSX network (8 March 2007 to 2 May 2008).
Entropy 21 00248 g004
Figure 5. A crisis period minimum spanning tree map of 181 stocks on the PSX network (5 May 2008 to 30 June 2009).
Entropy 21 00248 g005
Figure 6. A postcrisis minimum spanning tree map of 181 stocks on the PSX network (1 July 2009 to 19 August 2010).
Entropy 21 00248 g006
Figure 7. An overall-period star-like minimum spanning tree map of 181 stocks on the PSX (3 January 2007 to 29 December 2017).
Entropy 21 00248 g007
Figure 8. A precrisis minimum spanning tree degree distribution of 181 stocks on the PSX network: the p-value is 0.669, which means the stocks follow the power-law distribution.
Entropy 21 00248 g008
Figure 9. A crisis period minimum spanning tree degree distribution of 181 stocks on the PSX network: the p-value is 0.764, which means the stocks follow the power-law distribution.
Entropy 21 00248 g009
Figure 10. A postcrisis minimum spanning tree degree distribution of 181 stocks on the PSX network: the p-value is 0.112, which means the stocks follow the power-law distribution.
Entropy 21 00248 g010
Figure 11. An overall-period minimum spanning tree degree distribution of 181 stock on the PSX.
Entropy 21 00248 g011
Figure 12. A dynamic minimum spanning tree degree distribution of 181 stocks on the PSX network from January 2007 to December 2017: The x-axis, y-axis, and z-axis mention the degree (k), time (t), and probability p(k), respectively.
Entropy 21 00248 g012
Figure 13. The normalized tree length of a dynamic minimum spanning tree of 181 stocks on the PSX network from January 2007 to December 2017.
Entropy 21 00248 g013
Table 1. The Pakistan stock sectors and their respective color in the minimum spanning tree (MST).
S. NoSectorColorNumber of Companies
1Automobile AssemblerPurple9
2Automobile Parts and AccessoriesPurple4
3Cable and Electric GoodsCream5
4CementBlue13
5ChemicalYellow8
6Close-End Mutual FundRose gold2
7Commercial BanksRed16
8EngineeringHazel Green4
9FertilizerOlive5
10Food and Personal Care ProductsCharcoal9
11Glass and CeramicsGunmetal4
12InsuranceCyan10
13Inv. Banks/Inv. Cos./Securities Cos.Lime7
14JuteBlack1
15LeasingNavy2
16Leather and TanneriesCeleste2
17MiscellaneousBrown7
18ModarabasGrey7
19Oil and Gas Exploration CompaniesOrange4
20Oil and Gas Marketing CompaniesOrange6
21Paper and BoardSilver5
22PharmaceuticalsGreen7
23Power Generation and DistributionLight blue6
24RefineryIndigo4
25Sugar and Allied IndustriesMagenta6
26Synthetic and RayonPlatinum2
27Technology and CommunicationTeal7
28Textile CompositeKhaki7
29Textile SpinningKhaki4
30Textile WeavingKhaki2
31TobaccoCoral2
32TransportMaroon3
33WoollenSalmon1
Table 2. A summary of the observations covering the precrisis, crisis, postcrisis and overall sample period for Pakistan stock exchange (PSX).
DistancePearson Correlation Coefficient
MeanMaximumMinimumMeanMaximumMinimum
Precrisis1.3111.7440.6350.1370.799−0.521
Crisis1.2651.5850.6410.1910.795−0.255
Postcrisis1.3131.5540.6930.1340.760−0.208
Overall1.3191.4500.7860.1280.691−0.051
Table 3. A list of the top five most and least volatile stocks of the Pakistan stock exchange based on the Shannon Entropy results.
RankNodeSectorEntropy with bins 0.01Entropy with bins 0.05
List of top five stocks with the highest Shannon entropy scores
1ICIBLInv. Banks/Inv. Cos./Securities Cos.4.6342.533
2TSPLPower Generation and Distribution4.6072.525
3CSMModarabas4.3182.503
4MZSMSugar and Allied Industries4.2452.226
5SPLCLeasing4.2092.324
List of top five stocks with the lowest Shannon entropy scores
1PSELMiscellaneous1.6940.887
2GATISynthetic and Rayon2.0250.948
3KAPCOPower Generation and Distribution2.4151.111
4CFLTextile Spinning2.4211.389
5SHEZFood and Personal Care Products2.4841.073
Table 4. The topology of the threshold network before, during, and after a financial crisis for PSX.
PrecrisisCrisisPostcrisis
p >0.1p > 0.3p > 0.5p > 0.1p > 0.3p > 0.5p > 0.1p > 0.3p > 0.5
Nodes181123371811618618110749
Retaining Edges96841250741097538916699370142194
% of Retaining Edges5980.4567.3723.894.1157.528.720.58
Average Degree107.00620.3254121.27148.33515.558103.53626.5613.837
Network Diameter357396357
Average Path Length1.4112.1632.5451.3292.2452.3991.4311.9642.777
Graph Density0.5940.1670.1110.6740.3020.1830.5750.2510.08
Communities588455559
Modularity0.0440.1340.4590.090.1670.2730.0410.1090.417

