An Intrinsic Entropy Model for Exchange-Traded Securities
Abstract
:1. Introduction and Context
- global, regional or national reports regarding the general state of the economic environment;
- company financial reporting, the basis of fundamental analysis for any exchange-listed company;
- stock exchange transaction data, disseminated to investors mainly through electronic data feeds and consisting in prices, volumes, timestamps of executed trades [3].
2. The Proposed Intrinsic Entropy Model and Computation Methodology
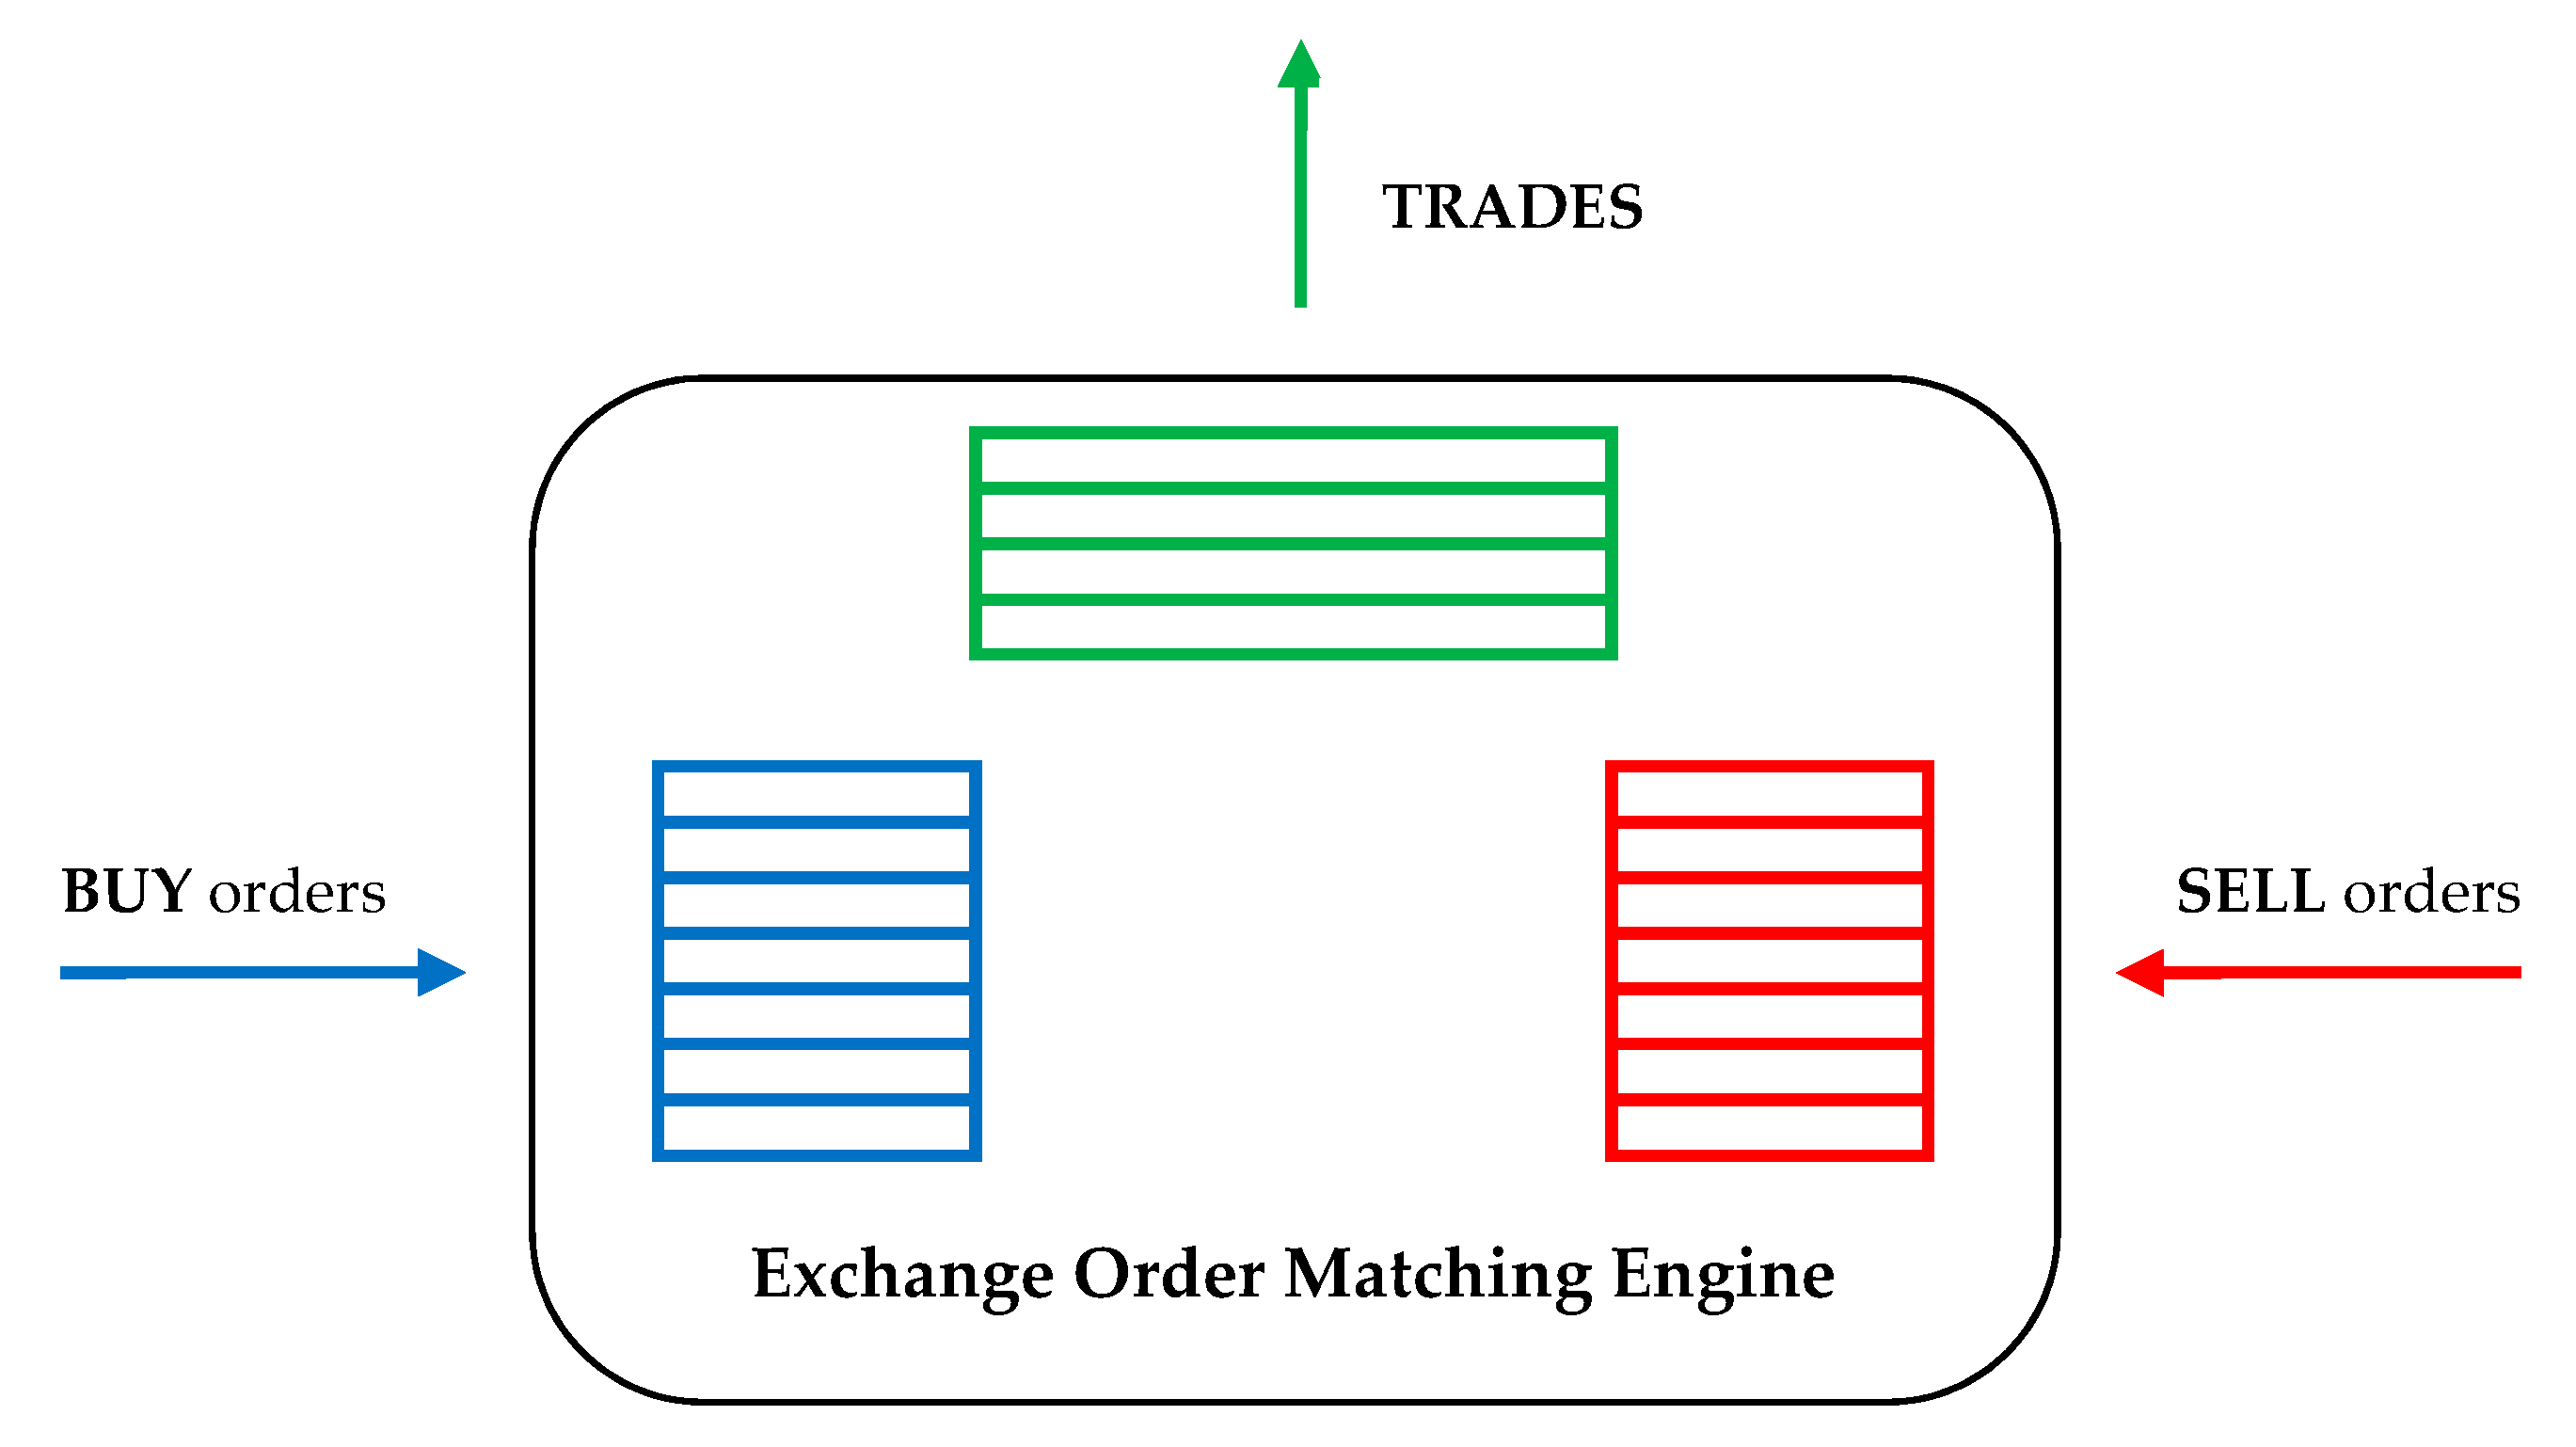
- the price at which the trade was made;
- the executed quantity, i.e., the quantity that could be put in correspondence by the exchange matching engine from one buy and one sell orders already placed on the market;
- the timestamp at which the order matching occurred and the trade was generated.
- (a)
- the quantity executed through that transaction, relative to the total quantity executed for the considered stock, up to the moment of the intrinsic entropy calculation represents the degree of confidence or support that the market provides to the price level at which the trade was made;
- (b)
- the price at which the order matching occurs, relative to a certain reference price, offers an indication about the inclination of the investors towards buying or selling the considered stock.
- n - total number of trades executed for symbol X in the current trading session up to moment t
- i - ordinal trade number
- - trade quantity i.e., number of shares of trade i for symbol X
- - trade price i.e., the price of trade i for symbol X
- Q - total traded quantity i.e., the number of shares traded during the day for symbol X, up to moment t
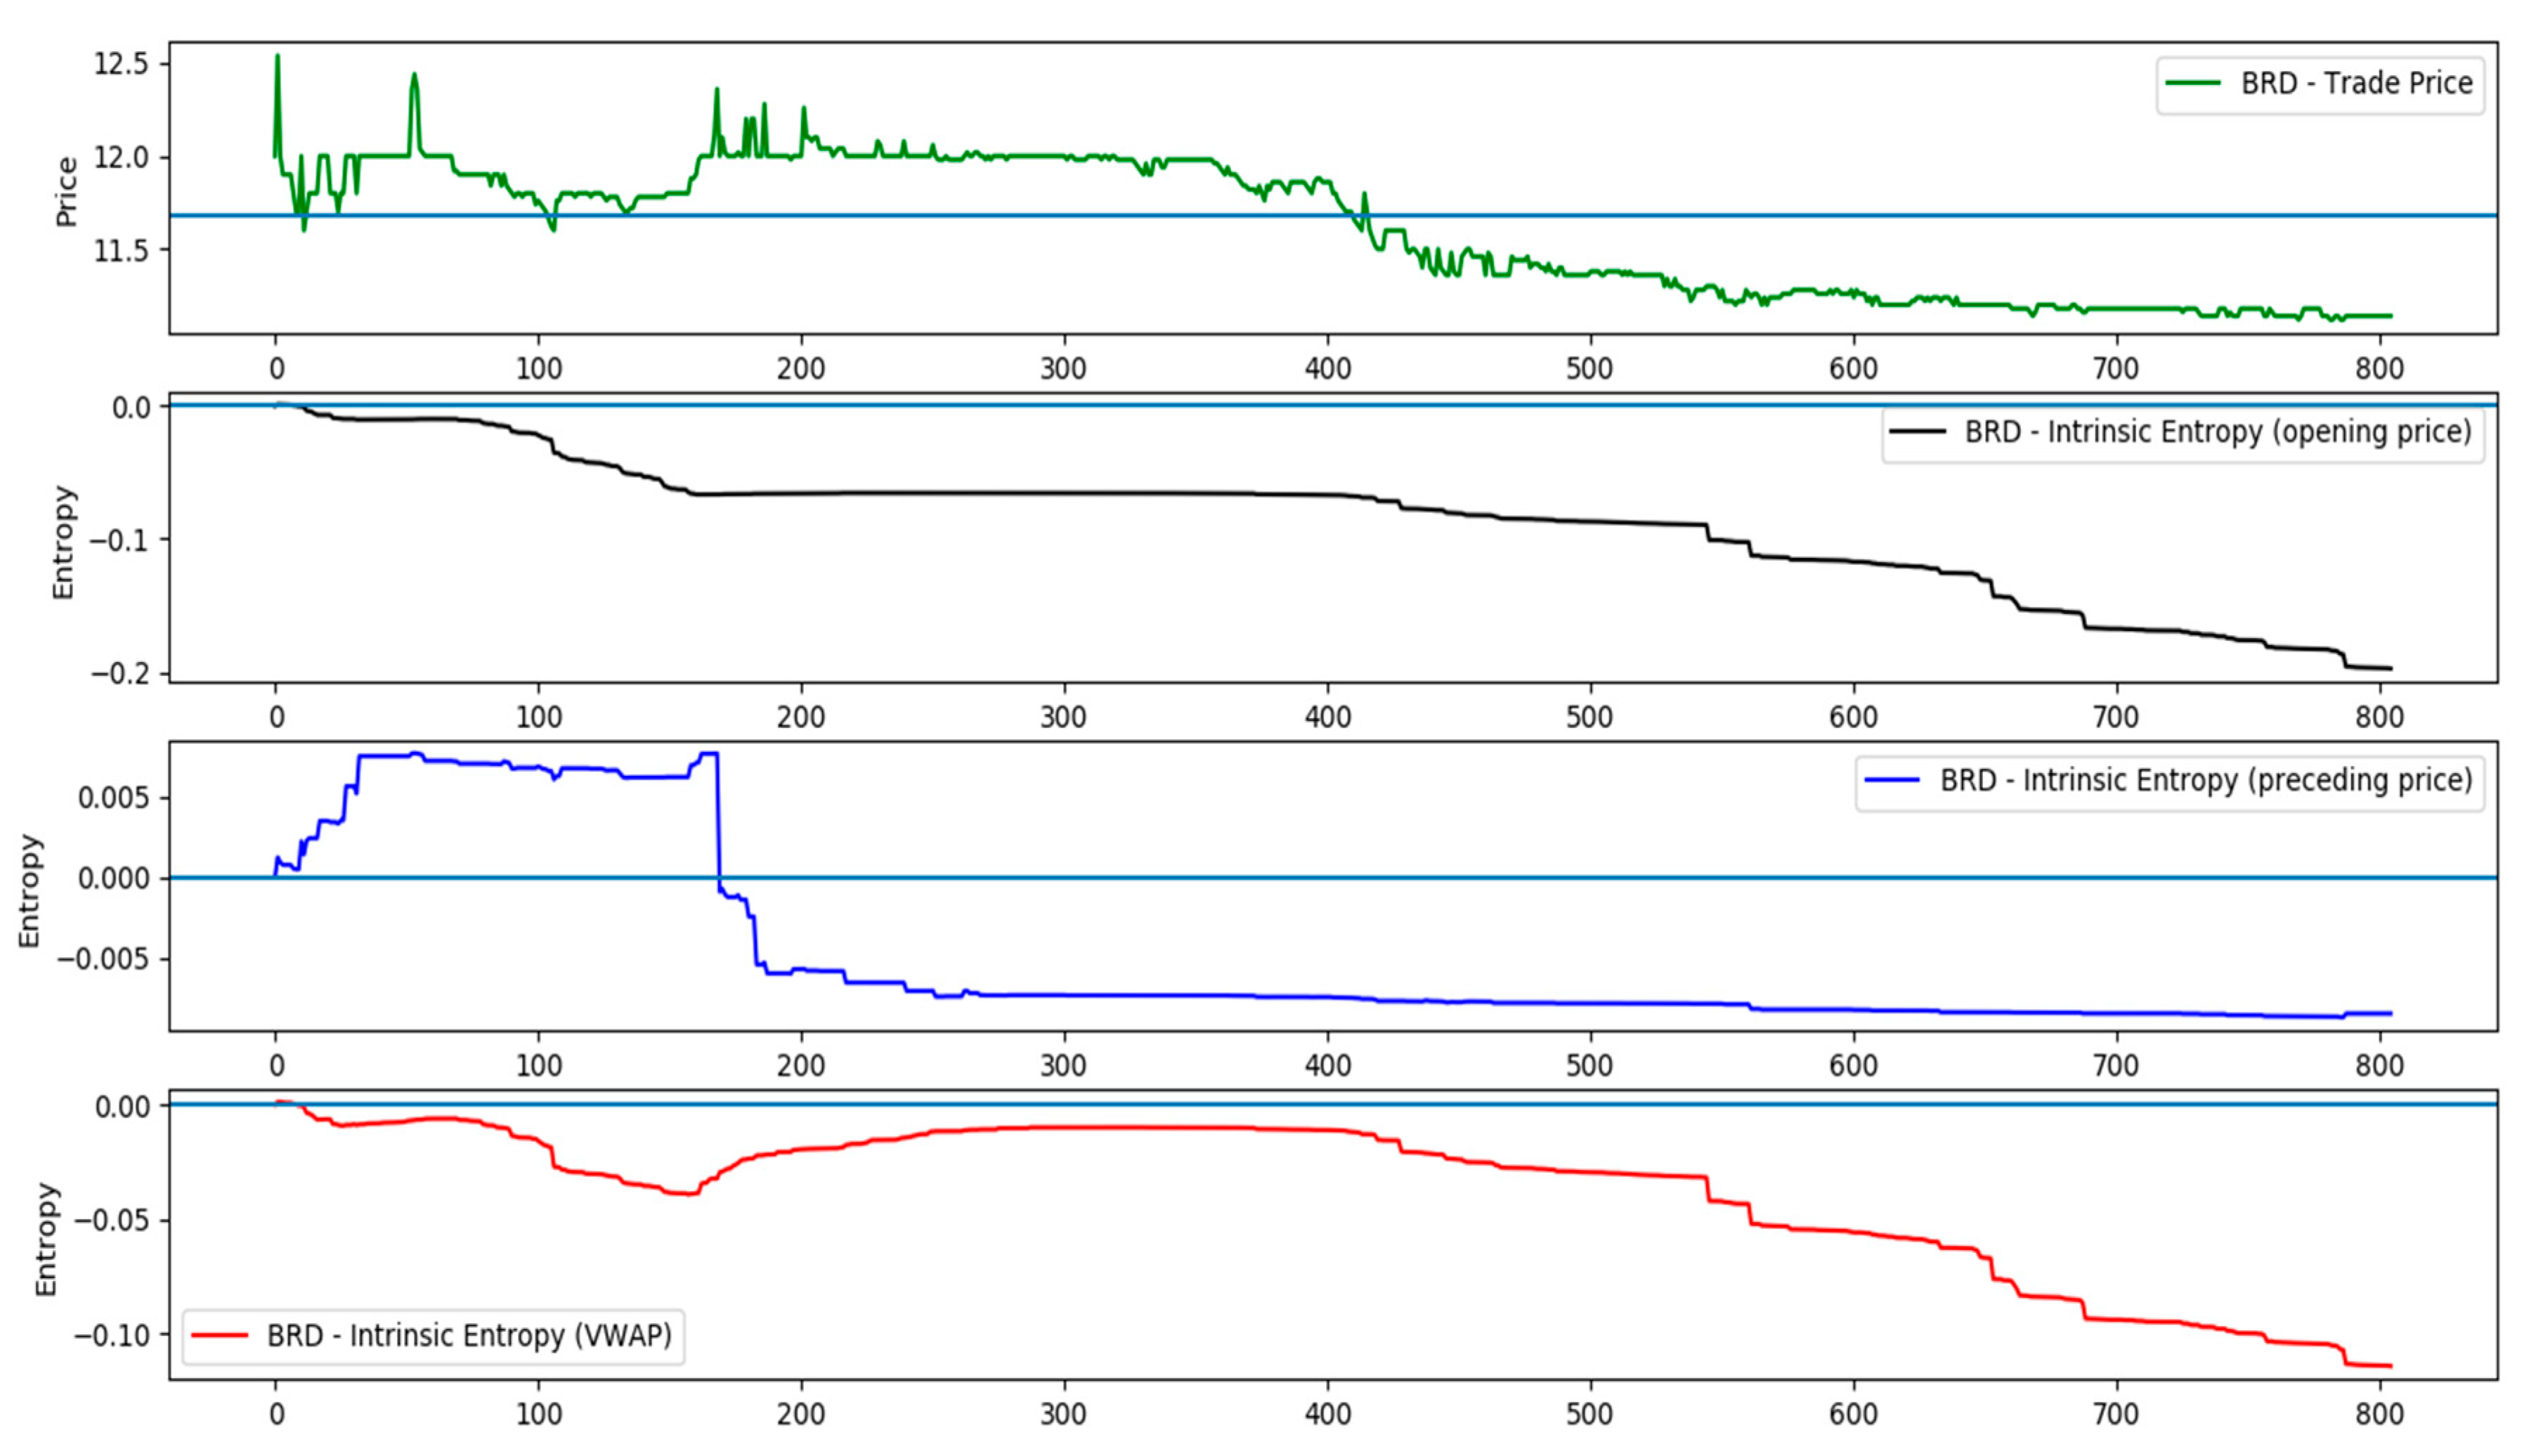
- - reference price for symbol X, corresponding to the trading data prior to the moment t
- (a)
- the opening price of the current trading day,
- (b)
- the price of the preceding transaction, constructing thereby a Markov chain,
- (c)
- and the volume weighted average price (VWAP), computed with trading data executed over the day up to, and including, the preceding transaction [34].
- (a)
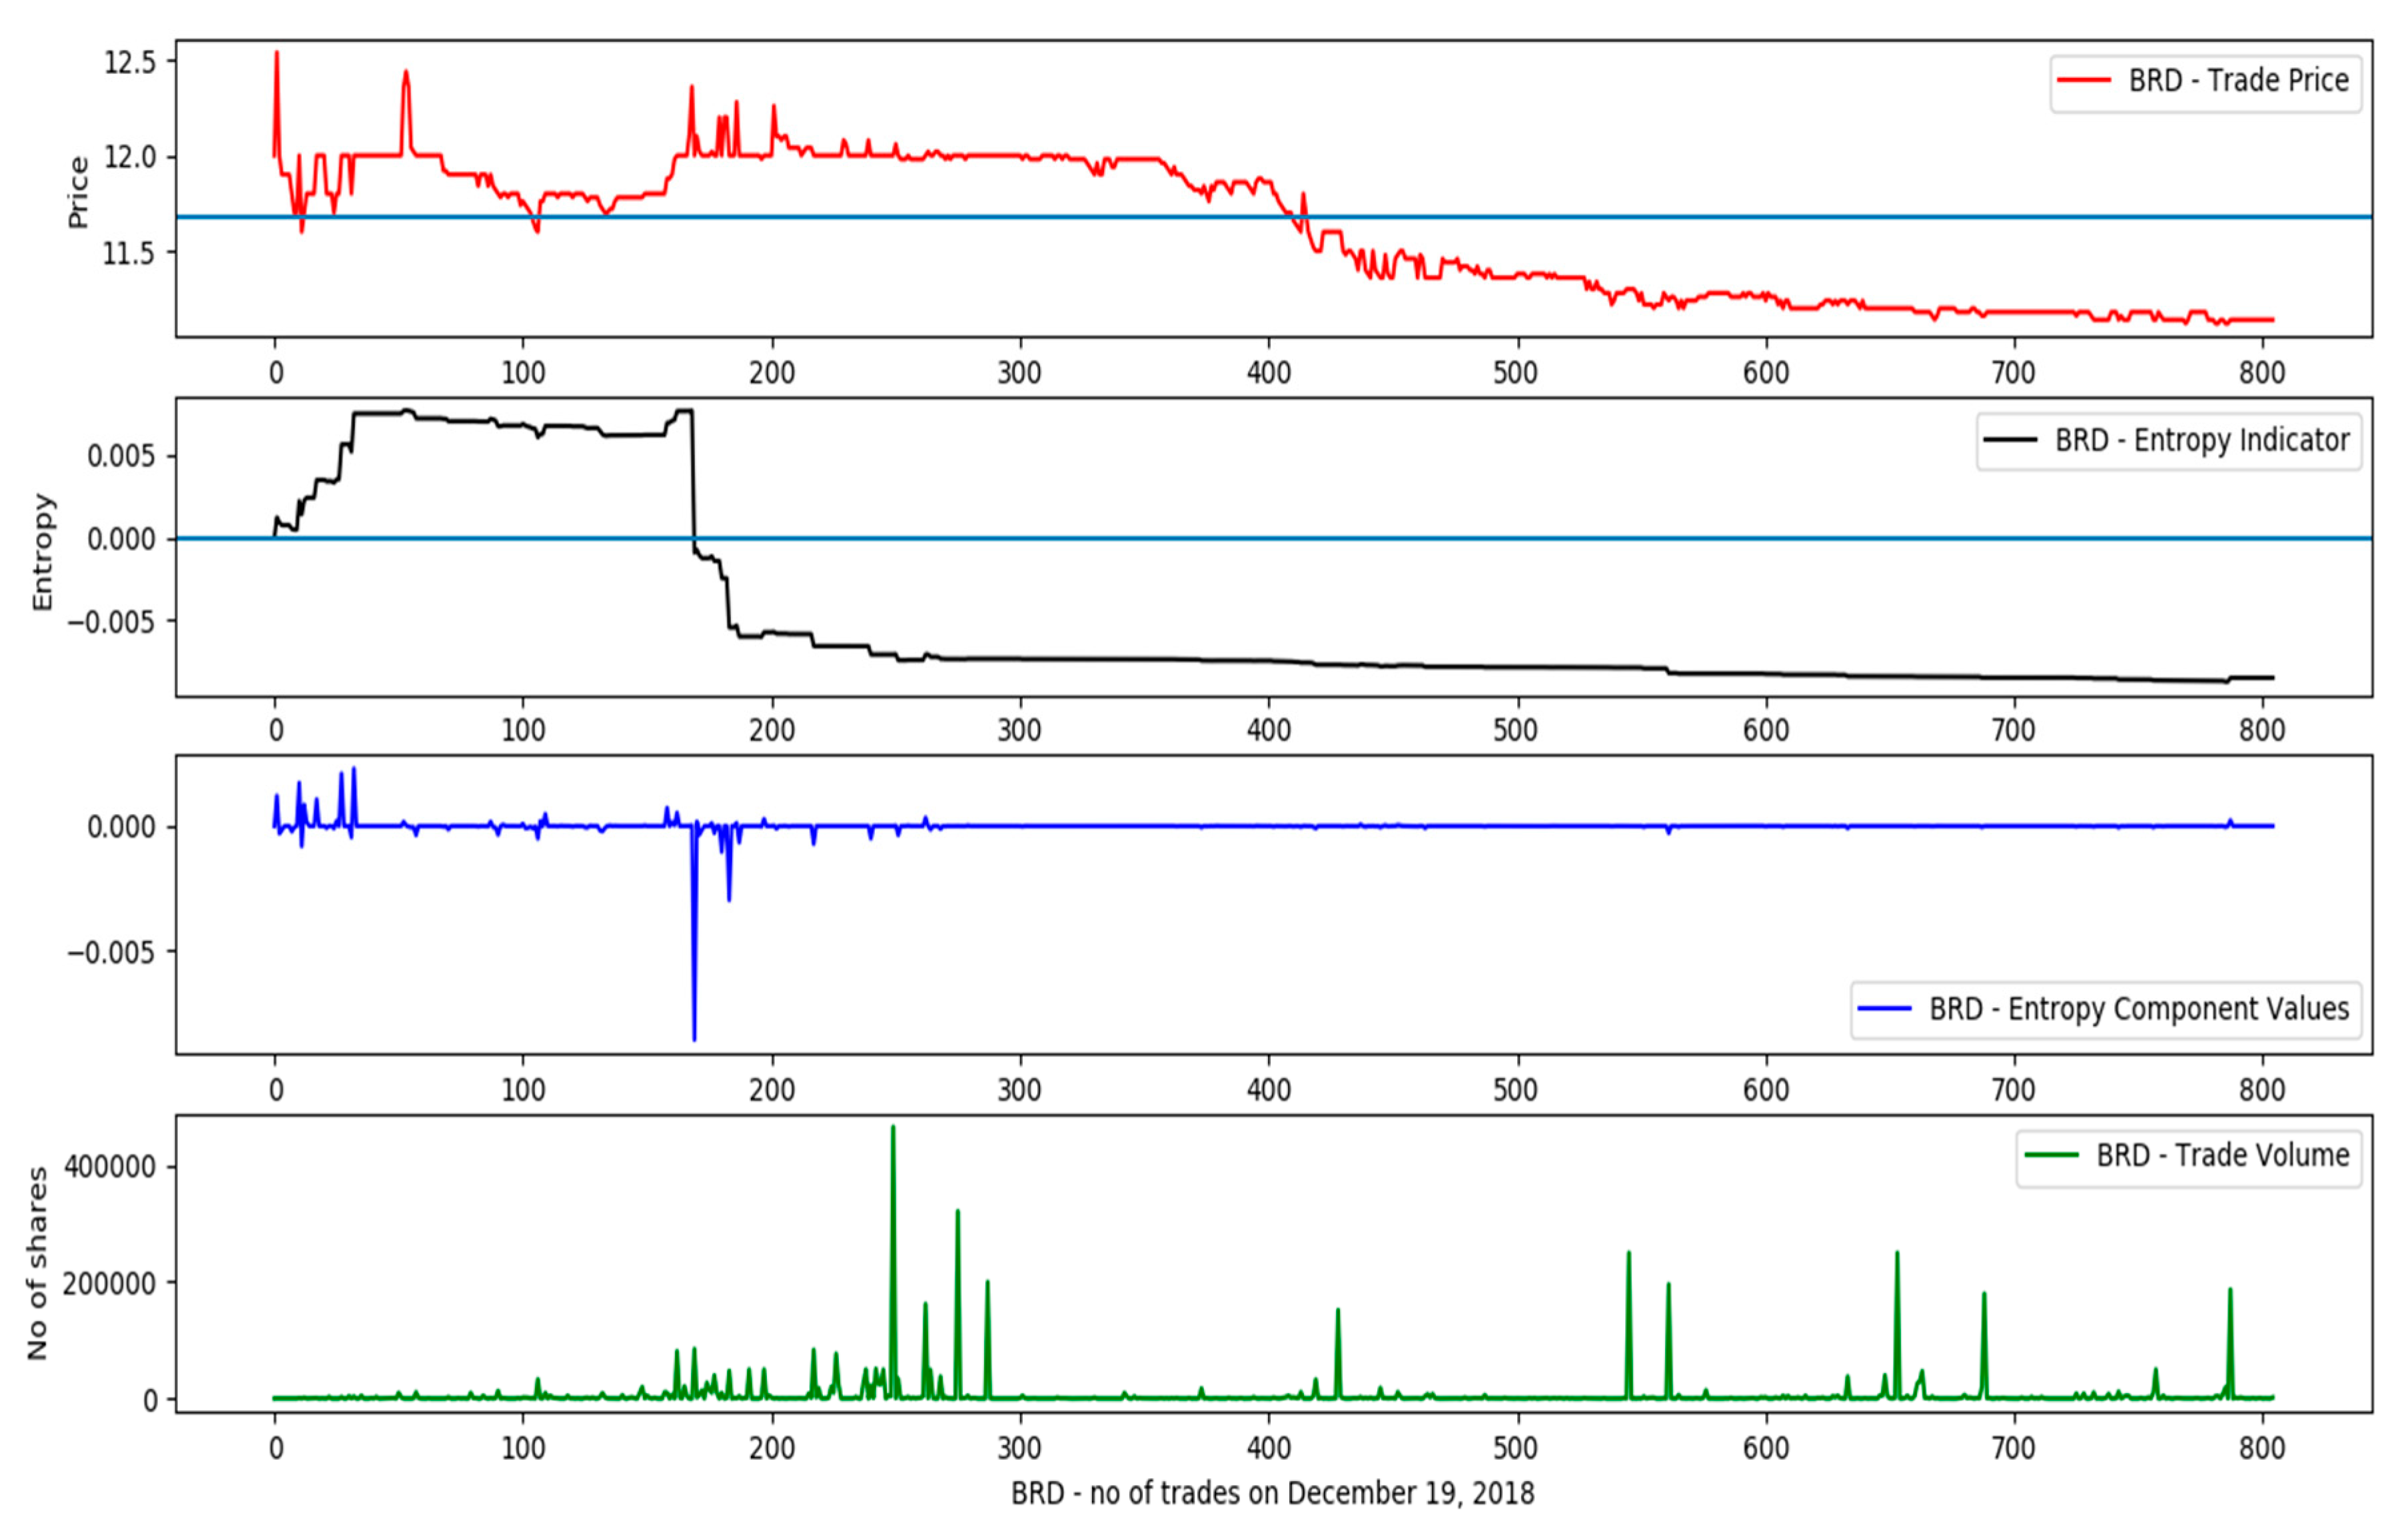
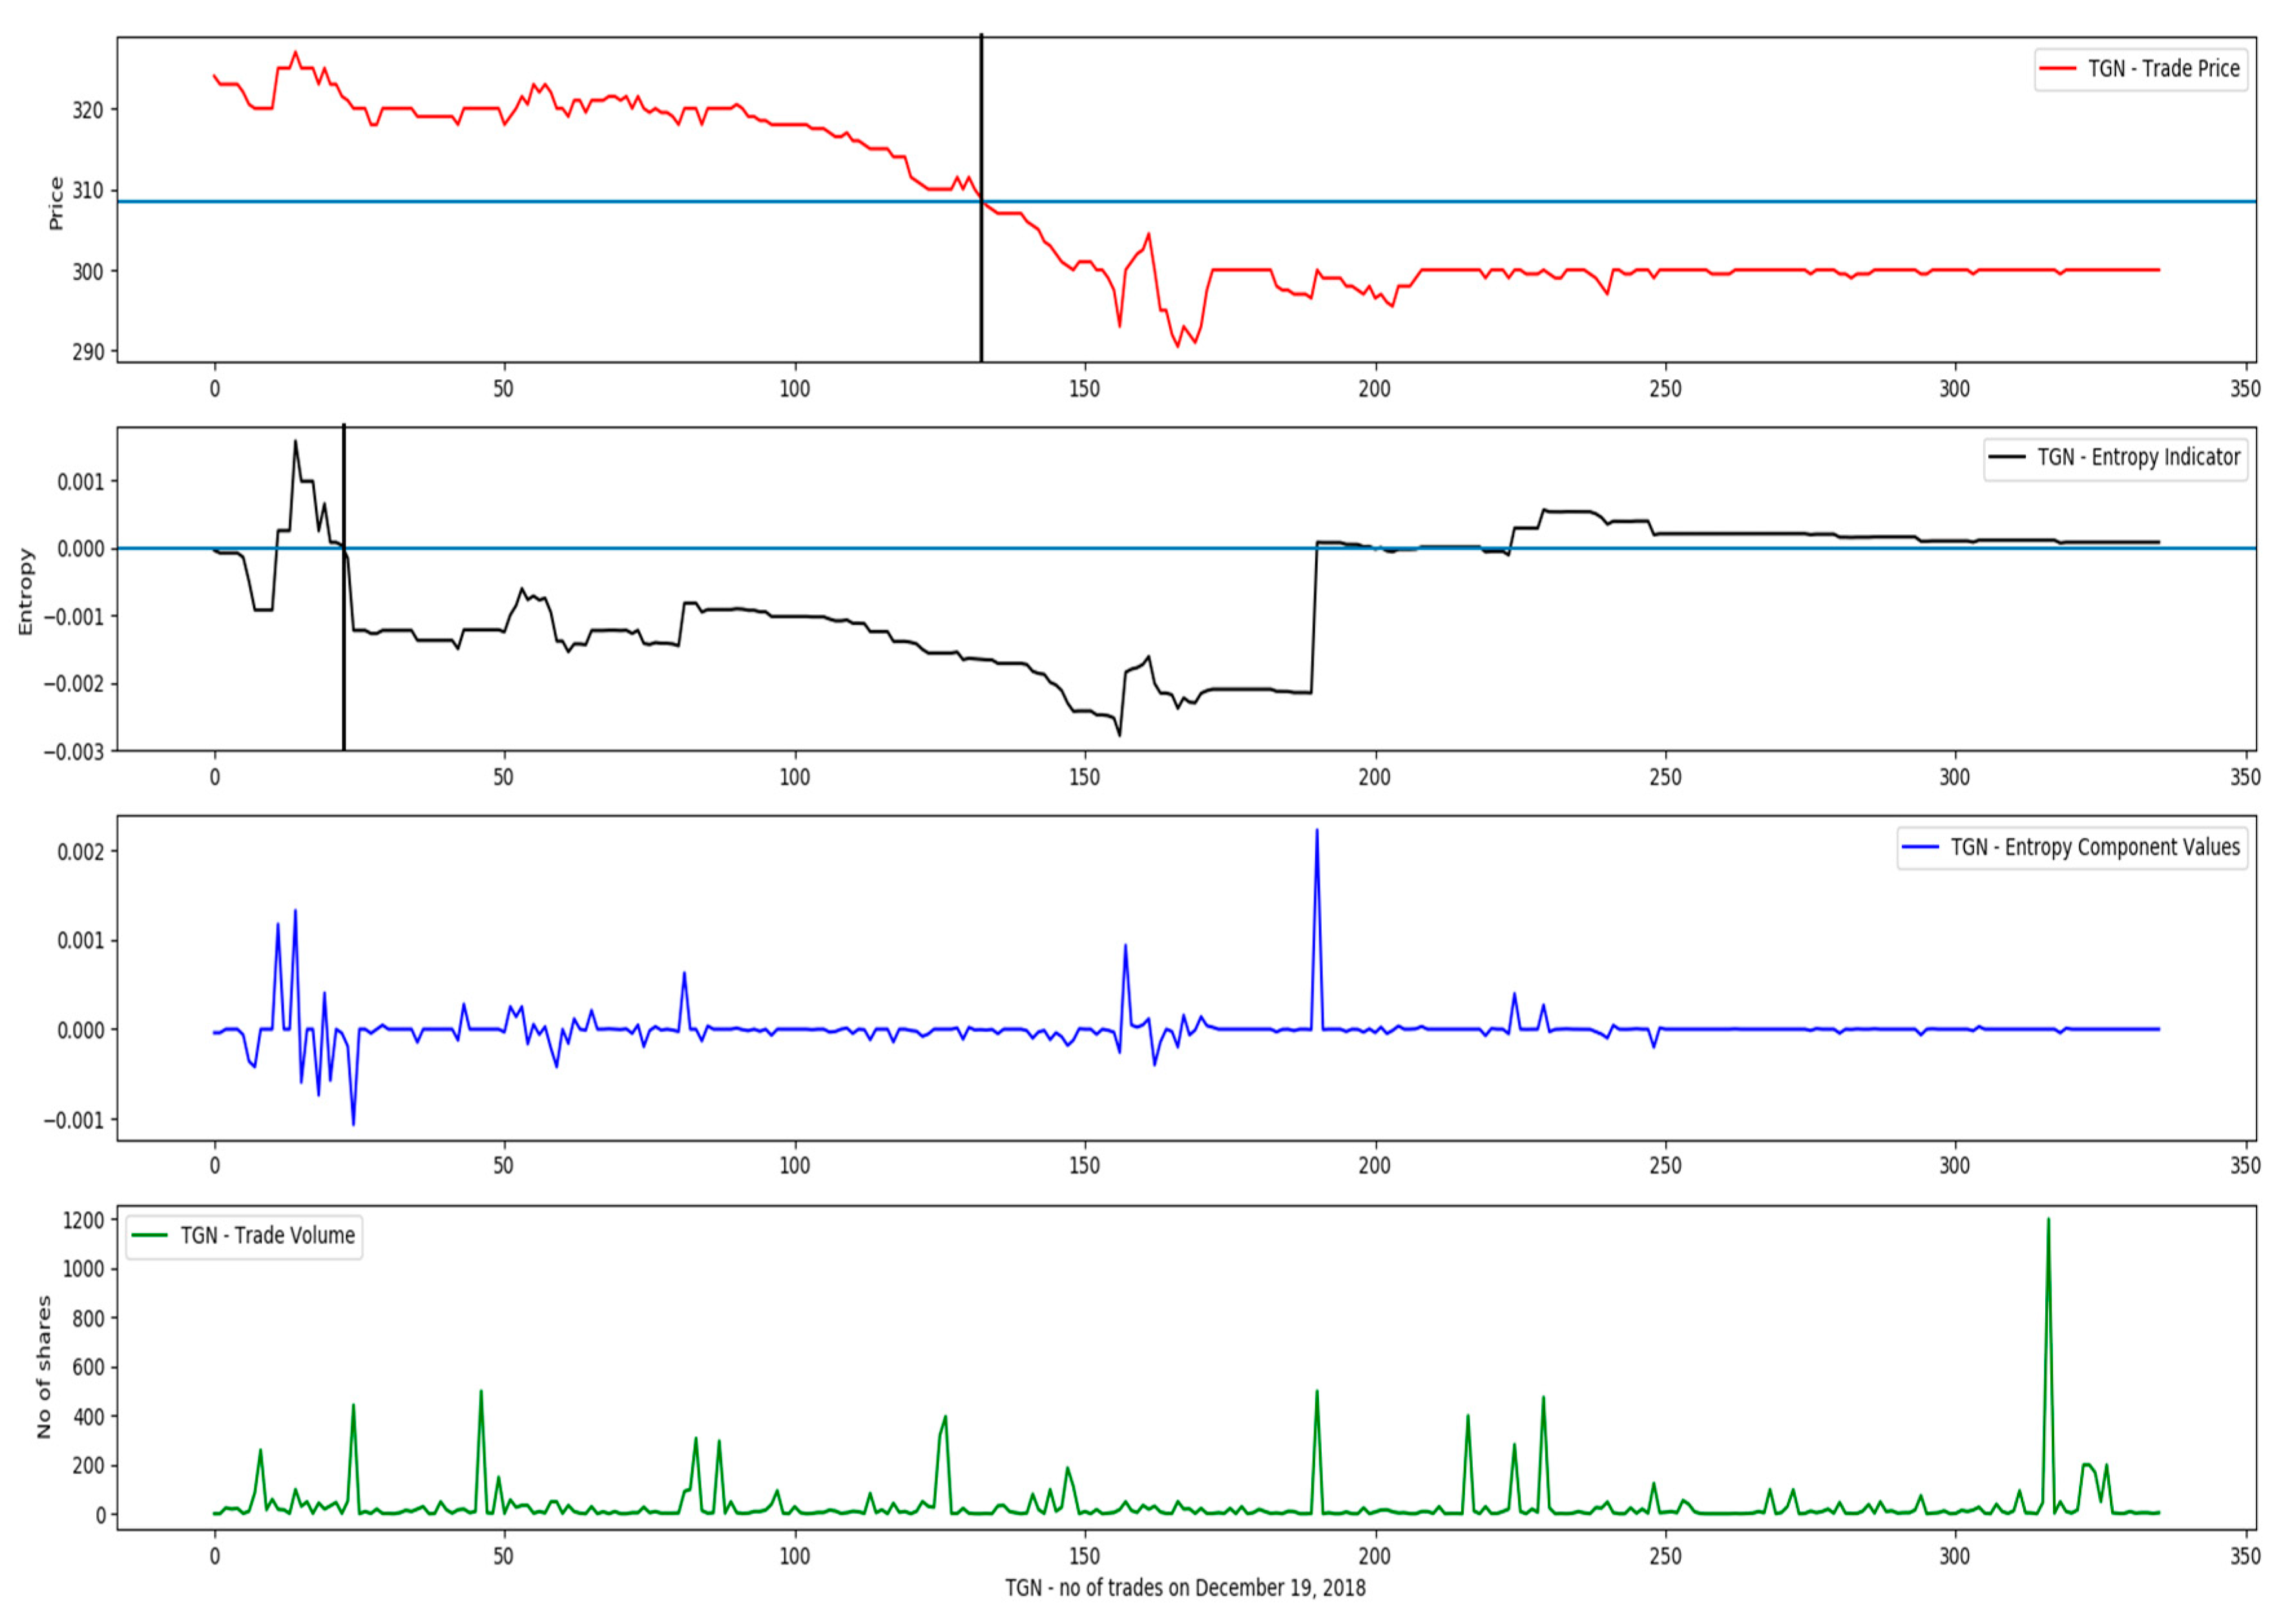
- number of trades-the number of generated executions by the exchange matching engine per symbol, during the trading day;
- (b)
- trade executed quantity;
- (c)
- trade executed price;
- (d)
- overall traded volume per symbol, during the day.
3. Results and Interpretation
- (a)
- the entropy components keep accruing during the day, when execution prices move consistently in a certain direction, up or down;
- (b)
- a high number of transactions, when the stock is heavily traded, suggests that the market, is keenly interested in the security, and this high number of states, and their associated probabilities, support the direction of price evolution.
- (a)
- anchoring to the probability provided by the fraction ;
- (b)
- indication regarding the direction for the trading activity of a given stock, up to the point in time when the entropy is computed.
- (a)
- if, predominantly, then there is a high probability that the computed intrinsic entropy is positive, ;
- (b)
- if, predominantly, then there is a high probability that the computed intrinsic entropy is negative, .
4. Employing the Proposed Intrinsic Entropy in Algorithmic Trading
- (1)
- one that makes decisions based on the values of the computed entropy along with the VWAP;
- (2)
- one that uses only the VAWP in the decision-making process.
- (a)
- whether to buy the stock or not;
- (b)
- when to buy it;
- (c)
- when to sell by the end of the trading day.
- (1)
- the intrinsic entropy that uses the opening price of the day as reference (H1);
- (2)
- the intrinsic entropy that uses the price of the proceeding trade as reference (Hk);
- (3)
- the intrinsic entropy that uses the VWAP computed for the previous trade as reference (Hvwap).
| Algorithm 1. Initialization: S = the set of all symbols tradable on the BVB. |
| 1. // S can be initialized also with a subset of symbols selected by investor 2. s = first symbol in S 3. while (s = next symbol in S) do 4. N = n // n is the no. of trades executed for symbol during the day 5. buyFlag = False 6. sellFlag = False 7. buyTradeNo = 0 8. Initialize the list of trade prices for s 9. Initialize the list of moving VWAP for s 10. Initialize the list of intrinsic entropy values H1 for s 11. Initialize the list of intrinsic entropy values Hk for s 12. Initialize the list of intrinsic entropy values Hvwap for s 13. for i=10 to N do 14. if ((H1[i] > 0) or (Hk[i] > 0) or (Hvwap[i] > 0)) and 15. (p[i] < VWAP[i]) and (buyFlag is False) then 16. Buy symbol s 17. buyFlag = True 18. buyTradeNo = i 19. end if 20. if (i > buyTradeNo) and (((H1[i] < 0) and (Hk[i] < 0) and (Hvwap[i] < 0)) or 21. (p[i] < VWAP[i]) or (i >= N-1)) and 22. (buyFlag is True) and (sellFlag is False) then 23. Sell symbol s 24. sellFlag = True 25. end if 26. end for 27. end while |
| Algorithm 2. Initialization: S = the set of all symbols tradable on the BVB. |
| 1. // S can be initialized also with a subset of symbols selected by investor 2. s = first symbol in S 3. while (s = next symbol in S) do 4. N = n // n is the no. of trades executed for symbol s during the day 5. buyFlag = False 6. sellFlag = False 7. buyTradeNo = 0 8. Initialize the list of trade prices for s 9. Initialize the list of moving VWAP for s 10. for i=10 to N do 11. if (p[i] < VWAP[i]) and (buyFlag is False) then 12. Buy symbol s 13. buyFlag = True 14. buyTradeNo = i 15. end if 16. if (i > buyTradeNo) and ((p[i] < VWAP[i]) or (i >= N-1)) and 17. (buyFlag is True) and (sellFlag is False) then 18. Sell symbol s 19. sellFlag = True 20. end if 21. end for 22. end while |
- the trading algorithm that uses only the VWAP generates a cumulated return of 4.93%, or 0.448% in average for the 11 traded symbols;
- the trading algorithm that employs the intrinsic entropy model that we propose here produces a cumulated return of 19.26%, or 1.75% in average for the 11 traded symbols.
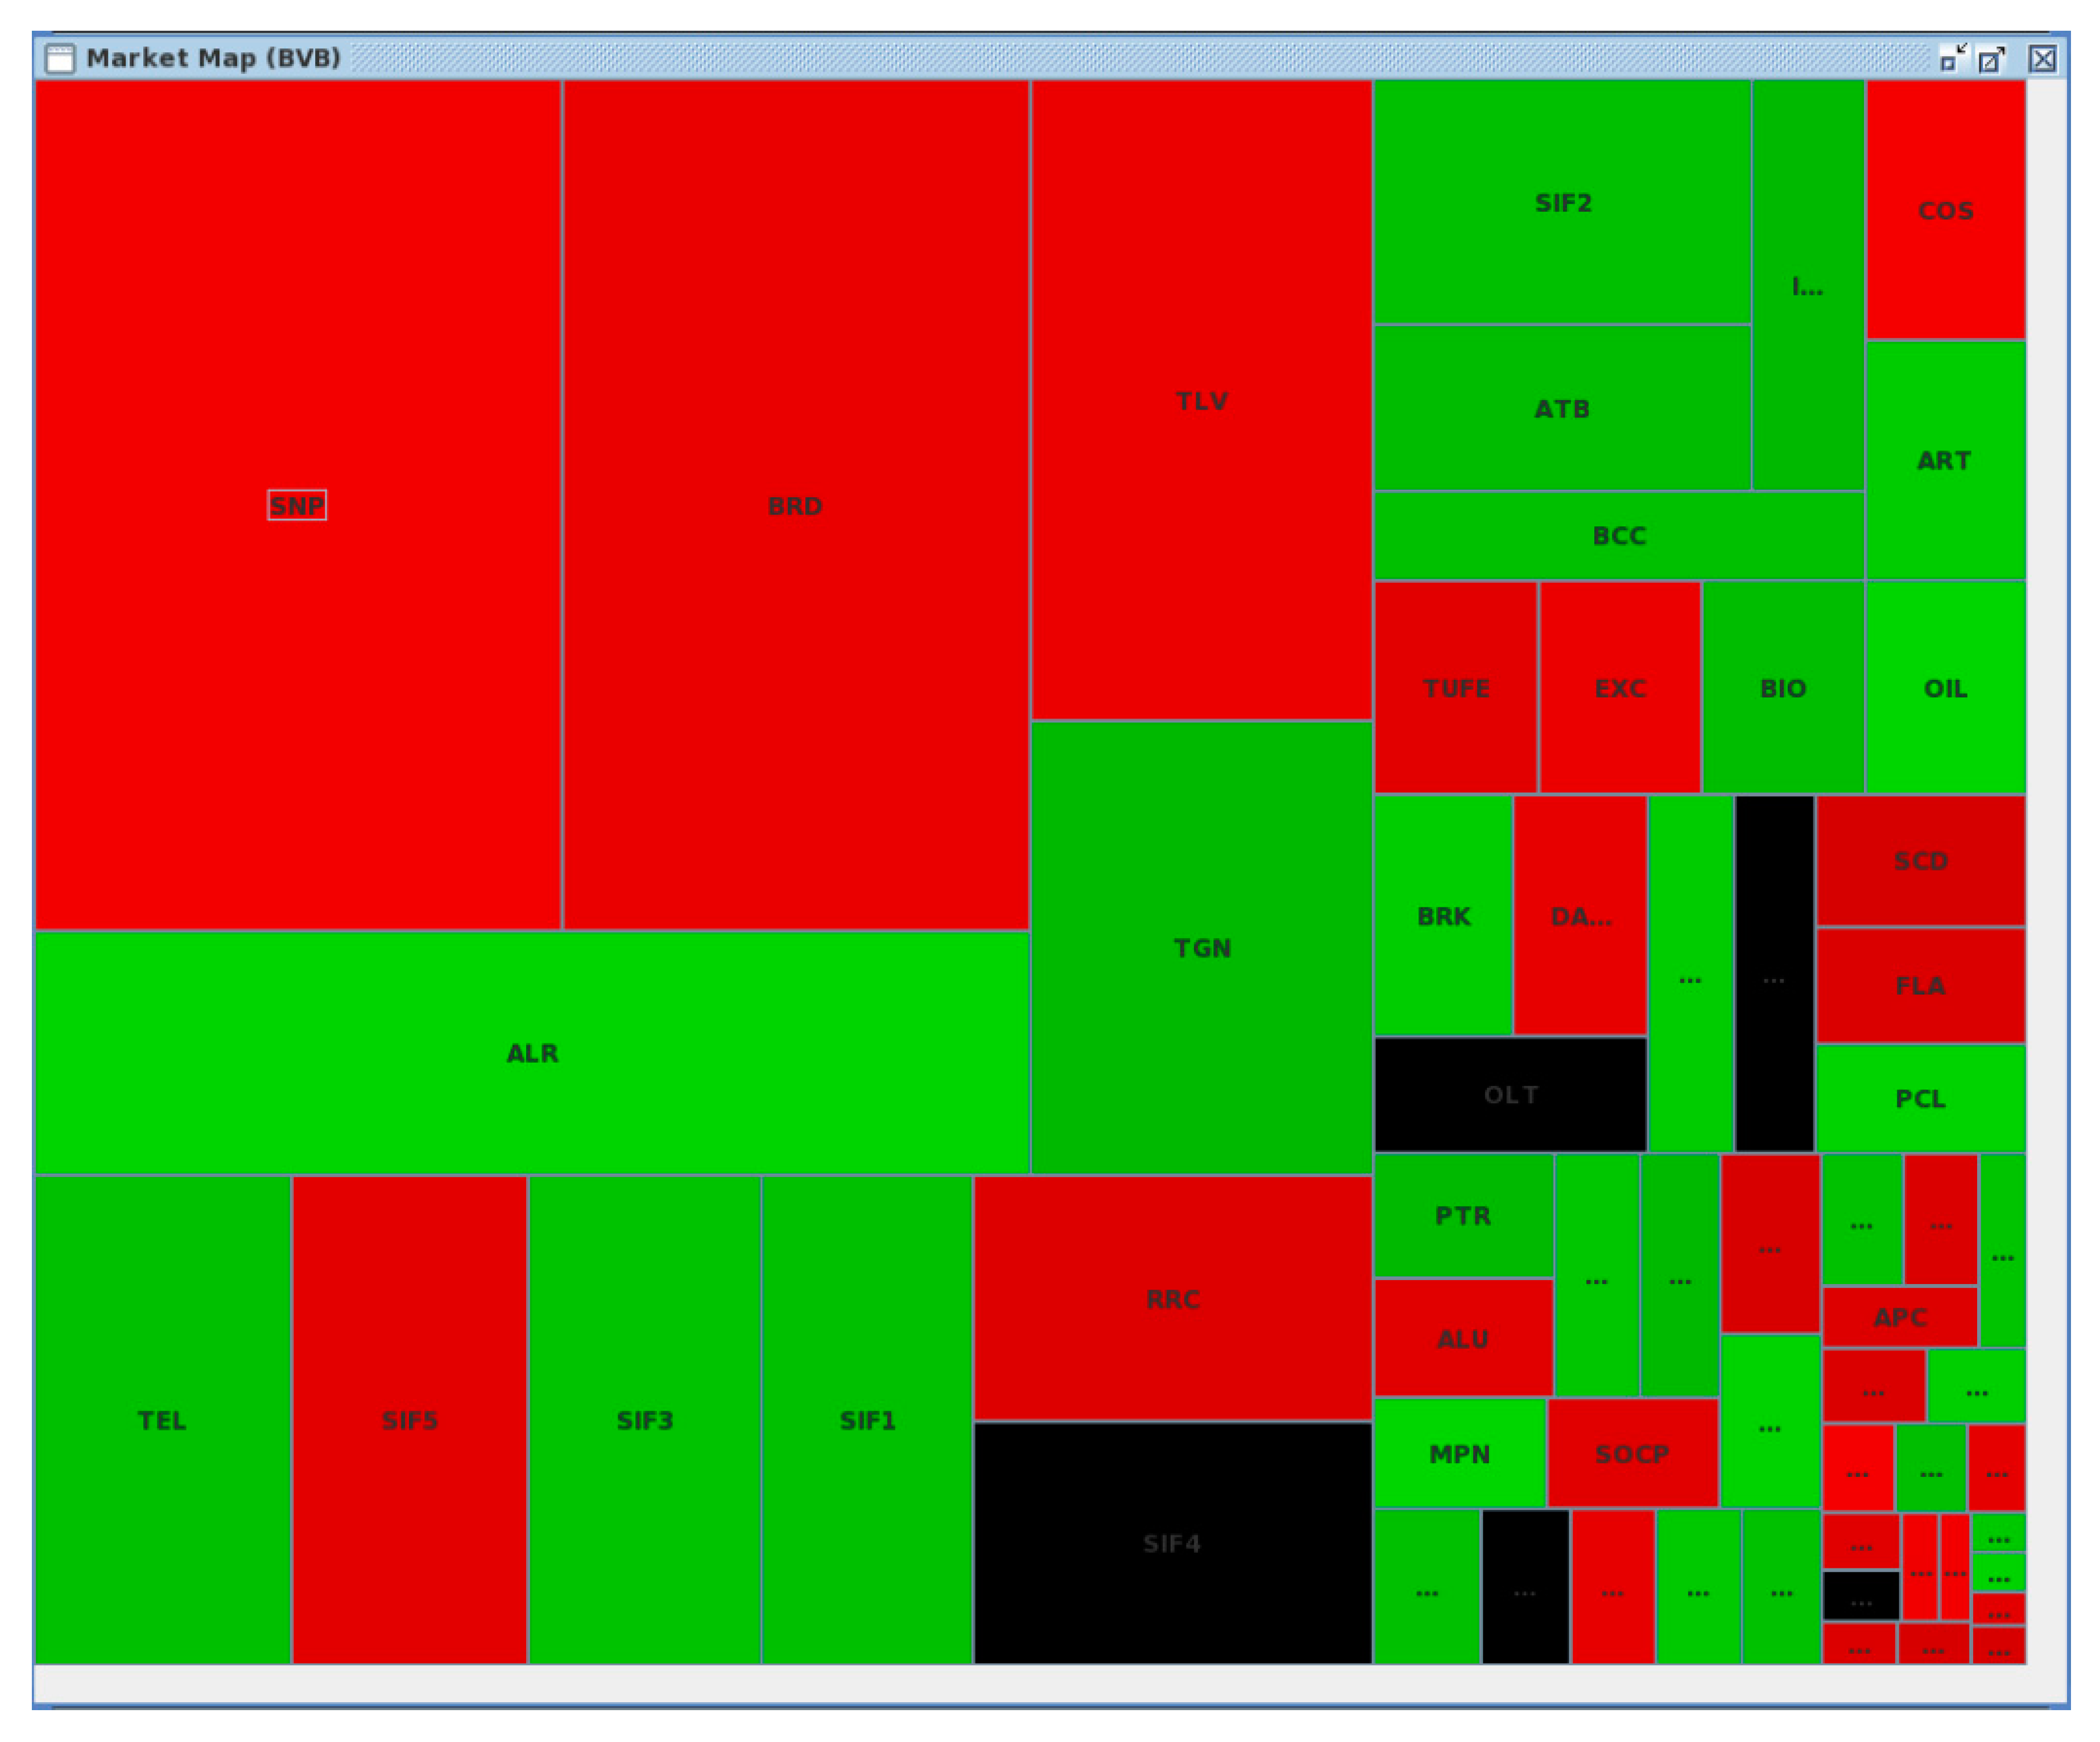
- nuances of red for negative entropies;
- black for entropy levels around zero;
- nuances of green for positive entropy levels.
5. Conclusions and Further Research
Author Contributions
Funding
Conflicts of Interest
Appendix A
| No. | Symbol | Trade Side | Buy Trade No. | Buy Price | Buy VWAP | Trade Side | Sell Trade No. | Sell Price | Sell VWAP | Return (%) |
|---|---|---|---|---|---|---|---|---|---|---|
| 1 | CMP | BUY | 12 | 0.87 | 0.908 | SELL | 35 | 0.88 | 0.892 | 1.1494 |
| 2 | ALR | |||||||||
| 3 | ALU | BUY | 30 | 0.65 | 0.67 | SELL | 33 | 0.665 | 0.67 | 2.3077 |
| 4 | ATB | |||||||||
| 5 | BRD | BUY | 10 | 11.7 | 11.999 | SELL | 11 | 12 | 11.998 | 2.5641 |
| 6 | BVB | |||||||||
| 7 | CEON | BUY | 10 | 0.3 | 0.301 | SELL | 15 | 0.3 | 0.299 | 0 |
| 8 | COTE | BUY | 62 | 75.2 | 76.864 | SELL | 63 | 77 | 76.869 | 2.3936 |
| 9 | EBS | |||||||||
| 10 | DIGI | |||||||||
| 11 | EL | |||||||||
| 12 | ELMA | |||||||||
| 13 | FP | |||||||||
| 14 | M | |||||||||
| 15 | PBK | |||||||||
| 16 | ROCE | |||||||||
| 17 | SIF1 | |||||||||
| 18 | SIF2 | BUY | 11 | 1.13 | 1.156 | SELL | 13 | 1.17 | 1.156 | 3.5398 |
| 19 | SIF3 | |||||||||
| 20 | SIF4 | |||||||||
| 21 | SIF5 | |||||||||
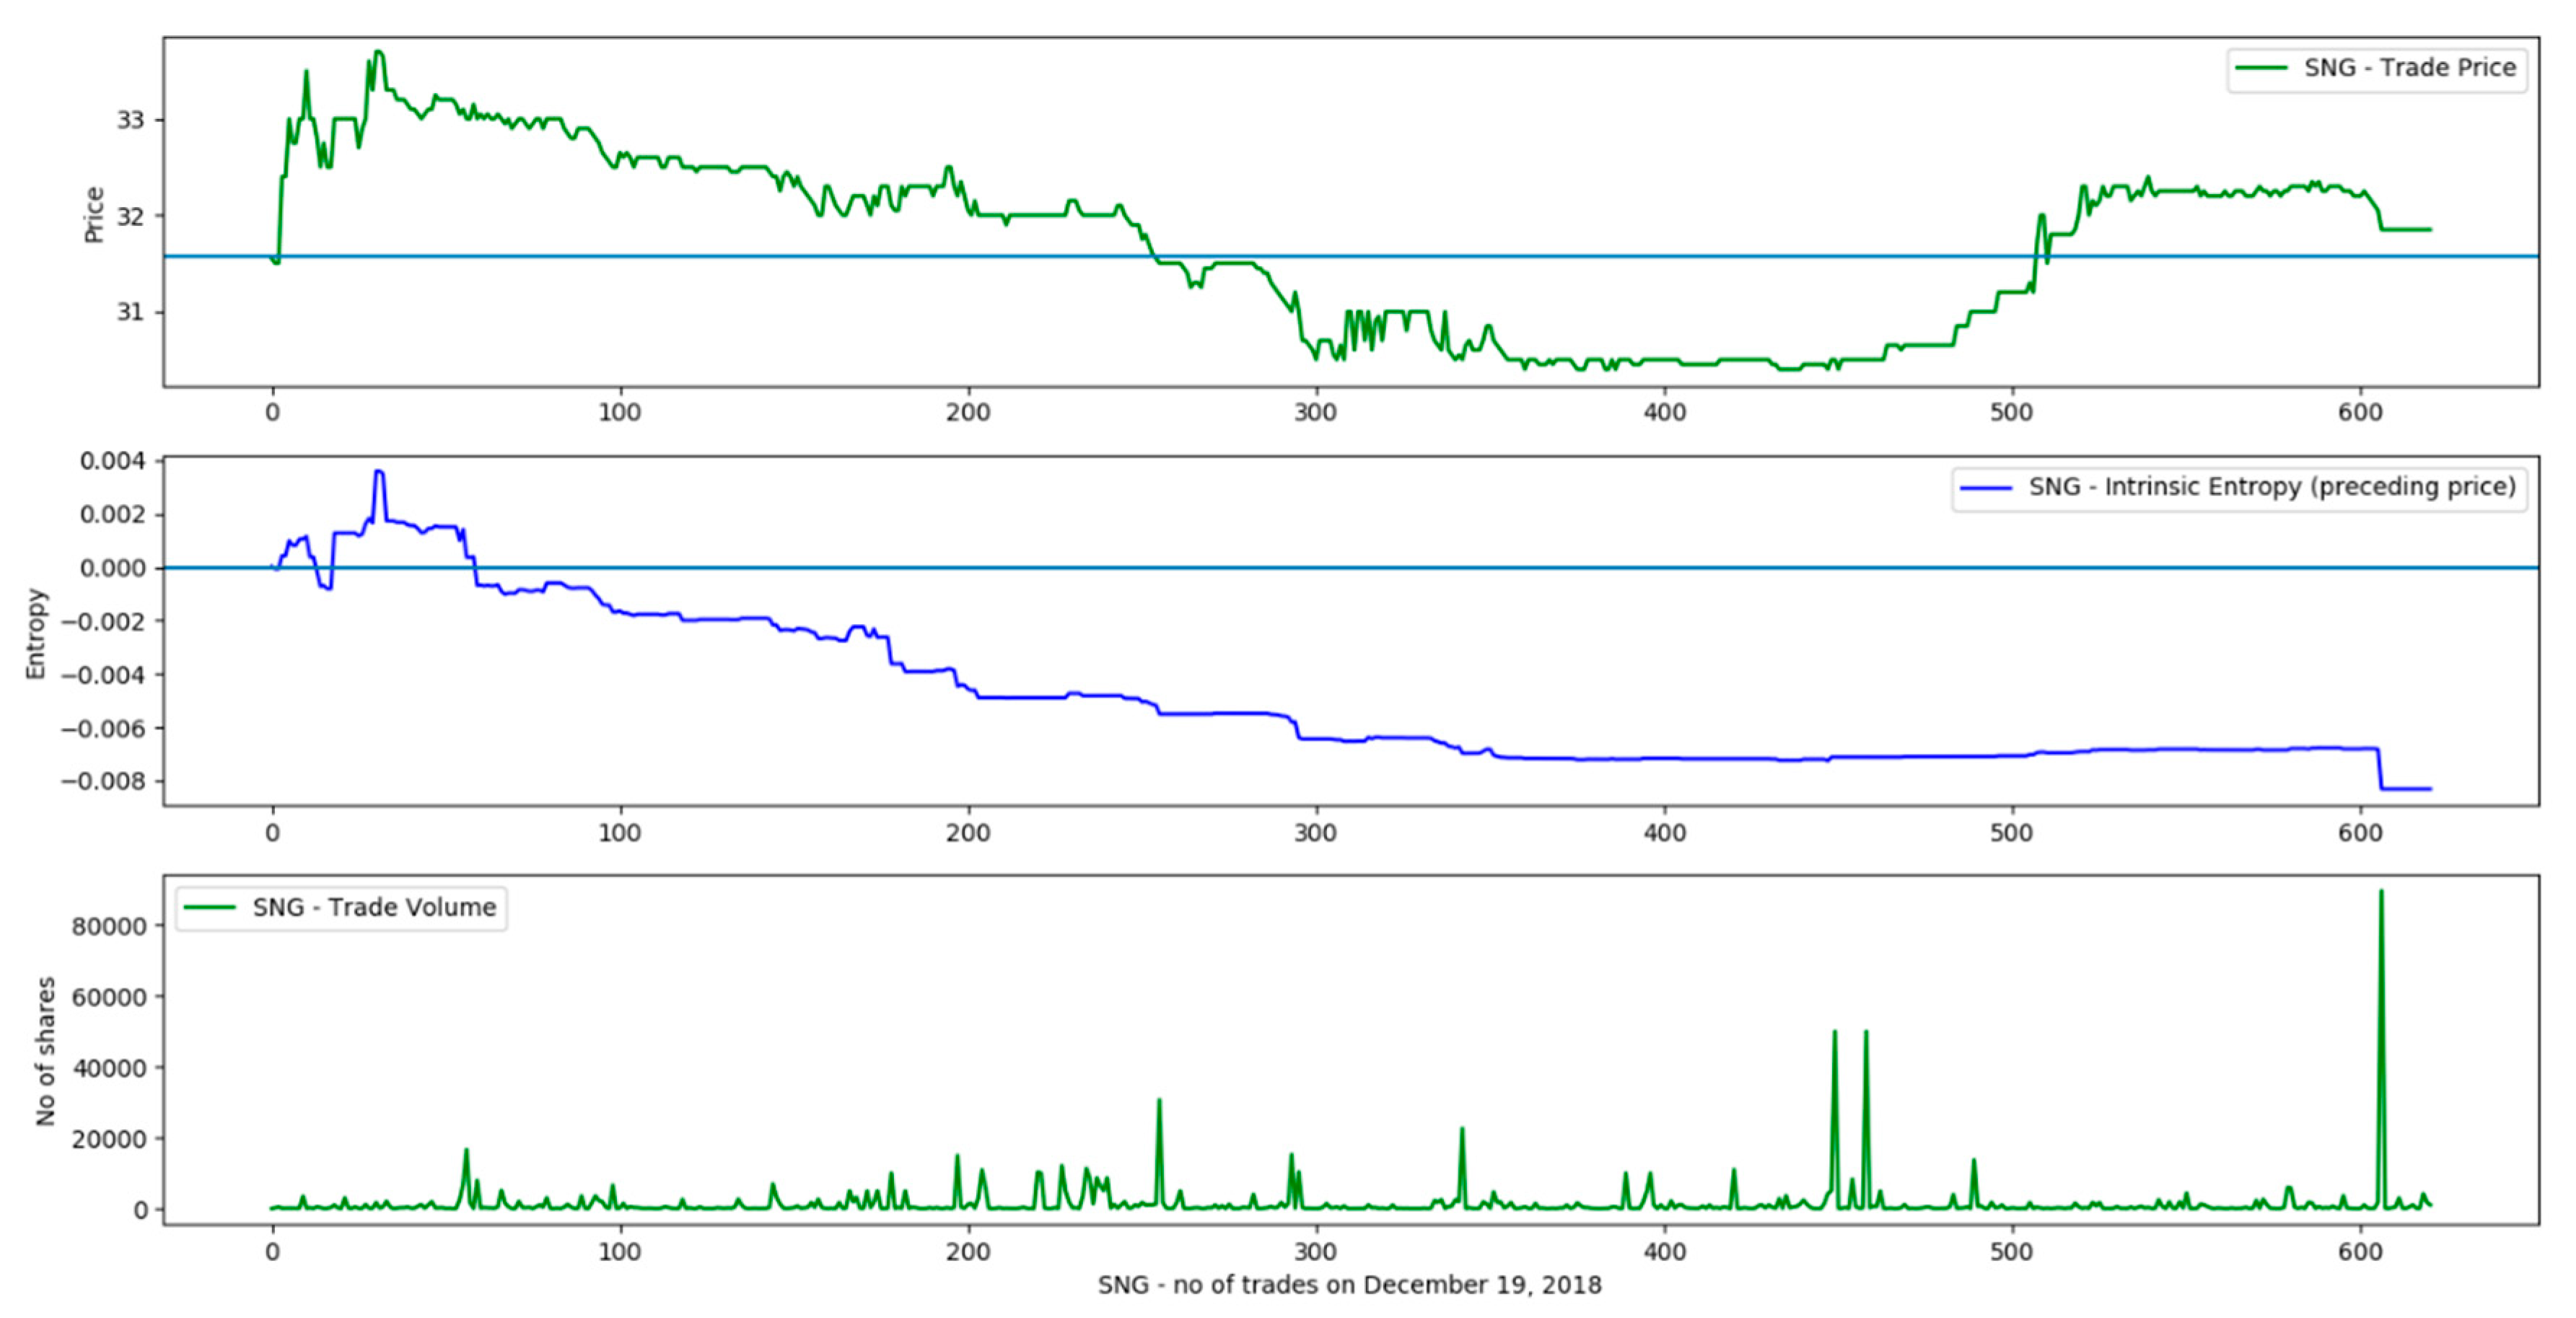
| 22 | SNG | BUY | 95 | 32.75 | 32.77 | SELL | 508 | 31.7 | 31.482 | −3.2061 |
| 23 | SNN | BUY | 29 | 9.01 | 9.466 | SELL | 30 | 9.5 | 9.466 | 5.4384 |
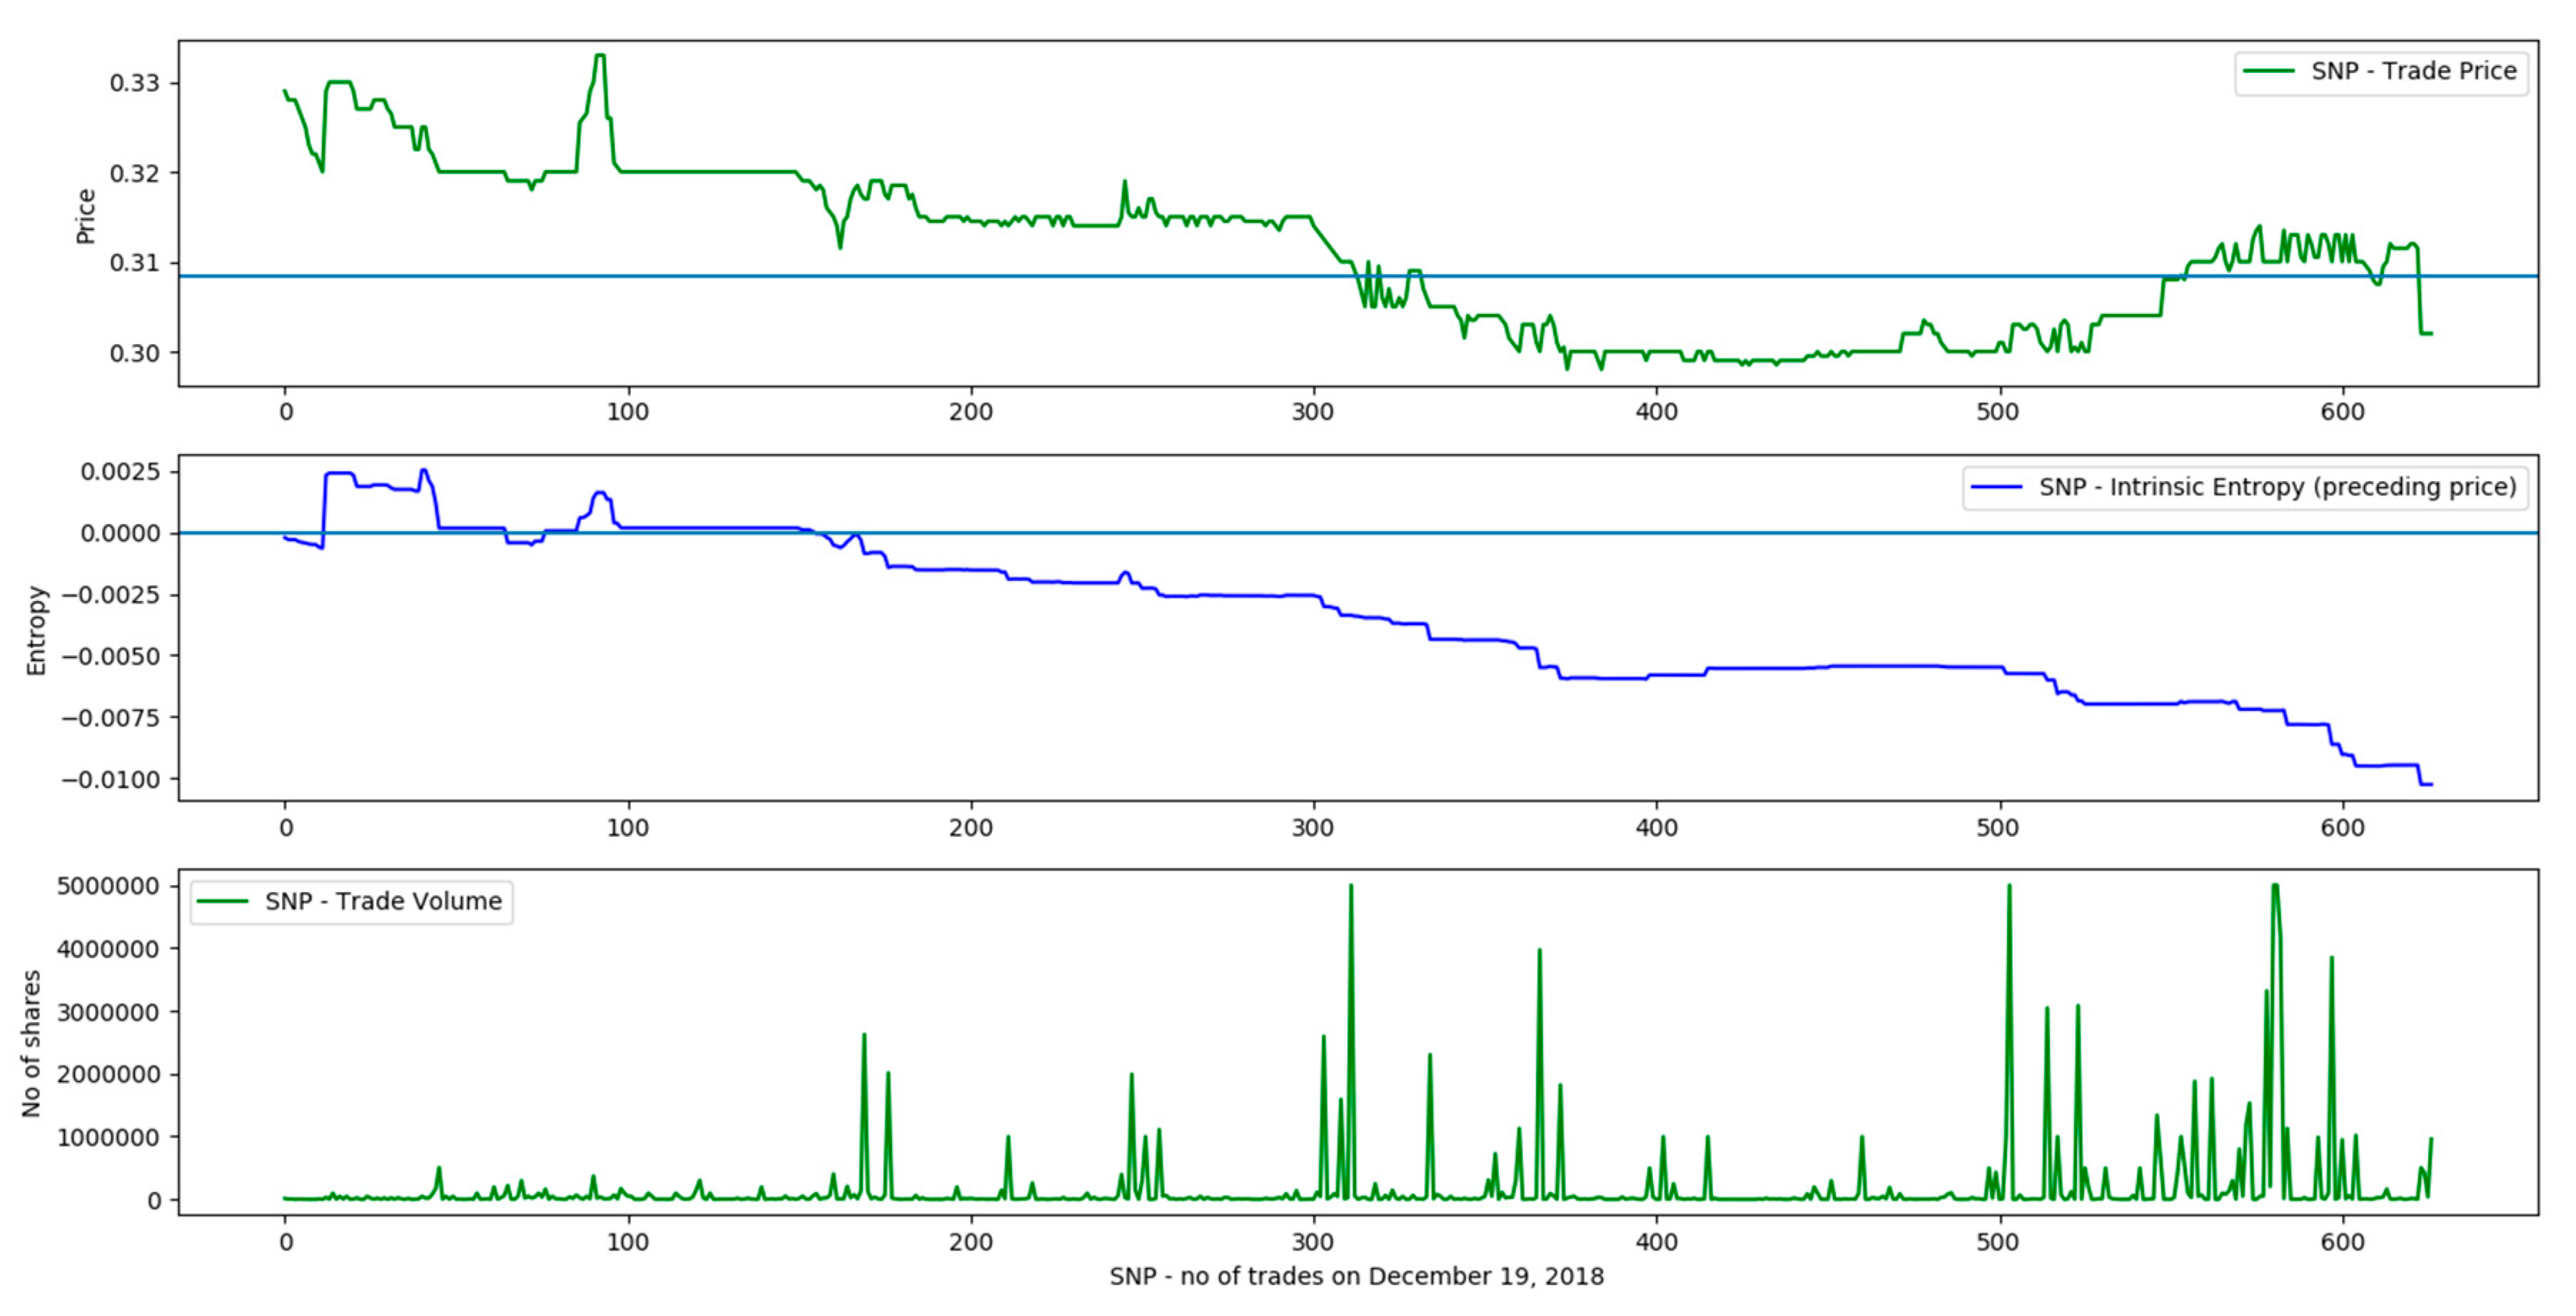
| 24 | SNP | BUY | 12 | 0.32 | 0.33 | SELL | 14 | 0.33 | 0.33 | 3.125 |
| 25 | TBM | |||||||||
| 26 | TEL | |||||||||
| 27 | TGN | BUY | 11 | 320 | 322.692 | SELL | 12 | 325 | 322.731 | 1.5625 |
| 28 | TLV | |||||||||
| 29 | TRP | BUY | 36 | 0.259 | 0.259 | SELL | 37 | 0.26 | 0.259 | 0.3861 |
| No. | Symbol | Trade Side | Buy Trade No. | Buy Price | Buy VWAP | Trade Side | Sell Trade No. | Sell Price | Sell VWAP | Return (%) |
|---|---|---|---|---|---|---|---|---|---|---|
| 1 | CMP | BUY | 12 | 0.87 | 0.908 | SELL | 43 | 0.822 | 0.886 | −5.5172 |
| 2 | ALR | BUY | 10 | 3.28 | 3.351 | SELL | 26 | 3.28 | 3.267 | 0 |
| 3 | ALU | BUY | 10 | 0.66 | 0.68 | SELL | 19 | 0.68 | 0.676 | 3.0303 |
| 4 | ATB | BUY | 10 | 0.479 | 0.481 | SELL | 14 | 0.486 | 0.48 | 1.4614 |
| 5 | BRD | BUY | 10 | 11.7 | 11.999 | SELL | 11 | 12 | 11.999 | 2.5641 |
| 6 | BVB | BUY | 10 | 22.1 | 22.273 | SELL | 18 | 22.2 | 22.192 | 0.4525 |
| 7 | CEON | BUY | 10 | 0.3 | 0.301 | SELL | 15 | 0.3 | 0.299 | 0 |
| 8 | COTE | BUY | 11 | 78 | 78.5 | SELL | 63 | 77 | 76.864 | −1.2821 |
| 9 | EBS | BUY | 10 | 139.05 | 141.371 | SELL | 29 | 149 | 139.265 | 7.1557 |
| 10 | DIGI | BUY | 10 | 25.6 | 26.295 | SELL | 21 | 26 | 25.84 | 1.5625 |
| 11 | EL | BUY | 11 | 10.7 | 10.81 | SELL | 265 | 9.98 | 10.045 | −6.729 |
| 12 | ELMA | BUY | 10 | 0.141 | 0.143 | SELL | 21 | 0.146 | 0.141 | 3.5461 |
| 13 | FP | BUY | 10 | 0.92 | 0.923 | SELL | 87 | 0.914 | 0.911 | −0.6522 |
| 14 | M | BUY | 10 | 26.9 | 27.005 | SELL | 13 | 27 | 26.899 | 0.3717 |
| 15 | PBK | BUY | 10 | 0.071 | 0.075 | SELL | 21 | 0.074 | 0.072 | 4.8159 |
| 16 | ROCE | BUY | 10 | 0.11 | 0.113 | SELL | 15 | 0.118 | 0.113 | 7.2727 |
| 17 | SIF1 | BUY | 10 | 2.2 | 2.216 | SELL | 11 | 2.26 | 2.216 | 2.7273 |
| 18 | SIF2 | BUY | 10 | 1.124 | 1.177 | SELL | 13 | 1.17 | 1.156 | 4.0925 |
| 19 | SIF3 | BUY | 10 | 0.207 | 0.209 | SELL | 24 | 0.207 | 0.207 | 0 |
| 20 | SIF4 | BUY | 10 | 0.6 | 0.603 | SELL | 128 | 0.574 | 0.58 | −4.3333 |
| 21 | SIF5 | BUY | 10 | 2.05 | 2.061 | SELL | 44 | 2.05 | 2.044 | 0 |
| 22 | SNG | BUY | 95 | 32.75 | 32.772 | SELL | 508 | 31.7 | 31.482 | −3.2061 |
| 23 | SNN | BUY | 10 | 9.46 | 9.577 | SELL | 30 | 9.5 | 9.466 | 0.4228 |
| 24 | SNP | BUY | 10 | 0.322 | 0.33 | SELL | 14 | 0.33 | 0.33 | 2.4845 |
| 25 | TBM | BUY | 10 | 0.205 | 0.214 | SELL | 15 | 0.22 | 0.213 | 7.3171 |
| 26 | TEL | BUY | 10 | 22.25 | 22.373 | SELL | 51 | 22.2 | 22.111 | −0.2247 |
| 27 | TGN | BUY | 10 | 320 | 322.82 | SELL | 12 | 325 | 322.692 | 1.5625 |
| 28 | TLV | BUY | 10 | 2.045 | 2.05 | SELL | 146 | 2.04 | 2.026 | −0.2445 |
| 29 | TRP | BUY | 10 | 0.256 | 0.257 | SELL | 12 | 0.258 | 0.257 | 0.7813 |
References
- Duan, W.; Zhou, W. The Sales Impact of Word-of-Mouth Distribution across Retail and Third-Party Websites. In Proceedings of the Sales Impact of the Distribution of Online WOM Thirty Seventh International Conference on Information Systems, Dublin, Ireland, 11–14 December 2016. [Google Scholar]
- Sprenger, T.O.; Welpe, I.M. News or Noise? The Stock Market Reaction to Different Types of Company-Specific News Events (January 4, 2011). Available online: http://dx.doi.org/10.2139/ssrn.1734632 (accessed on 28 November 2019).
- Machado, J.A.; Duarte, F.B.; Duarte, G.M. Analysis of stock market indices with multidimensional scaling and wavelets. Math. Probl. Eng. 2012, 2012, 1–14. [Google Scholar] [CrossRef]
- Fama, E.F. Efficient Capital Markets: A Review of Theory and Empirical Work. J. Financ. 1970, 25, 383–417. [Google Scholar] [CrossRef]
- Frigg, R.; Werndl, C. Entropy—A Guide for the Perplexed. In Probabilities in Physics; Beisbart, C., Hartmann, S., Eds.; Oxford University Press: Oxford, UK, 2010. [Google Scholar]
- Shannon, E.C. A Mathematical Theory of Communication. Bell Syst. Tech. J. 1948, 27, 379–423. [Google Scholar] [CrossRef]
- Clausius, R. On a Modified Form of the Second Fundamental Theorem in the Mechanical Theory of Heat. Lond. Edinb. Dublin Philos. Mag. J. Sci. 1856, 12, 81–98. [Google Scholar] [CrossRef]
- Boltzmann, L. Lectures on Gas Theory; translated by Brush S.G.; University of California Press: Berkeley, CS, USA, 2012. [Google Scholar]
- Schneider, T.D. Information Theory Primer with an Appendix on Logarithms; National Cancer Institute: Bethesda, MD, USA, 2007; pp. 5–6.
- Jaynes, E.T.; Smith, C.R.; Erickson, G.J. The Gibbs Paradox. In Maximum Entropy and Bayesian Methods; Neudorfer, P.O., Ed.; Kluwer Academic: Dordrecht, The Netherlands, 1992; pp. 1–22. [Google Scholar]
- Georgescu-Roegen, N. The Entropy Law and the Economic Process; Harvard University Press: Cambridge, MA, USA, 1971. [Google Scholar]
- Ausloos, M. New region planning in France? Better order or more disorder? Entropy 2015, 17, 5695–5710. [Google Scholar] [CrossRef]
- Ausloos, M.; Nedic, O.; Dekanski, A. Seasonal Entropy, Diversity and Inequality Measures of Submitted and Accepted Papers Distributions in Peer-Reviewed Journals. Entropy 2019, 21, 564. [Google Scholar] [CrossRef]
- Marti, G.; Nielsen, F.; Bińkowski, M.; Donnat, P. A review of two decades of correlations, hierarchies, networks and clustering in financial markets. arXiv 2017, arXiv:1703.00485. [Google Scholar]
- Horowitz, R.A.; Horowitz, I. The real and illusory virtues of entropy-based measures for business and economic analysis. Decis. Sci. 1976, 7, 121–136. [Google Scholar] [CrossRef]
- Philippatos, G.; Wilson, C. Entropy, market risk and the selection of efficient portfolios. Appl. Econ. 1972, 4, 209–220. [Google Scholar] [CrossRef]
- Philippatos, G.; Wilson, C. Entropy, market risk and the selection of efficient portfolios: Reply. Appl. Econ. 1974, 6, 76–79. [Google Scholar] [CrossRef]
- White, D. Entropy, market risk and the selection of efficient portfolios: Comment. Appl. Econ. 1974, 6, 73–75. [Google Scholar] [CrossRef]
- Nawrocki, D.N.; Harding, W.H. State-value weighted entropy as a measure of investment risk. Appl. Econ. 1986, 18, 411–419. [Google Scholar] [CrossRef]
- Tsallis, C. Possible generalization of Boltzmann–Gibbs statistics. J. Stat. Phys. 1988, 52, 479–487. [Google Scholar] [CrossRef]
- Jaynes, E.T. Gibbs vs Boltzmann entropies. Am. J. Phys. 1965, 33, 391–398. [Google Scholar] [CrossRef]
- Gibbs, J.W. On the Equilibrium of Heterogeneous Substances. Am. J. Sci. 1878, 16, 441–458. [Google Scholar] [CrossRef]
- Gibbs, J.W. Elementary Principles in Statistical Mechanics, Developed with Especial Reference to the Rational Foundation of Thermodynamics; Charles Scribner’s Sons: New York, NY, USA, 1902. [Google Scholar]
- Maassoumi, E.; Racine, J. Entropy and predictability of stock market returns. J. Econom. 2002, 107, 291–312. [Google Scholar] [CrossRef]
- Ausloos, M.; Ivanova, K. Dynamical model and nonextensive statistical mechanics of a market index on large time windows. Phys. Rev. E 2003, 68, 046122. [Google Scholar] [CrossRef]
- Zhou, R.; Cai, R.; Tong, G. Applications of entropy in finance: A review. Entropy 2013, 15, 4909–4931. [Google Scholar] [CrossRef]
- Xu, M.; Shang, P.; Huang, J. Modified generalized sample entropy and surrogate data analysis for stock markets. Commun. Nonlinear Sci. Numer. Simul. 2016, 35, 17–24. [Google Scholar] [CrossRef]
- Zunino, L.; Zanin, M.; Tabak, B.M.; Pérez, D.G.; Rosso, O.A. Complexity-entropy causality plane: A useful approach to quantify the stock market inefficiency. Phys. A Stat. Mech. Its Appl. 2010, 389, 1891–1901. [Google Scholar] [CrossRef]
- Zanin, M.; Zunino, L.; Rosso, O.A.; Papo, D. Permutation entropy its main biomedical econophysics applications: A review. Entropy 2012, 14, 1553–1577. [Google Scholar] [CrossRef]
- Li, J.; Liang, C.; Zhu, X.; Sun, X.; Wu, D. Risk contagion in Chinese banking industry: A Transfer Entropy-based analysis. Entropy 2013, 15, 5549–5564. [Google Scholar] [CrossRef]
- Cerqueti, R.; Rotundo, G.; Ausloos, M. Investigating the configurations in cross-shareholding: A joint copula-entropy approach. Entropy 2018, 20, 134. [Google Scholar] [CrossRef]
- Ceptureanu, S.I.; Ceptureanu, E.G.; Marin, I. Assessing the Role of Strategic Choice on Organizational Performance by Jacquemin–Berry Entropy Index. Entropy 2017, 19, 448. [Google Scholar] [CrossRef]
- Vinte, C. The Informatics of the Equity Markets—A Collaborative Approach. Econ. Inform. 2009, 13, 76–85. [Google Scholar]
- Vinte, C. Methods and Apparatus for Optimizing the Distribution of Trading Executions. U.S. Patent 2014/0149274A1, 29 May 2014. Available online: https://patents.google.com/patent/US20140149274 (accessed on 22 November 2019).
- Hoskisson, R.E.; Hitt, M.A.; Johnson, R.A.; Moesel, D.D. Construct validity of an objective (entropy) categorical measure of diversification strategy. Strateg. Manag. J. 1993, 14, 215–235. [Google Scholar] [CrossRef]
- Bera, A.K.; Park, S.Y. Optimal portfolio diversification using the maximum entropy principle. Econom. Rev. 2008, 27, 484–512. [Google Scholar] [CrossRef]
- Barry, J. Algorithmic Trading & DMA an Introduction to Direct Access Trading Strategies; 4Myeloma Press: London, UK, 2010; pp. 115–160. [Google Scholar]
- Vinte, C. Upon a Tridimensional Perspective of the Stock Market. In Proceedings of the Ninth International Conference on Informatics in Economy, Bucharest, Romania, 7–8 May 2009. [Google Scholar]
| Timestamp | Traded Symbol | Trade Quantity (no of Shares) | Trade Price |
|---|---|---|---|
| 19 December 2018 10:00 | BRD | 57,795 | 12 |
| 19 December 2018 10:00 | BRD | 55 | 12 |
| 19 December 2018 10:00 | BRD | 300 | 12.54 |
| 19 December 2018 10:00 | BRD | 60 | 12 |
| 19 December 2018 10:00 | BRD | 210 | 11.9 |
| 19 December 2018 10:00 | BRD | 220 | 11.9 |
| 19 December 2018 10:00 | BRD | 2 | 11.9 |
| 19 December 2018 10:00 | BRD | 94 | 11.9 |
| … | … | … | … |
| 19 December 2018 17:56 | BRD | 350 | 11.14 |
| 19 December 2018 17:56 | BRD | 60 | 11.14 |
| 19 December 2018 17:56 | BRD | 1000 | 11.14 |
| 19 December 2018 17:56 | BRD | 100 | 11.14 |
| 19 December 2018 17:57 | BRD | 448 | 11.14 |
| 19 December 2018 17:57 | BRD | 1000 | 11.14 |
| 19 December 2018 17:58 | BRD | 1 | 11.14 |
| No. | Symbol | Trade Side | Buy Trade No. | Buy Price | Buy VWAP | Trade Side | Sell Trade No. | Sell Price | Sell VWAP | Return (%) |
|---|---|---|---|---|---|---|---|---|---|---|
| 1 | CMP | BUY | 12 | 0.87 | 0.908 | SELL | 35 | 0.88 | 0.892 | 1.1494 |
| 2 | ALU | BUY | 30 | 0.65 | 0.67 | SELL | 33 | 0.665 | 0.67 | 2.3077 |
| 3 | BRD | BUY | 10 | 11.7 | 11.999 | SELL | 11 | 12 | 11.998 | 2.5641 |
| 4 | CEON | BUY | 10 | 0.3 | 0.301 | SELL | 15 | 0.3 | 0.299 | 0 |
| 5 | COTE | BUY | 62 | 75.2 | 76.864 | SELL | 63 | 77 | 76.869 | 2.3936 |
| 6 | SIF2 | BUY | 11 | 1.13 | 1.156 | SELL | 13 | 1.17 | 1.156 | 3.5398 |
| 7 | SNG | BUY | 95 | 32.75 | 32.77 | SELL | 508 | 31.7 | 31.482 | −3.2061 |
| 8 | SNN | BUY | 29 | 9.01 | 9.466 | SELL | 30 | 9.5 | 9.466 | 5.4384 |
| 9 | SNP | BUY | 12 | 0.32 | 0.33 | SELL | 14 | 0.33 | 0.33 | 3.125 |
| 10 | TGN | BUY | 11 | 320 | 322.692 | SELL | 12 | 325 | 322.731 | 1.5625 |
| 11 | TRP | BUY | 36 | 0.259 | 0.259 | SELL | 37 | 0.26 | 0.259 | 0.3861 |
| Cumulated return | 19.2605 | |||||||||
| No. | Symbol | Trade Side | Buy Trade No. | Buy Price | Buy VWAP | Trade Side | Sell Trade No. | Sell Price | Sell VWAP | Return (%) |
|---|---|---|---|---|---|---|---|---|---|---|
| 1 | CMP | BUY | 12 | 0.87 | 0.908 | SELL | 43 | 0.822 | 0.886 | −5.5172 |
| 2 | ALU | BUY | 10 | 0.66 | 0.68 | SELL | 19 | 0.68 | 0.676 | 3.0303 |
| 3 | BRD | BUY | 10 | 11.7 | 11.999 | SELL | 11 | 12 | 11.999 | 2.5641 |
| 4 | CEON | BUY | 10 | 0.3 | 0.301 | SELL | 15 | 0.3 | 0.299 | 0 |
| 5 | COTE | BUY | 11 | 78 | 78.5 | SELL | 63 | 77 | 76.864 | −1.2821 |
| 6 | SIF2 | BUY | 10 | 1.124 | 1.177 | SELL | 13 | 1.17 | 1.156 | 4.0925 |
| 7 | SNG | BUY | 95 | 32.75 | 32.772 | SELL | 508 | 31.7 | 31.482 | −3.2061 |
| 8 | SNN | BUY | 10 | 9.46 | 9.577 | SELL | 30 | 9.5 | 9.466 | 0.4228 |
| 9 | SNP | BUY | 10 | 0.322 | 0.33 | SELL | 14 | 0.33 | 0.33 | 2.4845 |
| 10 | TGN | BUY | 10 | 320 | 322.82 | SELL | 12 | 325 | 322.692 | 1.5625 |
| 11 | TRP | BUY | 10 | 0.256 | 0.257 | SELL | 12 | 0.258 | 0.257 | 0.7813 |
| Cumulated return | 4.9326 | |||||||||
© 2019 by the authors. Licensee MDPI, Basel, Switzerland. This article is an open access article distributed under the terms and conditions of the Creative Commons Attribution (CC BY) license (http://creativecommons.org/licenses/by/4.0/).
Share and Cite
Vințe, C.; Smeureanu, I.; Furtună, T.-F.; Ausloos, M. An Intrinsic Entropy Model for Exchange-Traded Securities. Entropy 2019, 21, 1173. https://doi.org/10.3390/e21121173
Vințe C, Smeureanu I, Furtună T-F, Ausloos M. An Intrinsic Entropy Model for Exchange-Traded Securities. Entropy. 2019; 21(12):1173. https://doi.org/10.3390/e21121173
Chicago/Turabian StyleVințe, Claudiu, Ion Smeureanu, Titus-Felix Furtună, and Marcel Ausloos. 2019. "An Intrinsic Entropy Model for Exchange-Traded Securities" Entropy 21, no. 12: 1173. https://doi.org/10.3390/e21121173
APA StyleVințe, C., Smeureanu, I., Furtună, T.-F., & Ausloos, M. (2019). An Intrinsic Entropy Model for Exchange-Traded Securities. Entropy, 21(12), 1173. https://doi.org/10.3390/e21121173


