


Abstract
Heinrich’s pyramid theory is one of the most influential theories in accident and incident prevention, especially for industries with high safety requirements. Originally, this theory established a quantitative correlation between major injury accidents, minor injury accidents and no-injury accidents. Nowadays, researchers from different fields of engineering also apply this theory in establishing quantitatively the correlation between accidents and incidents. In this work, on the one hand, we have detected the applicability of this theory by studying incident reports of different severities occurred in air traffic management. On the other hand, we have deepened the analysis of this theory from a qualitative perspective. For this purpose, we have applied the convolution operator in identifying correlations between contributing causes to different incident severities, also known as precursors to accidents, and system failures. The results suggested that system failures are mechanisms by which the causes are manifested. In particular, the same underlying cause can be manifested through different failures which contribute to incidents with different severities. Finally, deriving from this result, an artificial neuronal network model is proposed to recognize future causes and their possible associated incident severities.
1. Introduction
Heinrich’s Pyramid Theory is another influential theory such as the Swiss chess model (SCM) of Reason [1] in safety science. This theory suggests that minimizing the number of incidents with lower levels of severities leads to reducing the number of high severity events, including accidents [2]. According to this theory, a large number of incidents with low consequences, if untreated, would potentially lead to few occurrences with high consequences [3]. Moreover, a progressive increase in minor incidents would lead to a major accident. Whilst some researchers disagree with Heinrich by stating that accidents are caused by poor management systems as the main reason and not by human actions [4] and provide criticism related to the lack of qualitative representation of this theory [5], the pyramid theory is still widely applied for safety management in different sectors. Kyriakidis et al. [6] have deepened this theory in improving accident precursor monitoring program of railway safety; Golovina et al. [7] have designed an algorithm based on this theory for preventative hazard recognition and control process related to construction safety. Marshall et al. [8] have turned to statistical methods to confirm Heinrich’s theory in occupational accidents. For industrial process analysis, Prem et al. [9] have generated safety pyramids based on historical databases of chemical industrial accidents and compared them with Heinrich’s pyramid to understand incident occurrence trends.
Particularly, in the aviation sector, Walker [10] has established a risk pyramid with quantitative relation between occurrences, incidents, and accidents based on data registered in black boxes with the purpose of improving flight data monitoring system. Majumdar et al. [11] have applied this theory directly to develop safety indicators using the data of loss of separation (LOS) incidents registered in airspaces of New Zealand and the United Kingdom; however, unlike the quantitative relation considered in Heinrich’s pyramid, Nazeri and Lance [12] have applied this theory in looking for a qualitative relation between accidents and incidents through their underlying factors.
Most of these researchers have used big data sources to demonstrate the validity of Heinrich’s pyramid theory [8], and thus show the proportion between occurrences with different levels of severity [12]. Based on this theory, they have established a quantitative relationship between occurrences with their source data. Even Heinrich in [2] postulated that, for each accident with major injury, there were 29 accidents with minor injuries and 300 accidents without injuries. However, both Heinrich and these researchers have not examined the mode of connection or contribution of underlying causes to occurrences with different levels of severity. Such a qualitative relationship is no less important than the quantitative one and it might support us in understanding the stream of causes from a low to a high level of severity.
From this perspective, statistical models that can establish the qualitative relationship between different levels of the pyramid will be advantageous in comprehending the proximity to fatalities [9]. In our previous work [13], we followed a series of steps in extracting serious incident data for Bayesian Network (BN) construction as well as searching possible scenarios where influential causes contributed to this category of accidents. In our research [14], we have completed the analysis adding major incidents and updated the BN model providing relations between serious (near accidents) and major incidents, which have been established through the connections between factors and events in different categories of the incident. Thus, one qualitative study related to the connections should be necessary and support us to detect the behaviour of each factor in different categories of incidents, even its associated events. For this reason, we employed the use of convolution operator, one mathematical operator, in filtering [15] and amplifying the information [16] contained in this kind of factors.
Objectives
In our previous work [14], our results indicated that some causes contribute to different categories of incidents. Their combinations provide potential scenarios leading to an accident in one category of incidents, but not in another. Derivate from this result, we can observe that common factors can be identified connecting different categories of incidents with different contributions. Therefore, the analysis should be deepened in the following points:
- Apply Heinrich’s Pyramid Theory in studying air traffic management (ATM) incidents. Based on the results in [13,14], it is deduced that a relationship might be established between factors and categories of incidents; such relationship approximates that described by Heinrich’s Pyramid Theory concerning causes and levels of severity. In addition, to check whether this theory explains the results obtained in previous papers, we are also interested in knowing if one relationship would be established between causes and different categories of incidents occurring within the ATM system.
- Detect correlations between factors and different levels of incident severity. If factors connect between different levels, we need to know what correlation is established between factors and incident severity levels. In this manner, it is possible to study the behaviour of each factor and its mode of contribution or stream within these incidents.
2. Material
According to ICAO Annex 11 [17] and European Regulation (EU) No. 376/2014 [18], an incident investigation must be conducted by the local authority and its final report should be published. In Spain, the State Investigation Office has the responsibility of receiving the notification and proceeding with the corresponding investigation. This entity is also in charge of processing the incident data and publishing the final report [19]. Table 1 presents a set of occurrences and categories of all investigated incidents, which occurred in the Spanish ATM system during four consecutive years. Within 31 serious incidents (severity A) and 139 major incidents (severity B), near 50% of them correspond to LOS incidents occurring between aircraft. Focusing on the purpose of this research work, only LOS incidents between commercial aircraft have been considered, resulting in a sample of 87 LOS incident reports in total; 14 serious incidents and 73 major incidents have been analysed.
Table 1.
Spanish incident reports during four consecutive years.
3. Methodology
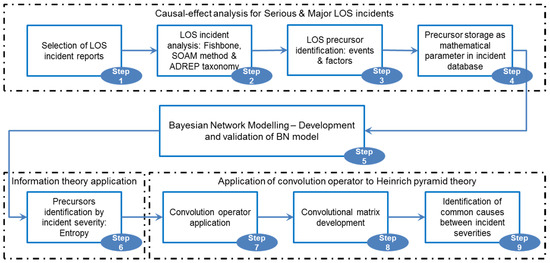
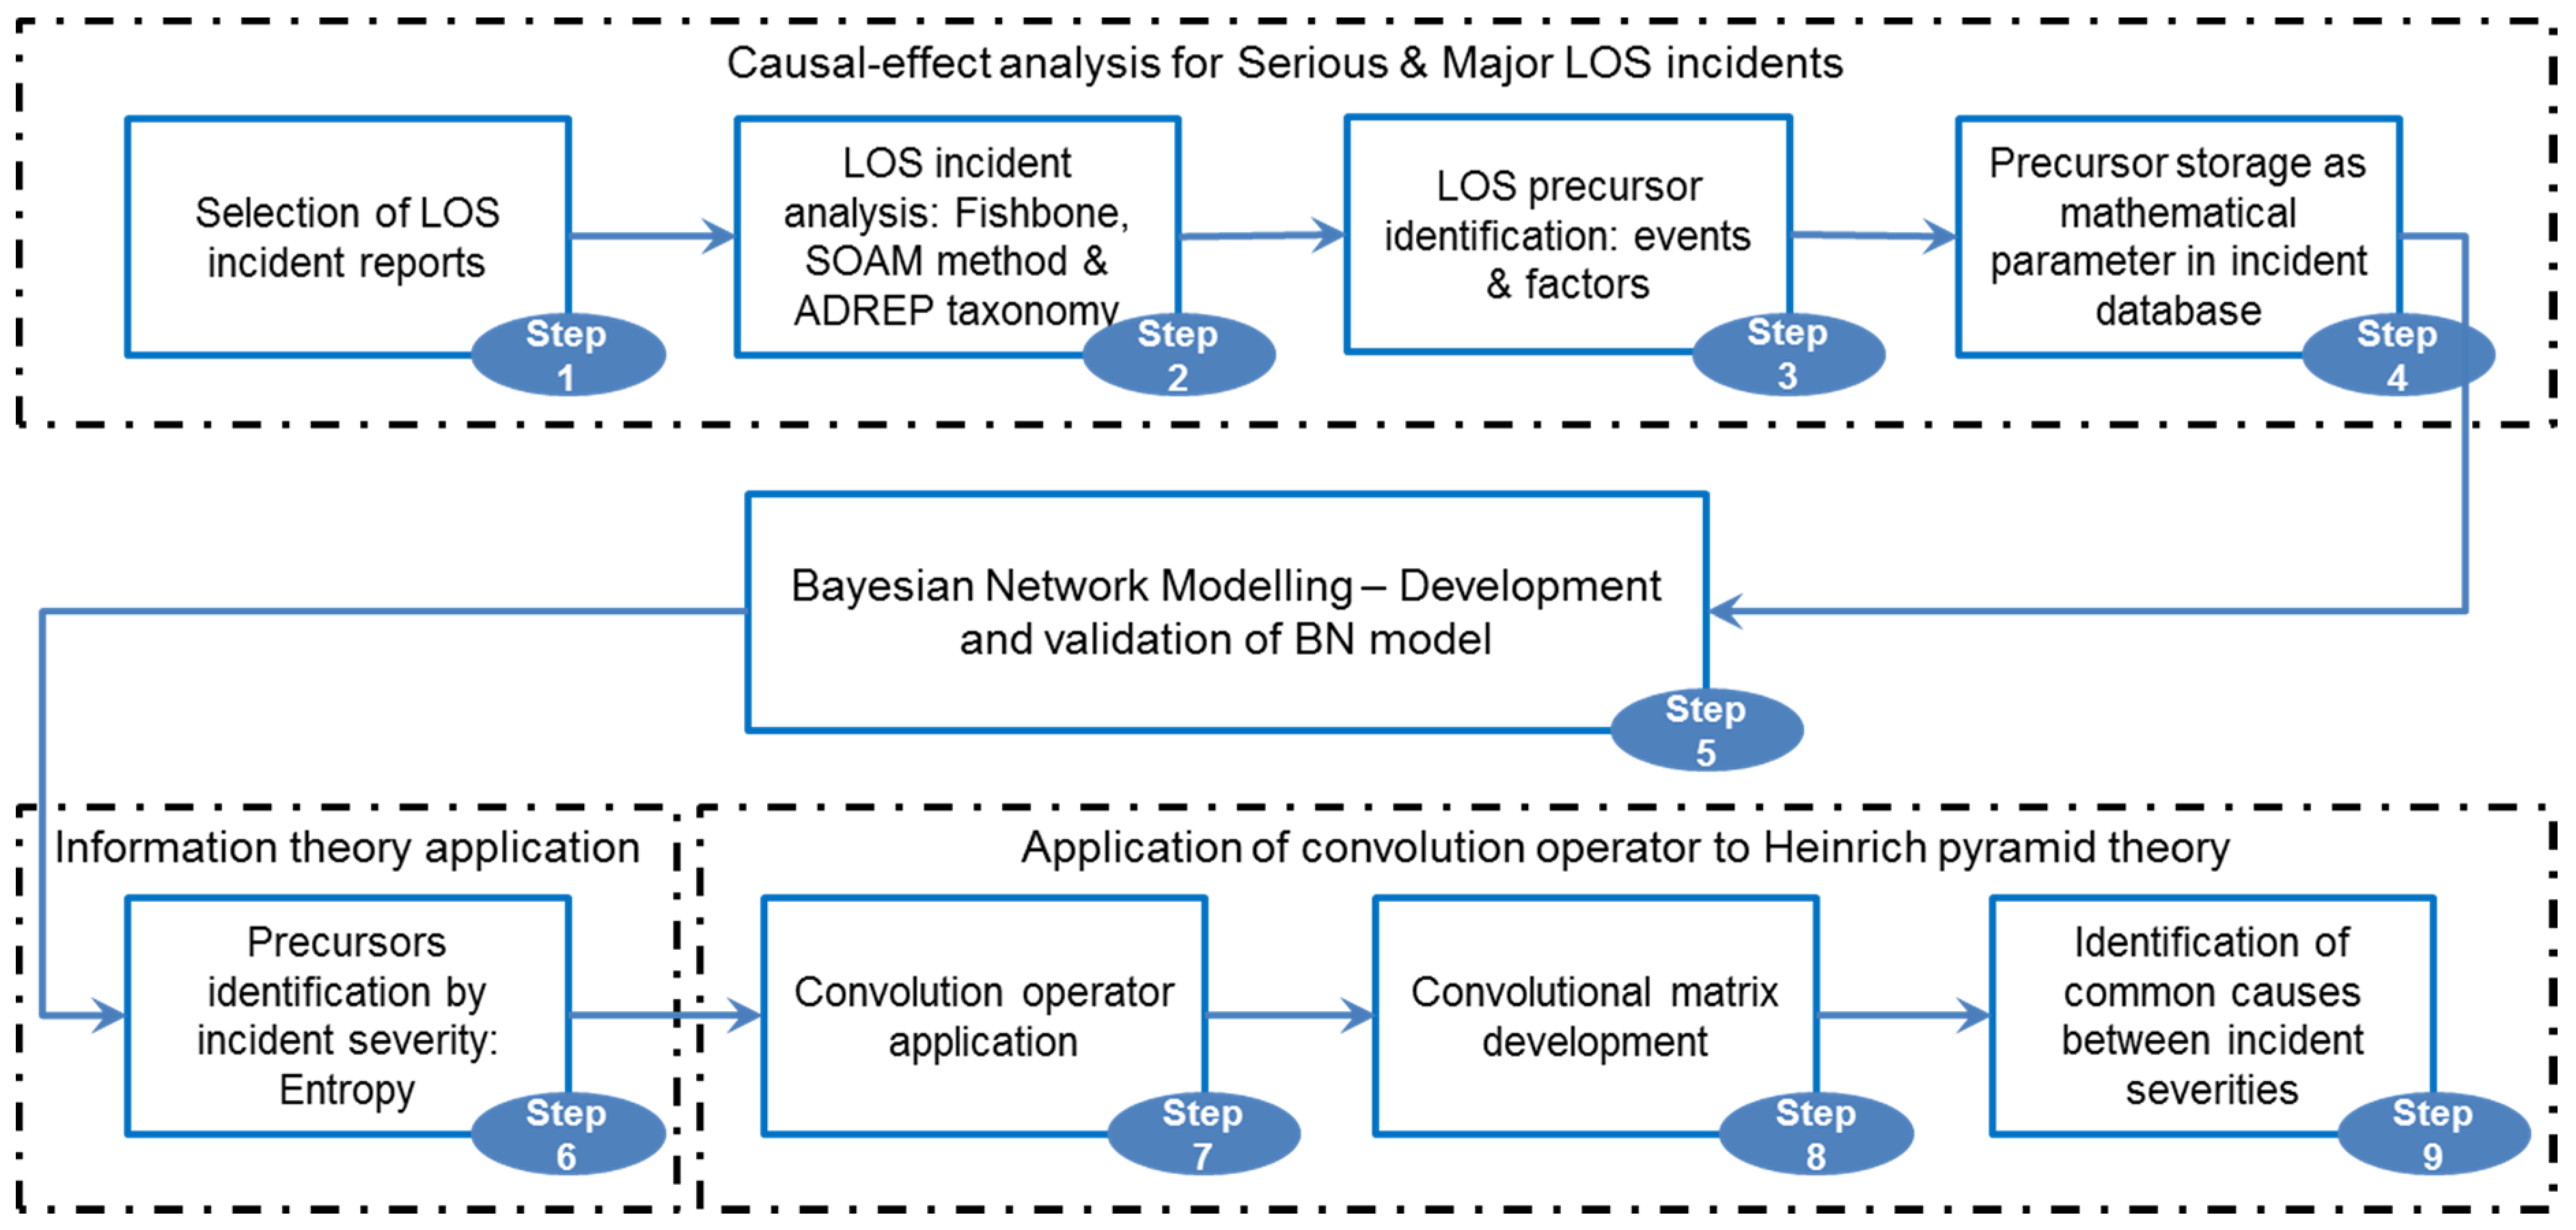
Steps of the methodology that we have followed during this research work are indicated in Figure 1. Even though steps 1–6 have been already exhaustively defined in our previous publications [13,14], they are summarized below in keeping the contextual connection.
Figure 1.
Methodology of convolution operator application to Heinrich pyramid theory in detecting common causes between incident severities.
The initial phase (steps 1–4) aims to detect causes and failures contributing to LOS serious and major incidents. Data collected from these incident reports are identified as factors and events, which are also denominated as precursors to future accidents. These factors and events can be extracted and codified by standardized methodologies [20,21,22] and taxonomies [23], which have been applied in this process. Factors based on taxonomy can be divided into two groups: descriptive factor (DF) and explanatory factor (EF). Both groups of factors represent causes of failures, meanwhile, events are identified as failures of the system.
In the second phase (step 5) based on the established correlation between factors and events, a BN model can be developed and validated. Moreover, a quantitative cause–effect map can be depicted through the BN model (factors as children nodes and events as parent nodes) and used to recreate scenarios of serious and major LOS incidents. Within the BN model, the likelihoods of factors and events, as well as their strength of the connections, are estimated based on the number of analysed incident reports and collected in the conditional probability table (CPT) [24].
During the third phase (step 6) the information theory developed from entropy principals is applied to identify the most correlated precursors of serious and major LOS incidents. The mutual information concept is used in quantifying the contribution of causes to these two incident severities and formulated as Equation (1):
During the last phase, Heinrich’s Pyramid Theory is considered in analysing precursors. Regarding Heinrich’s Pyramid Theory, factors that contribute to critical incidents, or with a higher severity level, are also present in less critical incidents or lower levels of severity. The application of this theory affords the identification of factors that have been involved in the incidents of severity A and B, and reveal their modes of participation in the incidents. However, this theory provides less qualitative correlation, which indicates the mode of contributing and the connection of these factors within two proximate severities. Consequently, without knowing the detail of this correlation, suitable design of barriers that allow the effective mitigation of events would not be carried out. Therefore, we can deepen the analysis by identifying the factors that chain between severity levels (concatenated factors), and their connectivity behaviours within different categories of incidents caused by them. Hence, Equation (2) of convolution for discrete sets [25] is applied to two sets of incidents with different severities, thereby filtering and amplifying information on factors common to both categories of incidents (step 7).
Equation (2):
where If and Ig are functions of mutual information of two sets of incidents with different and proximate severities. Additionally, according to the commutative property of convolution, , the convolution from one set to another presents a symmetrical interpretation. Developing Equation (2), one generic convolution matrix related to the status of mutual information of a factor in two close severities is created as indicated in Table 2 (step 8).
Table 2.
Mutual information matrix for two proximate categories of incidents.
Three associated situations of incidents are shown independently of the factor states (columns of the matrix):
- i.
- Both categories of incidents are in present states;
- ii.
- One of them is in the present state and the other one in the absent state;
- iii.
- Neither of them is in the present state.
The other three situations associated with the status of the factor are shown independently of the incident states (rows of the matrix):
- i.
- The factor belongs to both incident categories;
- ii.
- The factor only belongs to one of both incident categories;
- iii.
- The factor is from neither of both incident categories.
Finally, the total number of mutual information that both severities of incidents share by this factor is the sum (I) of these nine components in the convolution matrix. Depending on the result of this sum of mutual information, three cases related to the participation and the behaviour of factors in different incident severities can be discussed (step 9).
4. Results of Application
As input data, a set of serious and major LOS incidents occurred between commercial aircraft in the Spanish airspace during four consecutive years has been considered (step 1). The analysis of incident reports provides causal–effect paths leading to serious and major LOS (step 2), and precursors that are extracted and attributed to events and factors (step 3). For the purpose of data management, these precursors are registered in a database as mathematical parameters (step 4).
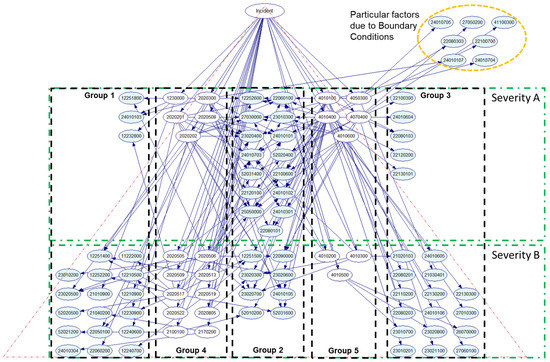
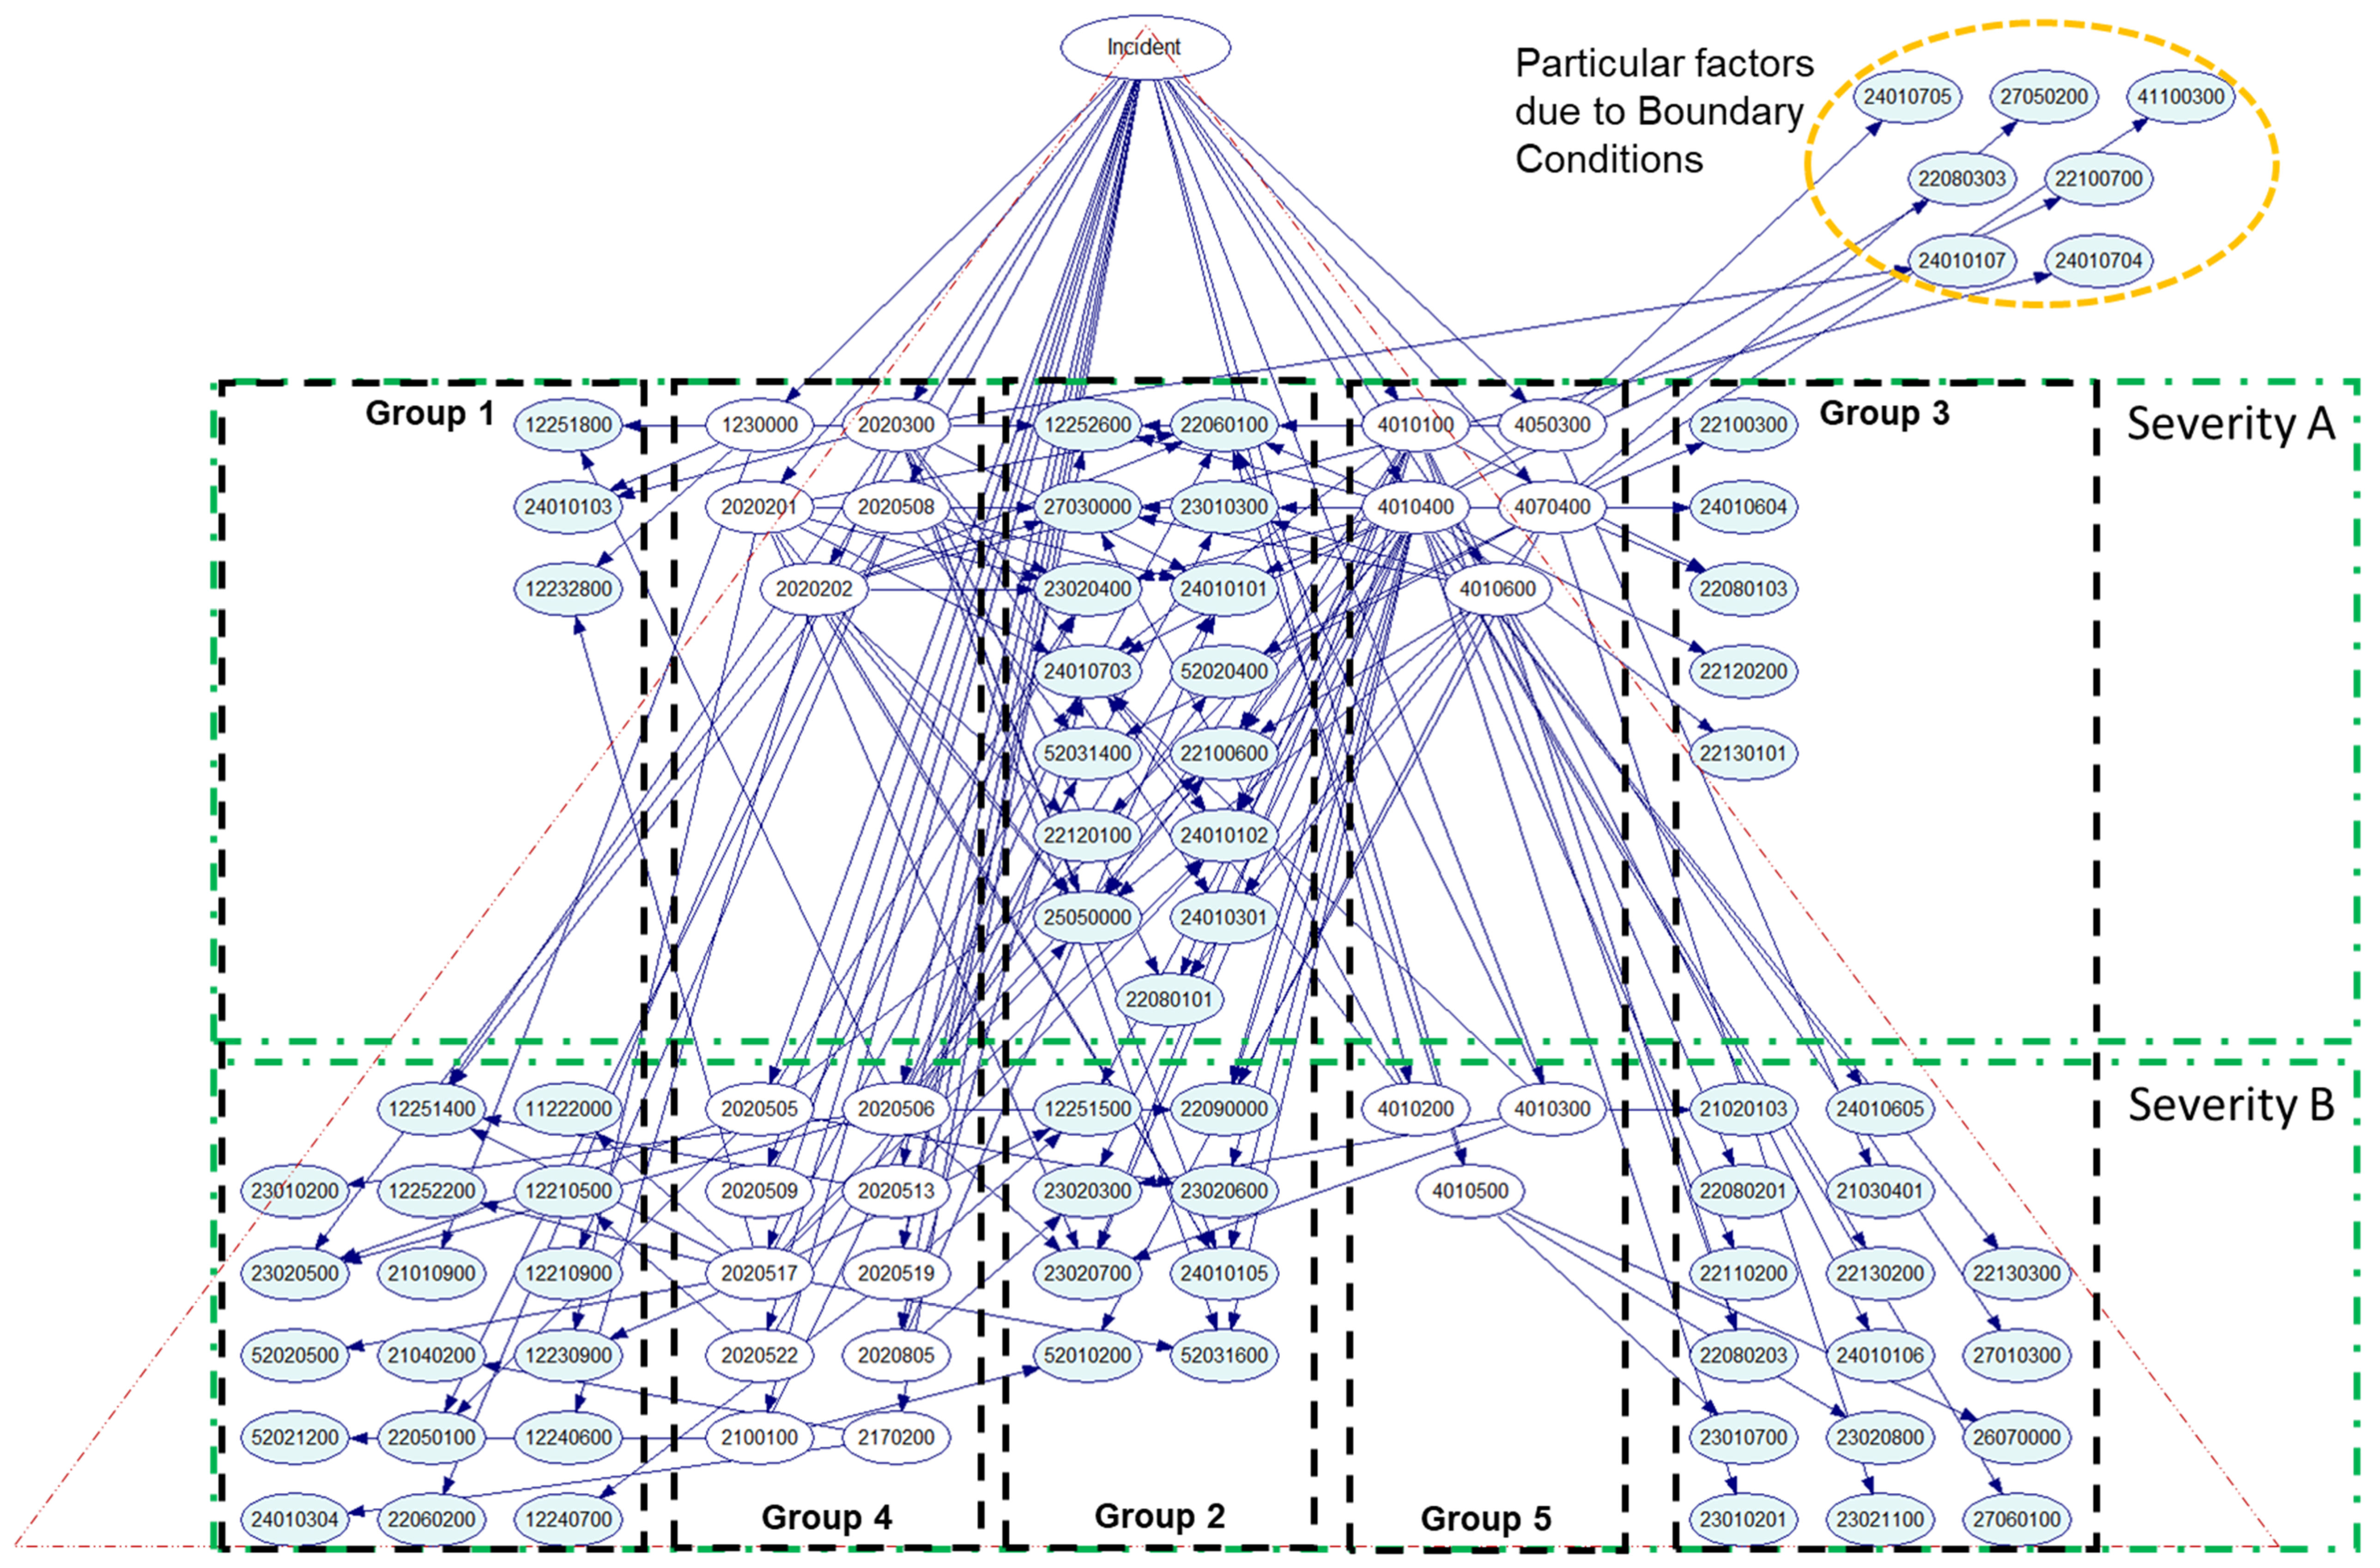
Figure 2 illustrates the proposed BN model in this research work. The model is a transformation from the result published in [14] with Heinrich’s pyramid theory in consideration (step 5). The CPT of correlation between factors and events is the same as published in [14] and summarized in Appendix A. In addition, accident/incident data reporting (ADREP) codifications of events and descriptive factors implicated in this research work are listed in Appendix B.
Figure 2.
Heinrich’s pyramid Bayesian Network (BN) model for loss of separation (LOS) serious and major incidents in commercial aviation.
Events and factors have been divided into five groups within this BN model:
- Group 1, children nodes on the air side, group of DFs related to A/C or flight crew.
- Group 2, children nodes of connection, group of DFs related to A/C or flight crew—ATM.
- Group 3, children nodes on the ground side, groups of DFs related to ATM.
- Group 4, parent nodes on the air side, group of events related to A/C or flight crew.
- Group 5, parent nodes on the ground side, group of events related to ATM.
The difference with respect to results represented in [14] is that, after considering Heinrich’s pyramid theory, events and factors can be organized and presented in such manner that they are associated with different levels of severity. In other words, with Figure 2, events and factors in severity A level are common to both incident severities. Meanwhile, events and factors in severity B level are singular from major incidents.
From the BN model, the likelihood of each factor is used to estimate its mutual information. Applying Equation (1), we obtain two matrices of mutual information of LOS incidents with severity A and B, and (step 6) and the sum of their components in each matrix is the mutual information for a particular DF in our validated BN model, and . Applying Equation to both matrices: (step 7). Then the convolution matrix of each DF is calculated and shown in Table 3 (step 8).
Table 3.
Mutual information matrix for incidents of severity A and B.
Moreover, the sum of its components, , is the mutual information of each DF in both severity A and B (I_A∩B).
As a result, we have three vectors of mutual information for all DFs contributed in the validated BN model: , and . For facilitating the analysis, each vector is normalized with respect to the sum of all its components.
Regarding the estimated mutual information that measures the participation of common factors in both categories of incidents, the factors can be identified within the following three groups (step 9):
Group 9.1. As shown in Figure 3, all factors have I_A∩B = 0. It means that no mutual information is shared between both severities by the same factor, and these kinds of factors with such characteristics are listed in Table A5 of Appendix C and belong to one category of incidents only. According to Heinrich’s pyramid theory, these kinds of factors should be specific to incidents with low severity level, i.e., severity B in this case.
Figure 3.
Descriptive factors (DFs) with I_A∩B = 0.
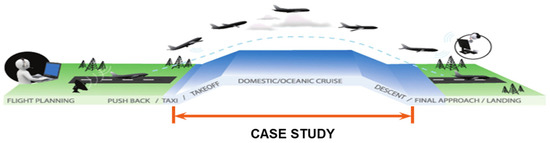
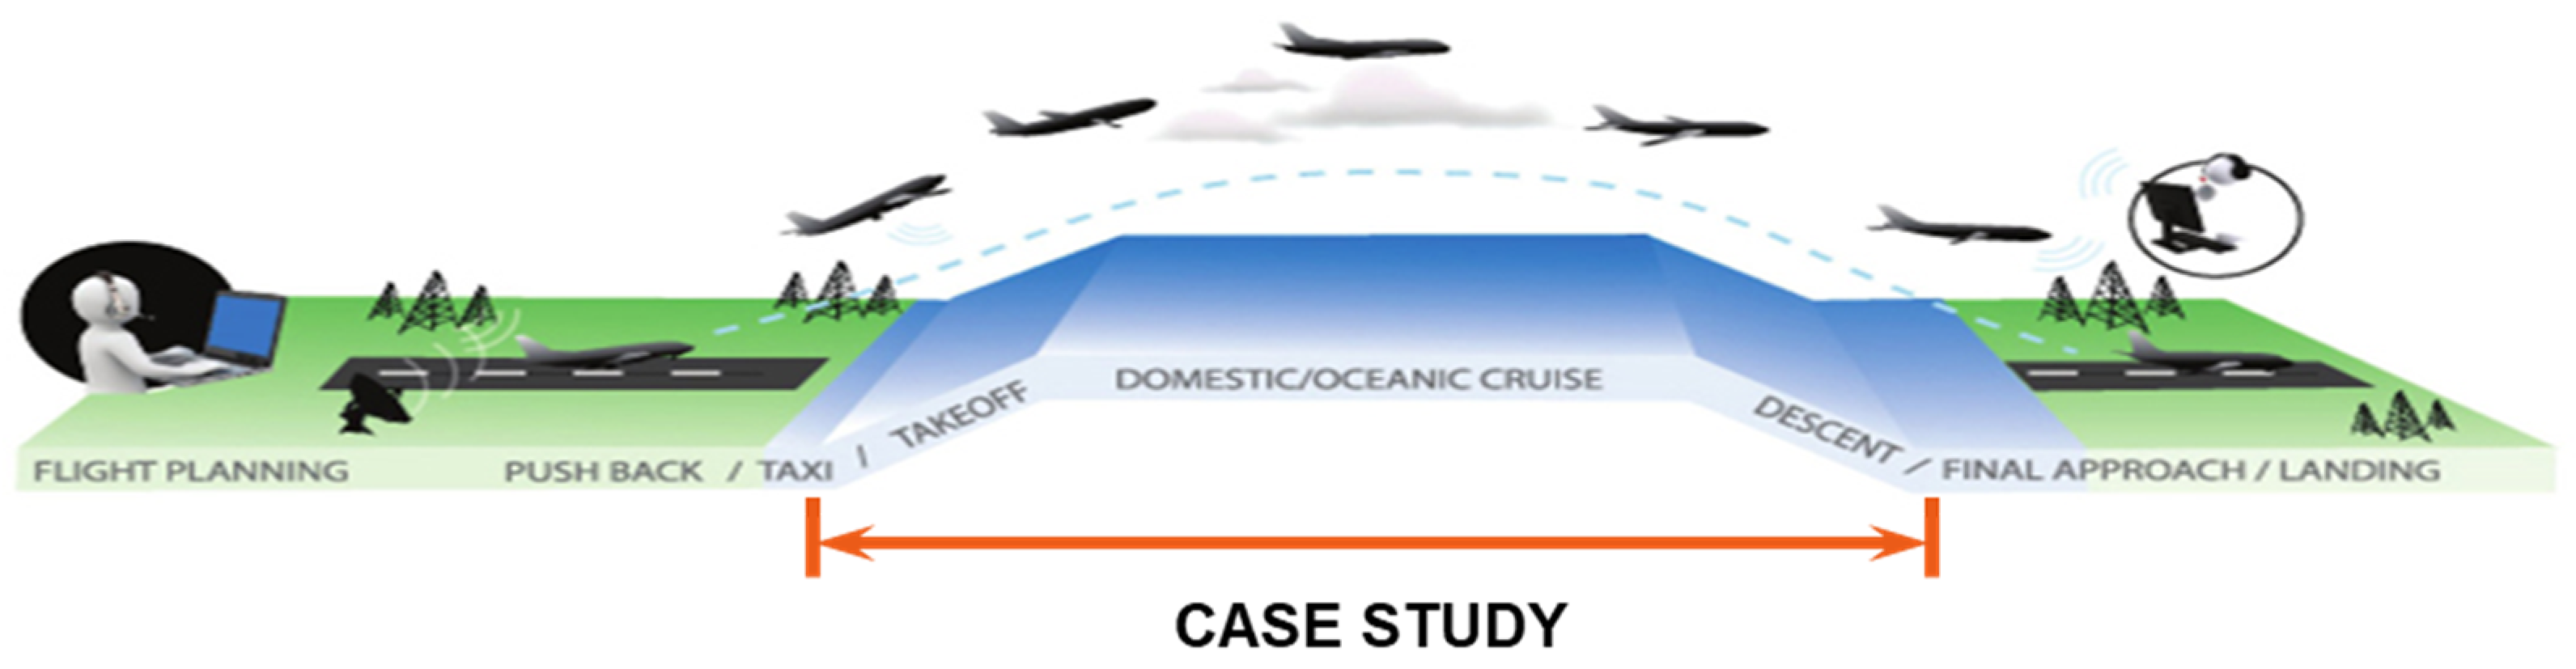
However, there are ones listed in Table A6 that belong to incidents of severity A, the high severity level. This singularity exists when the study is limited by the established boundary conditions for our case study:
- Incident severity: serious and major incidents are considered;
- Incident category: LOS or separation minima infringement (SMI);
- Type of flight: limited only to commercial aircraft involved in the incident scenario;
- Operating phase: none of the involved aircraft were operating at the final approach phase or before achieving the second segment of the take-off, as indicated in Figure 4.
Figure 4.
Boundary conditions of the case study.
If these boundary conditions are removed, i.e., extending cases studies considering other types of flight like incidents occurred between military and civil aircraft, these factors would be present in incidents of severity B, lower level of severity, regarding Heinrich’s Pyramid Theory.
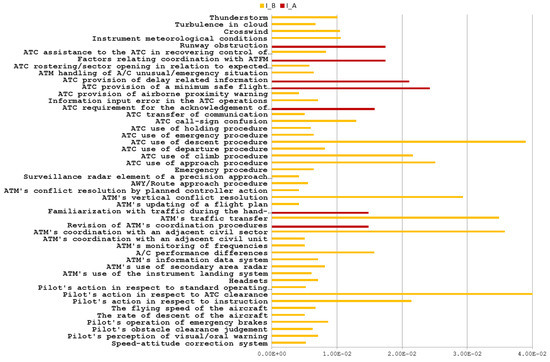
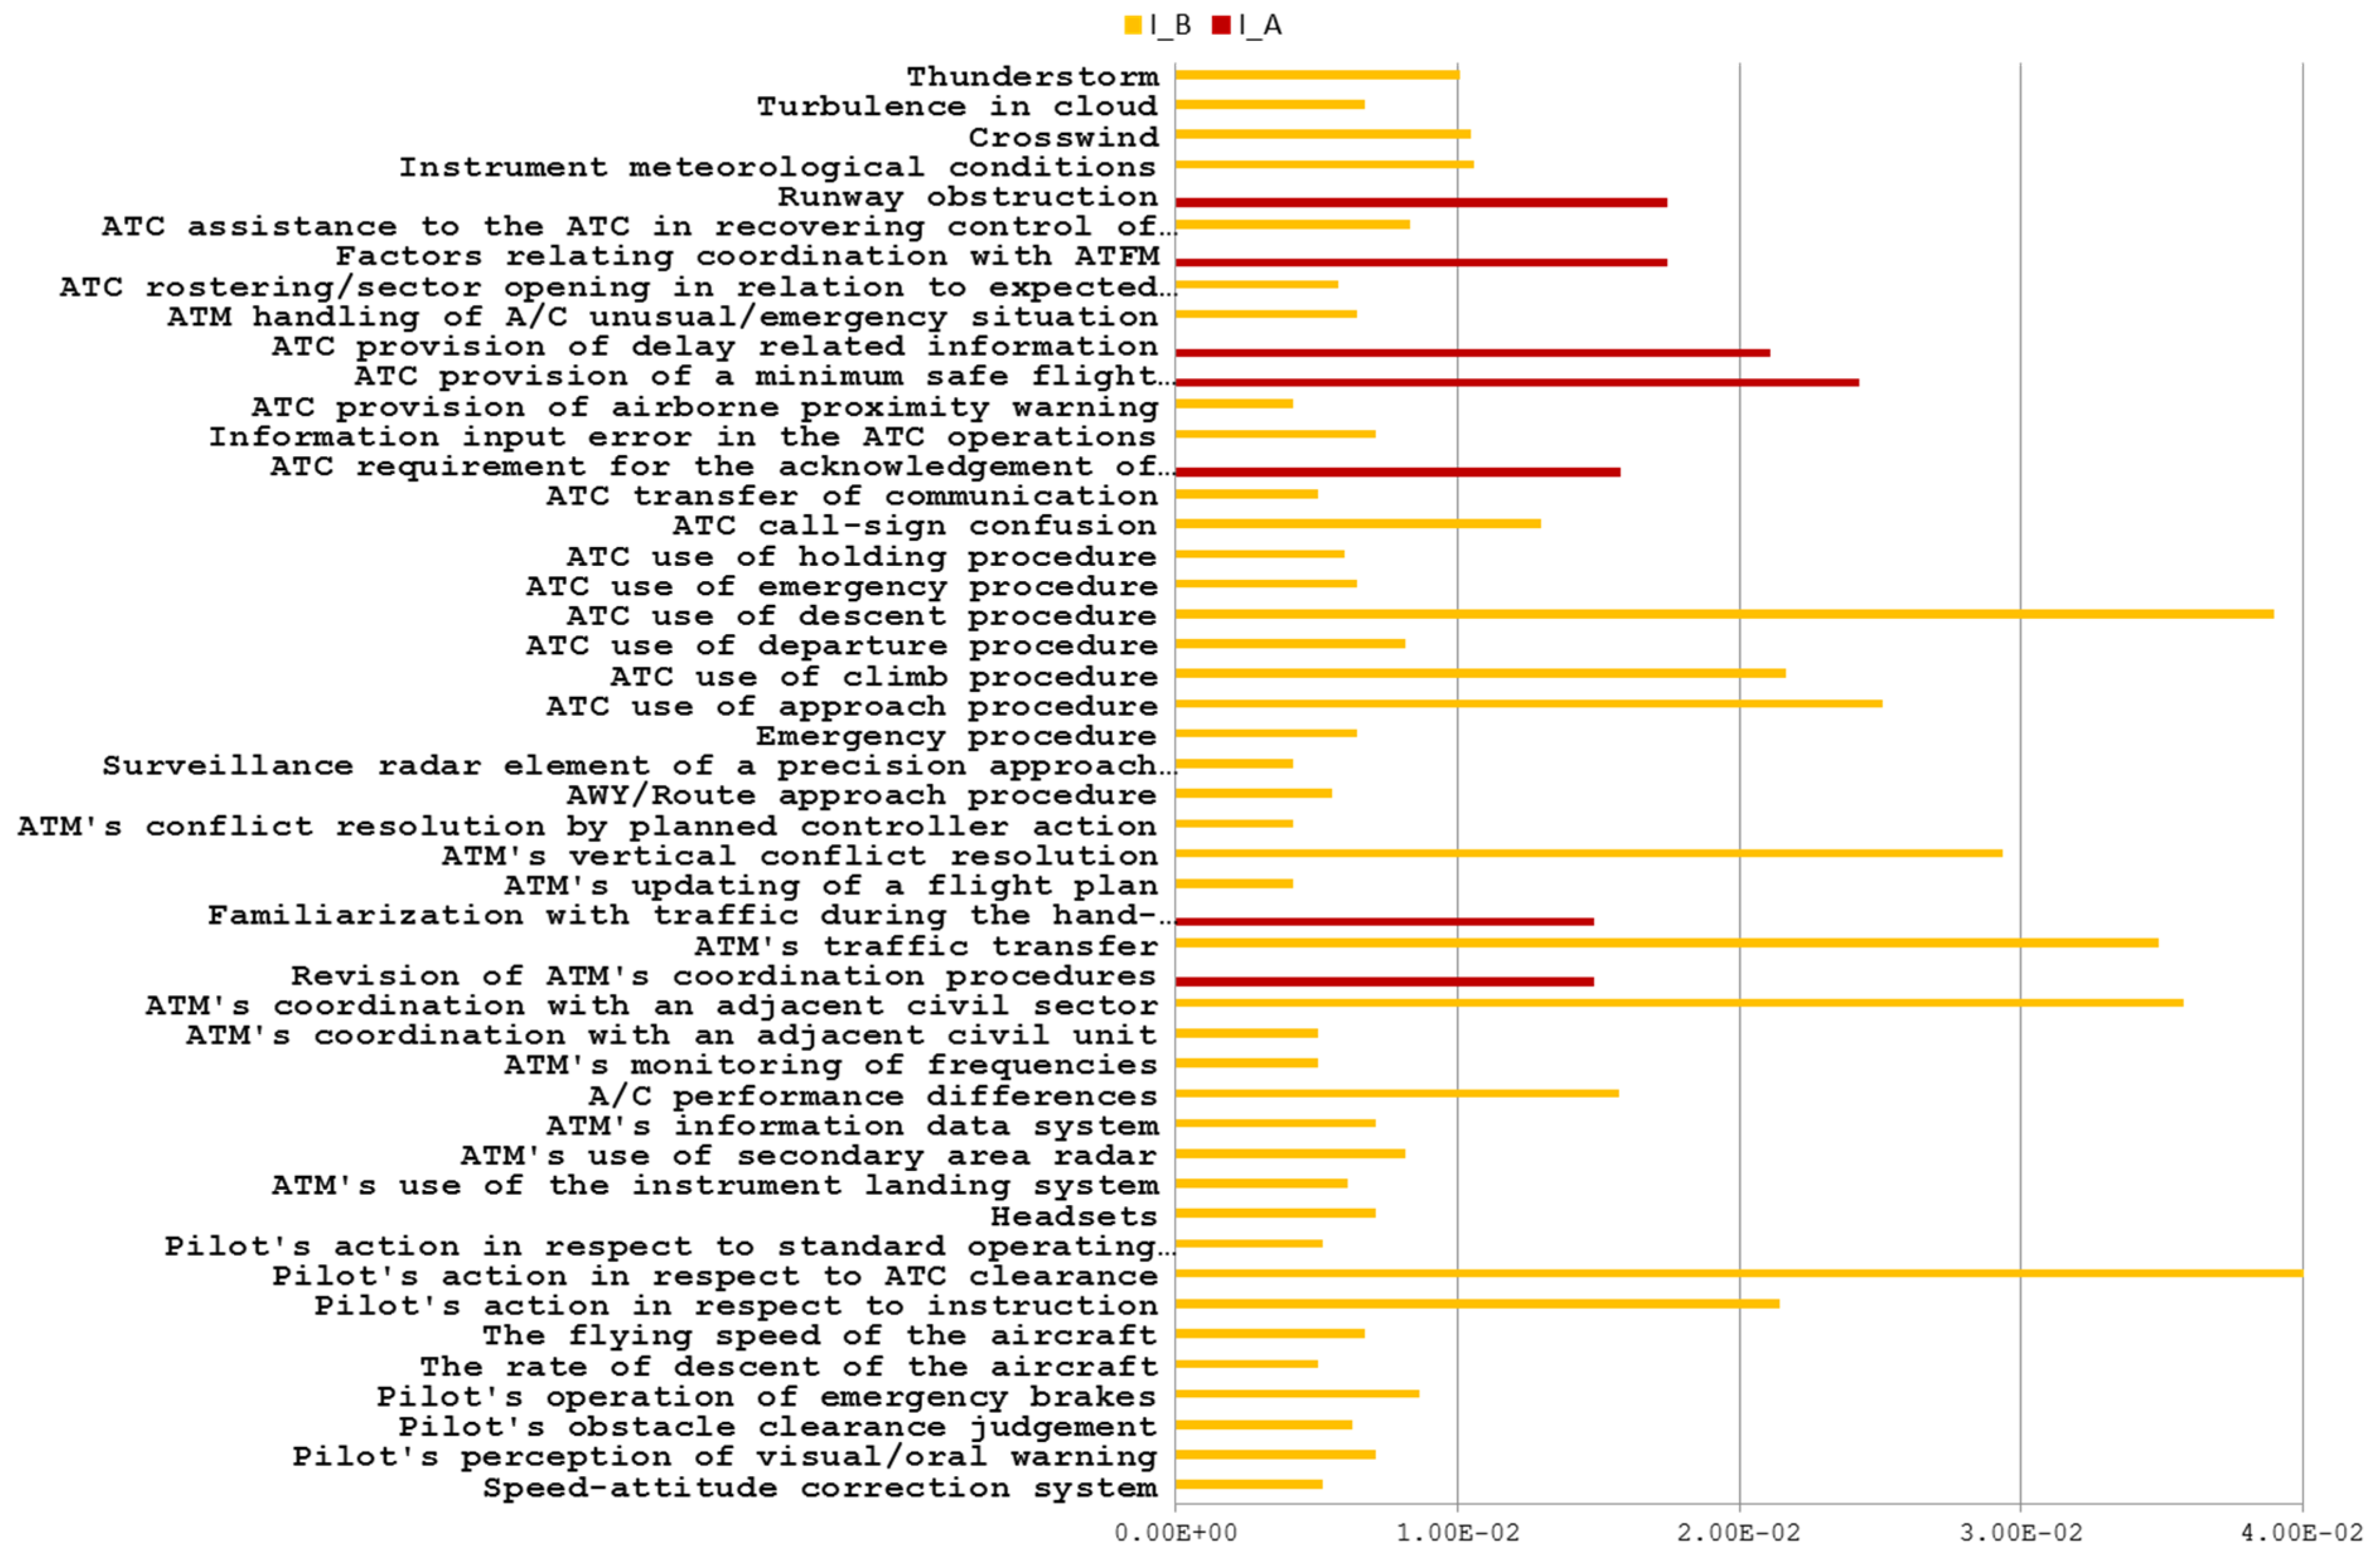
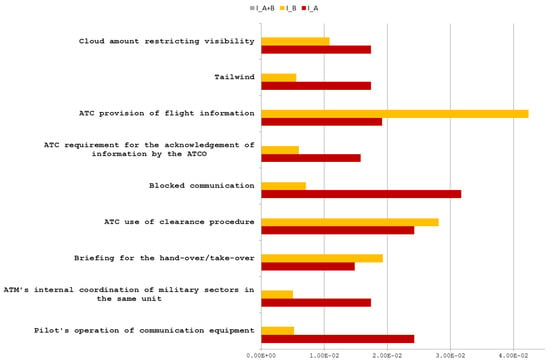
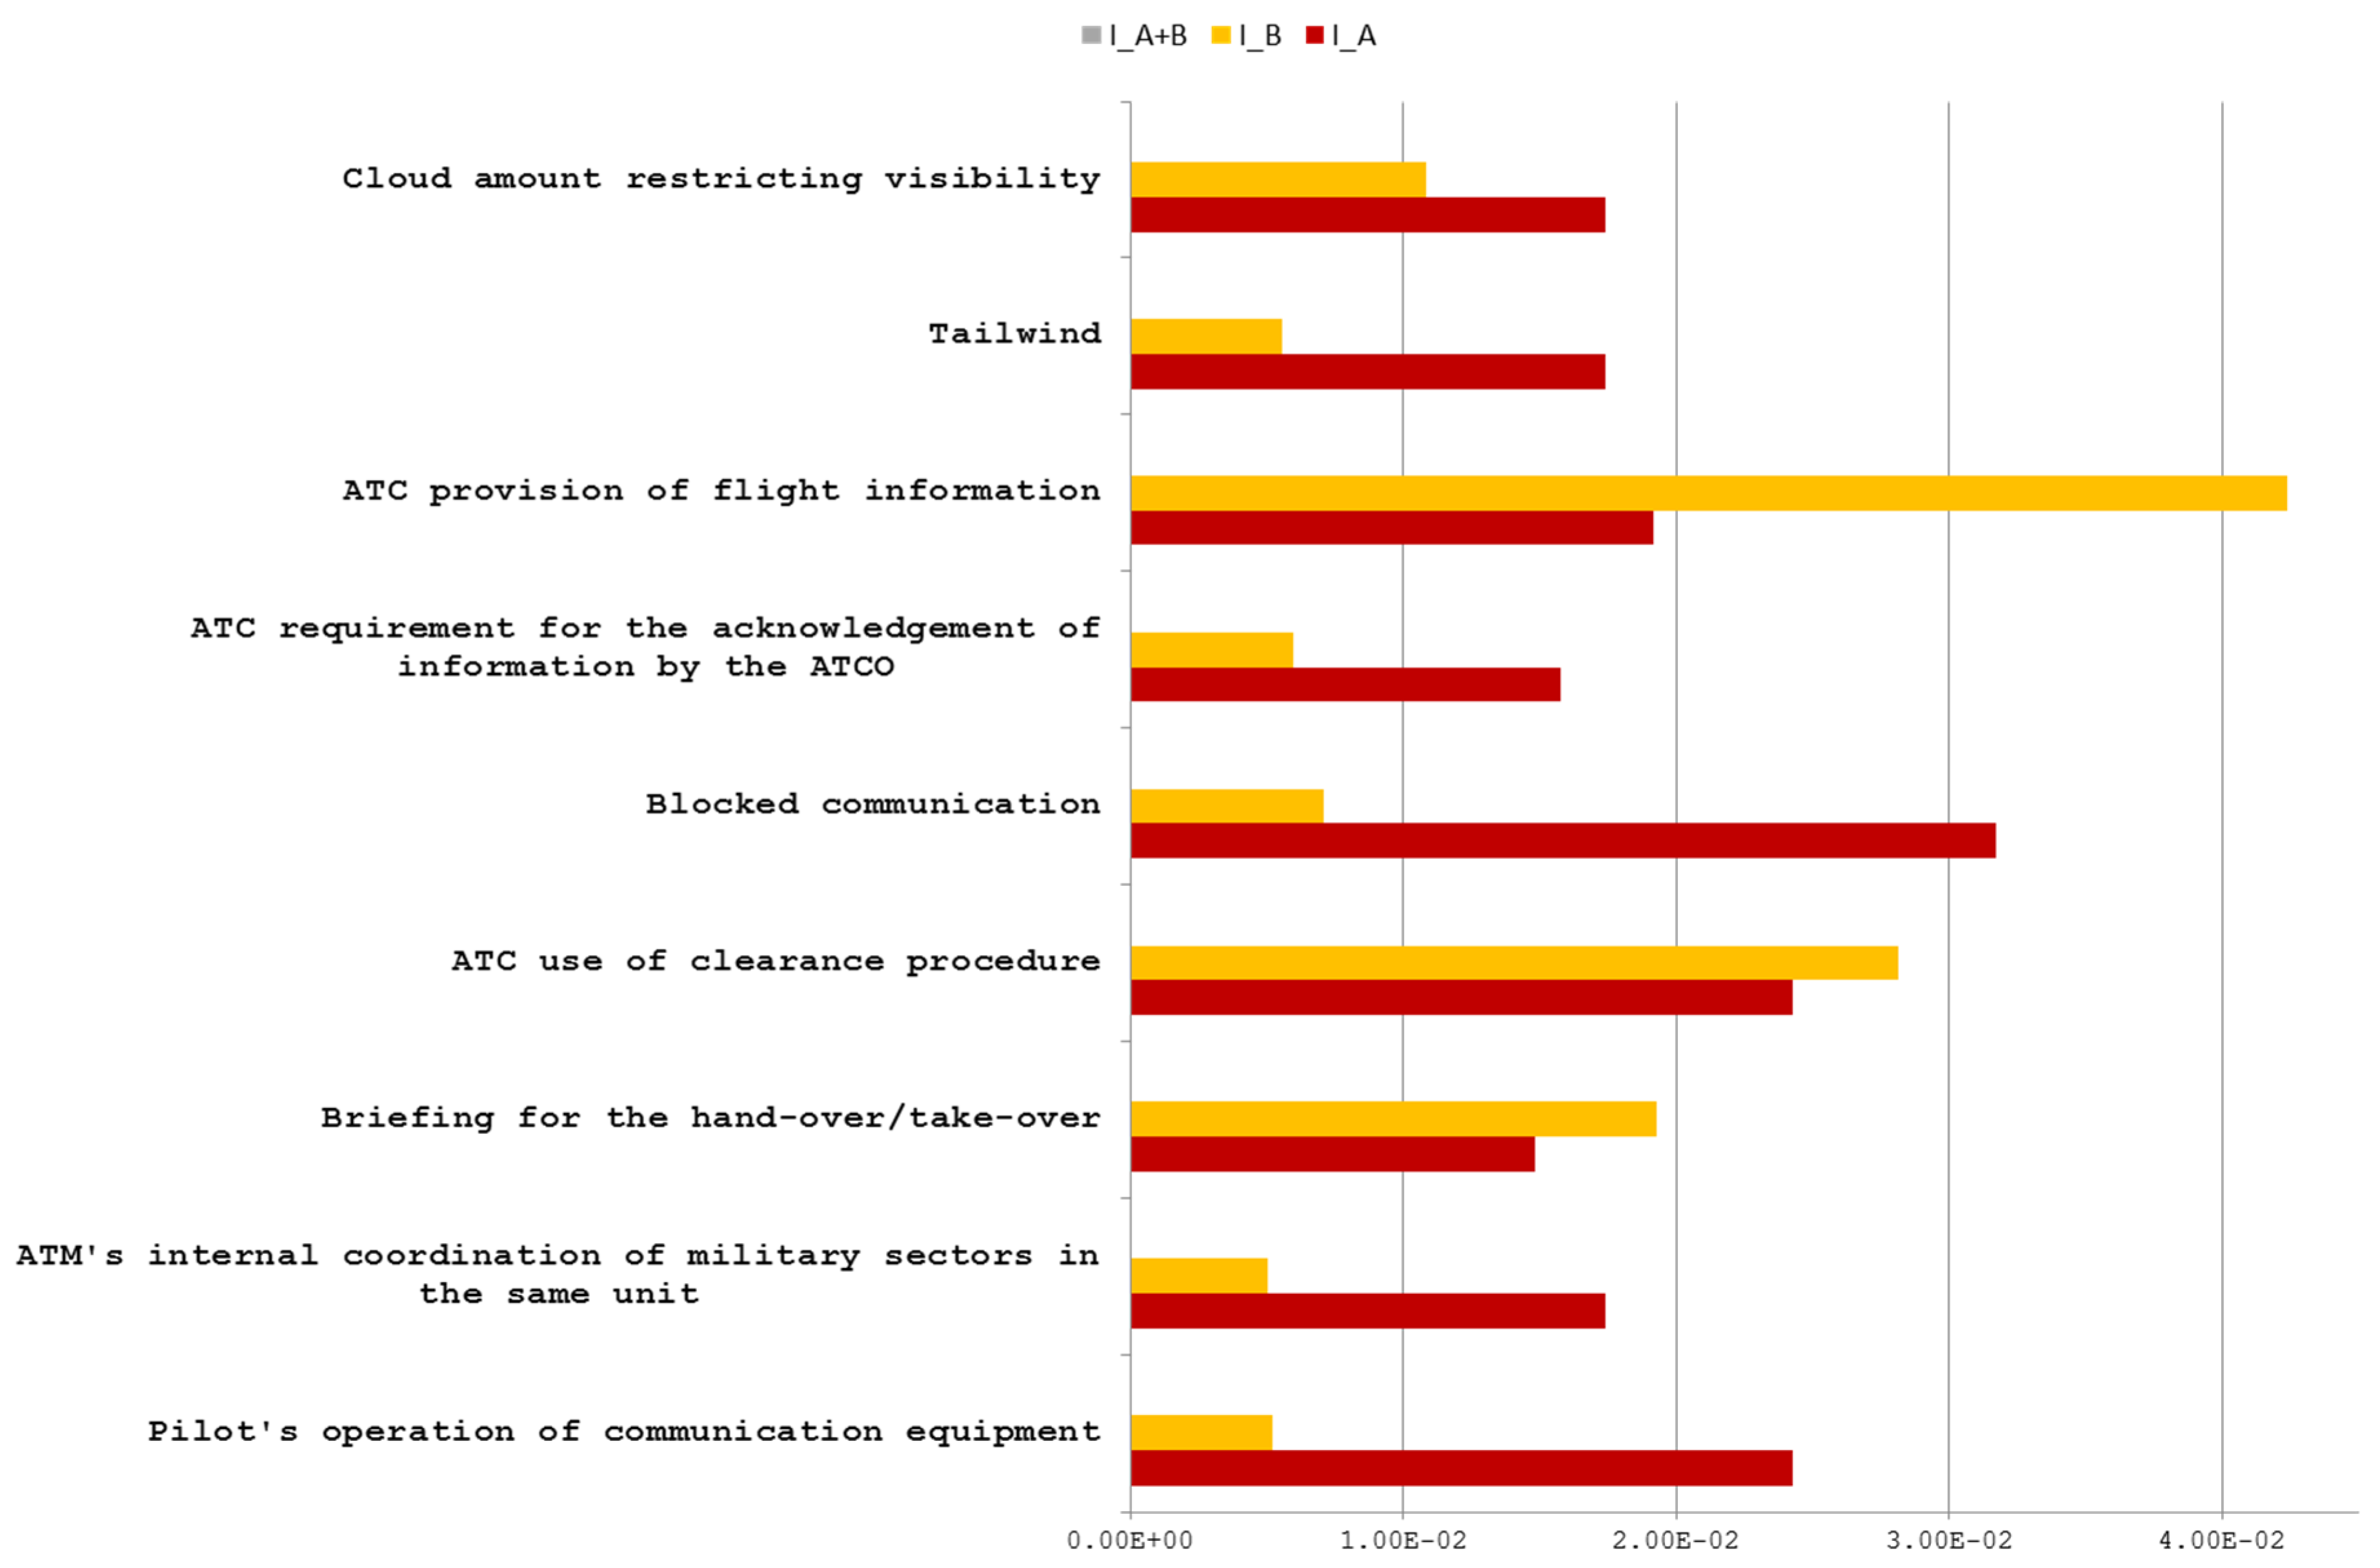
Group 9.2. As shown in Figure 5, all factors listed in Table A7 have I_A∩B → 0. The mutual information shared by factors within all incidents of severity A and B are close to zero. It means that these factors provide a weak connection to both severity levels.
Figure 5.
DFs with 1 × 10⁻¹⁰ < I_A∩B < 1 × 10⁻³(I → 0).
According to the property of Kullback-Leibler divergence (KLD) [26,27], these factors contribute to both severities separately. In other words, they are in present either in severity A incidents or in severity B incidents. This result, checked together with the BN model, shows that all factors are linked to two independent joints of events, such that each joint belongs to one specific category of incidents without intersection with others. For example, if the factor ‘24010103 Blocked communication’ is in the present state, then events ‘2020300 Communication between pilot and ANS’ and ‘1230000 Communication systems’ could be affected. However, the event ‘2020300 Communication between pilot and ANS belongs to severity A incidents, meanwhile the event ‘1230000 Communication systems’ belongs to severity B incidents only.
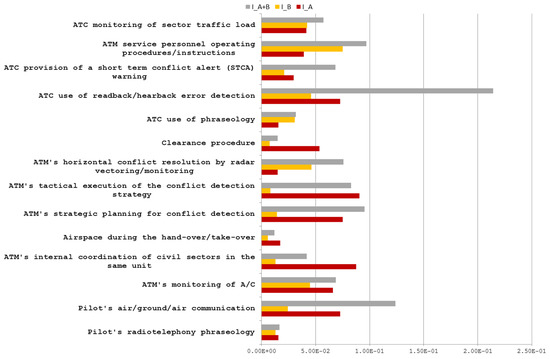
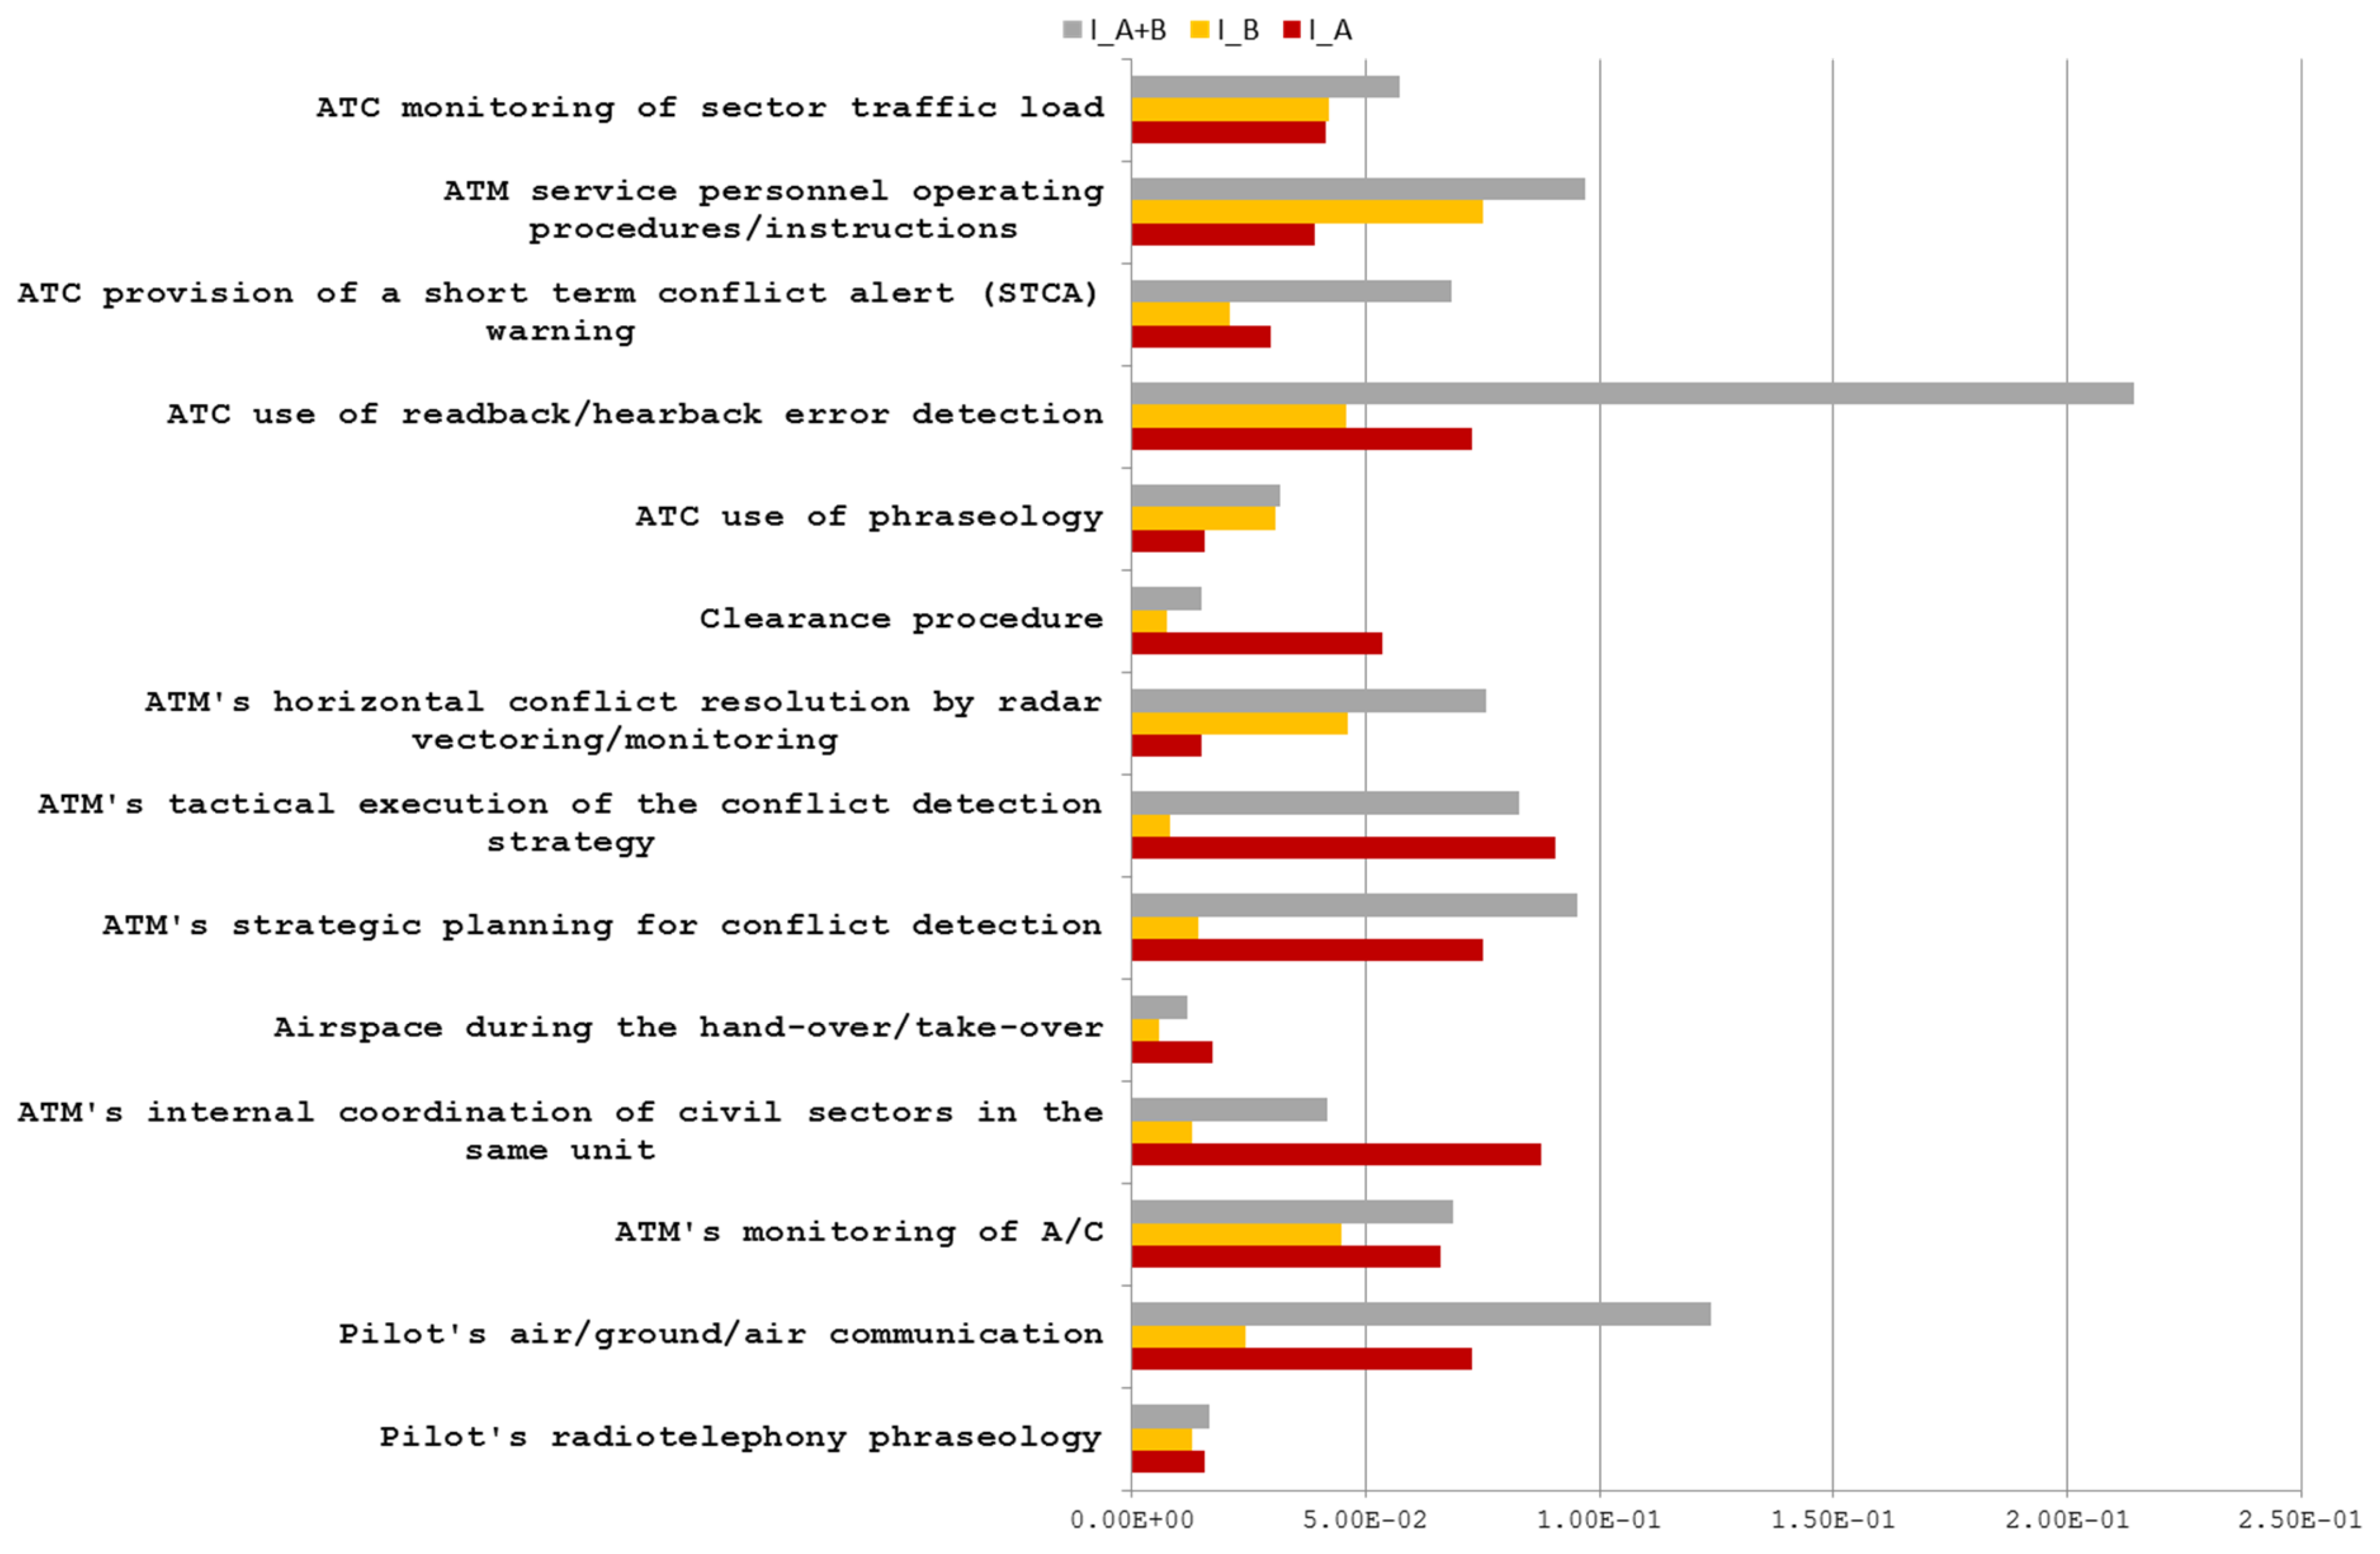
Group 9.3. As shown in Figure 6 all factors listed in Table A8 contribute to both categories of incidents through common events.
Figure 6.
DFs with I_A∩B > 1 × 10⁻³.
These events leading to either of the two incident categories are manifested, whilst the factors are in the present state. For example, when the factor ‘24010102 ATC use of readback/hearback error detection’ is in the present state, then the events in Table 4 could be affected. Moreover, the mutual information of this factor is higher than others due to its stronger connection to both severities through the event ‘2020300 Communication between pilot and ANS’.
Table 4.
Associated events in severity A and B when DF 24010102 is in the present state.
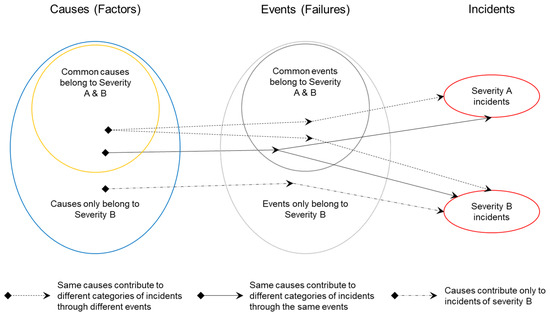
In summary, contribution paths of causes to incidents are performed through events in three paths as indicated in Figure 7:
Figure 7.
Contribution path of causes to incidents.
- i.
- Causes only belong to severity B incidents contribute exclusively to this category of incidents, then the mutual information of both categories of incidents is zero (I_A∩B = 0);
- ii.
- Common causes belong to incidents of severity A and B can contribute to each category of incidents through the same mechanisms or events. In this case, the mutual information of both categories of incidents is different to zero (I_A∩B ≠ 0);
- iii.
- Common causes belong to incidents of severity A and B and contribute to different categories of incidents through different mechanisms or events. In this case, the mutual information of both categories of incidents tends to zero (I_A∩B → 0).
5. ANN Model Proposal from the Analysis Result
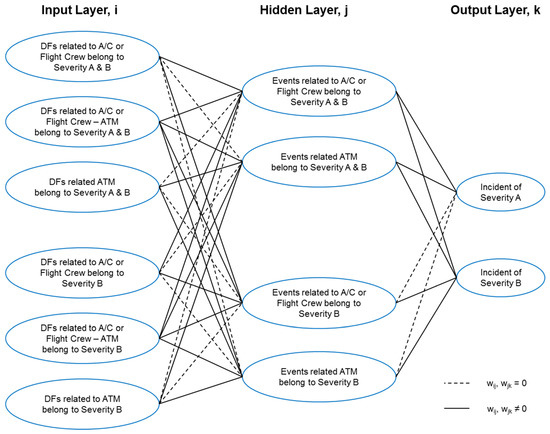
In addition, based on the analysis results and this reorganization of the BN model, connections between different groups of events and factors provide other interpretations with a tendency to possible applications of neuronal networks. As indicated in Figure 8, this simple multilayer Perceptrons (MLP) neuronal network consists of three layers:
Figure 8.
Convolutional neuronal network.
- Input layer, i: shaped by classified groups of factors (xi);
- Hidden layer, j: performed by events groups (yj);
- Output layer, k: provided by results of incident prediction (Ok).
Therefore, the general MLP equation for each layer can be formulated as follows:
Equation (3):
Equation (4):
Equation (5):
In Equation (4) and Equation (5), wij and wjk are weight parameters after the convolution for estimated mutual information, depending on the participation of the DF in different incident categories, i.e., if one DF belongs to severity A incident only, then the wij for events of severity B incidents are null (wij = 0); meanwhile xi (input layer) is the estimated likelihood of each DF in the BN model, yj (hidden layer) and Ok (output layer) correspond to the mutual information in the function of xi. Note that bi and bj are bias for additional weight adjustments in neuronal networks.
The method of applying Bayesian network to neuronal networks training became popular, researchers like Huang et al. [28] applied this method for foreign exchange rates forecasting, Abdulhai et al. [29] used it for freeway incident detection and Gupta and Schumann [30] implemented it for improving flight control system.
Unlike other researchers that have used Bayesian network as a data filter for neuronal network training, through this analysis we attempt to show a possible construction of a Bayesian-driven neuronal network model. In this manner, we could have a neural network with its hidden layer controlled. When a factor is located in a possible occurrence, we would know with which event group this factor would be associated and to which incident category it would be contributed.
6. Conclusions
In this analysis, Heinrich’s Pyramid Theory has been considered as the main approach that allowed the detection of common factors within different levels of severity as well as their relationship. According to this theory, causes detected at high levels of severity are always found at low levels; therefore, these causes are identified as concatenated factors, which contribute to incidents through their pertinent events.
Moreover, we have explored this theory in depth through the analysis of mutual information between both severity levels, and introduced it in refining the contribution of factors to different categories of incidents.
For deepening the analysis, we have selected all LOS incidents of severity A and B that occurred in the Spanish airspace during four consecutive years. The selection of these two joints of incidents has been specified by defined boundary conditions. The equation of convolution for discrete sets is applied in estimating qualitatively the mutual information between these incident joints, and hence the behaviour of factors and their modes of contribution within incidents depending on values of mutual information.
6.1. Benefits of the Application
The application of this methodology illustrates how the simple application of the convolution operator to Heinrich’s pyramid theory makes clearer the contribution of causes in incidents occurred due to operational failures. The added value of this technique allows us to detect contributing paths of causes leading to incidents.
Additionally, with the filtration of mutual information calculated within different incident severities, the correlation between causes, failures and incident categories are identified more clearly. We can observe that some common factors (causes) provide common events (failures) and belong to both incident severities. However, from these events, different paths have been separated into two categories of incidents, i.e., with determinate factors, some events only contribute to severity A or B incidents and others contribute to both categories of incidents. In other words, the same causes detected in different categories of incidents can provide different streams through various failures. Consequently, although we know the causes of operational failures, one solution focused on avoiding the failures does not prevent incidents occurring. Indeed, this conclusion could guide us to reassess the design of barriers in avoiding the recurrence of causes.
6.2. Limitations of the Application
The proposed methodology presents limitations as follows:
- Computational limitation: Although one neuronal network model based on the BN approach can be proposed, the number of cases for network learning is limited due to serious and major incidents occurring rarely.
- Data limitation: Causes and failures of serious and major incidents are known only from incident reports, or their frequencies of occurrence are partially known. Therefore, data related to their contributions to non-incident operations or incidents with less severity, i.e., minor incidents (severity C), are missed and, consequently, the accuracy of the information theory approach is compromised due to data limitations.
- BN model limitation: the model requires continuous updating of data to provide a higher level of reliability and reduce the degree of uncertainty.
6.3. Future Work
- The proposed Bayesian-driven neuronal network model is limited to a conceptual design currently. Thus, more cases of serious and major incidents should be analysed and used for model learning.
- Regarding the computational limitation, minor incidents could be considered to complete the correlation between causes and failures. It might be interesting to check the behaviour of already established contribution paths with this new severity level in consideration.
Author Contributions
Conceptualization, S.Z.Y.L.C., R.M.A.V. and V.F.G.C.; Formal analysis, S.Z.Y.L.C. and R.M.A.V.; Funding acquisition, V.F.G.C.; Investigation, S.Z.Y.L.C.; Methodology, S.Z.Y.L.C. and R.M.A.V.; Project administration, R.M.A.V., V.F.G.C. and F.J.S.N.; Resources, V.F.G.C.; Supervision F.J.S.N.; Validation, V.F.G.C.; Writing—original draft, S.Z.Y.L.C.; Writing—review & editing, R.M.A.V.
Funding
This research received no external funding.
Conflicts of Interest
The authors declare no conflict of interest.
Abbreviations
| ABBREVIATION | DEFINITION |
| A/C | Aircraft |
| ADREP | Accident/Incident Data Reporting |
| ANS | Air Navigation Service |
| ATC | Air Traffic Control |
| ATCO | Air Traffic Control Officer |
| ATM | Air Traffic Management |
| BN | Bayesian Network |
| CPT | Conditional Probability Table |
| DF | Descriptive Factor |
| EF | Explanatory Factor |
| ICAO | International Civil Aviation Organization |
| KLD | Kullback-Leibler divergence |
| LOS | Loss of Separation |
| MLP | Multilayer Perceptrons |
| SCM | Swiss Chess Method |
| SMI | Separation Minima Infringement |
| STCA | Short Term Conflict Alert |
Appendix A. CPT of Events and Factors for BN Modelling
Table A1.
CPT of events and descriptive factors under scenario of LOS in commercial aviation—Severity A.
Table A2.
CPT of Events and Descriptive Factors under Scenario of LOS in Commercial Aviation—Severity B.
Appendix B. ADREP Taxonomy Code of Events and Descriptive Factors
Table A3.
ADREP taxonomy code of events.
Table A4.
ADREP taxonomy code of descriptive factors.
Appendix C. Groups of Descriptive Factors Associated to the Result of Mutual Information I_A∩B
Table A5.
Associated DFs of severity B with I_A∩B = 0.
Table A6.
Associated DFs of severity A with I_A∩B = 0.
Table A7.
Associated DFs of severity A and B with I_AB → 0.
Table A8.
Associated DFs of severity A and B with I > 0.
References
- Reason, J. Human Error, 20th ed.; Cambridge University Press: Cambridge, UK, 1990. [Google Scholar]
- Heinrich, H.W. Industrial Accident Prevention: A Scientific Approach; McGraw-Hill: New York, NY, USA, 1931. [Google Scholar]
- Heinrich, H.W.; Roos, N.R.; Petersen, D.C. Industrial Accident Prevention: A Safety Management Approach; McGraw-Hill: New York, NY, USA, 1980. [Google Scholar]
- Johnson, A. Examining the foundation. In Proceedings of the National Safety Council Congress & Expo, Houston, TX, USA, 20–26 October 2018. [Google Scholar]
- Sultana, S.; Andersen, B.S.; Haugen, S. Identifying safety indicators for safety performance measurement using a system engineering approach. Process Saf. Environ. Prot. 2019, 128, 107–120. [Google Scholar] [CrossRef] [Scilit]
- Kyriakidis, M.; Hirsch, R.; Majumdar, A. Metro railway safety: An analysis of accident precursors. Saf. Sci. 2012, 50, 1535–1548. [Google Scholar] [CrossRef] [Scilit]
- Golovina, O.; Perschewski, M.; Teizer, J.; König, M. Algorithm for quantitative analysis of close call events and personalized feedback in construction safety. Autom. Constr. 2019, 99, 206–222. [Google Scholar] [CrossRef] [Scilit]
- Marshall, P.; Hirmas, A.; Singer, M. Heinrich’s pyramid and occupational safety: A statistical validation methodology. Saf. Sci. 2018, 101, 180–189. [Google Scholar] [CrossRef] [Scilit]
- Prem, K.P.; Ng, D.; Mannan, M.S. Harnessing database resources for understanding the profile of chemical process industry incidents. J. Loss Prev. Process Ind. 2010, 23, 549–560. [Google Scholar] [CrossRef] [Scilit]
- Walker, G. Redefining the incidents to learn from: Safety science insights acquired on the journey from black boxes to Flight Data Monitoring. Saf. Sci. 2017, 99, 14–22. [Google Scholar] [CrossRef] [Scilit]
- Majumdar, A.; Dupuy, M.D.; Ochieng, W.Y.; Nalder, P. Developing Safety Indicators for New Zealand Airspace: Analysis of Loss-of-Separation Incidents. Transp. Res. Rec. J. Transp. Res. Board 2006, 1951, 86–97. [Google Scholar] [CrossRef]
- Nazeri, Z.; Donohue, G.; Sherry, L. Analyzing Relationships Between Aircraft Accidents and Incidents. In Proceedings of the International Conference on Research in Air Transportation (ICRAT 2008), Fairfax, WV, USA, 1–4 June 2008. [Google Scholar]
- Arnaldo Valdés, R.M.; Liang Cheng, S.Z.; Gómez Comendador, V.F.; Sáez Nieto, F.J. Application of Bayesian Networks and Information Theory to Estimate the Occurrence of Mid-Air Collisions Based on Accident Precursors. Entropy 2018, 20, 969. [Google Scholar] [CrossRef] [Scilit]
- Liang Cheng, S.Z.; Arnaldo Valdés, R.M.; Gómez Comendador, V.F.; Román Cordón, R. Analysis of accident precursor data for Mid Air Collision occurrences using expert build Bayesian Network model and Information Theory. In Proceedings of the 8th European Conference for Aeronautics and Space Sciences (Eucass), Madrid, Spain, 1–4 July 2019. [Google Scholar]
- Kim, N.K.; Jeon, K.M.; Kim, H.K. Convolutional Recurrent Neural Network-Based Event Detection in Tunnels Using Multiple Microphones. Sensors 2019, 19, 2695. [Google Scholar] [CrossRef] [Scilit] [PubMed]
- Nan, K.; Liu, S.; Du, J.; Liu, H. Deep model compression for mobile platforms: A survey. Tsinghua Sci. Technol. 2019, 24, 677–693. [Google Scholar] [CrossRef] [Scilit]
- ICAO. International Standards and Recommended Practices Annex 11 to the Convention on International Civil Aviation Air Traffic Services; ICAO: Montreal, QC, Canada, 2016. [Google Scholar]
- European Union. Regulation (EU) No 376/2014 of the European Parliament and of the Council of 3 April 2014; European Union: Brussels, Belgium, 2014. [Google Scholar]
- Ceanita. Informes Definitivos. Available online: https://www.seguridadaerea.gob.es/lang_castellano/g_r_seguridad/ceanita/informes_definitivos/default.aspx (accessed on 27 November 2019).
- Licu, T.; Cioran, F.; Hayward, B.; Lowe, A. EUROCONTROL—Systemic Occurrence Analysis Methodology (SOAM)—A ‘Reason’-based organisational methodology for analysing incidents and accidents. Reliab. Eng. Syst. Saf. 2007, 92, 1162–1169. [Google Scholar] [CrossRef] [Scilit]
- Eurocontrol. EAM 2/GUI 8—Guidelines on the Systemic Occurrence Analysis Methodology (SOAM); Eurocontrol: Brussels, Belgium, 2005. [Google Scholar]
- Liang Cheng, S.Z.; Arnaldo Valdés, R.M.; Gómez Comendador, V.F.; Sáez Nieto, F.J. A Case Study of Fishbone Sequential Diagram Application and ADREP Taxonomy Codification in Conventional ATM Incident Investigation. Symmetry 2019, 11, 491. [Google Scholar] [CrossRef] [Scilit]
- Ferrante, O.; Jouniaux, P.; Loo, T.; Nicolas, G.; Cabon, P.; Mollard, R. Application of ADREP 2000 taxonomy for the analysis and the encoding of aviation accidents and incidents: A human factors approach. Hum. Factors Aerosp. Saf. 2004, 4, 19–48. [Google Scholar]
- Nadkarni, S.; Shenoy, P.P. A causal mapping approach to constructing Bayesian networks. Decis. Support Syst. 2004, 38, 259–281. [Google Scholar] [CrossRef] [Scilit]
- Damelin, S.B.; Miller, W. The Mathematics of Signal Processing; Cambridge University Press: Cambridge, UK, 2011. [Google Scholar]
- Hu, X.; Zhang, H.; Ma, D.; Wang, R. Status detection from spatial-temporal data in pipeline network using data transformation convolutional neural network. Neurocomputing 2019, 358, 401–413. [Google Scholar] [CrossRef] [Scilit]
- Nguyen, H.D.; McLachlan, G. On approximations via convolution-defined mixture models. Commun. Stat. Theory Methods 2019, 48, 3945–3955. [Google Scholar] [CrossRef] [Scilit]
- Huang, W.; Lai, K.K.; Zhang, J.; Bao, Y. Foreign Exchange Rates Forecasting with Multilayer Perceptrons Neural Network by Bayesian Learning. In Proceedings of the 2008 Fourth International Conference on Natural Computation, Jinan, China, 18–20 October 2008. [Google Scholar]
- Abdulhai, B.; Ritchie, S.G. Enhancing the universality and transferability of freeway incident detection using a Bayesian-based neural network. Transp. Res. Part C Emerg. Technol. 1999, 7, 261–280. [Google Scholar] [CrossRef] [Scilit]
- Gupta, P.; Schumann, J. A tool for verification and validation of neural network based adaptive controllers for high assurance systems. In Proceedings of the Eighth IEEE International Symposium on High Assurance Systems Engineering, Tampa, FL, USA, 25–26 March 2004. [Google Scholar]

© 2019 by the authors. Licensee MDPI, Basel, Switzerland. This article is an open access article distributed under the terms and conditions of the Creative Commons Attribution (CC BY) license (http://creativecommons.org/licenses/by/4.0/).