1. Introduction
Owing to the global environmental concerns and energy crisis, applications of renewable energy, for instance, wind/solar energy, merit high attention [
1,
2,
3]. Whereas the artificial refrigerants show significantly high define (GWP) and define (ODP), recently the environmentally friendly ecological refrigerant carbon dioxide (CO
2) has achieved significant attention and has been recognized as an appropriate substitute refrigerant due to its outstanding heat transfer features, and its non-toxicity and non-flammability [
4,
5]. Therefore, machinery systems employing CO
2 as working fluid to transform absorbed heat into thermal, mechanical energy and hereafter electricity probably represent the greatest advances among other current prospects. Medium heat transfer fluids are extensively utilized in various energy systems for transferring heat between sub-systems. Nowadays, several scholars have concentrated on refining the performances of the solar system, particularly solar collectors’ effect, and other elements on the thermal cycle performances. For instance, variables affecting the operation of water-in-glass collector tubes have been examined by Morrison and Budihardjo. Additionally, the performance of a water-in-glass evacuated tube solar heater has been studied. Riffat and Zhao [
6,
7] studied the heat transfer and thermodynamic features of a hybrid heat pipe solar collector/CHP system employing
n-pentane as working fluid and the system worked on a representative Rankine cycle.
Additionally, working fluids properties affect the thermodynamic performance of cycles. Applying appropriate working fluid in a cycle can lead to higher efficiency or output power. One of the methods which are applicable is utilizing transcritical cycles to achieve better performance [
8]. Several studies have focused on transcritical cycles operating with CO
2 as working fluid. An analysis of the transcritical CO
2 refrigeration cycle associated with the second law has been demonstrated by Fartaj et al. [
9]. Yang et al. [
10] carried out an exergy analysis on the transcritical CO
2 refrigeration cycle working with an expander. Chen et al. [
9] and Cayer et al. [
11] implemented a comprehensive investigation of the CO
2 Rankine cycle. These types of research focused on analyzing the system variables on a particular condition. There are limited investigations concentrating on the system performance with respect to time, not to declare the CO
2 Rankine cycle exergy analysis with time.
Furthermore, global warming and air pollution which lead to environmental issues are growing due to industries development and daily rise in energy demand. Natural gas (NG) has been known as an eco-friendly type of energy source which could be widely utilized in the combustion process [
12]. Consequently, using NG as an alternative resource for the sake of meeting the growing energy demand and reducing the environmental pollution is considered as a proper approach. Liquefied natural gas (LNG) is natural gas which has been converted into a liquid form in order to be transportable for long distances with lower difficulty [
13]. Moreover, through the liquefying procedure, LNG can deliver a great amount of cryogenic energy, due to its temperature which is very low (110 K). The cryogenic energy can be extracted during the process of regasification. In other words, LNG can be used as an alternative energy supply. Nonetheless, the conventional regasification methods waste the cold energy and still need a great amount of energy supply [
14,
15,
16,
17,
18]. Hence, investigation and development of cold recovery processes, has been the aim of many studies in the LNG regasification process. One of the most reliable methods for electricity power production is cold recovery process of LNG. About 16 cryogenic power plants using the recovered cryogenic energy of LNG have been built in Japan since 1979 to 2000 [
19]. Efficiencies and performances of aforementioned cryogenic power plants have been continually enhanced. Dispenza [
20,
21] presented a modified process in a combined heat and power (CHP) system, which utilized LNG stream through the regasification stage, as a cold source. Szargut [
22] evaluated the performance of three different cryogenic power plants.
Several studies have focused on improving the performance of LNG cold energy recovery, by combining conventional power cycles or by advance optimization of the main variables of the cycles. Choi [
23] presented a cascade Rankine cycle in order to recover LNG cold energy. The results showed that by increasing the stage numbers, exergy and energy efficiencies and total power output would enhance (<3 stages). Gomez [
24] designed a new closed Brayton cycle power plant which includes a steam Rankine cycle, in which the regasification of LNG provided the available cold exergy. Still Gomez [
14], evaluated the traditional thermodynamic cycles in order to enhance the power plant performance by using the cryogenic energy of LNG and provided a selection criterion for the working fluids. Dong [
25] studied and modified a model, which used the LNG cryogenic energy to generate power by Stirling cycle.
The properties of working fluids and operational conditions, directly affect the power generation efficiency. Accordingly, some researchers studied the working fluid properties to enhance [
26] the recovered cold energy of LNG. CO
2 is a proper choice for power generation systems by employing LNG cold energy [
27,
28]. It is shown that low-temperature natural gas can be employed as a heat sink to condense the CO
2. Additionally, employing CO
2 can be considered as a solution for some environmental issues including rising sea levels and global warming. Some researchers have investigated capturing CO
2 over cold energy recovery in LNG-fueled power plants. Liu [
29] performed a thermo-economic analysis on a zero-CO
2 emission and refrigeration cogeneration cycle. Zhang [
30] studied a new configuration of the LNG-fueled power plant that liquefies the CO
2 after combustion stage, and captures it without additional energy use. Alabdulkarem [
31] studied an LNG plant with CO
2 capture and sequestration in order to decrease the energy use through the CO
2 liquefaction process. These investigations were subjected to ‘self-capturing’ which is related to the post-capture system. Nonetheless, some industries such as magnetite processing generate large amounts of CO
2 without combustion.
One of the promising approaches with low emission and high efficiency in comparison with fossil fuel-based systems is Solid oxide fuel cell (SOFC) [
32]. SOFC typically performs at a high temperature, approximately 600–1000 °C [
33]. This technology has the ability to be integrated with other classical and regular thermodynamic cycles for enhancing the energy conversion efficiency. SOFC-GT system is a general approach to recover the waste heat from the SOFC. This system is provided by integrating a SOFC and a gas turbine (GT) as the bottoming cycle to improve the total efficiency via recovering waste heat from SOFC output. The theoretical backgrounds and conceptual models of the hybrid SOFC-GT system were studied and analyzed by various scholars for decades [
34,
35,
36,
37,
38,
39,
40,
41,
42,
43,
44,
45,
46,
47].
Solid oxide fuel cells have the ability to be coupled with bottoming power cycles, including Brayton [
48], Rankine [
49], Kalina [
50] and Stirling [
51] cycles, tri-generation systems [
52], and renewable energy systems [
53], to reach efficient power generation up to 80% efficiency [
54,
55].
Integrating SOFCs with high output temperatures (i.e., up to 1000 °C), with a bottoming steam Rankine cycle (SRC) [
56,
57,
58] or organic Rankine cycle (ORC) [
59,
60,
61,
62,
63,
64], might limit SOFC operation temperature, and/or increase Rankine working fluid critical temperature. In spite of reported energy efficiencies of up to 71% [
57], studies of SOFC-SRCs are limited. A single pressure level superheated SRC with hybrid SOFC-SRC thermal efficiencies of 62–68% has been used by Rokhi, depending cycle structure and operating conditions [
63,
64]. Gandiglio et al. [
49] reported thermal efficiency of 65% by employing a three-pressure level SRC for recovering the waste heat of SOFC. Mehrpooya et al. [
58] coupled a SOFC with a three-pressure level regenerative SRC at live steam pressures of 60–100 bar in order to reach 62.4% of electrical efficiency. ORCs have lower operating pressure, more compact layout and simpler structure, enhanced reliability, and reduced maintenance in comparison with SRCs [
65].
Generally, SOFC is supplied by the methane as fuel. The methane is supported by the natural gas that is usually accumulated as LNG at −161 °C for large scale of manufacturing use. Throughout the natural gas liquefying process, a huge amount of mechanical energy is employed in the refrigeration process. Consequently, LNG comprises considerable cold energy. If the LNG cold energy could be retrieved in the fuel feeding process for SOFC, the efficiency of the suggested SOFC-GT-ORC unified power system could be increased. Various methods of LNG cold energy employing were proposed in previous years [
66,
67,
68,
69,
70] including material freezing, intake air-cooling, and power generation. Liu and Guo [
71] suggested an innovative cryogenic cycle via employing working fluids, comprising a binary mixture and improving the energy retrieval effectiveness of a LNG cold power creation, integrating with a vapor absorption process. The outcomes of simulation revealed that the innovative power cycle with LNG had significantly higher efficiency than the conventional ORC. Song et al. [
27] suggested a transcritical CO
2 power system powered by solar energy via employing LNG as heat sink. Their study revealed that the entire power cycle efficiency increased by employing the LNG cold energy underneath the particular situation and it can be additionally raised via parametric optimization.
Based on the literature review, several studies have been conducted on integrating various cycles with SOFC; however, there few studies focused on SOFC-GT-ORC. For instance, Eveloy et al. [
72] investigated SOFC-GT-ORC systems and observed an enhancement in power generation by integrating these systems. Utilizing SOFC-GT-ORC for micro-scale power generation was investigated by Ebrahimi et al. [
73]. It was concluded that these types of systems are efficient for power generation. In the present study, in addition to the mentioned configuration, LNG cold energy is utilized in order to achieve higher efficiency. Using LNG as a heat sink in SOFC-GT-ORC system was investigated by Yan et al. [
74]; however, exergy analysis was not performed by the authors which is conducted in this study. Exergy analysis enables designers to distinguish the components with high exergy destruction rate and helps them to optimize the system more appropriately. The proposed system can be used for small-scale power generation by heat recovery from SOFCs utilized in industrial activities which consume LNG as fuel. Integrating the components (SOFC, ORC, GT and LNG as a heat sink) will lead to a high efficiency of the overall system.
In the suggested SOFC-GT-ORC unified power system, LNG is employed as a heat sink to cool the compressor inlets, to condense the turbine outlet and lastly supply the fuel for the SOFC. In order to improve the power output of the ORC, LNG can decrease the temperature of condensing to a very low value, owing to considerable decreasing in the back pressure of turbine via the cryogenic condenser. In addition, LNG can turn cold the air in the intercooler between the two compressors that decreases the compressor intake air temperature, results in lower required work for the compression process.
In this paper, an integrated power system is studied by applying exergy and energy analyses as the principal methods. First, the integrated power system is described; afterward, the primary concepts of the simulation are discussed. Subsequently, results of the simulation, exergy analysis, and composite curves of heat exchangers are represented and discussed. In this design investigated of all components by Pinch technology and Exergy analysis. these tools for this design system used the first time.
2. System Description
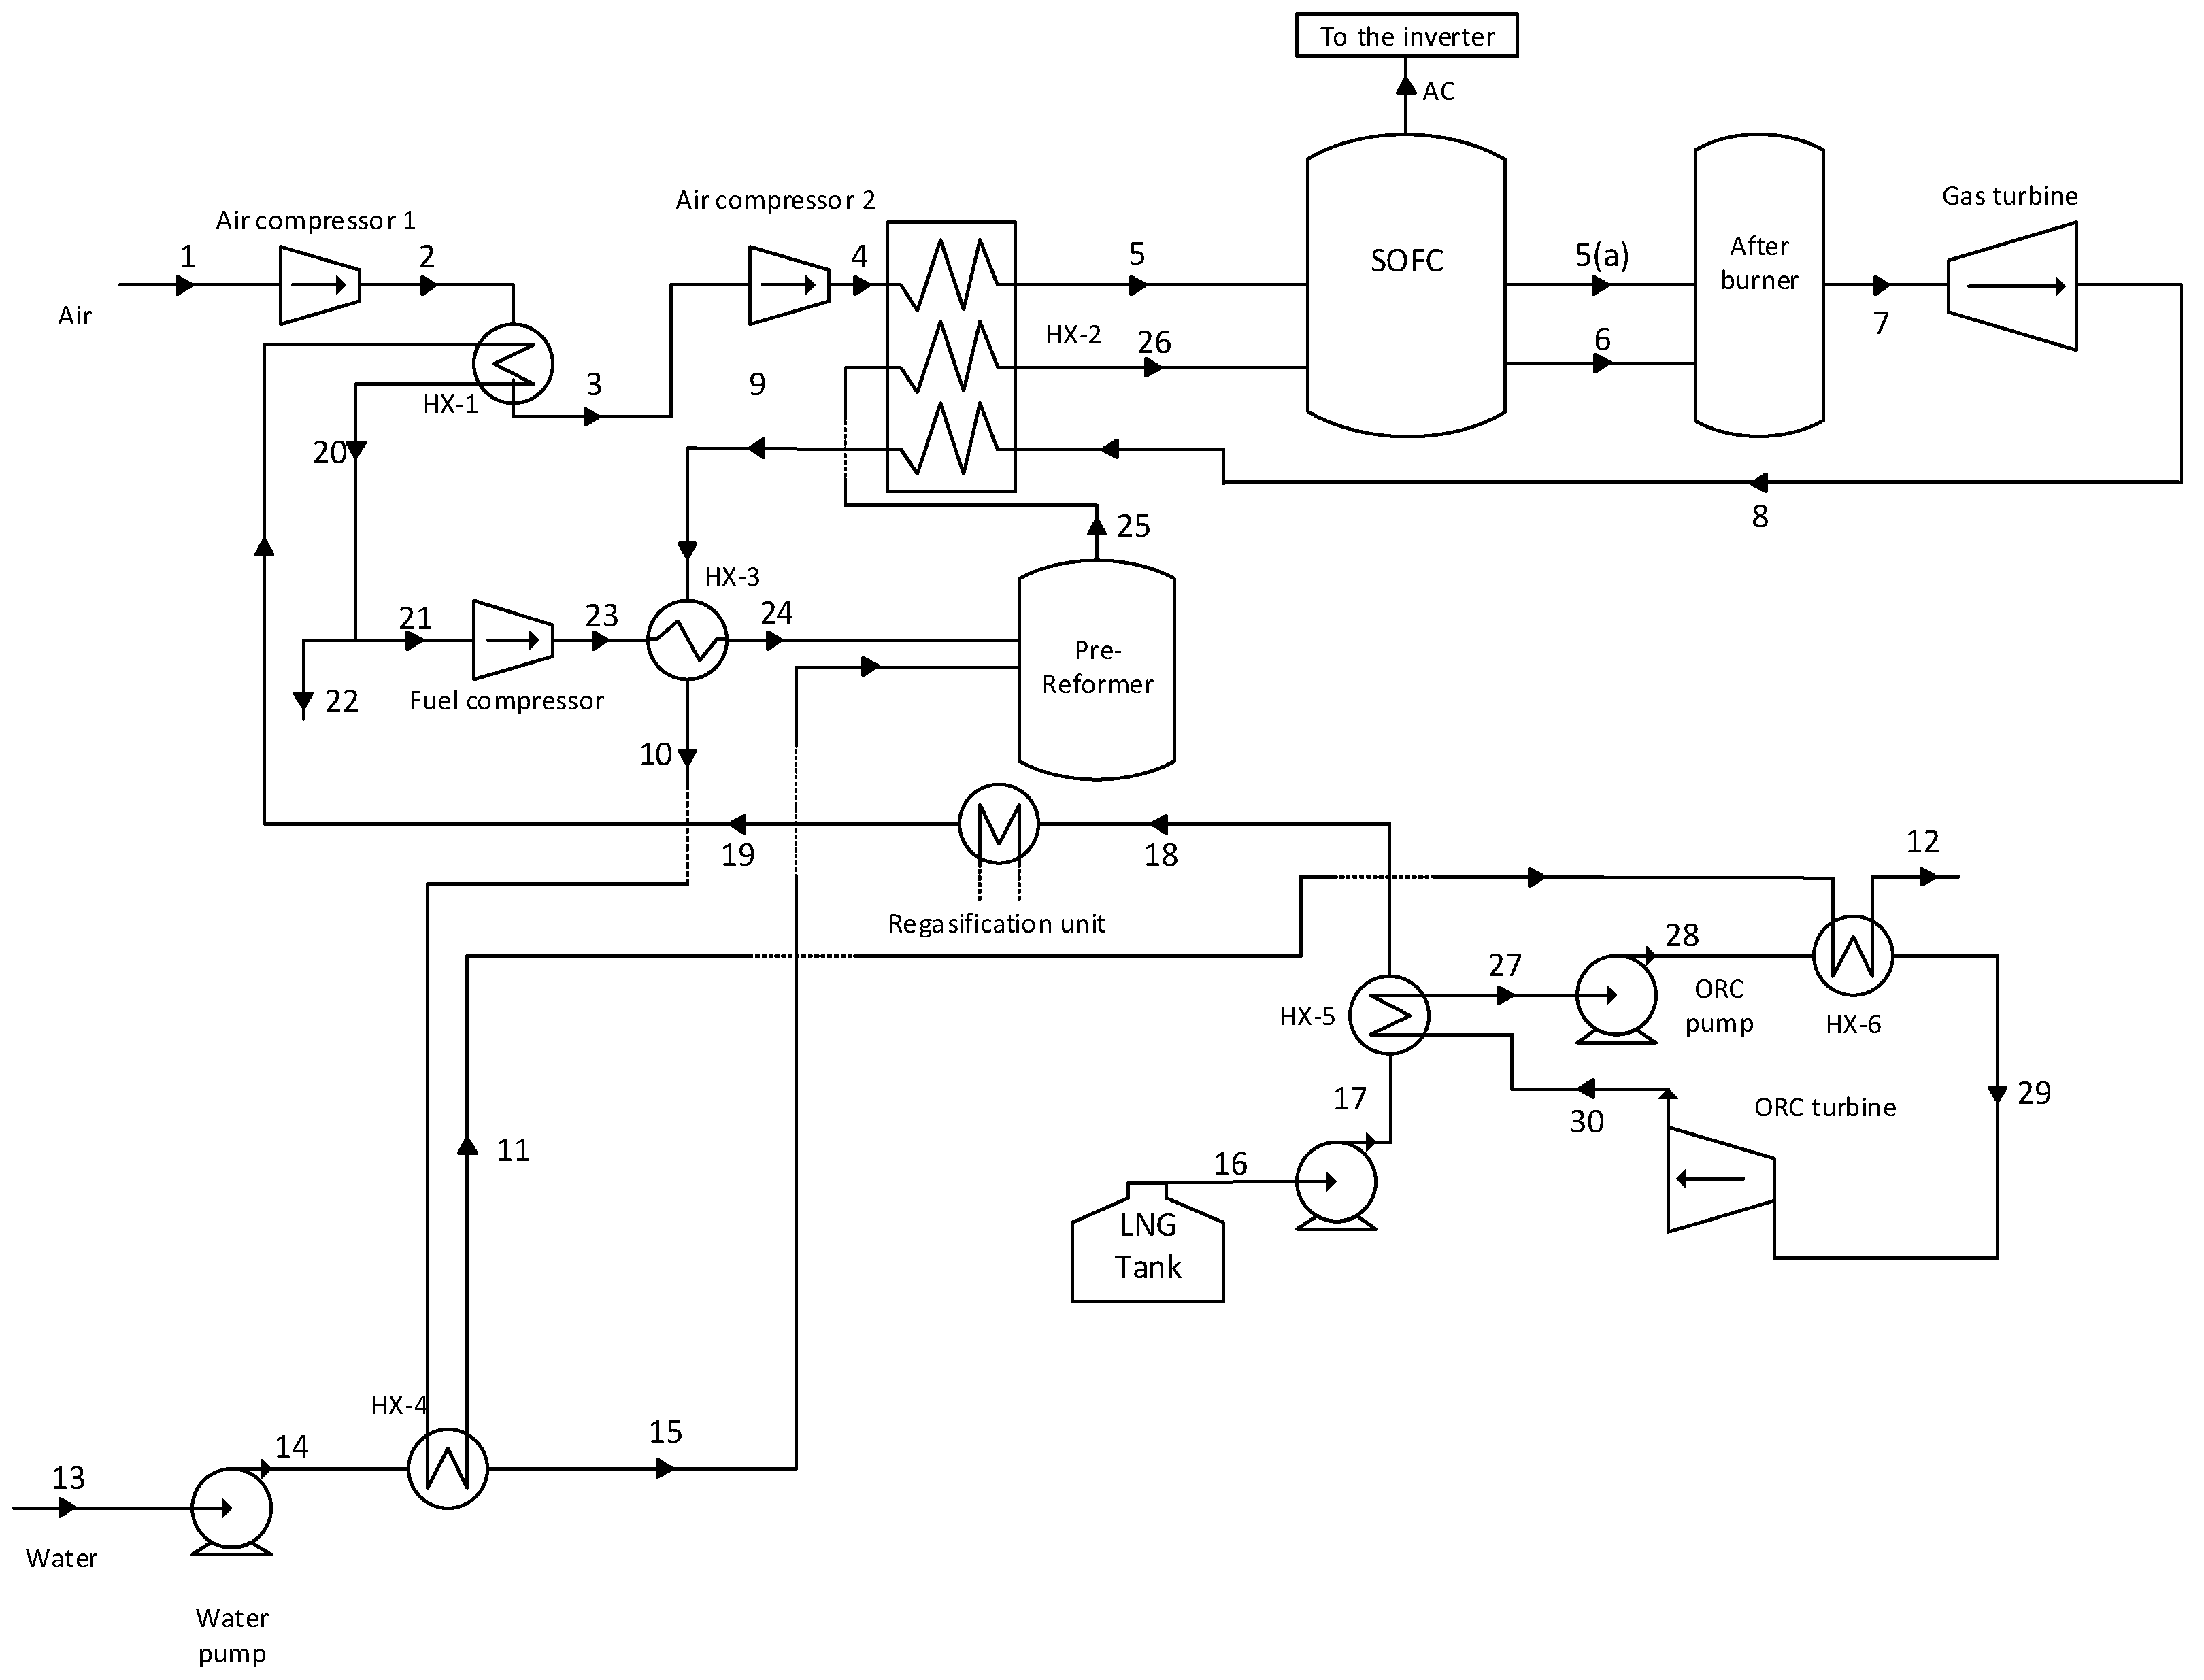
The flow sheet of an integrated power generation system, which uses LNG as a heat sink, is shown in
Figure 1. In
Figure 1, two compressors are used to compress the air stream to the SOFC stack operating pressure. The outlet air stream of the compressor (air compressor 1) is cooled in the heat exchanger (HX-1) by the low-temperature natural gas stream. Subsequently, after compression by the compressor (air compressor 2), the air stream is heated in the heat exchanger (HX-2) by the outlet stream of the gas turbine. The water stream (13) is pumped to the pre-reformer operating pressure and heated in the heat exchanger (HX-4) by the exhaust of the heat exchanger (HX-3) before entering to the pre-reformer reactor as steam.
On the other hand, the LNG stream after heating in several heat exchangers (HX-5, HX-1, and refrigeration storage) is compressed to the pre-reformer operating pressure. Afterwards, the natural gas stream is heated in the heat exchanger (HX-3) by the outlet stream of the heat exchanger (HX-2) and enters to the pre-reforming reactor. In the pre-reformer reactor, regarding reforming reactions, a fraction of the natural gas is transformed into hydrogen. The product of the pre-reformer reactor (25), which contains the hydrogen heated in the heat exchanger (HX-2), enters to the SOFC stack as stream (26). The air stream, after preheating in the heat exchanger (HX-2) and reaching to an appropriate temperature, enters the SOFC stack, where electrochemical and reforming reactions happen concurrently. The reforming reaction is an endothermic one; therefore, a part of the heat emitted from the electrochemical reactions is consumed by the reforming reaction. A DC current is produced by the electrochemical reaction, which the inverter converts into AC.
The outlet streams of the anode and the cathode of the SOFC, (6) and (5(a)), respectively, enter the afterburner reactor. The untransformed part of the fuel in SOFC reactor burns in the afterburner. The outlet of the afterburner reactor with high pressure and the temperature is expanded by the gas turbine to produce power. As aforementioned, the exhaust of the gas turbine is used to heat up the air, natural gas, and water streams.
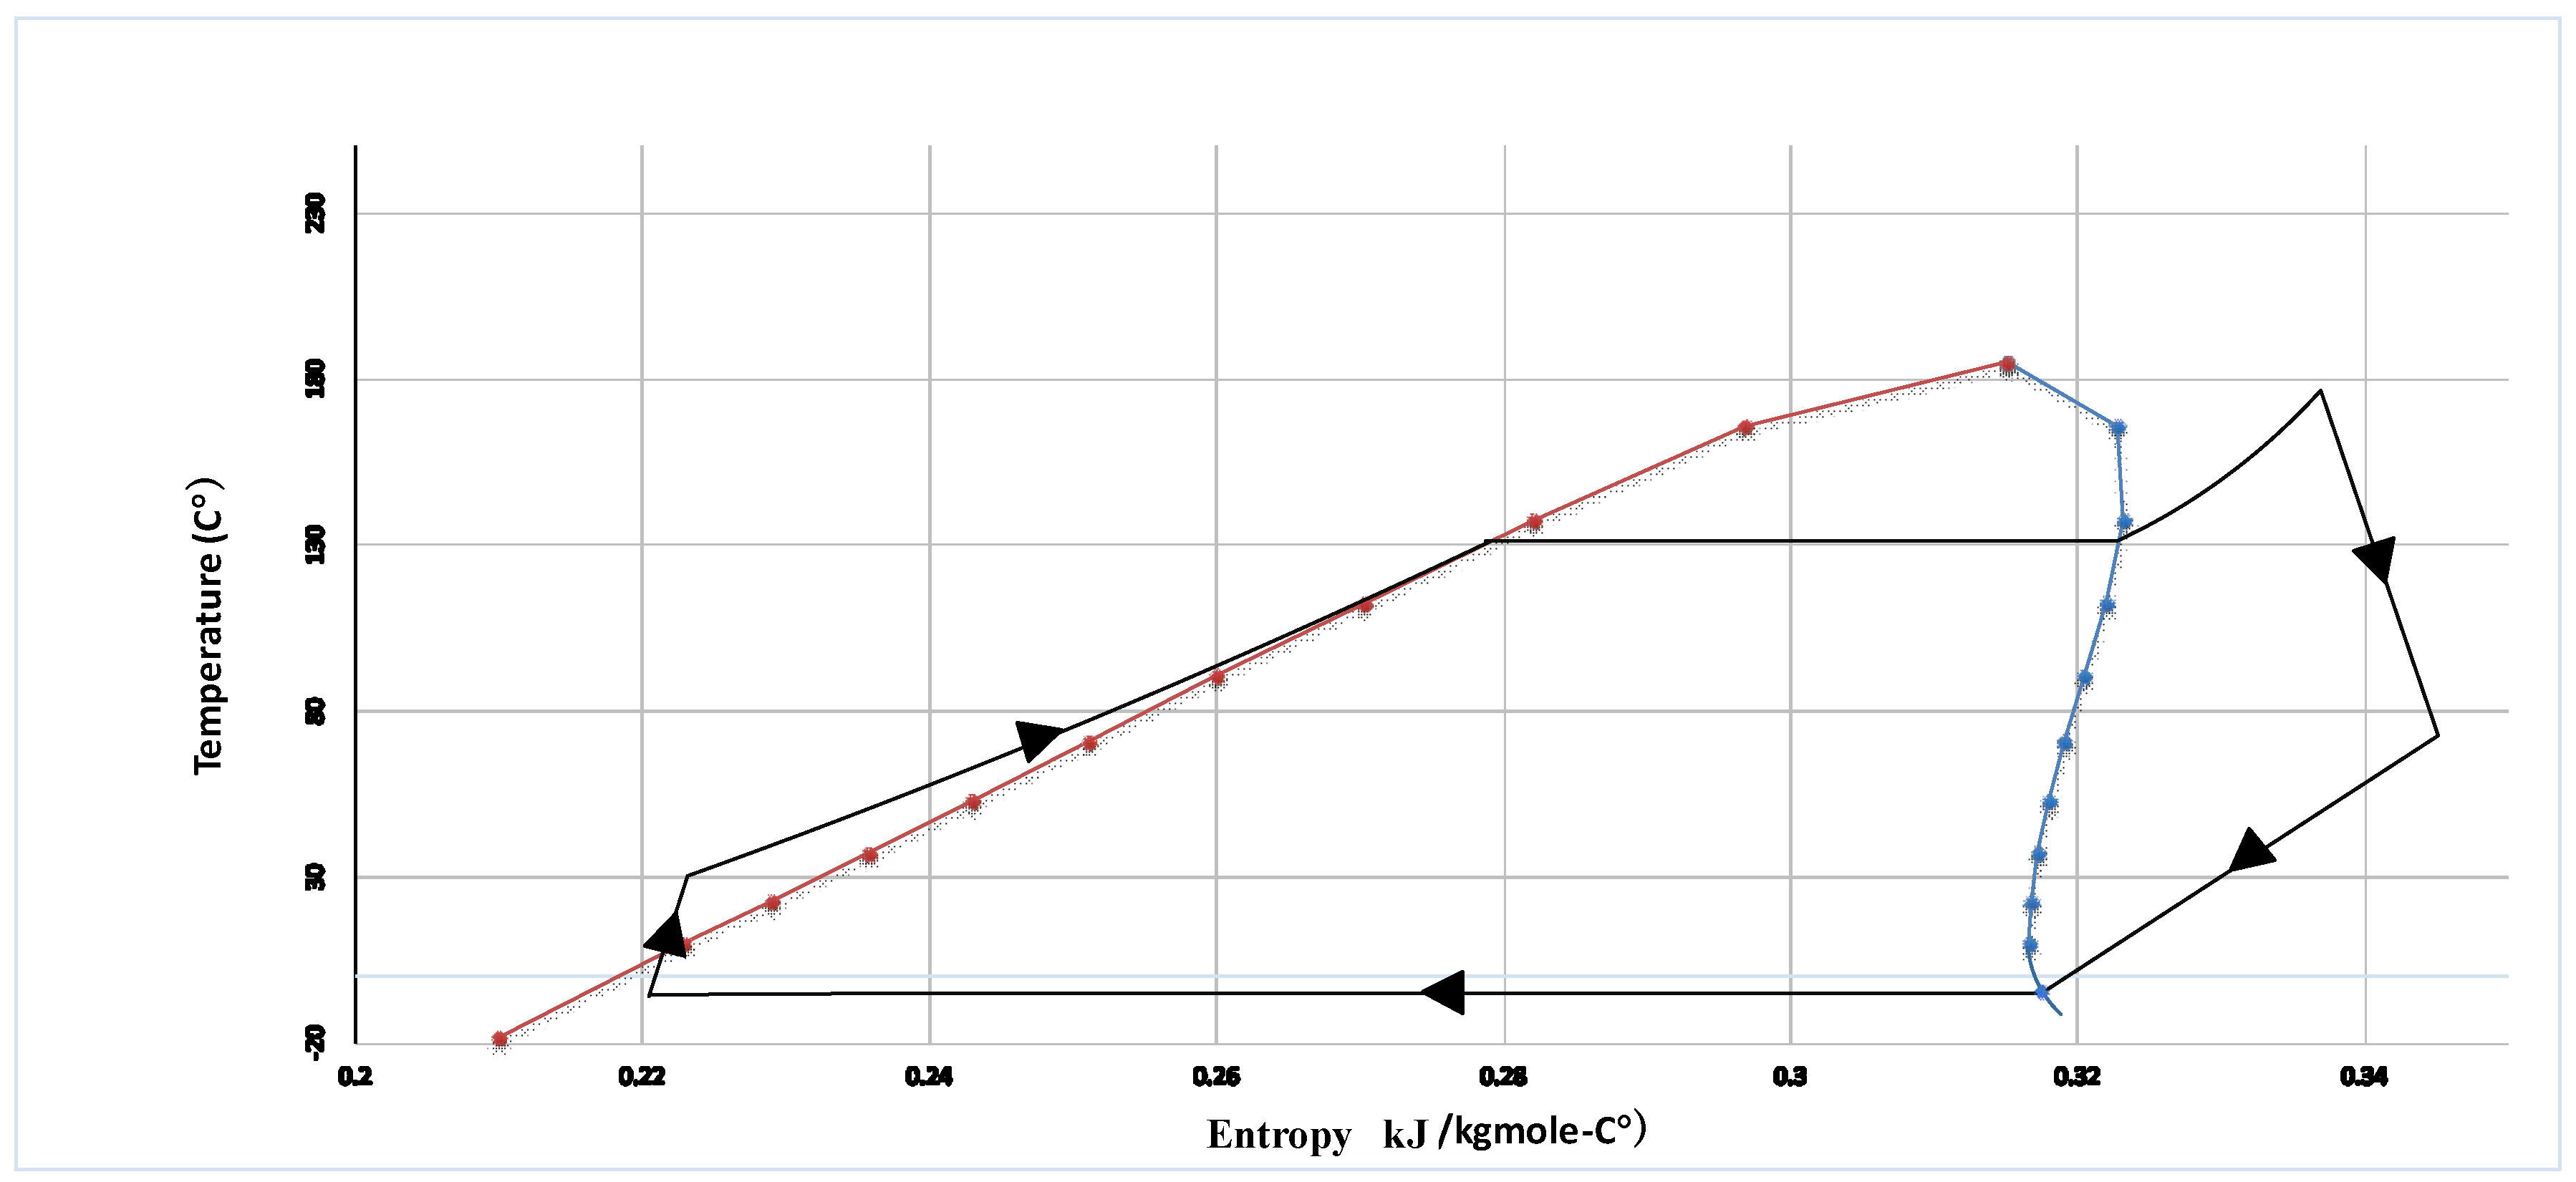
HCFC-123 is used as working fluid in the ORC Brayton cycle. The organic working fluid of the ORC cycle as stream (27) is compressed by the pump (ORC pump) after leaving the heat exchanger (HX-5) as a saturated liquid. Afterwards, the working fluid as stream 28 is introduced into the heat exchanger (HX-6) where it is heated and converted to the superheated vapor. The high-pressure superheat vapor (29) is expanded to low-pressure vapor by ORC turbine to produce power. The exhaust of the ORC turbine (30) is fed to the heat exchanger (HX-5) and is cooled by liquid natural gas to the saturated liquid.
HCFC-123 is used as working fluid in the ORC Brayton cycle. The organic working fluid of the ORC cycle as stream (27) is compressed by the pump (ORC pump) after leaving the heat exchanger (HX-5) as a saturated liquid. Afterwards, the working fluid as stream (28) is introduced into the heat exchanger (HX-6) where it is heated and converted to the superheated vapor. The high-pressure superheat vapor (29) is expanded to low-pressure vapor by ORC turbine to produce power. The exhaust of the ORC turbine (30) is fed to the heat exchanger (HX-5) and is cooled by liquid natural gas to the saturated liquid.


