Truncated Power-Normal Distribution with Application to Non-Negative Measurements
Abstract
1. Introduction
- , for
2. The Truncated Positive PN Distribution
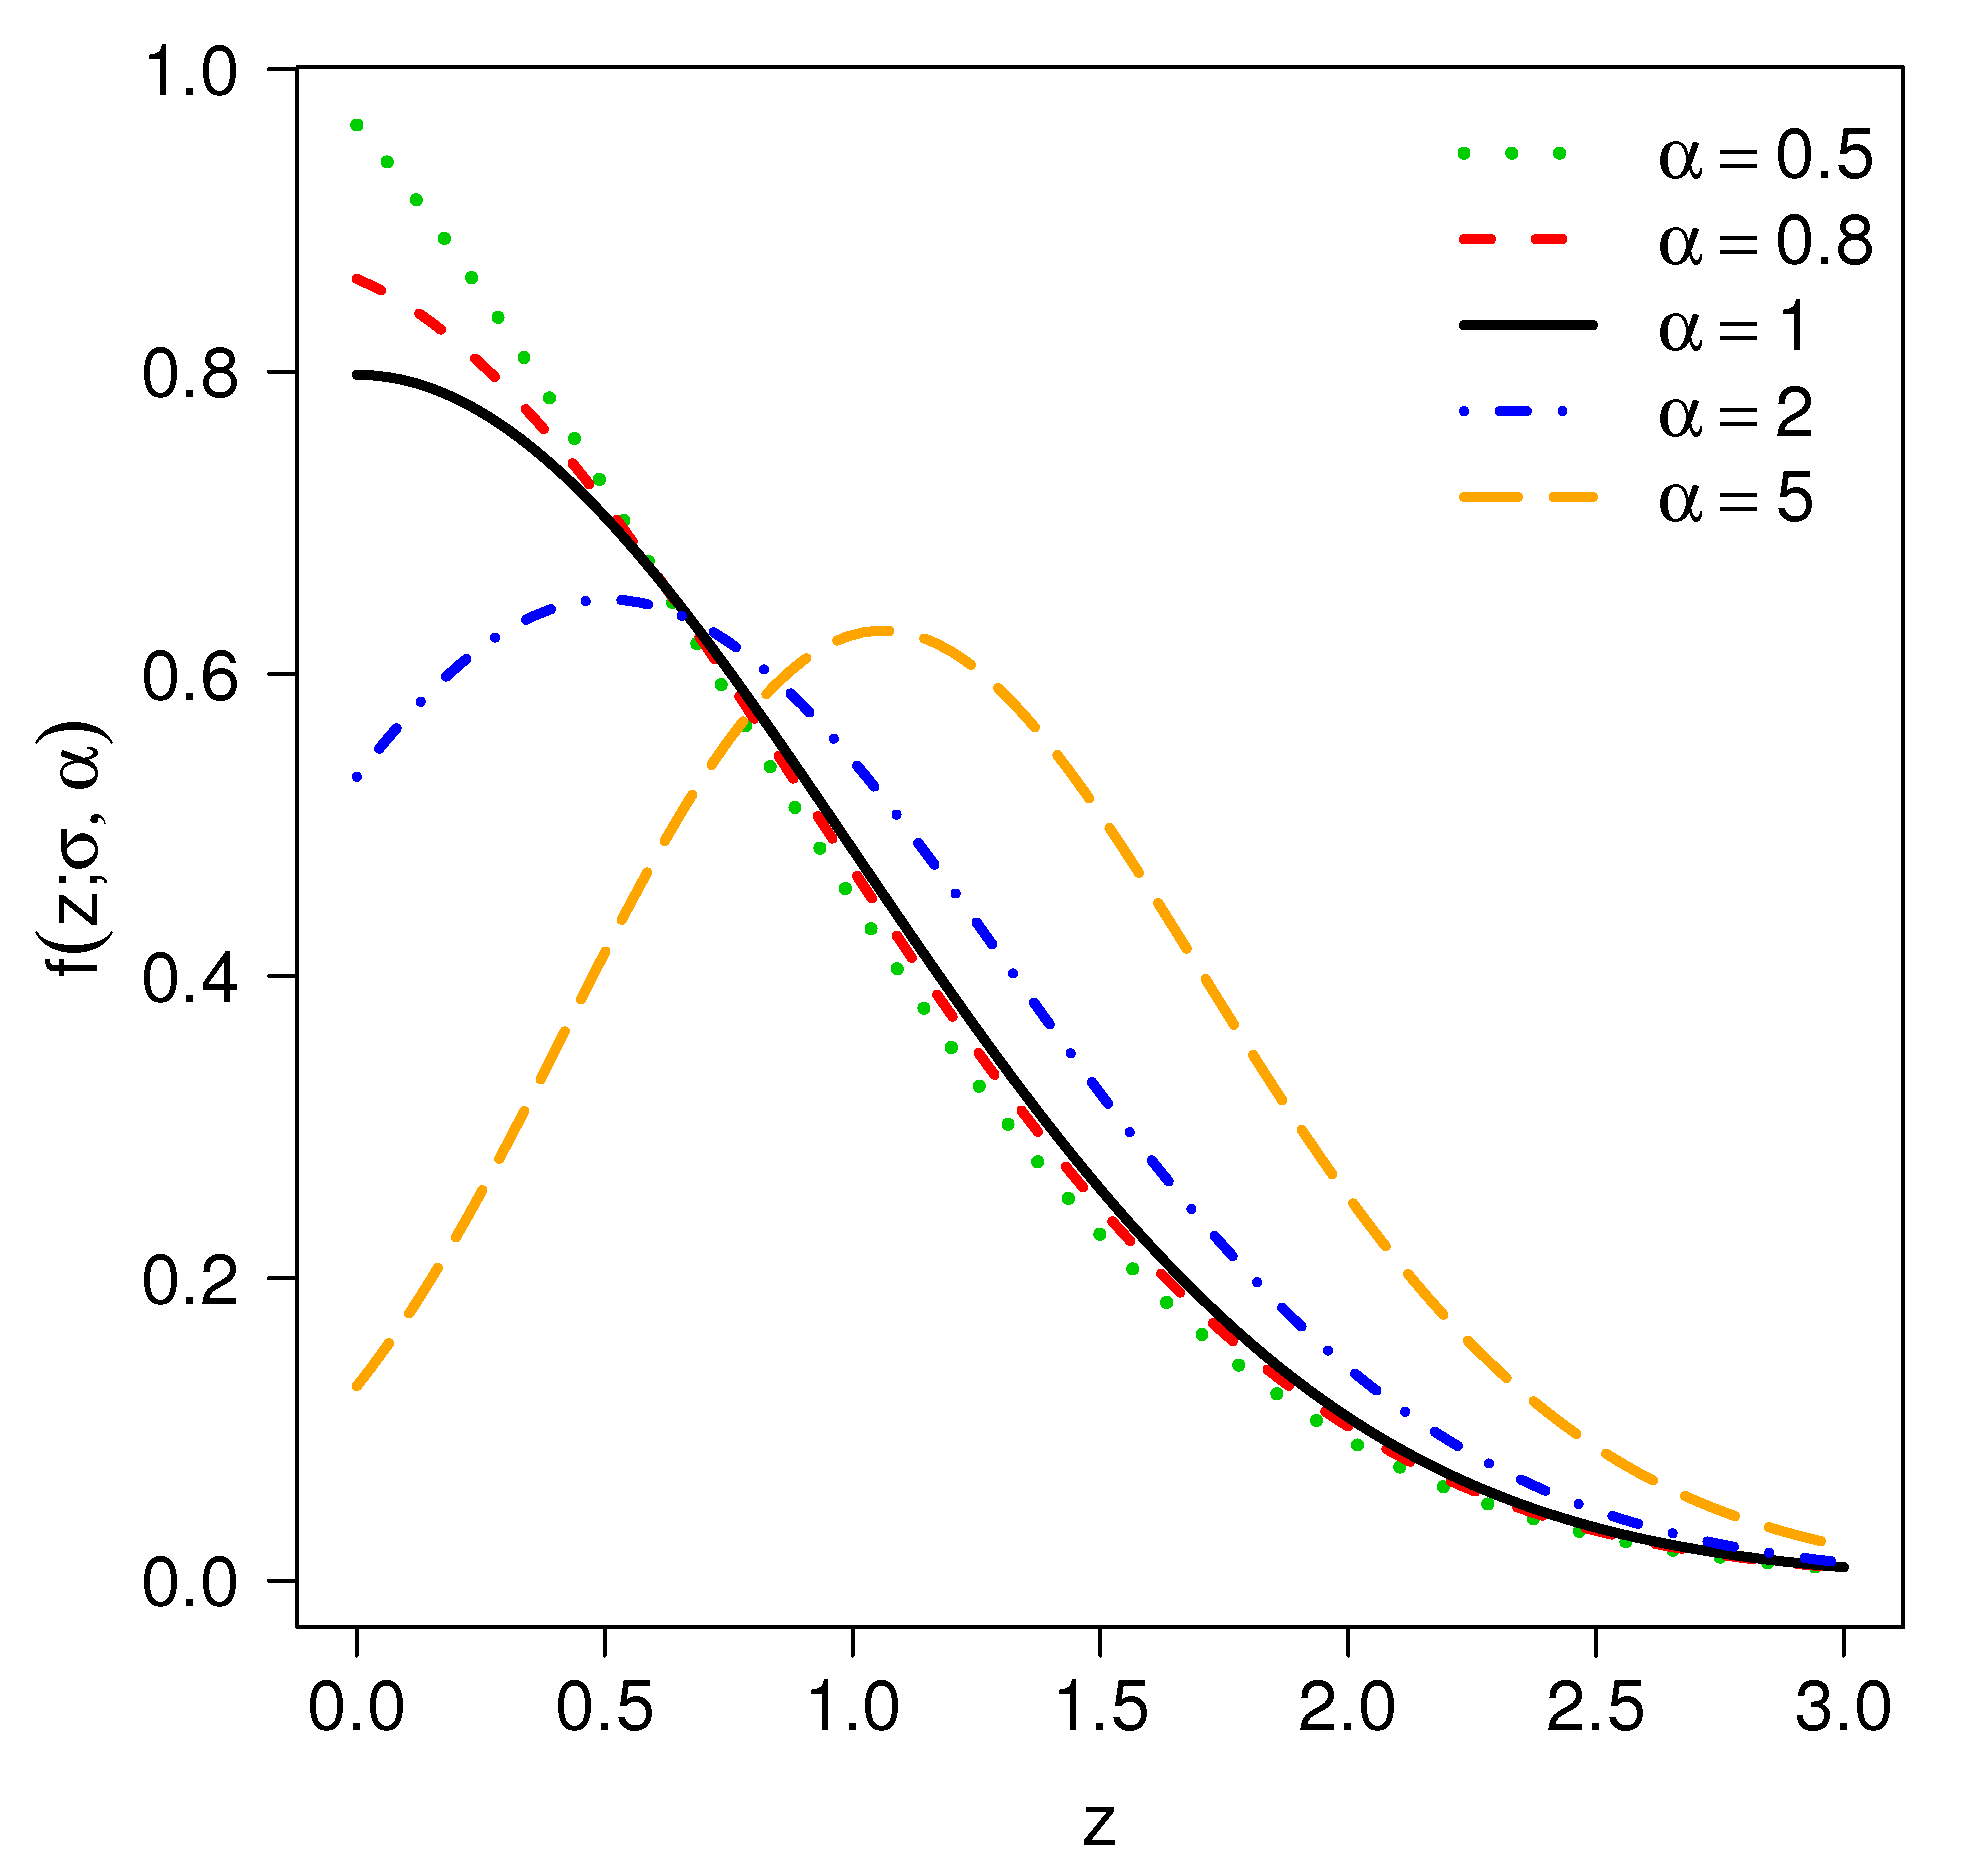
2.1. The Probability Density Function
2.2. Properties
2.2.1. Quantile Function
- First quartile =
- Median(Z) =
- Third quartile =
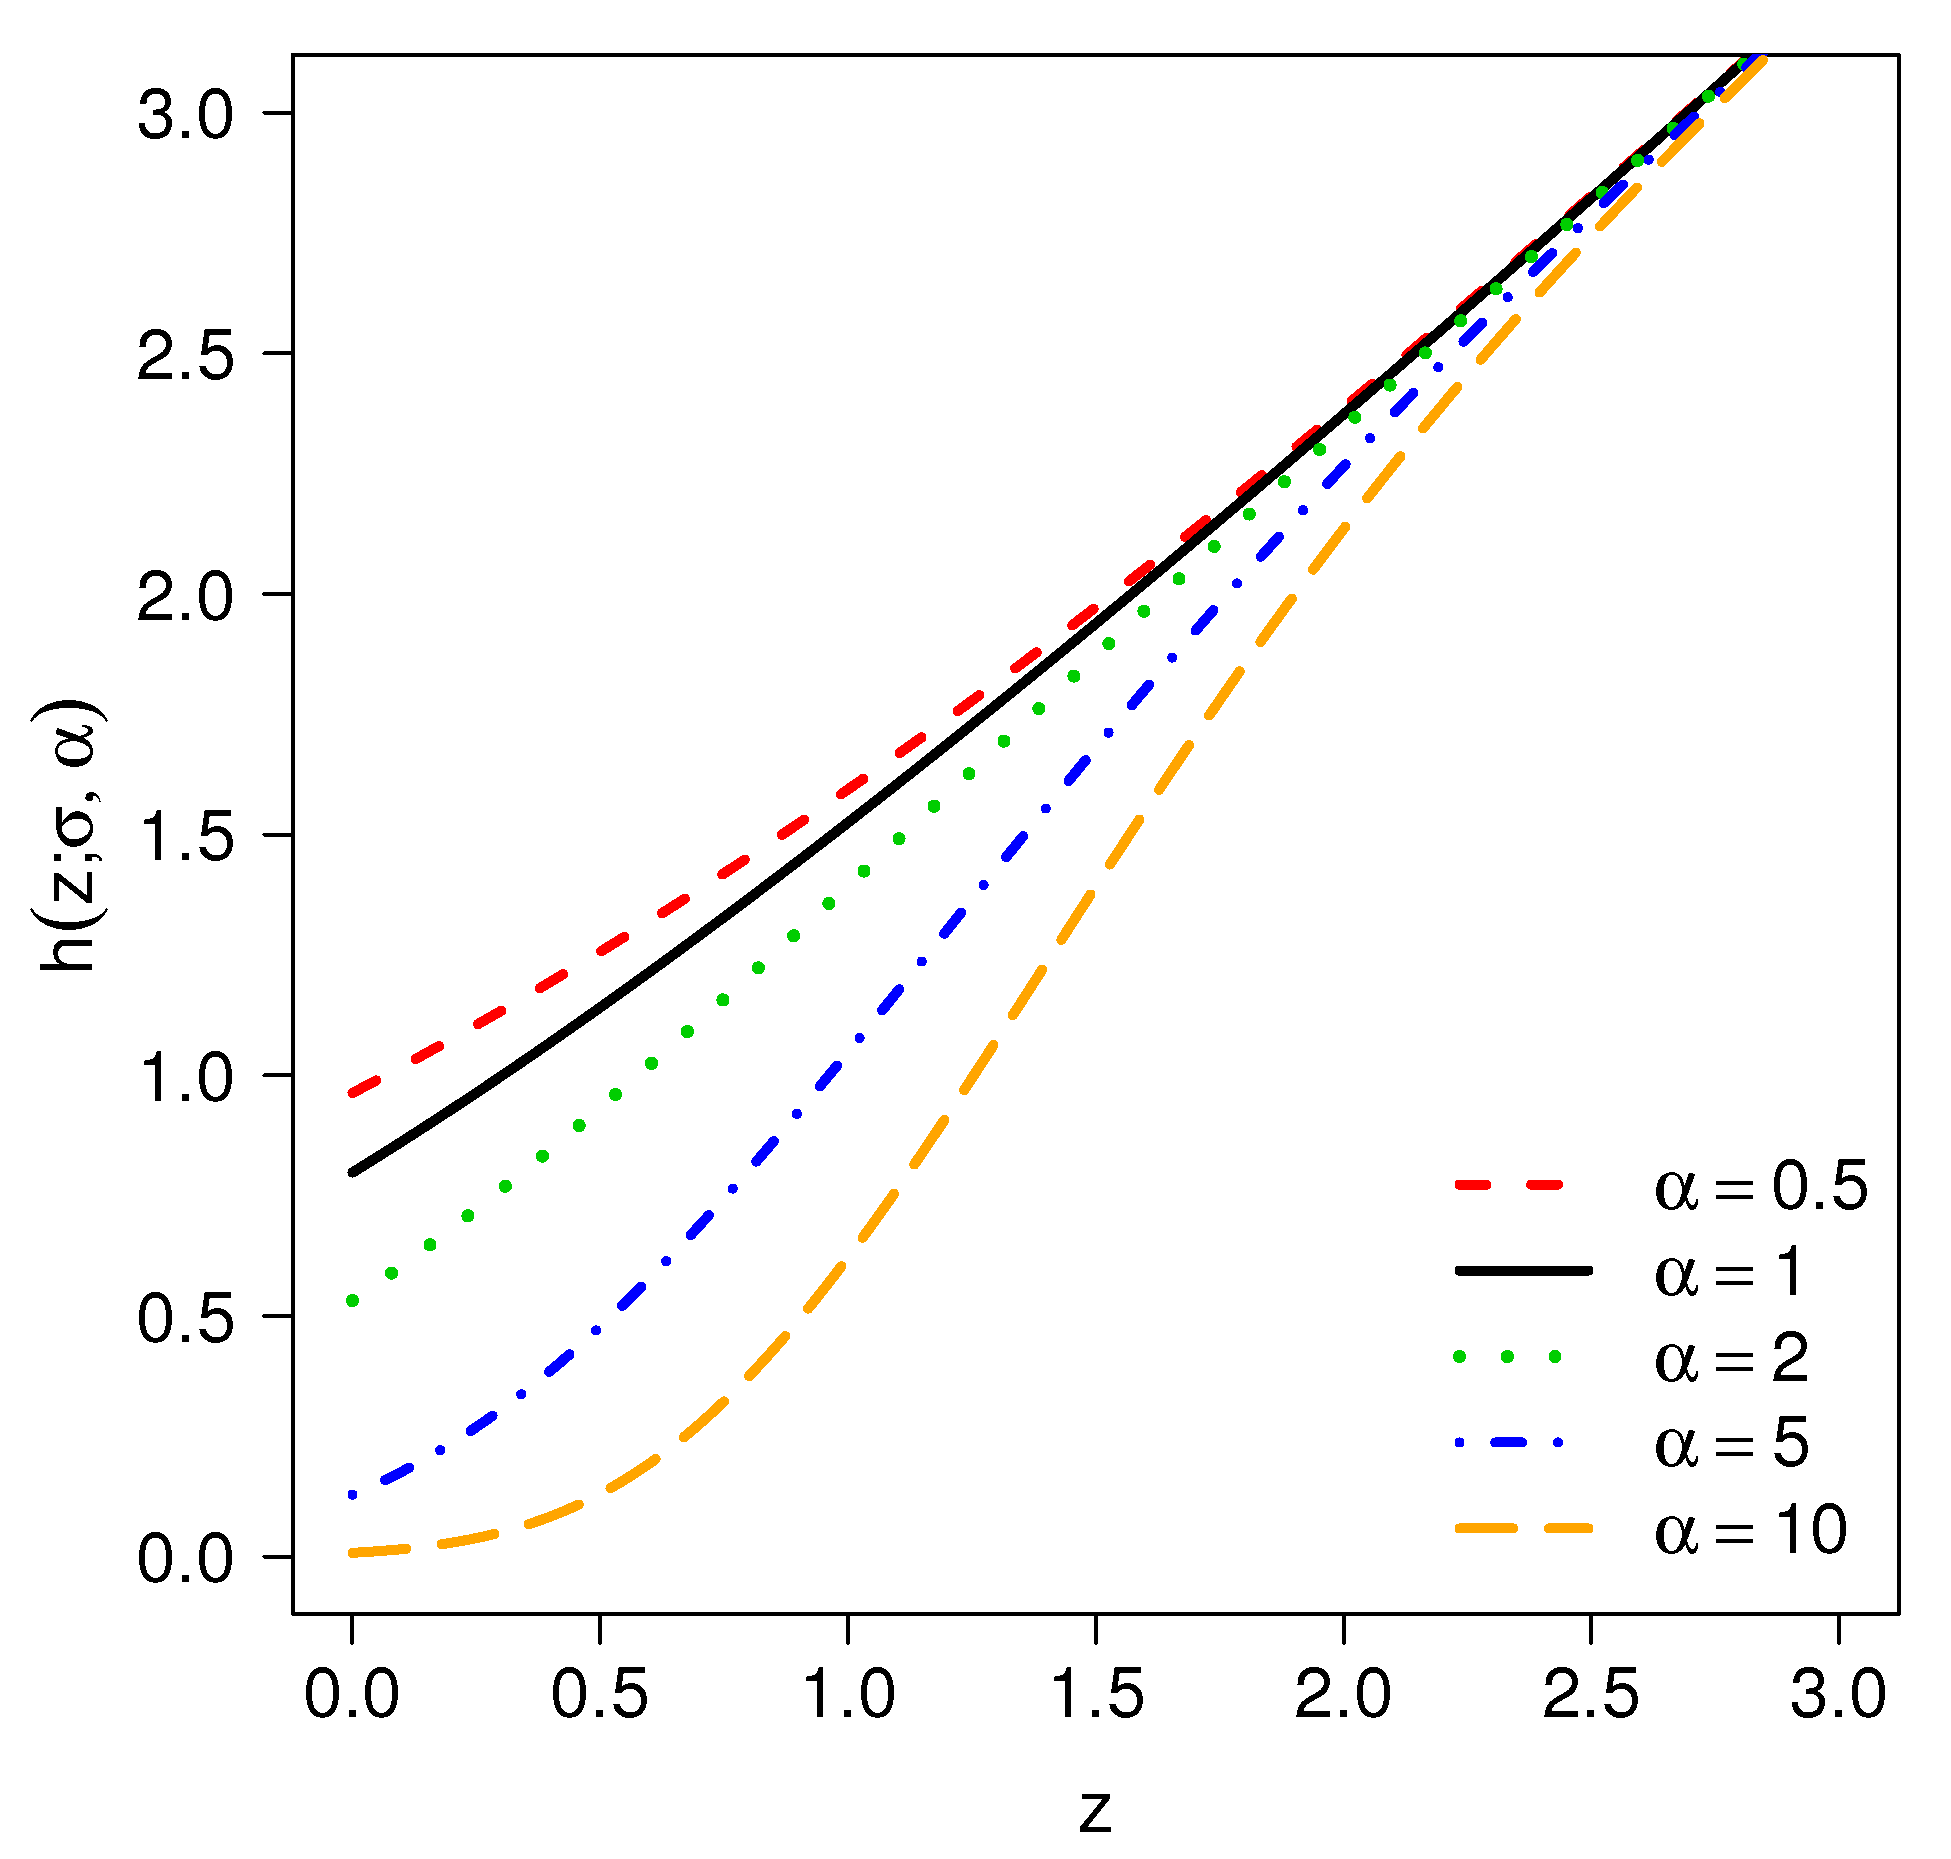
2.2.2. Hazard Rate Function
- (i)
- If , then is the hazard function for the half-normal model .
- (ii)
- , is monotonically increasing with .
- (iii)
- , , as .
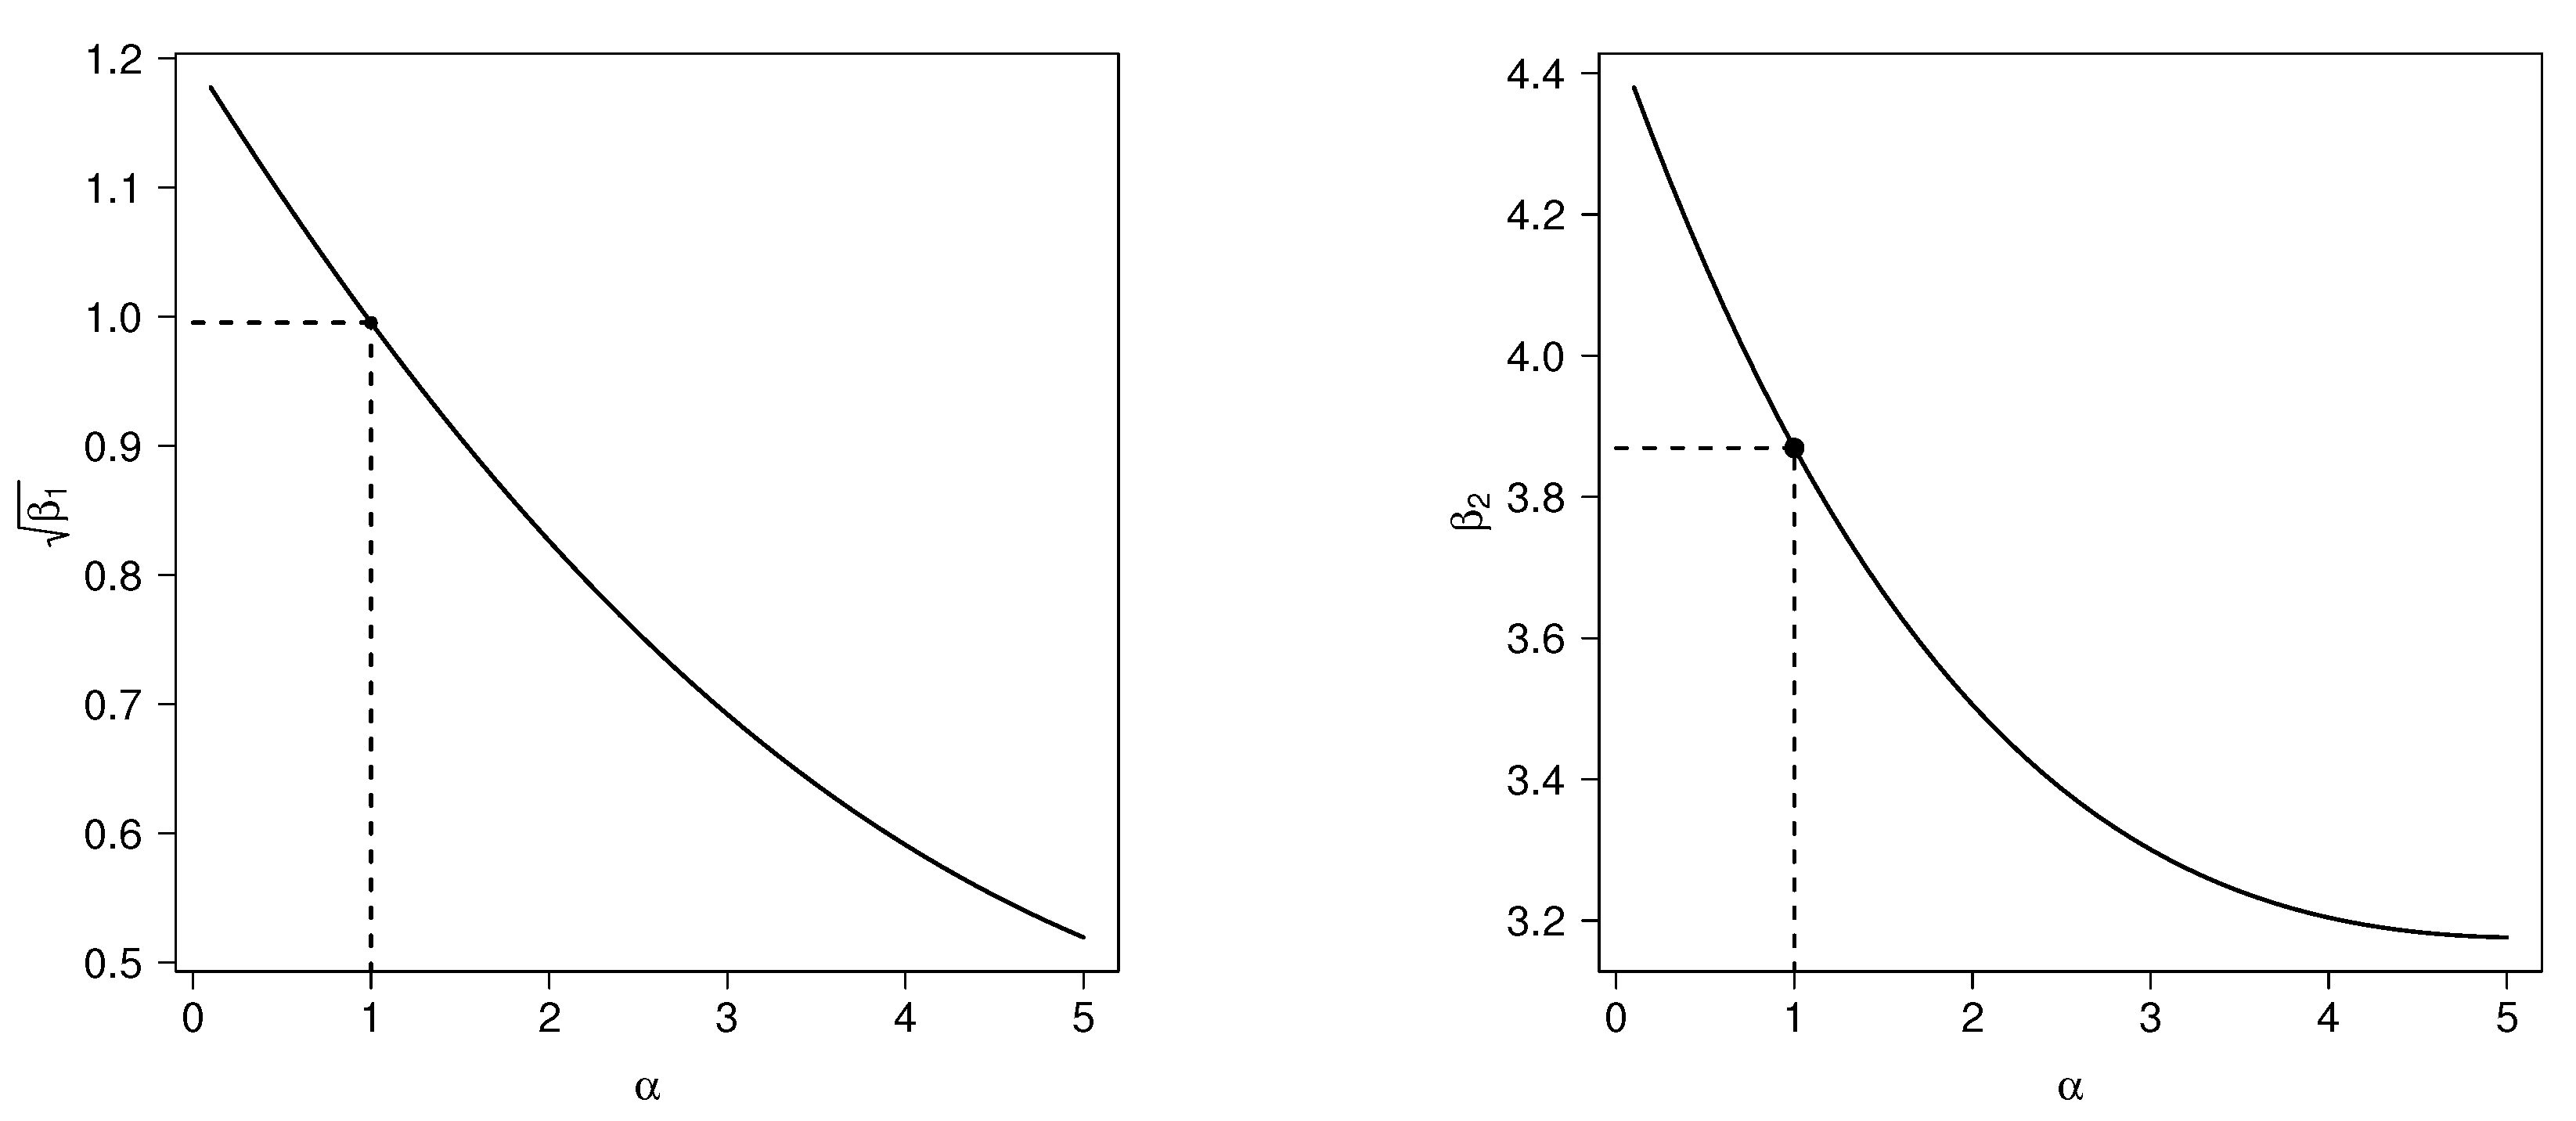
2.3. Moments
- (a)
- (b)
- (c)
- (d)
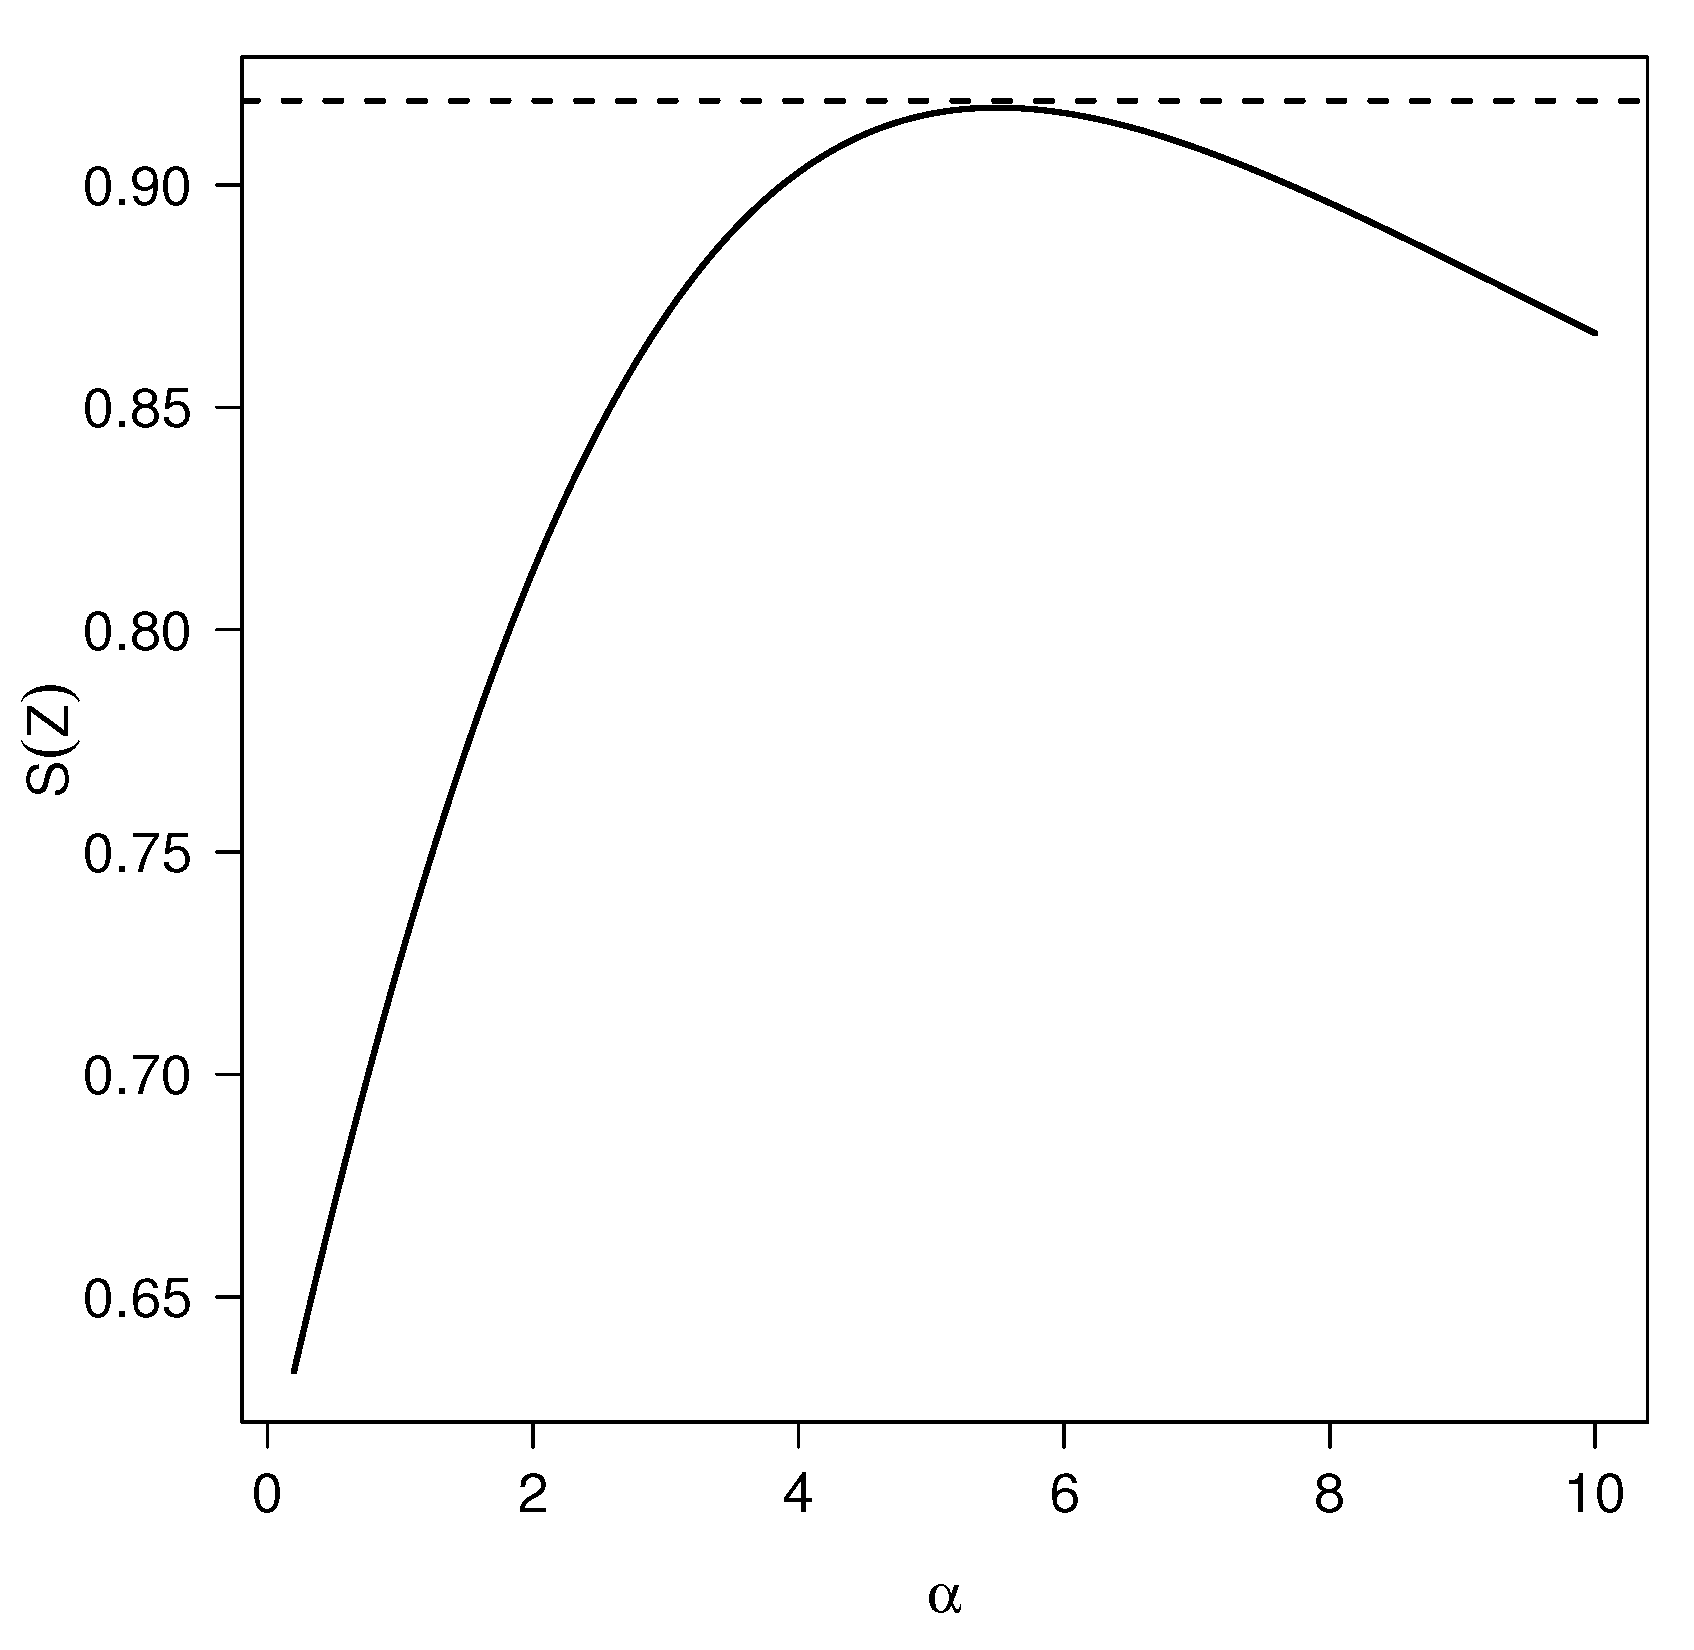
2.4. Shannon Entropy
2.5. Rényi Entropy
- (a)
- .
- (b)
- .
- (c)
- .
- (d)
- , , for .
- (e)
- For , there is no closed form expression for . However, approximated values are provided in Table 1 from [21].
2.6. Kullback–Leibler Divergence for HN and TPN Models
3. Inference
3.1. Moments Estimation
3.2. The Log-Likelihood Function
Fisher Information Matrix
3.3. Truncation at c
4. Simulation Study
- Simulate , and compute .
- If , make . Otherwise, go to the previous step.
Examples
5. Real Data Illustration
5.1. Australian Athletes
5.2. Breaking Stress of Carbon Fibers
6. Discussion
Author Contributions
Acknowledgments
Conflicts of Interest
References
- Lehmann, E.L. The power of rank tests. Ann. Math. Stat. 1953, 24, 23–43. [Google Scholar] [CrossRef]
- Durrans, S.R. Distributions of fractional order statistics in hydrology. Water Resour. Res. 1992, 28, 1649–1655. [Google Scholar] [CrossRef]
- Gupta, D.; Gupta, R.C. Analyzing skewed data by power normal model. Test 2008, 17, 197–210. [Google Scholar] [CrossRef]
- Pewsey, A.; Gómez, H.W.; Bolfarine, H. Likelihood-based inference for power distributions. Test 2012, 21, 775–789. [Google Scholar] [CrossRef]
- Eugene, N.; Lee, C.; Famoye, F. Beta-normal distribution and its applications. Commun. Stat. Theory Methods 2002, 31, 497–512. [Google Scholar] [CrossRef]
- Cooray, K.; Ananda, M.M.A. A Generalization of the Half-Normal Distribution with Applications to Lifetime Data. Commun. Stat. Theory Methods 2008, 37, 1323–1337. [Google Scholar] [CrossRef]
- Castro, L.M.; Gómez, H.W.; Valenzuela, M. Epsilon half-normal model: Properties and inference. Comput. Stat. Data Anal. 2012, 56, 4338–4347. [Google Scholar] [CrossRef]
- Olmos, N.M.; Varela, H.; Gómez, H.W.; Bolfarine, H. An extension of the half-normal distribution. Stat. Pap. 2012, 53, 875–886. [Google Scholar] [CrossRef]
- Arnold, B.C. Flexible univariate and multivariate models based on hidden truncation. J. Stat. Plan. Inference 2009, 139, 3741–3749. [Google Scholar] [CrossRef]
- Barranco-Chamorro, I.; Moreno-Rebollo, J.L.; Pascual-Acosta, A.; Enguix-Gonzalez, A. An overview of asymptotic properties of estimator in truncated distributions. Commun. Stat. Theory Methods 2007, 36, 2351–2366. [Google Scholar] [CrossRef]
- Barr, D.R.; Sherrill, E.T. Mean and variance of truncated normal distributions. Am. Stat. 1999, 53, 357–361. [Google Scholar]
- Bebu, I.; Mathew, T. Confidence intervals for limited moments and truncated moments in normal and lognormal models. Stat. Probab. Lett. 2009, 79, 375–380. [Google Scholar] [CrossRef]
- Chopin, N. Fast simulation of truncated Gaussian distributions. Stat. Comput. 2011, 21, 275–288. [Google Scholar] [CrossRef]
- Damien, P.; Walker, S.G. Sampling truncated normal, beta, and gamma densities. J. Comput. Graph. Stat. 2001, 10, 206–215. [Google Scholar] [CrossRef]
- Jonhson, N.L.; Kotz, S.; Balakrishnan, N. Continuous Univariate Distributions, 2nd ed.; Wiley: New York, NY, USA, 1995; Volume 1. [Google Scholar]
- Robert, C.P. Simulation of truncated normal variables. Stat. Comput. 1995, 5, 121–125. [Google Scholar] [CrossRef]
- Shannon, C.E. A Mathematical Theory of Communication. Bell Syst. Tech. J. 1948, 27, 379–423. [Google Scholar] [CrossRef]
- Ahsanullah, M.; Golam Kibria, B.M.; Shakil, M. Normal and Student’s t Distributions and Their Applications; Atlantis Press: Paris, France, 2014. [Google Scholar]
- Arnold, B.C.; Beaver, R.J. Skewed multivariate models related to hidden truncation and/or selective reporting (with discussion). Test 2002, 11, 7–54. [Google Scholar] [CrossRef]
- Sharafi, M.; Behboodian, J. The Balakrishnan skew-normal pdf. Stat. Pap. 2008, 49, 769–778. [Google Scholar] [CrossRef]
- Steck, G.P. Orthant probability for the equicorrelated multivariate normal distribution. Biometrika 1962, 49, 433–445. [Google Scholar] [CrossRef]
- R Development Core Team. R: A Language and Environment for Statistical Computing; R Foundation for Statistical Computing: Vienna, Austria, 2017; ISBN 3-900051-07-0. [Google Scholar]
- Byrd, R.H.; Lu, P.; Nocedal, J.; Zhu, C. A limited memory algorithm for bound constrained optimization. SIAM J. Sci. Comput. 1995, 16, 1190–1208. [Google Scholar] [CrossRef]
- Birnbaum, Z.W.; Saunders, S.C. A new family of life distributions. J. Appl. Probab. 1969, 6, 319–327. [Google Scholar] [CrossRef]
- Birnbaum, Z.W.; Saunders, S.C. Estimation for a family of life distributions with applications to fatigue. J. Appl. Probab. 1969, 6, 328–377. [Google Scholar] [CrossRef]
- Cordeiro, G.M.; Lemonte, A.J. The β-Birnbaum-Saunders distribution: An improved distribution for fatigue life modeling. Comput. Stat. Data Anal. 2011, 55, 1445–1461. [Google Scholar] [CrossRef]
- Gómez, Y.M.; Bolfarine, H. Likelihood-based inference for the power half-normal distribution. J. Stat. Theory Appl. 2015, 14, 383–398. [Google Scholar] [CrossRef]
- Gómez, H.J.; Olmos, N.M.; Varela, H.; Bolfarine, H. Truncated positive normal distribution. Appl. Math. J. Chin. Univ. 2018, 33, 163–176. [Google Scholar]
- Akaike, H. A new look at the statistical model identification. IEEE Trans. Autom. Control 1974, 19, 716–723. [Google Scholar] [CrossRef]
- Cook, R.D.; Weisberg, S. An Introduction to Regression Graphics; JohnWiley & Sons Inc.: New York, NY, USA, 1994. [Google Scholar]
- Nichols, M.D.; Padgett, W.J. A bootstrap control chart for Weibull percentiles. Qual. Reliab. Eng. Int. 2006, 22, 141–151. [Google Scholar] [CrossRef]
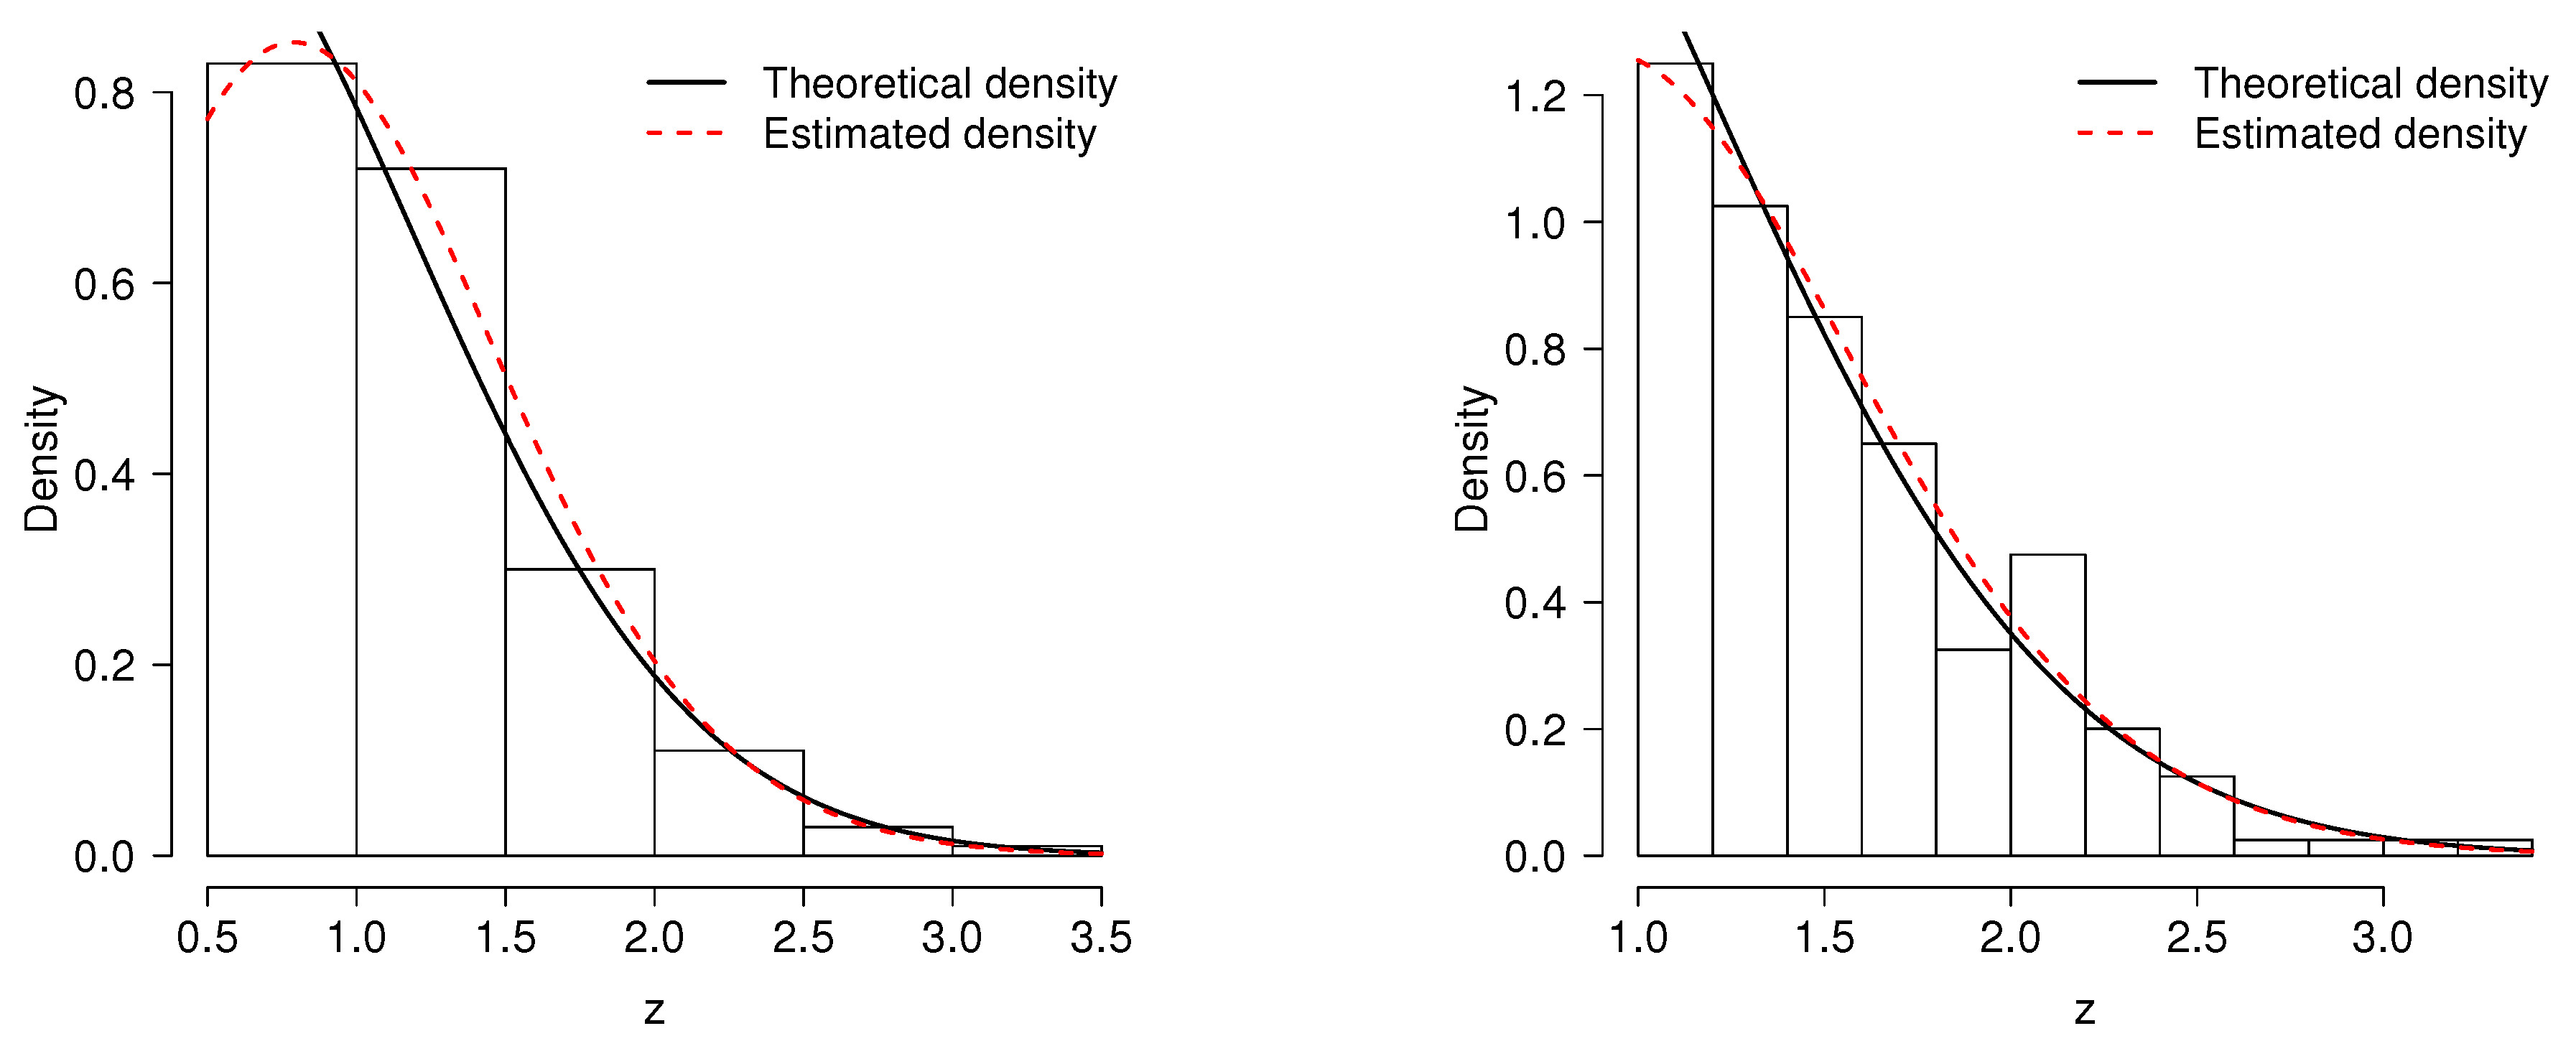


| True Value | ||||||||||||||
|---|---|---|---|---|---|---|---|---|---|---|---|---|---|---|
| mean | s.d. | mean | s.d. | mean | s.d. | mean | s.d. | |||||||
| 0.0 | 0.8 | 1 | 1.235 | 1.099 | 1.221 | 0.959 | 0.164 | 0.166 | 1.304 | 1.050 | 0.987 | 0.953 | 0.136 | 0.133 |
| 2 | 1.238 | 1.097 | 1.221 | 1.923 | 0.329 | 0.328 | 1.229 | 1.018 | 0.968 | 1.923 | 0.274 | 0.268 | ||
| 3 | 1.244 | 1.095 | 1.234 | 2.876 | 0.491 | 0.499 | 1.137 | 0.935 | 0.964 | 2.922 | 0.406 | 0.41 | ||
| 1.0 | 1 | 1.414 | 1.145 | 1.269 | 0.965 | 0.164 | 0.169 | 1.399 | 1.052 | 0.951 | 0.964 | 0.136 | 0.13 | |
| 2 | 1.420 | 1.159 | 1.262 | 1.932 | 0.329 | 0.330 | 1.352 | 1.023 | 0.971 | 1.943 | 0.273 | 0.262 | ||
| 3 | 1.412 | 1.156 | 1.280 | 2.901 | 0.494 | 0.502 | 1.286 | 0.960 | 0.980 | 2.934 | 0.404 | 0.405 | ||
| 1.5 | 1 | 1.857 | 1.265 | 1.353 | 0.975 | 0.163 | 0.162 | 1.770 | 1.056 | 0.996 | 0.980 | 0.132 | 0.126 | |
| 2 | 1.835 | 1.261 | 1.336 | 1.955 | 0.326 | 0.328 | 1.721 | 1.043 | 0.992 | 1.972 | 0.265 | 0.255 | ||
| 3 | 1.838 | 1.259 | 1.348 | 2.936 | 0.490 | 0.495 | 1.695 | 1.016 | 1.030 | 2.966 | 0.396 | 0.39 | ||
| 0.5 | 0.8 | 1 | 2.256 | 2.383 | 3.004 | 0.945 | 0.149 | 0.157 | 2.423 | 2.421 | 2.441 | 0.932 | 0.129 | 0.131 |
| 2 | 1.595 | 1.568 | 1.866 | 1.907 | 0.314 | 0.324 | 1.687 | 1.538 | 1.497 | 1.891 | 0.265 | 0.264 | ||
| 3 | 1.468 | 1.394 | 1.605 | 2.863 | 0.477 | 0.490 | 1.355 | 1.219 | 1.241 | 2.897 | 0.398 | 0.406 | ||
| 1.0 | 1 | 2.329 | 2.415 | 2.996 | 0.953 | 0.151 | 0.155 | 2.537 | 2.418 | 2.451 | 0.936 | 0.128 | 0.131 | |
| 2 | 1.730 | 1.607 | 1.888 | 1.921 | 0.315 | 0.325 | 1.801 | 1.544 | 1.498 | 1.901 | 0.265 | 0.262 | ||
| 3 | 1.615 | 1.454 | 1.634 | 2.884 | 0.482 | 0.497 | 1.507 | 1.249 | 1.261 | 2.911 | 0.398 | 0.402 | ||
| 1.5 | 1 | 2.665 | 2.553 | 2.989 | 0.965 | 0.153 | 0.154 | 2.764 | 2.388 | 2.313 | 0.953 | 0.128 | 0.122 | |
| 2 | 2.163 | 1.770 | 1.965 | 1.939 | 0.318 | 0.320 | 2.088 | 1.542 | 1.468 | 1.937 | 0.262 | 0.251 | ||
| 3 | 2.020 | 1.570 | 1.714 | 2.922 | 0.483 | 0.480 | 1.858 | 1.290 | 1.294 | 2.949 | 0.394 | 0.385 | ||
| 1.0 | 0.8 | 1 | 8.602 | 10.109 | 12.768 | 0.912 | 0.146 | 0.171 | 3.867 | 4.601 | 6.288 | 0.953 | 0.112 | 0.117 |
| 2 | 2.287 | 2.389 | 3.112 | 1.891 | 0.298 | 0.317 | 2.378 | 2.381 | 2.455 | 1.868 | 0.257 | 0.263 | ||
| 3 | 1.733 | 1.777 | 2.139 | 2.858 | 0.465 | 0.479 | 1.846 | 1.740 | 1.765 | 2.830 | 0.392 | 0.4 | ||
| 1.0 | 1 | 8.637 | 10.050 | 12.698 | 0.914 | 0.146 | 0.169 | 4.061 | 4.658 | 6.454 | 0.956 | 0.112 | 0.118 | |
| 2 | 2.364 | 2.433 | 3.008 | 1.901 | 0.301 | 0.315 | 2.449 | 2.373 | 2.369 | 1.881 | 0.257 | 0.257 | ||
| 3 | 1.963 | 1.866 | 2.227 | 2.866 | 0.466 | 0.481 | 1.942 | 1.743 | 1.734 | 2.855 | 0.393 | 0.393 | ||
| 1.5 | 1 | 8.611 | 9.785 | 11.740 | 0.922 | 0.147 | 0.165 | 4.376 | 4.830 | 6.260 | 0.961 | 0.114 | 0.116 | |
| 2 | 2.664 | 2.565 | 2.986 | 1.932 | 0.307 | 0.313 | 2.754 | 2.374 | 2.354 | 1.907 | 0.256 | 0.247 | ||
| 3 | 2.300 | 1.987 | 2.252 | 2.903 | 0.471 | 0.471 | 2.245 | 1.757 | 1.689 | 2.892 | 0.390 | 0.373 | ||
| True Value | ||||||||||||||
|---|---|---|---|---|---|---|---|---|---|---|---|---|---|---|
| mean | s.d. | mean | s.d. | mean | s.d. | mean | s.d. | |||||||
| 0.0 | 0.8 | 1 | 0.967 | 0.707 | 0.678 | 0.986 | 0.102 | 0.100 | 0.857 | 0.508 | 0.511 | 0.996 | 0.074 | 0.074 |
| 2 | 0.923 | 0.675 | 0.690 | 1.979 | 0.202 | 0.199 | 0.856 | 0.508 | 0.511 | 1.99 | 0.149 | 0.147 | ||
| 3 | 0.930 | 0.672 | 0.687 | 2.964 | 0.301 | 0.297 | 0.850 | 0.509 | 0.505 | 2.989 | 0.223 | 0.221 | ||
| 1.0 | 1 | 1.129 | 0.719 | 0.701 | 0.991 | 0.101 | 0.100 | 1.046 | 0.519 | 0.524 | 0.998 | 0.073 | 0.073 | |
| 2 | 1.107 | 0.701 | 0.712 | 1.985 | 0.200 | 0.197 | 1.040 | 0.519 | 0.522 | 1.996 | 0.146 | 0.145 | ||
| 3 | 1.104 | 0.705 | 0.706 | 2.976 | 0.301 | 0.297 | 1.042 | 0.518 | 0.521 | 2.994 | 0.22 | 0.218 | ||
| 1.5 | 1 | 1.591 | 0.739 | 0.735 | 0.995 | 0.096 | 0.096 | 1.535 | 0.525 | 0.529 | 0.999 | 0.069 | 0.069 | |
| 2 | 1.584 | 0.735 | 0.746 | 1.990 | 0.192 | 0.191 | 1.545 | 0.525 | 0.525 | 1.994 | 0.137 | 0.138 | ||
| 3 | 1.566 | 0.735 | 0.738 | 2.990 | 0.289 | 0.284 | 1.532 | 0.525 | 0.53 | 2.998 | 0.206 | 0.209 | ||
| 0.5 | 0.8 | 1 | 1.287 | 1.252 | 1.402 | 0.979 | 0.092 | 0.092 | 1.058 | 0.931 | 0.992 | 0.989 | 0.069 | 0.068 |
| 2 | 1.057 | 0.907 | 0.961 | 1.968 | 0.193 | 0.192 | 0.915 | 0.681 | 0.705 | 1.988 | 0.144 | 0.143 | ||
| 3 | 1.003 | 0.816 | 0.853 | 2.957 | 0.293 | 0.290 | 0.882 | 0.622 | 0.621 | 2.984 | 0.22 | 0.215 | ||
| 1.0 | 1 | 1.435 | 1.304 | 1.424 | 0.983 | 0.093 | 0.091 | 1.202 | 0.967 | 1.020 | 0.993 | 0.069 | 0.069 | |
| 2 | 1.195 | 0.944 | 0.974 | 1.980 | 0.195 | 0.190 | 1.095 | 0.714 | 0.724 | 1.993 | 0.145 | 0.142 | ||
| 3 | 1.178 | 0.860 | 0.883 | 2.969 | 0.295 | 0.293 | 1.068 | 0.644 | 0.641 | 2.992 | 0.219 | 0.216 | ||
| 1.5 | 1 | 1.850 | 1.432 | 1.513 | 0.991 | 0.094 | 0.093 | 1.656 | 1.058 | 1.095 | 0.997 | 0.07 | 0.069 | |
| 2 | 1.639 | 1.022 | 1.041 | 1.991 | 0.194 | 0.192 | 1.560 | 0.748 | 0.755 | 1.998 | 0.141 | 0.141 | ||
| 3 | 1.637 | 0.921 | 0.930 | 2.984 | 0.290 | 0.287 | 1.563 | 0.666 | 0.673 | 2.994 | 0.209 | 0.209 | ||
| 1.0 | 0.8 | 1 | 2.469 | 2.839 | 3.670 | 0.972 | 0.084 | 0.086 | 2.445 | 2.674 | 2.689 | 0.967 | 0.068 | 0.066 |
| 2 | 1.287 | 1.265 | 1.403 | 1.960 | 0.185 | 0.183 | 1.044 | 0.938 | 0.981 | 1.980 | 0.138 | 0.134 | ||
| 3 | 1.102 | 1.001 | 1.067 | 2.953 | 0.285 | 0.282 | 0.963 | 0.759 | 0.778 | 2.975 | 0.213 | 0.207 | ||
| 1.0 | 1 | 2.586 | 2.954 | 3.590 | 0.974 | 0.085 | 0.086 | 2.542 | 2.683 | 2.666 | 0.971 | 0.068 | 0.066 | |
| 2 | 1.439 | 1.323 | 1.434 | 1.967 | 0.186 | 0.186 | 1.224 | 0.982 | 1.015 | 1.984 | 0.139 | 0.138 | ||
| 3 | 1.290 | 1.064 | 1.121 | 2.959 | 0.288 | 0.283 | 1.145 | 0.796 | 0.824 | 2.979 | 0.214 | 0.213 | ||
| 1.5 | 1 | 2.962 | 3.118 | 3.723 | 0.979 | 0.086 | 0.086 | 2.810 | 2.701 | 2.610 | 0.976 | 0.069 | 0.064 | |
| 2 | 1.844 | 1.429 | 1.509 | 1.982 | 0.188 | 0.186 | 1.658 | 1.063 | 1.069 | 1.993 | 0.14 | 0.136 | ||
| 3 | 1.704 | 1.147 | 1.178 | 2.980 | 0.289 | 0.284 | 1.597 | 0.841 | 0.848 | 2.994 | 0.211 | 0.211 | ||
| Dataset | n | S | |||||
|---|---|---|---|---|---|---|---|
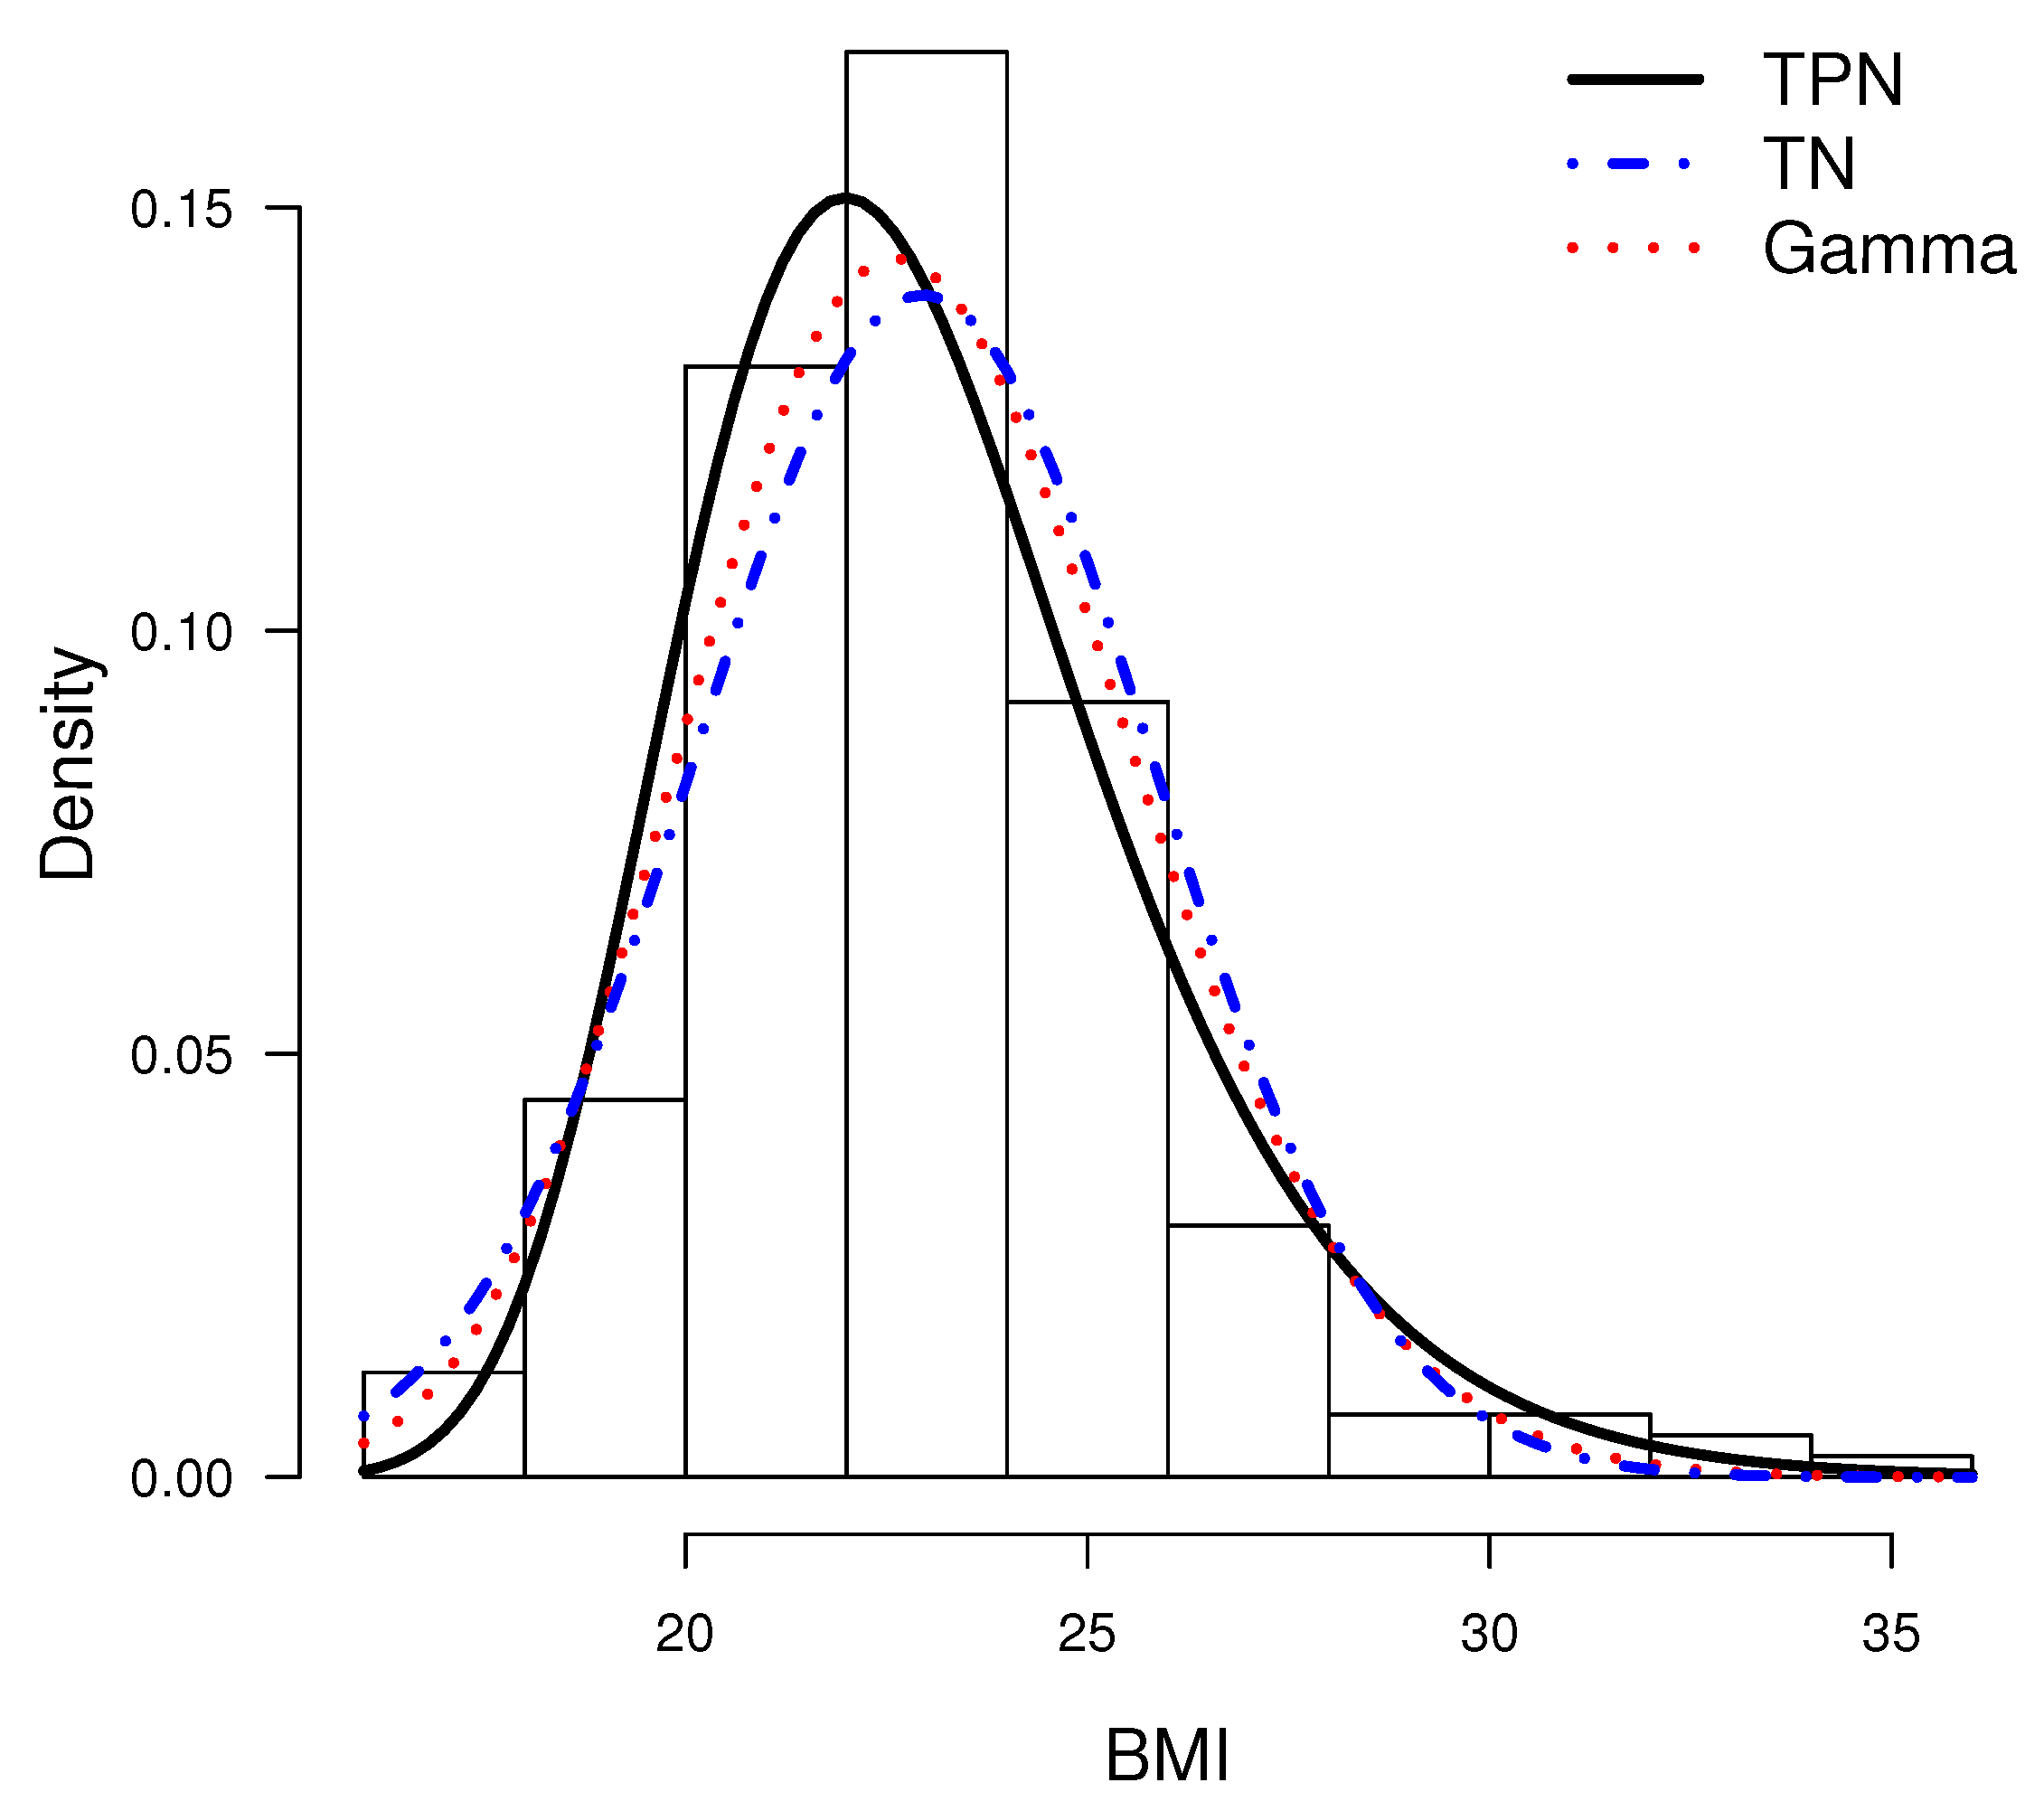
| BMI | 202 |
| Estimates | Weibull | Gamma | GHN | TPN | TPN | TN |
|---|---|---|---|---|---|---|
| 7.676 (0.229) | 1.050 (0.142) | |||||
| 433.809 (109.878) | - | |||||
| - | - | - | - | - | 8.035 (0.406) | |
| c | - | - | - | 0 (-) | 16 (-) | - |
| log-likelihood | ||||||
| AIC |
| Data Set | n | S | |||||
|---|---|---|---|---|---|---|---|
| BSFC | 66 |
| Estimates | BS | -BS | EHN | TPN | PHN |
|---|---|---|---|---|---|
| - | - | 0.570 (0.118) | |||
| 1.581 (0.913) | |||||
| - | - | - | |||
| a | - | - | - | - | |
| b | - | - | - | - | |
| log-likelihood | |||||
| AIC |
© 2018 by the authors. Licensee MDPI, Basel, Switzerland. This article is an open access article distributed under the terms and conditions of the Creative Commons Attribution (CC BY) license (http://creativecommons.org/licenses/by/4.0/).
Share and Cite
Castillo, N.O.; Gallardo, D.I.; Bolfarine, H.; Gómez, H.W. Truncated Power-Normal Distribution with Application to Non-Negative Measurements. Entropy 2018, 20, 433. https://doi.org/10.3390/e20060433
Castillo NO, Gallardo DI, Bolfarine H, Gómez HW. Truncated Power-Normal Distribution with Application to Non-Negative Measurements. Entropy. 2018; 20(6):433. https://doi.org/10.3390/e20060433
Chicago/Turabian StyleCastillo, Nabor O., Diego I. Gallardo, Heleno Bolfarine, and Héctor W. Gómez. 2018. "Truncated Power-Normal Distribution with Application to Non-Negative Measurements" Entropy 20, no. 6: 433. https://doi.org/10.3390/e20060433
APA StyleCastillo, N. O., Gallardo, D. I., Bolfarine, H., & Gómez, H. W. (2018). Truncated Power-Normal Distribution with Application to Non-Negative Measurements. Entropy, 20(6), 433. https://doi.org/10.3390/e20060433


