2.1. Gaussian Graphical Models
The independence graph for a probability distribution on three univariate random variables,
has three vertices and three possible edges, as described in
Table 1. Let
.
Graphical models represent the conditional independences present in a probability distribution, as described in
Table 1.
Suppose that
has a multivariate Gaussian distribution with mean vector
, positive definite covariance matrix
and p.d.f.
. There is no loss of generality in assuming that each component of
has mean zero and variance equal to 1 [
12]. If we let the covariance (correlation) between
and
be
p, between
and
Y be
q and between
and
Y be r, then the covariance (correlation) matrix for
is
and we require that
are each less than 1, and to ensure positive definiteness we require also that
Conditional independences are specified by setting certain off-diagonal entries to zero in the inverse covariance matrix, or concentration matrix,
([
13], p. 164). Given our assumptions about the covariance matrix of
Z, this concentration matrix is
where
We now illustrate using these Gaussian graphical models how conditional independence constraints also impose constraints on marginal distributions of the type required, and we use the Gaussian graphical models and to do so.
Since is multivariate Gaussian and has a zero mean vector, the distribution of is specified via its covariance matrix . Hence, fitting any of the Gaussian graphical models involves estimating the relevant covariance matrix by taking the conditional independence constraints into account. Let and be the covariance and concentration matrices of the fitted model .
We begin with the saturated model which has a fully connected graph and no constraints of conditional independence. Therefore, there is no need to set any entries of the concentration matrix K to zero, and so = . That is: model is equal to the given model for .
Now consider model
. In this model there is no edge between
and
Y and so
and
Y are conditionally independent given
. This conditional independence is enforced by ensuring that the [1, 3] and [3, 1] entries in
are zero. The other elements in
remain to be determined. Therefore
has the form
Given the form of
,
has the form
where
is to be determined. Notice that only the [1, 3] and [3, 1] entries in
have been changed from the given covariance matrix
, since the [1, 3] and [3, 1] entries of
have been set to zero. An exact solution is possible. The inverse of
is
Since the [1, 3] entry in
must be zero, we obtain the solution that
and so the estimated covariance matrix for model
is
The estimated covariance matrices for the other models can be obtained exactly using a similar argument.
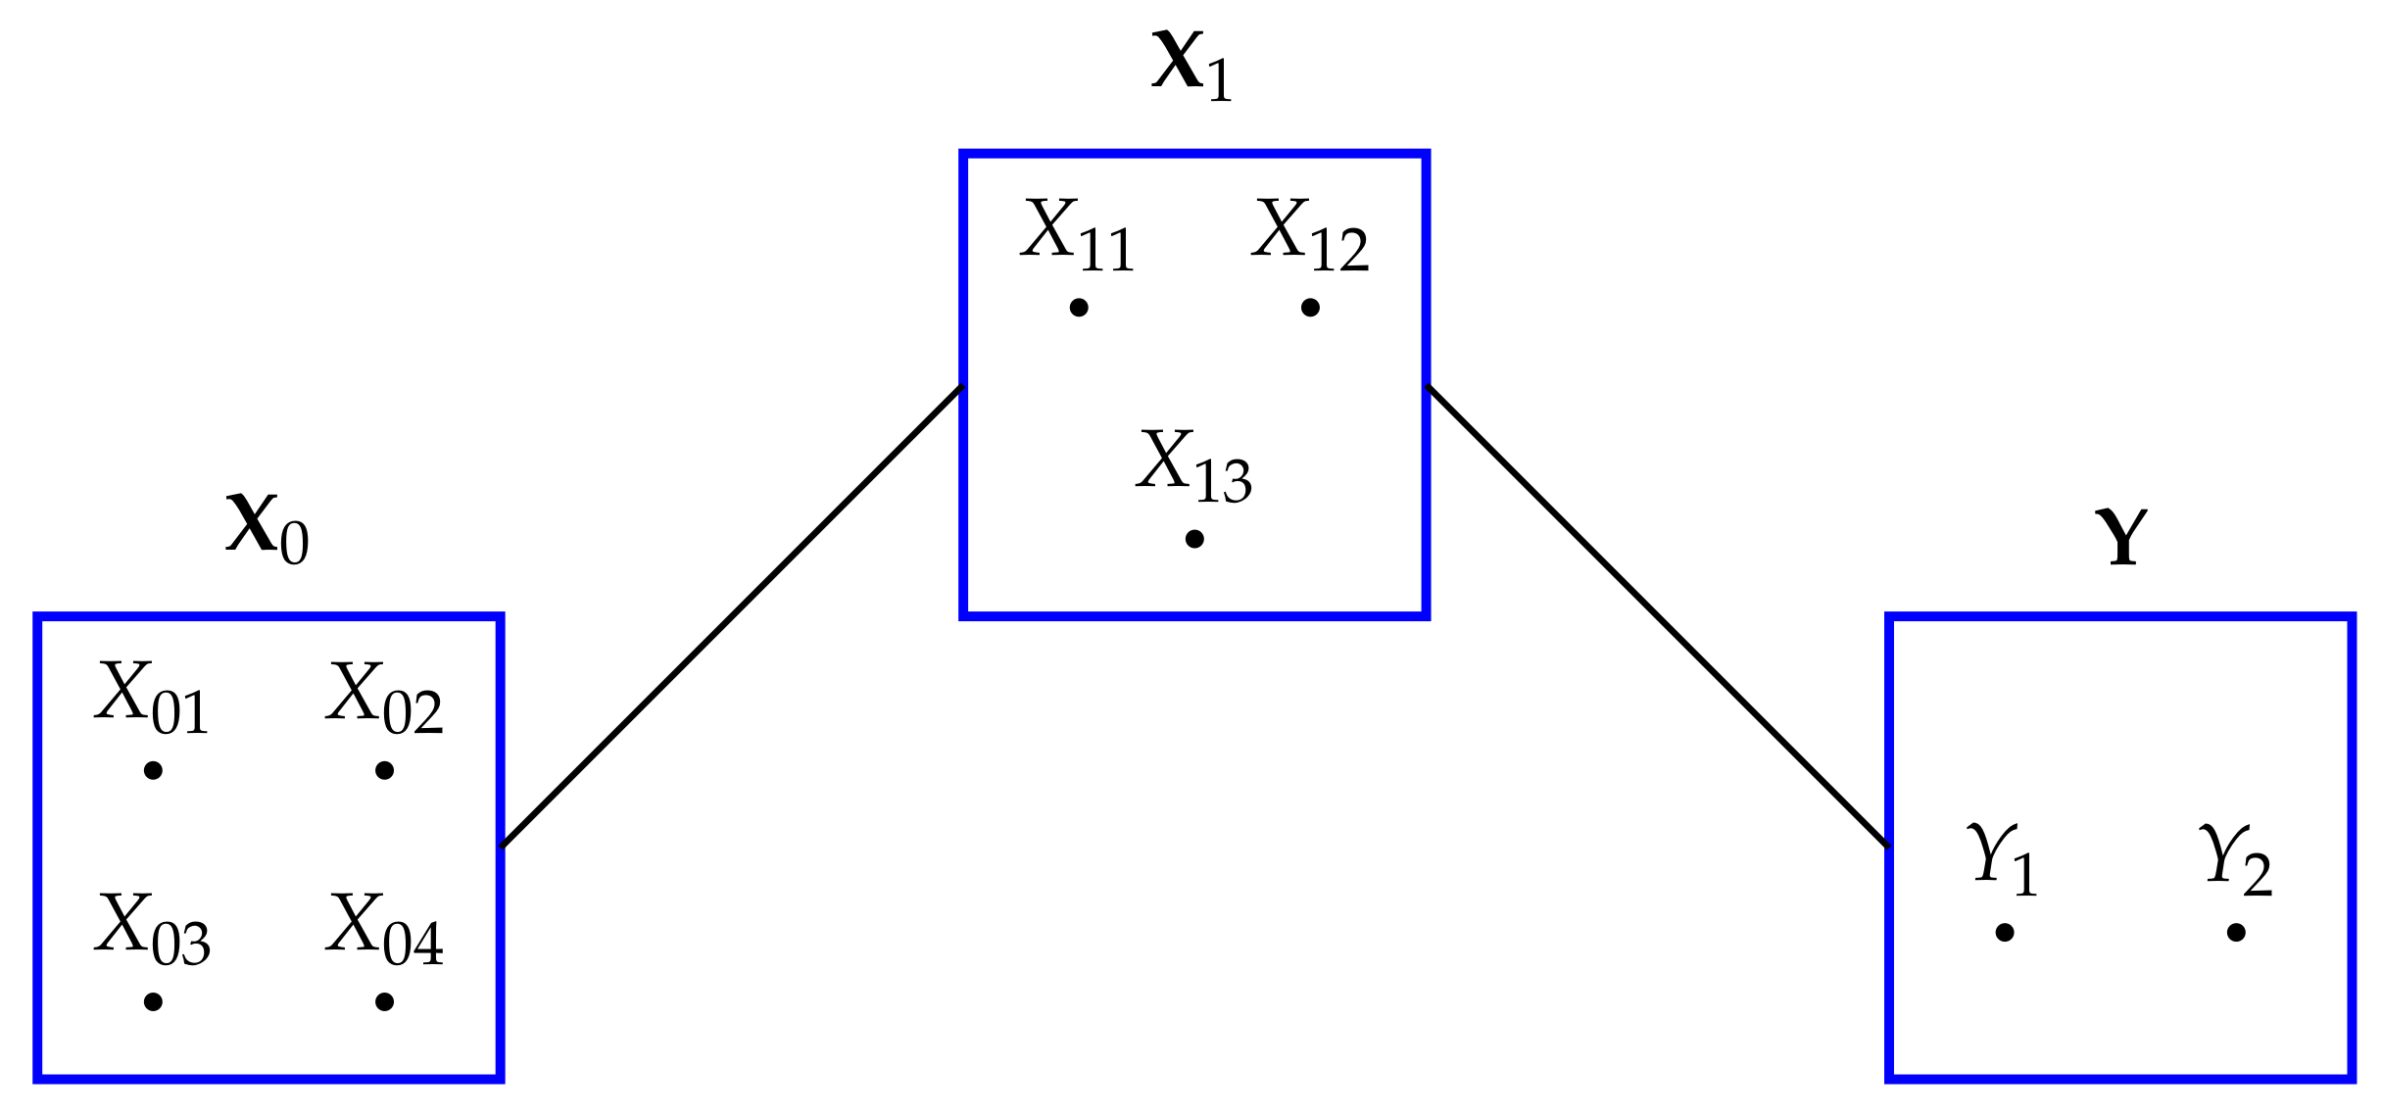
Model
contains the marginal distributions of
,
,
Y,
and
. It is important to note that these marginal distributions are exactly the same as in the given multivariate Gaussian distribution for
, which has covariance matrix
. To see this we use a standard result on the marginal distribution of a sub-vector of a multivariate Gaussian distribution [
24], p. 63.
The covariance matrix of the marginal distribution
is equal to the upper-left 2 by 2 sub-matrix of
, which is also equal to the same sub-matrix in
in (
16). This means that this marginal distribution in model
is equal to the corresponding marginal distribution in the distribution of
Z. The covariance matrix of the marginal distribution
is equal to the lower-right 2 by 2 sub-matrix of
, which is also equal to the same sub-matrix in
in (
16), and so the
marginal distribution in model
matches the corresponding marginal distribution in the distribution of
Z. Using similar arguments, such equality is also true for the other marginal distributions in model
.
Looking at (
17), we see that setting to [1, 3] of
K entry to zero gives
. Therefore, simply imposing this conditional independence constraint also gives the required estimated covariance matrix
.
It is generally true ([
13], p.176) that applying the conditional independence constraints is sufficient and it also leads to the marginal distributions in the fitted model being exactly the same as the corresponding marginal distributions in the given distribution of
. For example, in (
19) we see that the only elements in
that are altered are the [1, 3] and [3, 1] entries and these entries corresponds exactly to the zero [1, 3] and [3, 1] entries in
. That is: the location of zeroes in
determines which entries in
will be changed; the remaining entries of
are unaltered and therefore this fixes the required marginal distributions. Therefore, in
Section 2.2, we will determine the required maximum entropy solutions by simply applying the necessary conditional independence constraints together with the other required constraints.
We may express the combination of the constraints on marginal distributions and the constraints imposed by conditional independences as follows [
16]. For model
, the
th entry of
is given by
where
is the edge set for model
(see
Table 1). For model
, the conditional independences are imposed by setting the
th entry of
to zero whenever
Before moving on to derive the maximum entropy distributions, we consider the conditional independence constraints in model
. In model
we see from
Table 1 that this model has no edge between
and
and none between
and
Y. Hence,
and
are conditionally independent given
Y and also
and
Y are conditionally independent given
. Hence, in
K in (
17) we set the [1, 2] and [2, 3] (and the [2, 1] and [3, 2]) entries to zero to enforce these conditional independences. That is:
and
. Taken together these equations give that
and
, and so the estimated covariance matrix for model
is
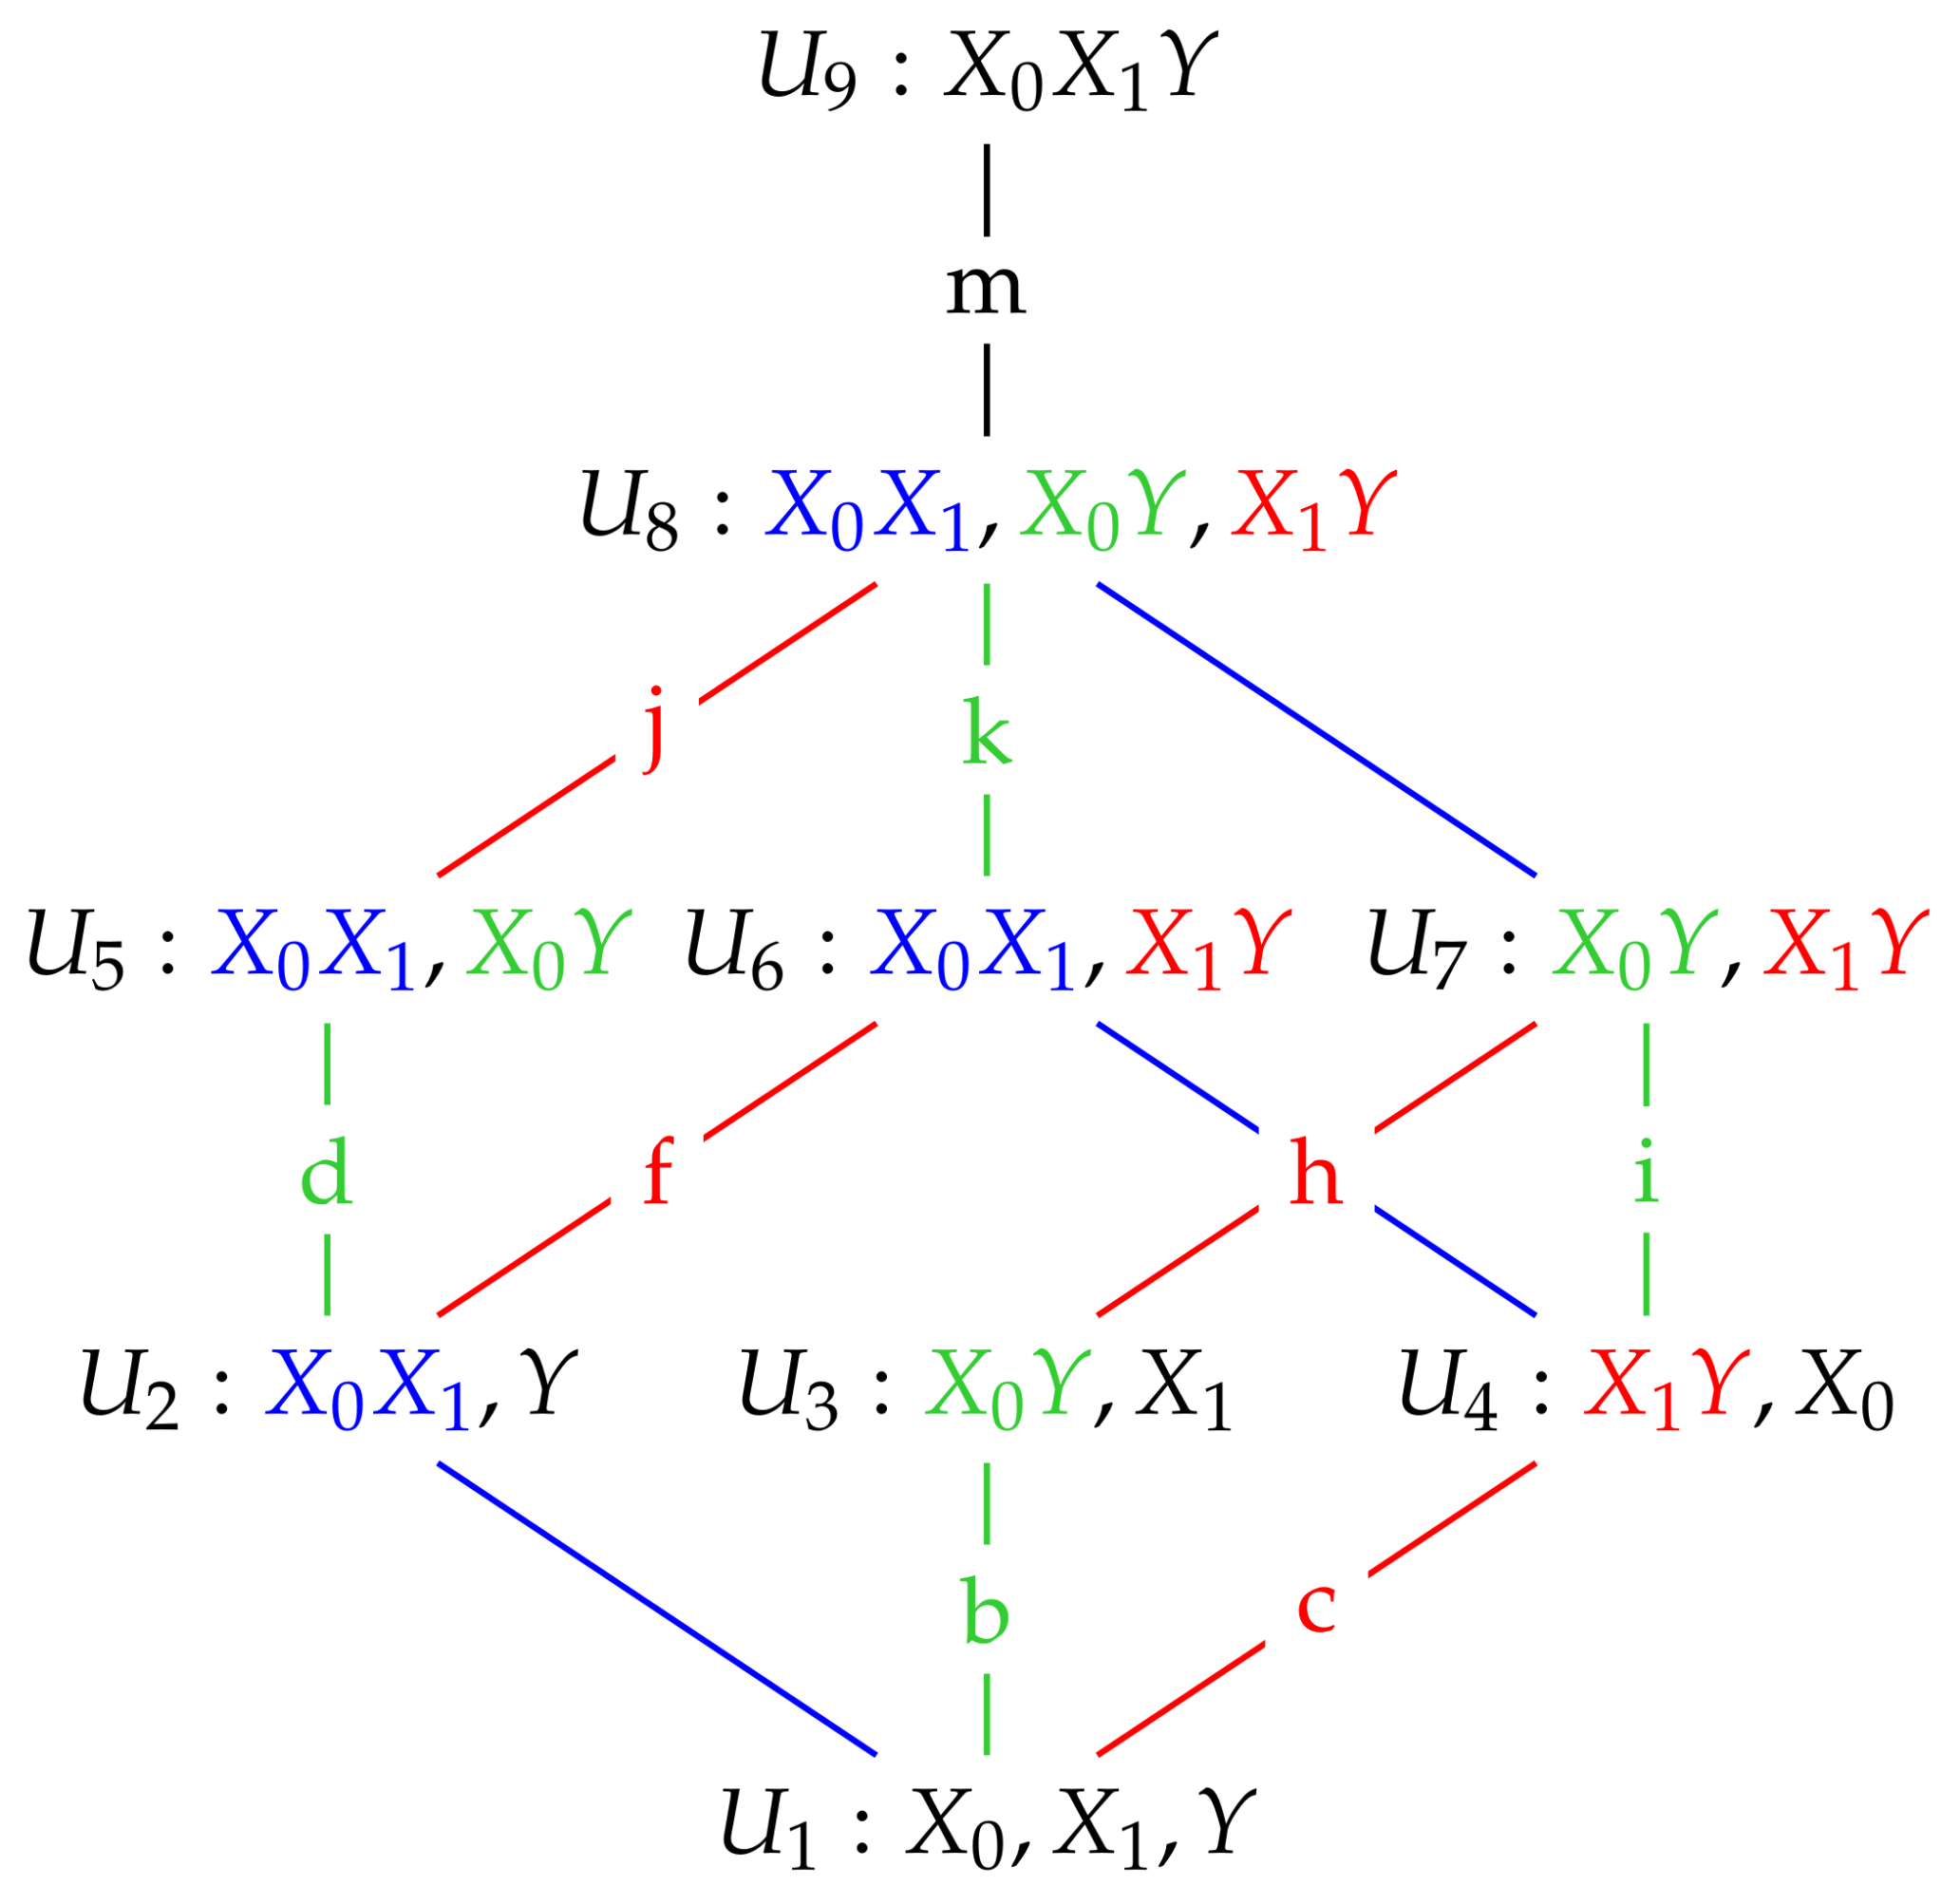
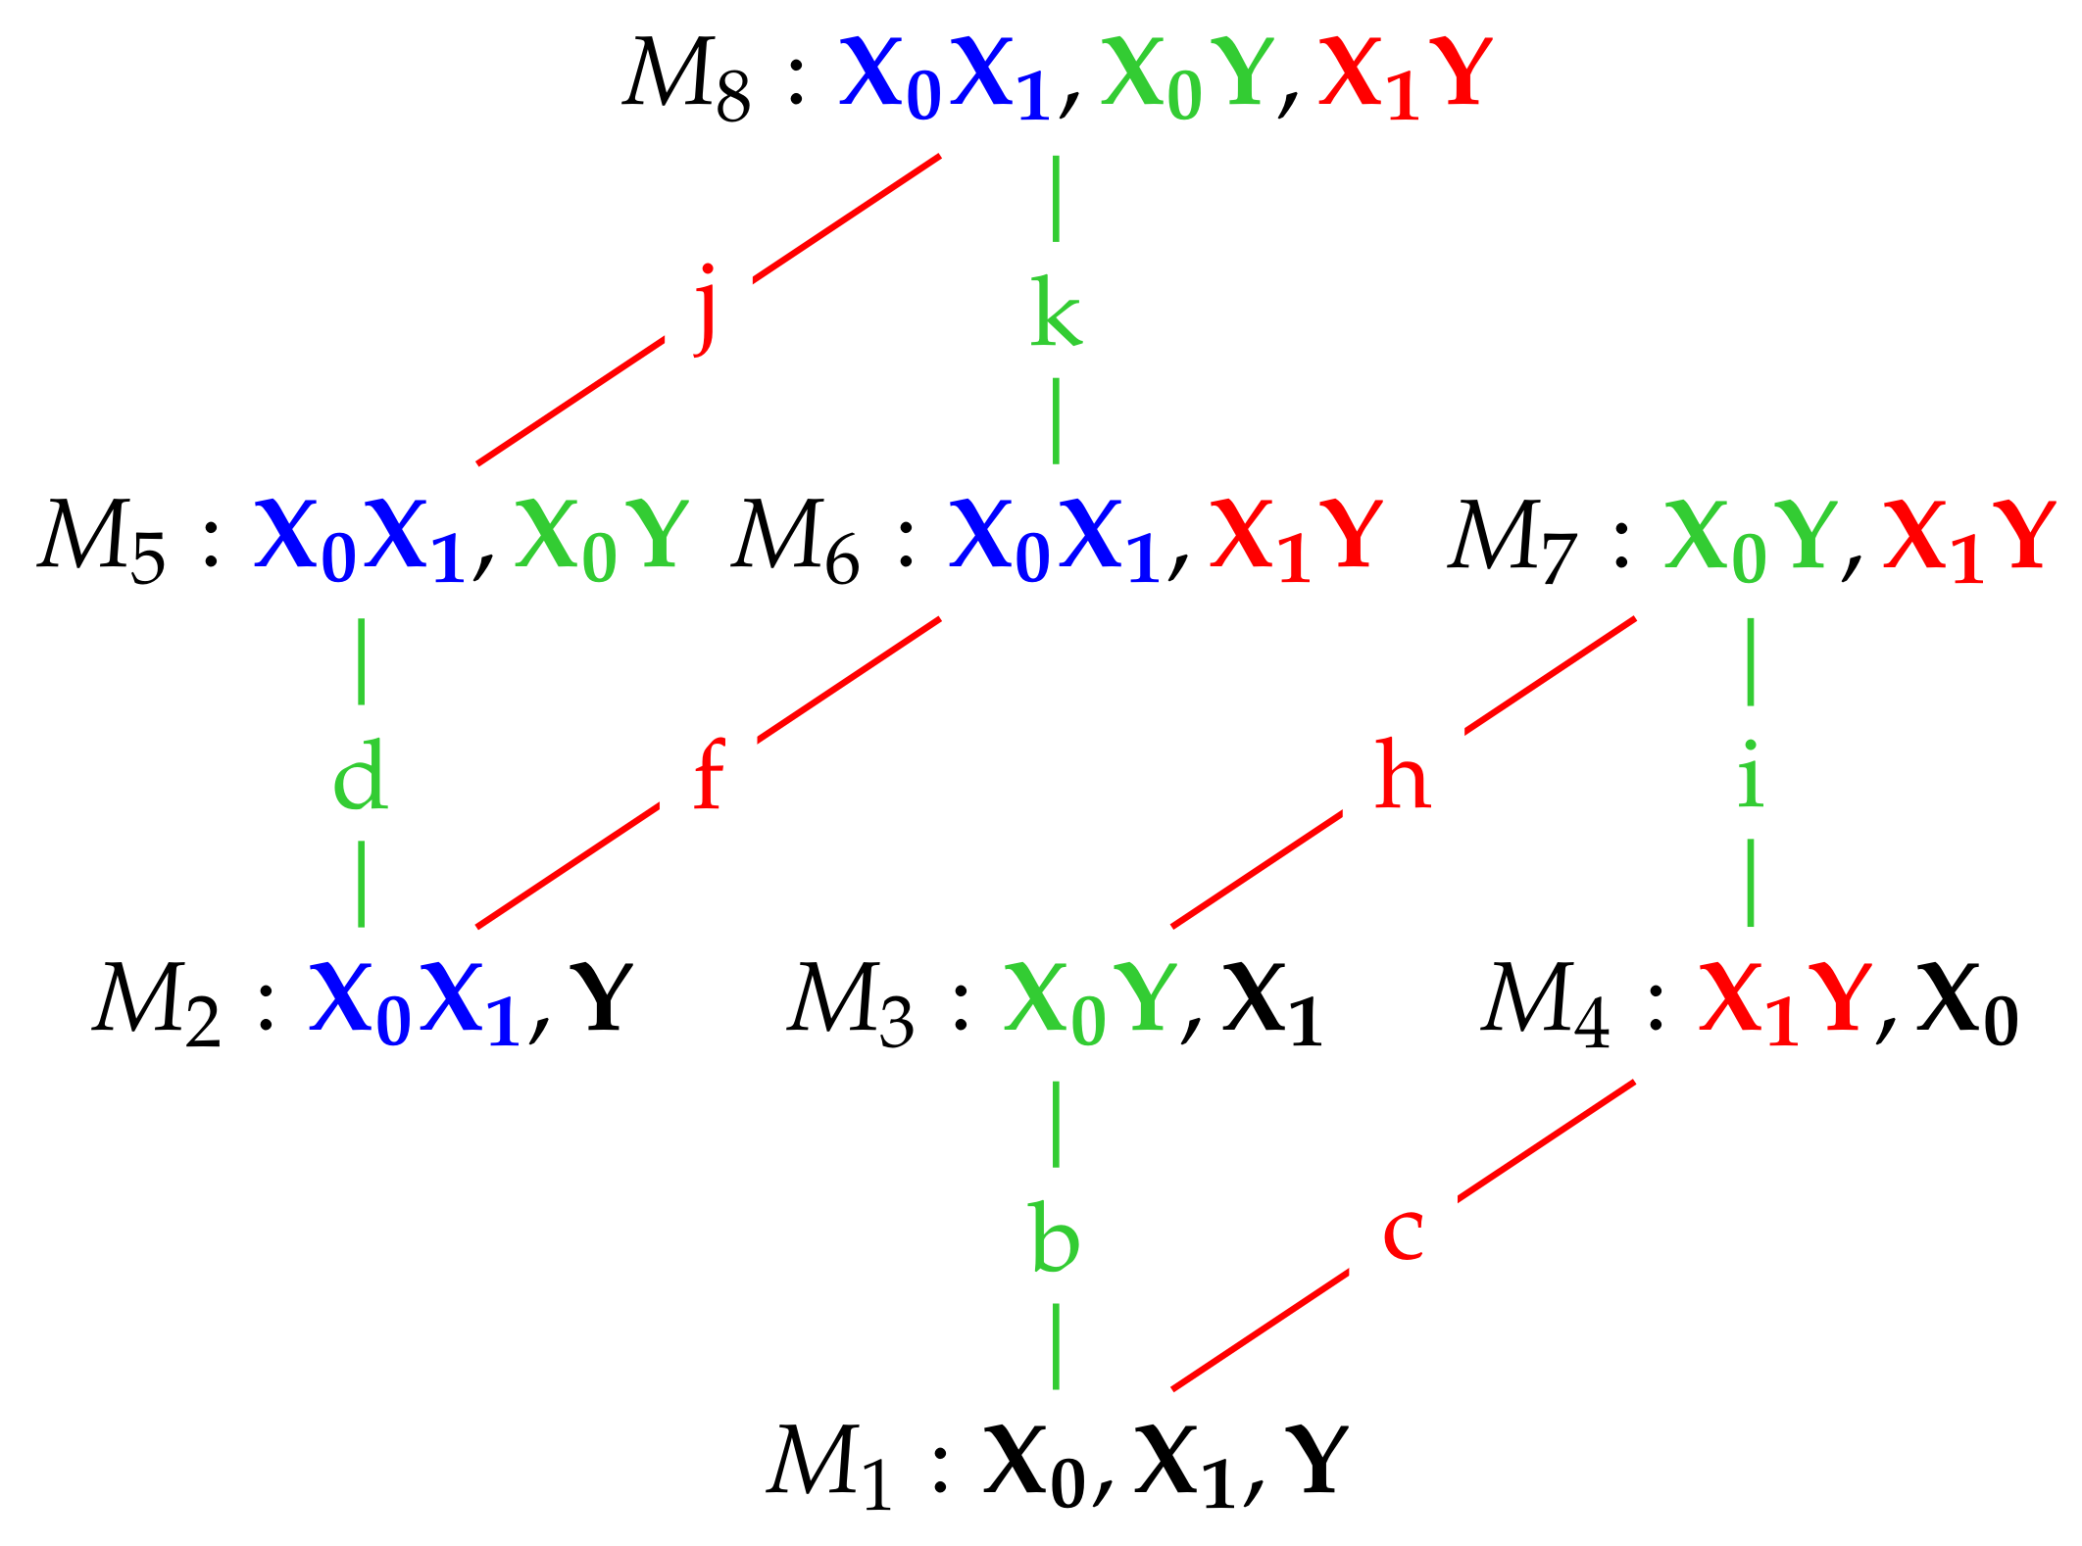
We also note that model
in
Figure 1 also possesses the same conditional independences as
. This is true for all of the maximum entropy models
, and so when finding the nature of these models in the next section we apply in each case the conditional independence constraints satisfied by the graphical model
.
2.2. Maximum Entropy Distributions
We are given the distribution of
Z which is multivariate Gaussian with zero mean vector and covariance matrix
in (
16), and has p.d.f.
For each of the models
, we will determine the p.d.f. of the maximum entropy solution
subject to the constraints
and the separate constraint for model
as well as the conditional independence constraints given in
Table 2.
We begin with model
. As shown in the previous section, the estimated covariance matrix for model
,
, is equal to the covariance matrix of
,
. By a well-known result [
25], the solution is that
is multivariate Gaussian with mean vector zero and covariance matrix,
. That is:
is equal to the given distribution of
.
For model
, the conditional independence constraint is
and so
Hence, using a similar argument to that for , the maximum entropy solution for model is multivariate Gaussian with zero mean vector and covariance matrix , and so is equal to the model .
In model , the conditional independence constraints are and so and .
Therefore,
and the maximum entropy solution for
is multivariate Gaussian with zero mean vector and covariance matrix
, and so is equal to
. The derivations for the other maximum entropy models are similar, and we state the results in Proposition 1.
Proposition 1. The distributions of maximum entropy, , subject to the constraints (23)–(24) and the conditional independence constraints in Table 2, are trivariate Gaussian graphical models having mean vector and with the covariance matrices given above in Table 3. The estimated covariance matrices in
Table 3 were inverted to give the corresponding concentration matrices, which are also given in
Table 3. They indicate by the location of the zeroes that the conditional independences have been appropriately applied in the derivation of the results in Proposition 1.
It is important to check that the relevant bivariate and univariate marginal distributions are the same in all of the models in which a particular constraint has been added For example, the
constraint is present in models
The marginal bivariate
distribution has zero mean vector and so is determined by the upper-left 2 by 2 sub-matrix of the estimated covariance matrices,
([
24], p. 63). Inspection of
Table 3 shows that this sub-matrix is equal to
in all four models. Thus, the bivariate distribution of
is the same in all four models in which this dependency constraint is fitted. It is also the same as in the original distribution, which has covariance matrix
in (
16). Further examination of
Table 3 shows equivalent results for the
and
bivariate marginal distributions. The univariate term
Y is present in all eight models. The univariate distribution of
Y has mean zero and so is determined by the [3, 3] element of the estimated covariance matrices
([
24], p. 63). Looking at the
column, we see that the variance of
Y is equal to 1 in all eight models, and so the marginal distribution of
Y is the same in all eight models. In particular, this is true in the original distribution, which has covariance matrix
in (
16).
2.5. Some Examples
Example 1. We consider the PID when
When
, we see from
Table 4 that
and
, so unq0 = 0, and since
the redundancy component is also zero. The unique information, unq1, and the synergy component, syn, are equal to
respectively. The
PID is exactly the same as the
PID.
Example 2. We consider the PID when
When
, we see from
Table 5 that
and also that
because
since
It follows that
, and that the synergy component is equal to
Since
, from (
29), the redundancy component is zero, as is unq1. The
PID is exactly the same as the
PID.
Example 3. We consider the PID when
Under the stated conditions, it is easy to show that
and
and so the minimum edge value is attained at
i. Using the results in
Table 5 and (
29)–(
31), we may write down the
PID as follows.
For this situation, the PID takes two different forms, depending on whether or not . Neither form is the same as the PID.
Example 4. Compare the and PIDs when , and .
The PIDs are given in the following table.
| PID | unq0 | unq1 | red | syn |
| 0.2877 | 0.2877 | 0.1981 | 0.4504 |
| 0 | 0 | 0.4587 | 0.7380 |
There is a stark contrast between the two PIDs in this system. Since , the PID has two zero unique informations, whereas has equal values for the uniques but they are quite large. The PID gives much larger values for the redundancy and synergy components than does the PID. In order to explore the differences between these PIDs, 50 random samples were generated from a multivariate normal distribution having correlations The sample estimates of were and the sample PIDs are
| PID | unq0 | unq1 | red | syn |
| 0.2324 | 0.3068 | 0.1623 | 0.4921 |
| 0 | 0.0744 | 0.3948 | 0.7245 |
We now apply tests of deviance in order to test model
within the saturated model
. The null hypothesis being tested is that model
is true (see
Appendix E). The results of applying tests of deviance ([
13], p. 185), in which each of models
is tested against the saturated model
, produced approximate
p values that were close to zero (
) for all but model
which had a
p value of
. This suggests that none of the models
provides an adequate fit to the data and so model
provides the best description. The results of testing
and
within model
gave strong evidence to suggest that the interaction terms
and
are required to describe the data, and that each term makes a significant contribution in addition to the presence of the other term. Therefore, one would expect to find fairly sizeable unique components in a PID, and so the
PID seems to provide a more sensible answer in this example. One would also expect synergy to be present, and both PIDs have a large, positive synergy component.
Example 5. Prediction of grip strength
Some data concerning the prediction of grip strength from physical measurements was collected from 84 male students at Glasgow University. Let Y be the grip strength, be the bicep circumference and the forearm circumference. The following correlations between each pair of variables were calculated: and PIDs applied with the following results.
| PID | unq0 | unq1 | red | syn |
| 0.0048 | 0.1476 | 0.3726 | 0 |
| 0 | 0.1427 | 0.3775 | 0.0048 |
The
and
PIDs are very similar, and the curious fact that unq0 in
is equal to the synergy in
is no accident, It is easy to show this connection theoretically by examining the results in (
30)–(
31) and
Table 5; that is, the sum of unq0 and syn in the
PID or the sum of unq1 and syn in the
PID is equal to the synergy value in the
PID. This happens because the
PID must have a zero unique component.
These PIDs indicate that there is almost no synergy among the three variables, which makes sense because the value of
is close to zero, and this suggests that
and
Y are conditionally independent given
. On the other hand,
is 0.1427 which suggests that
and
Y are not conditionally independent given
, and so both terms
and
are of relevance in explaining the data, which is the case in model
This model has
and therefore no synergy and also a zero unique value in relation to
. The results of applying tests of deviance ([
13], p. 185), in which each of models
is tested within the saturated model
, show that the approximate
p values are close to zero (
) for all models except
and
. The
p value for the model
is
, while the
p value for the test of
against
is approximately 0.45. Thus, there is strong evidence to reject all the models except model
and this suggests that model
provides a good fit to data, and this alternative viewpoint provides support for the form of both PIDs.
2.6. Graphical Illustrations
We present some graphical illustrations of the
PID and compare it to the
PID; see
Section 1.1.1 and
Section 1.2 for definitions of these PIDs.
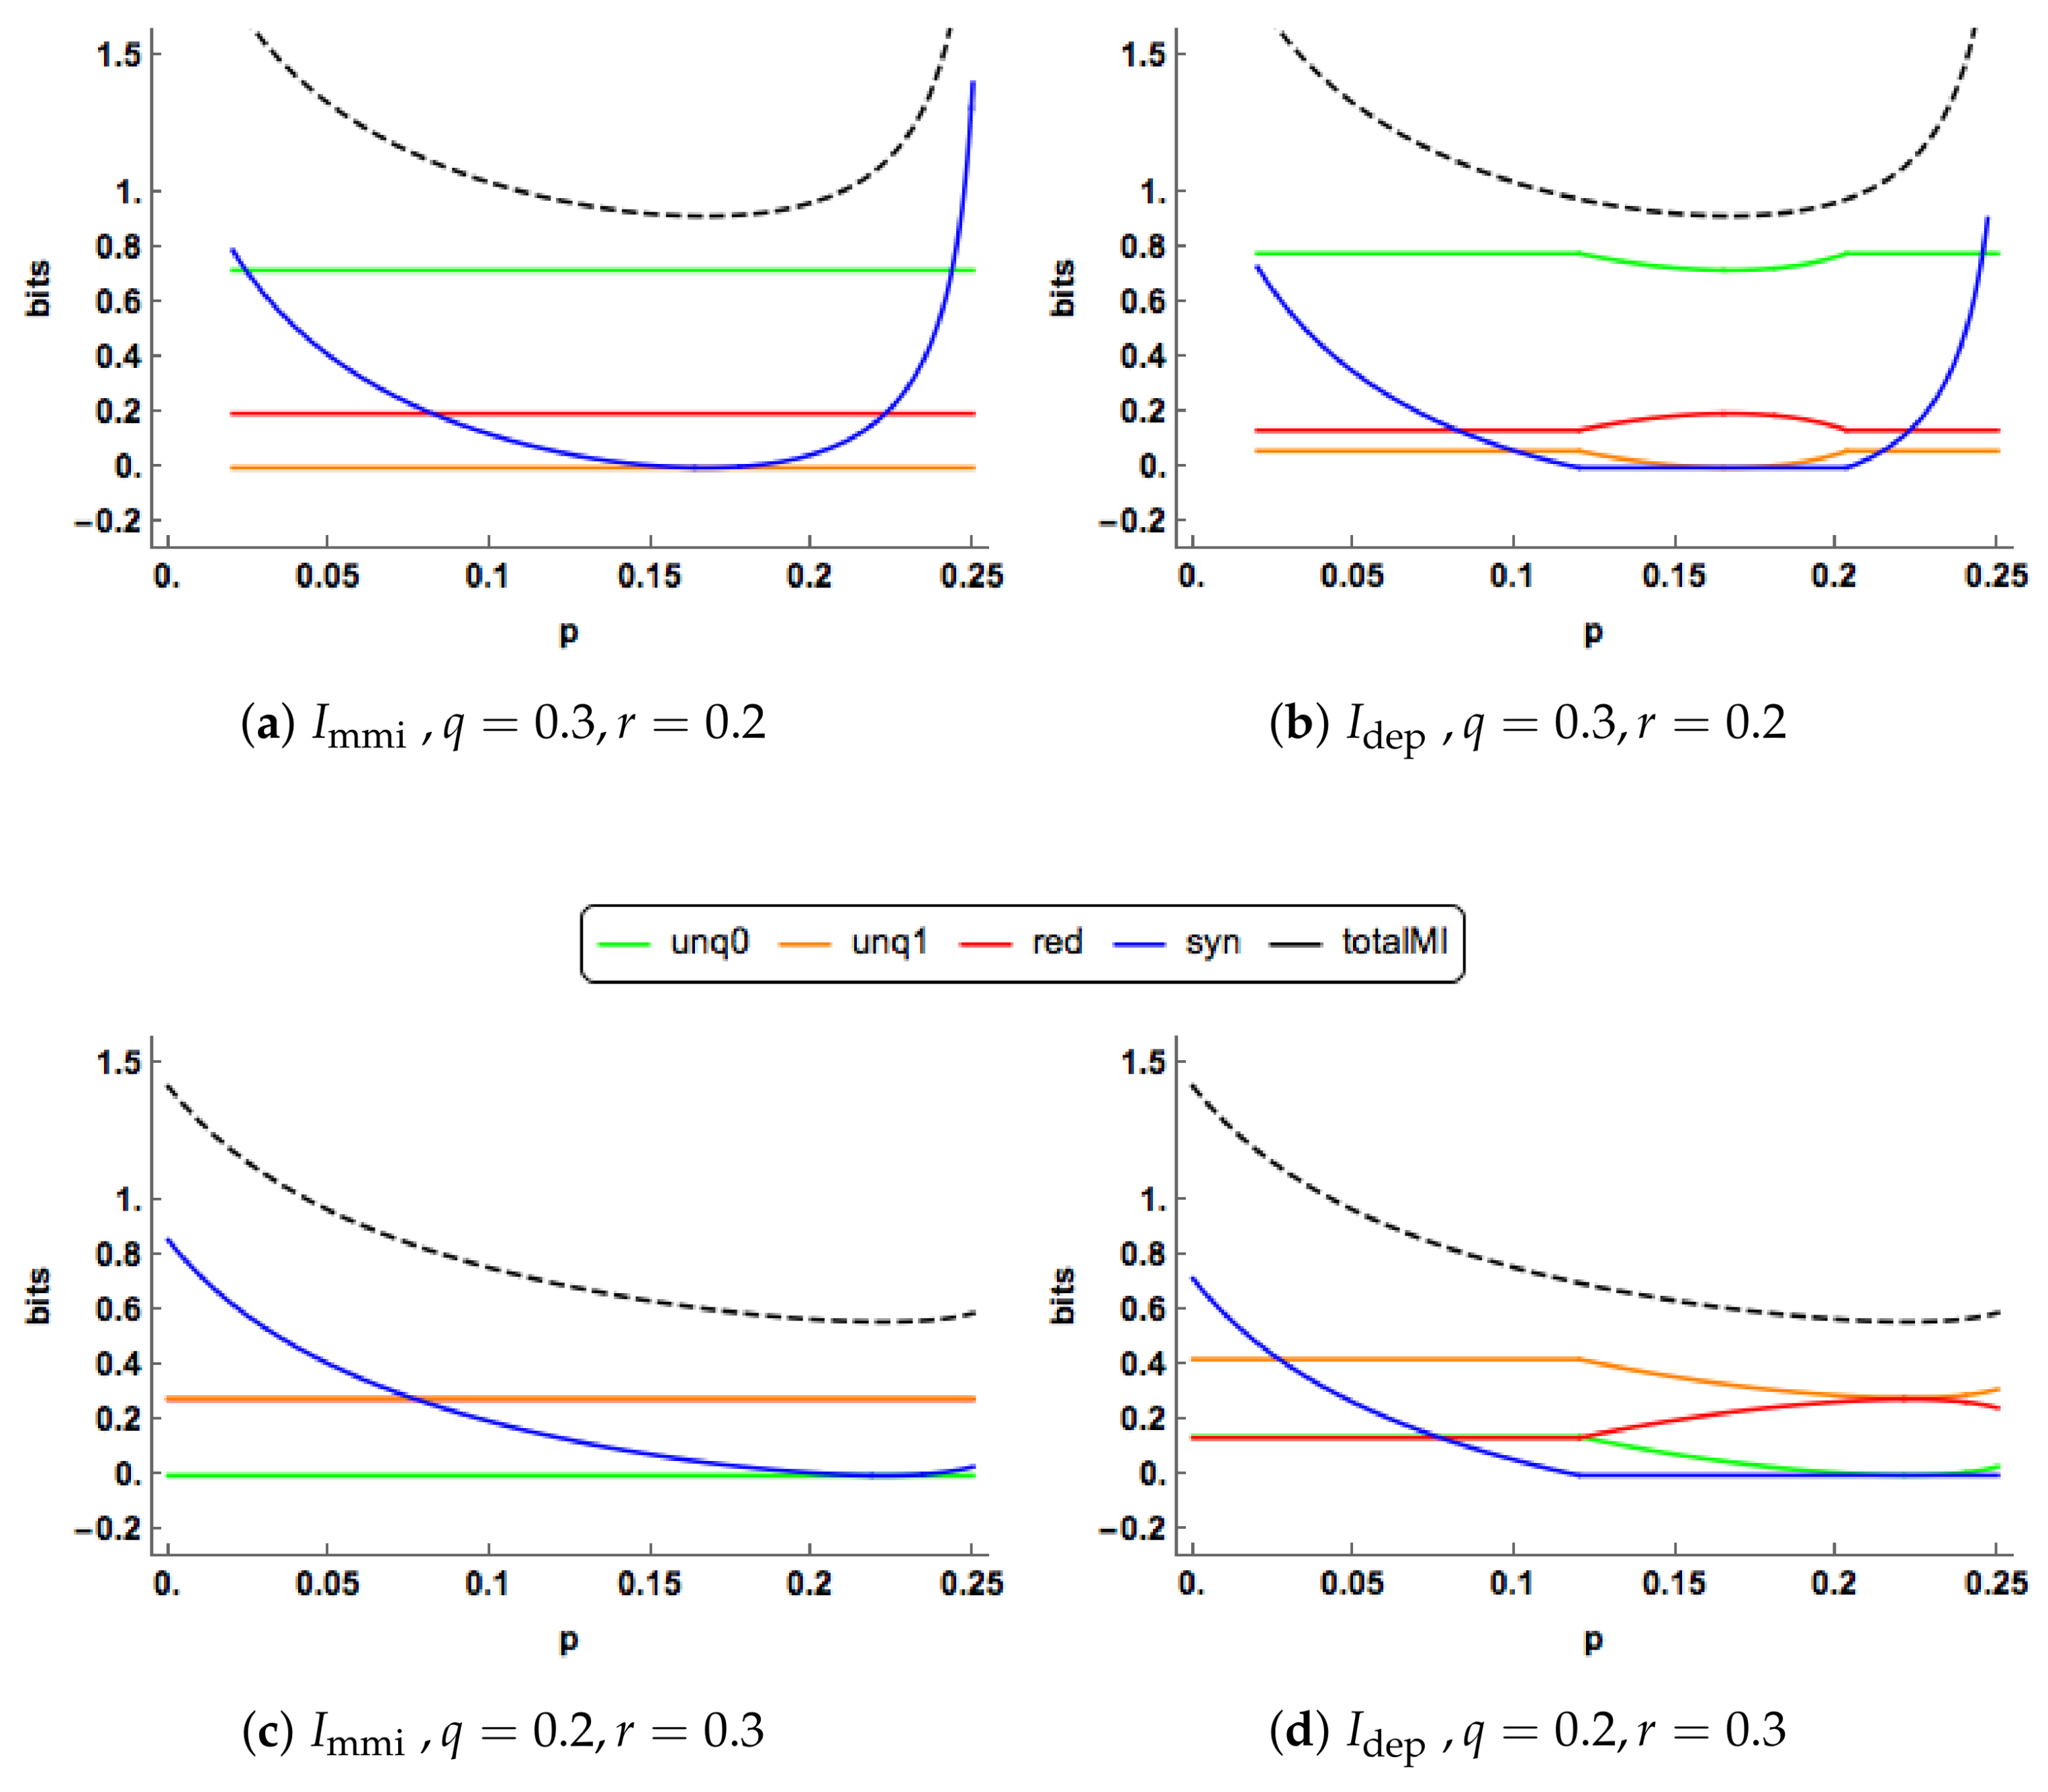
Since
, both the
unique informations are zero in
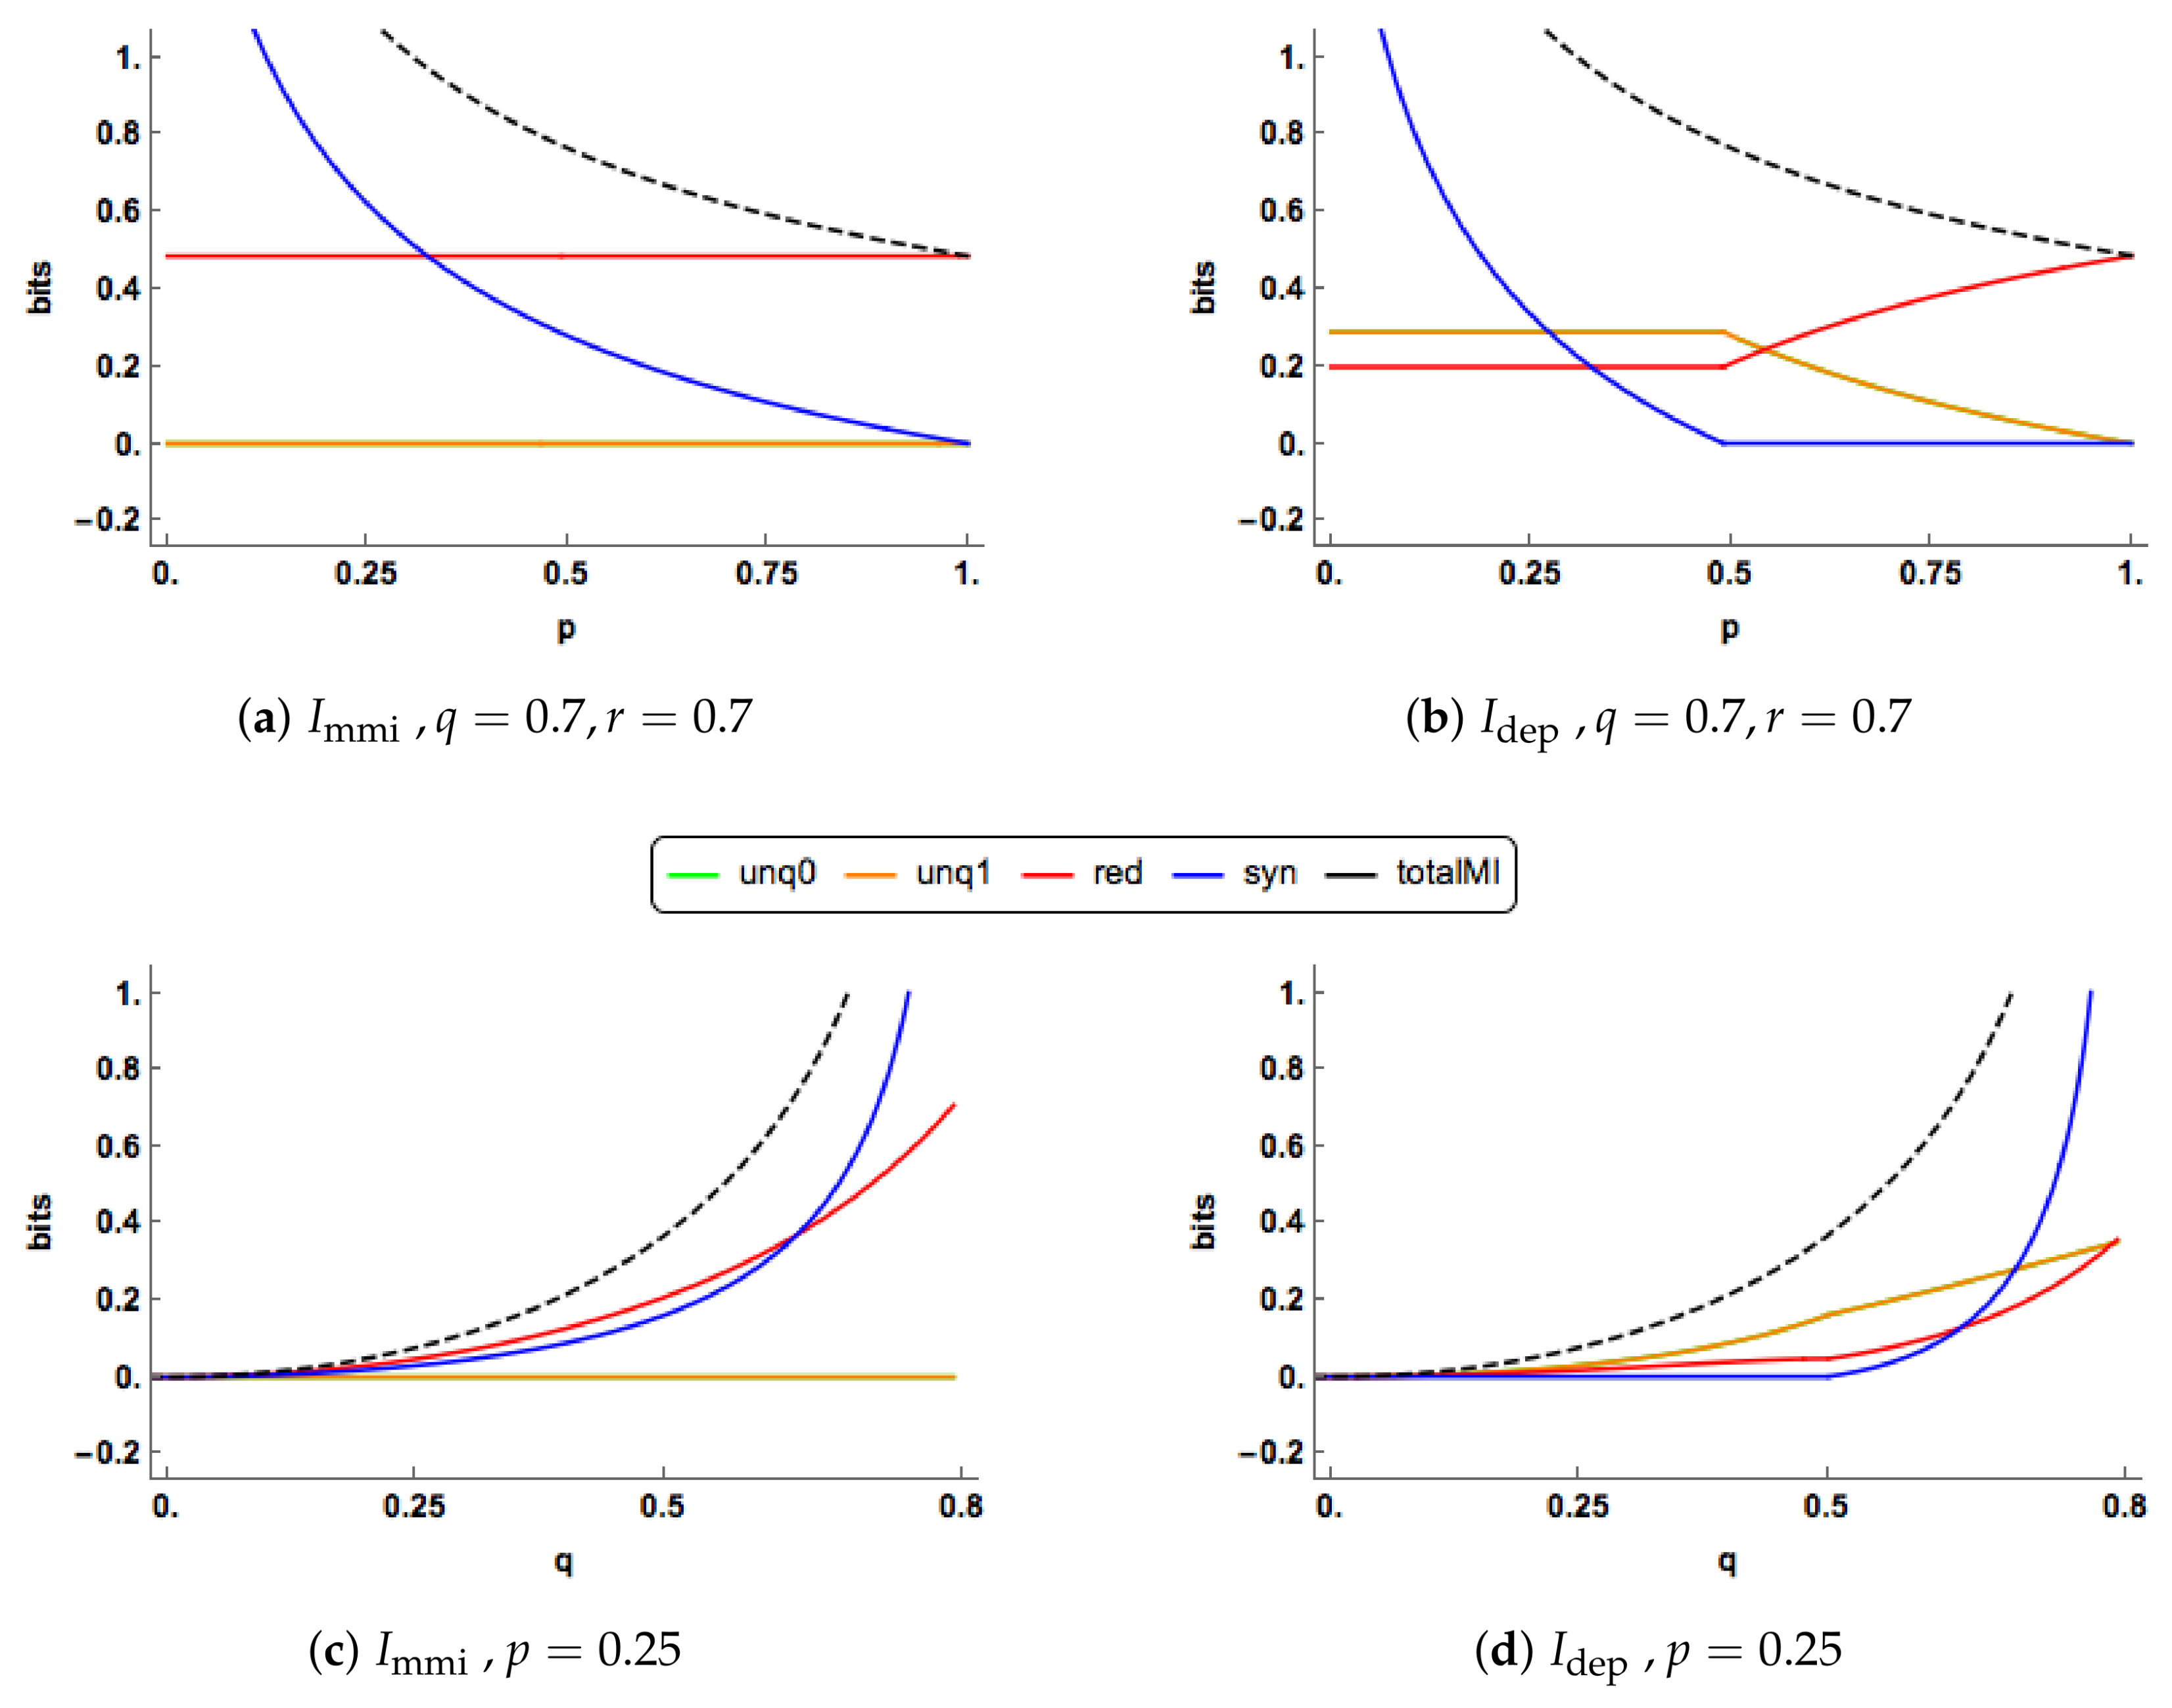
Figure 3a. The redundancy component is constant, while the synergy component decreases towards zero. In
Figure 3b, we observe change-point behaviour of
when
. For
the unique components of
are equal, constant and positive. The redundancy component is also constant and positive with a lower value than the corresponding component in the
PID. The synergy component decreases towards zero and reaches this value when
. The
synergy is lower that the corresponding
synergy for all values of
p.
At , the synergy “switches off” in the PID, and stays “off” for larger values of p, and then the unique and redundancy components are free to change. In the range the redundancy increases and takes up all the mutual information when , while the unique informations decrease towards zero. The and profiles show different features in this case. The “regime switching” in the PID is interesting. As mentioned in Proposition 2, the minimum edge value occurs with unq0 = i or k. When unq0 = k the synergy must be equal to zero, whereas when unq0 = i the synergy is positive and the values of the unique informations and the redundancy are constant. Regions of zero synergy in the PID are explored in Figure 5.
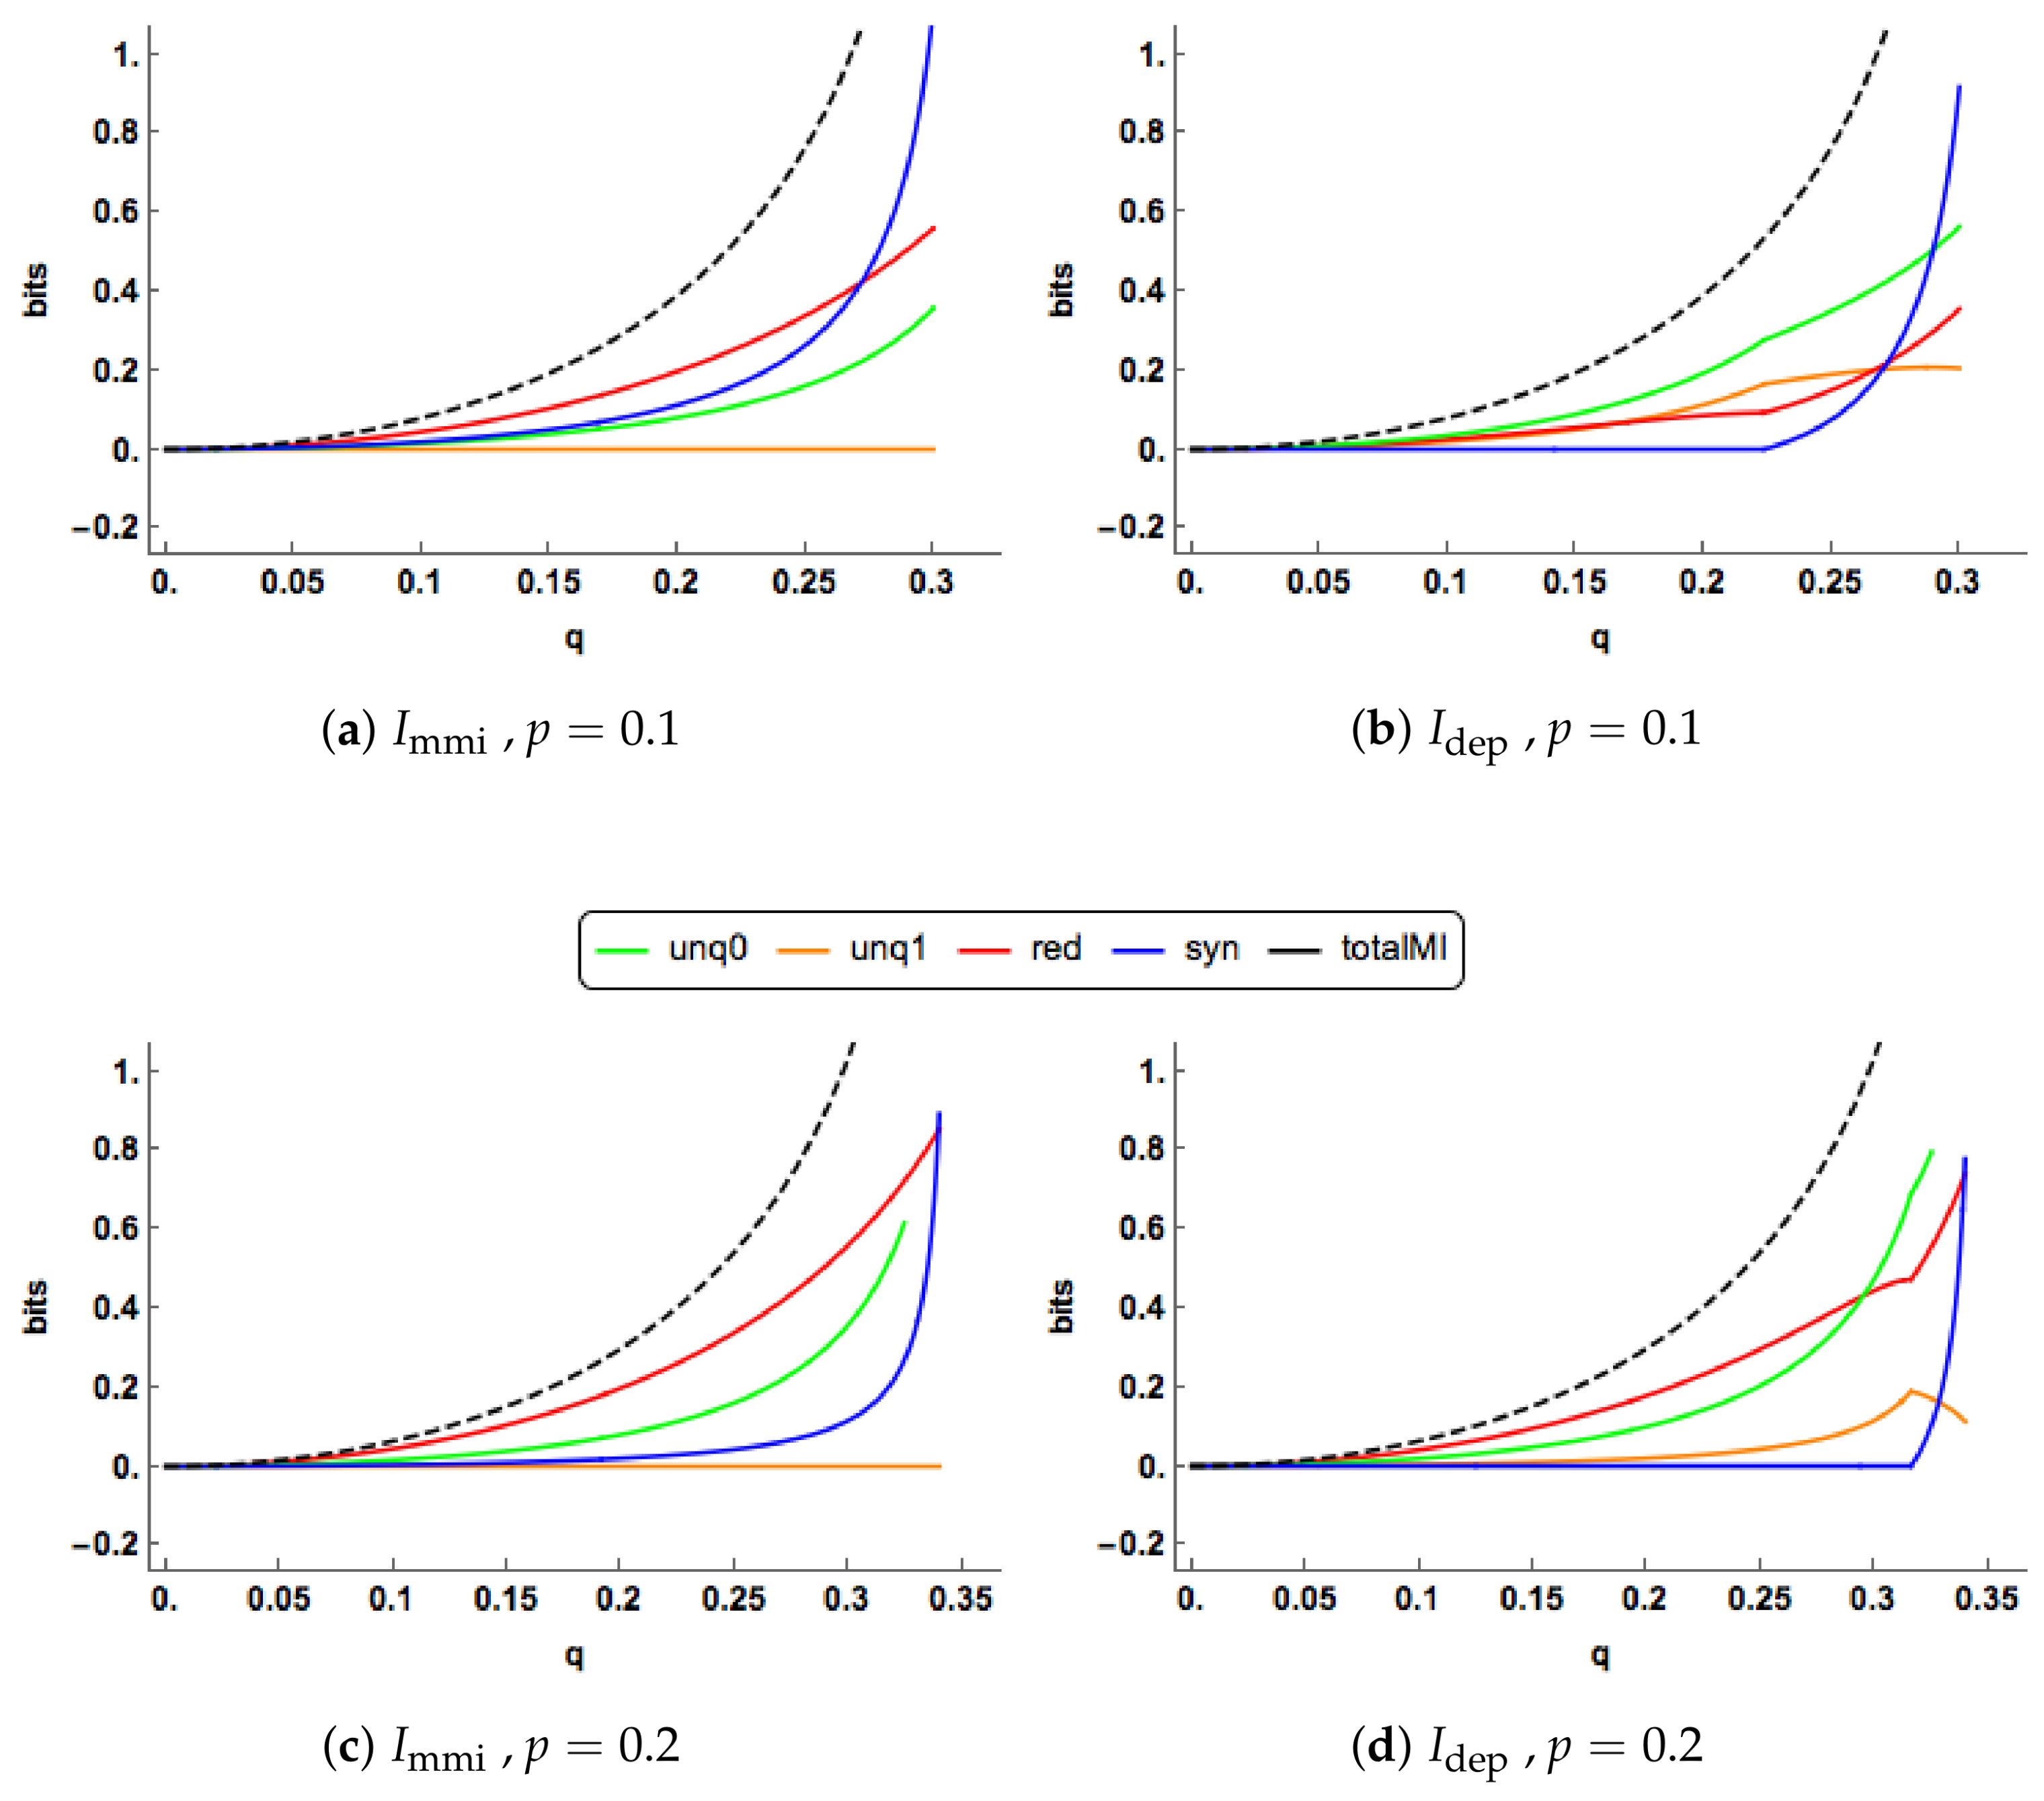
In
Figure 4a,b, there are clear differences in the PID profiles between the two methods. The
synergy component switches off at
and is zero thereafter. For
, both the
uniques are much larger than those of
, which are zero, and
has a larger redundancy component. For
, the redundancy component in
increases to take up all of the mutual information, while the unique information components decrease towards zero. In contrast to this, in the
PID the redundancy and unique components remain at their constant values while the synergy continues to decrease towards zero.
The PIDs are plotted for increasing values of
in
Figure 4c,d when
. The
and
profiles are quite different. As
q increases, the
uniques remain at zero, while the
uniques rise gradually. Both the
redundancy and synergy profiles rise more quickly than their
counterparts, probably because both their uniques are zero. In the
PID, the synergy switches on at
and it is noticeable than all the
components can change simultaneously as
q increases.
One of the characteristics noticed in
Figure 3 and
Figure 4 is the ’switching behaviour’ of the
PID in that there are kinks in the plots of the PIDs against the correlation between the predictors,
p: the synergy component abruptly becomes equal to zero at certain values of
p, and there are other values of
p at which the synergy moves from being zero to being positive.
In Proposition 2, it is explained for the
PID that when both predictor-target correlations are non-zero the minimum edge value occurs at edge value
i or
k. When the synergy moves from zero to a positive value, this means that the minimum edge value has changed from being
k to being equal to
i, and vice-versa. For a given value of
p, one can explore the regions in
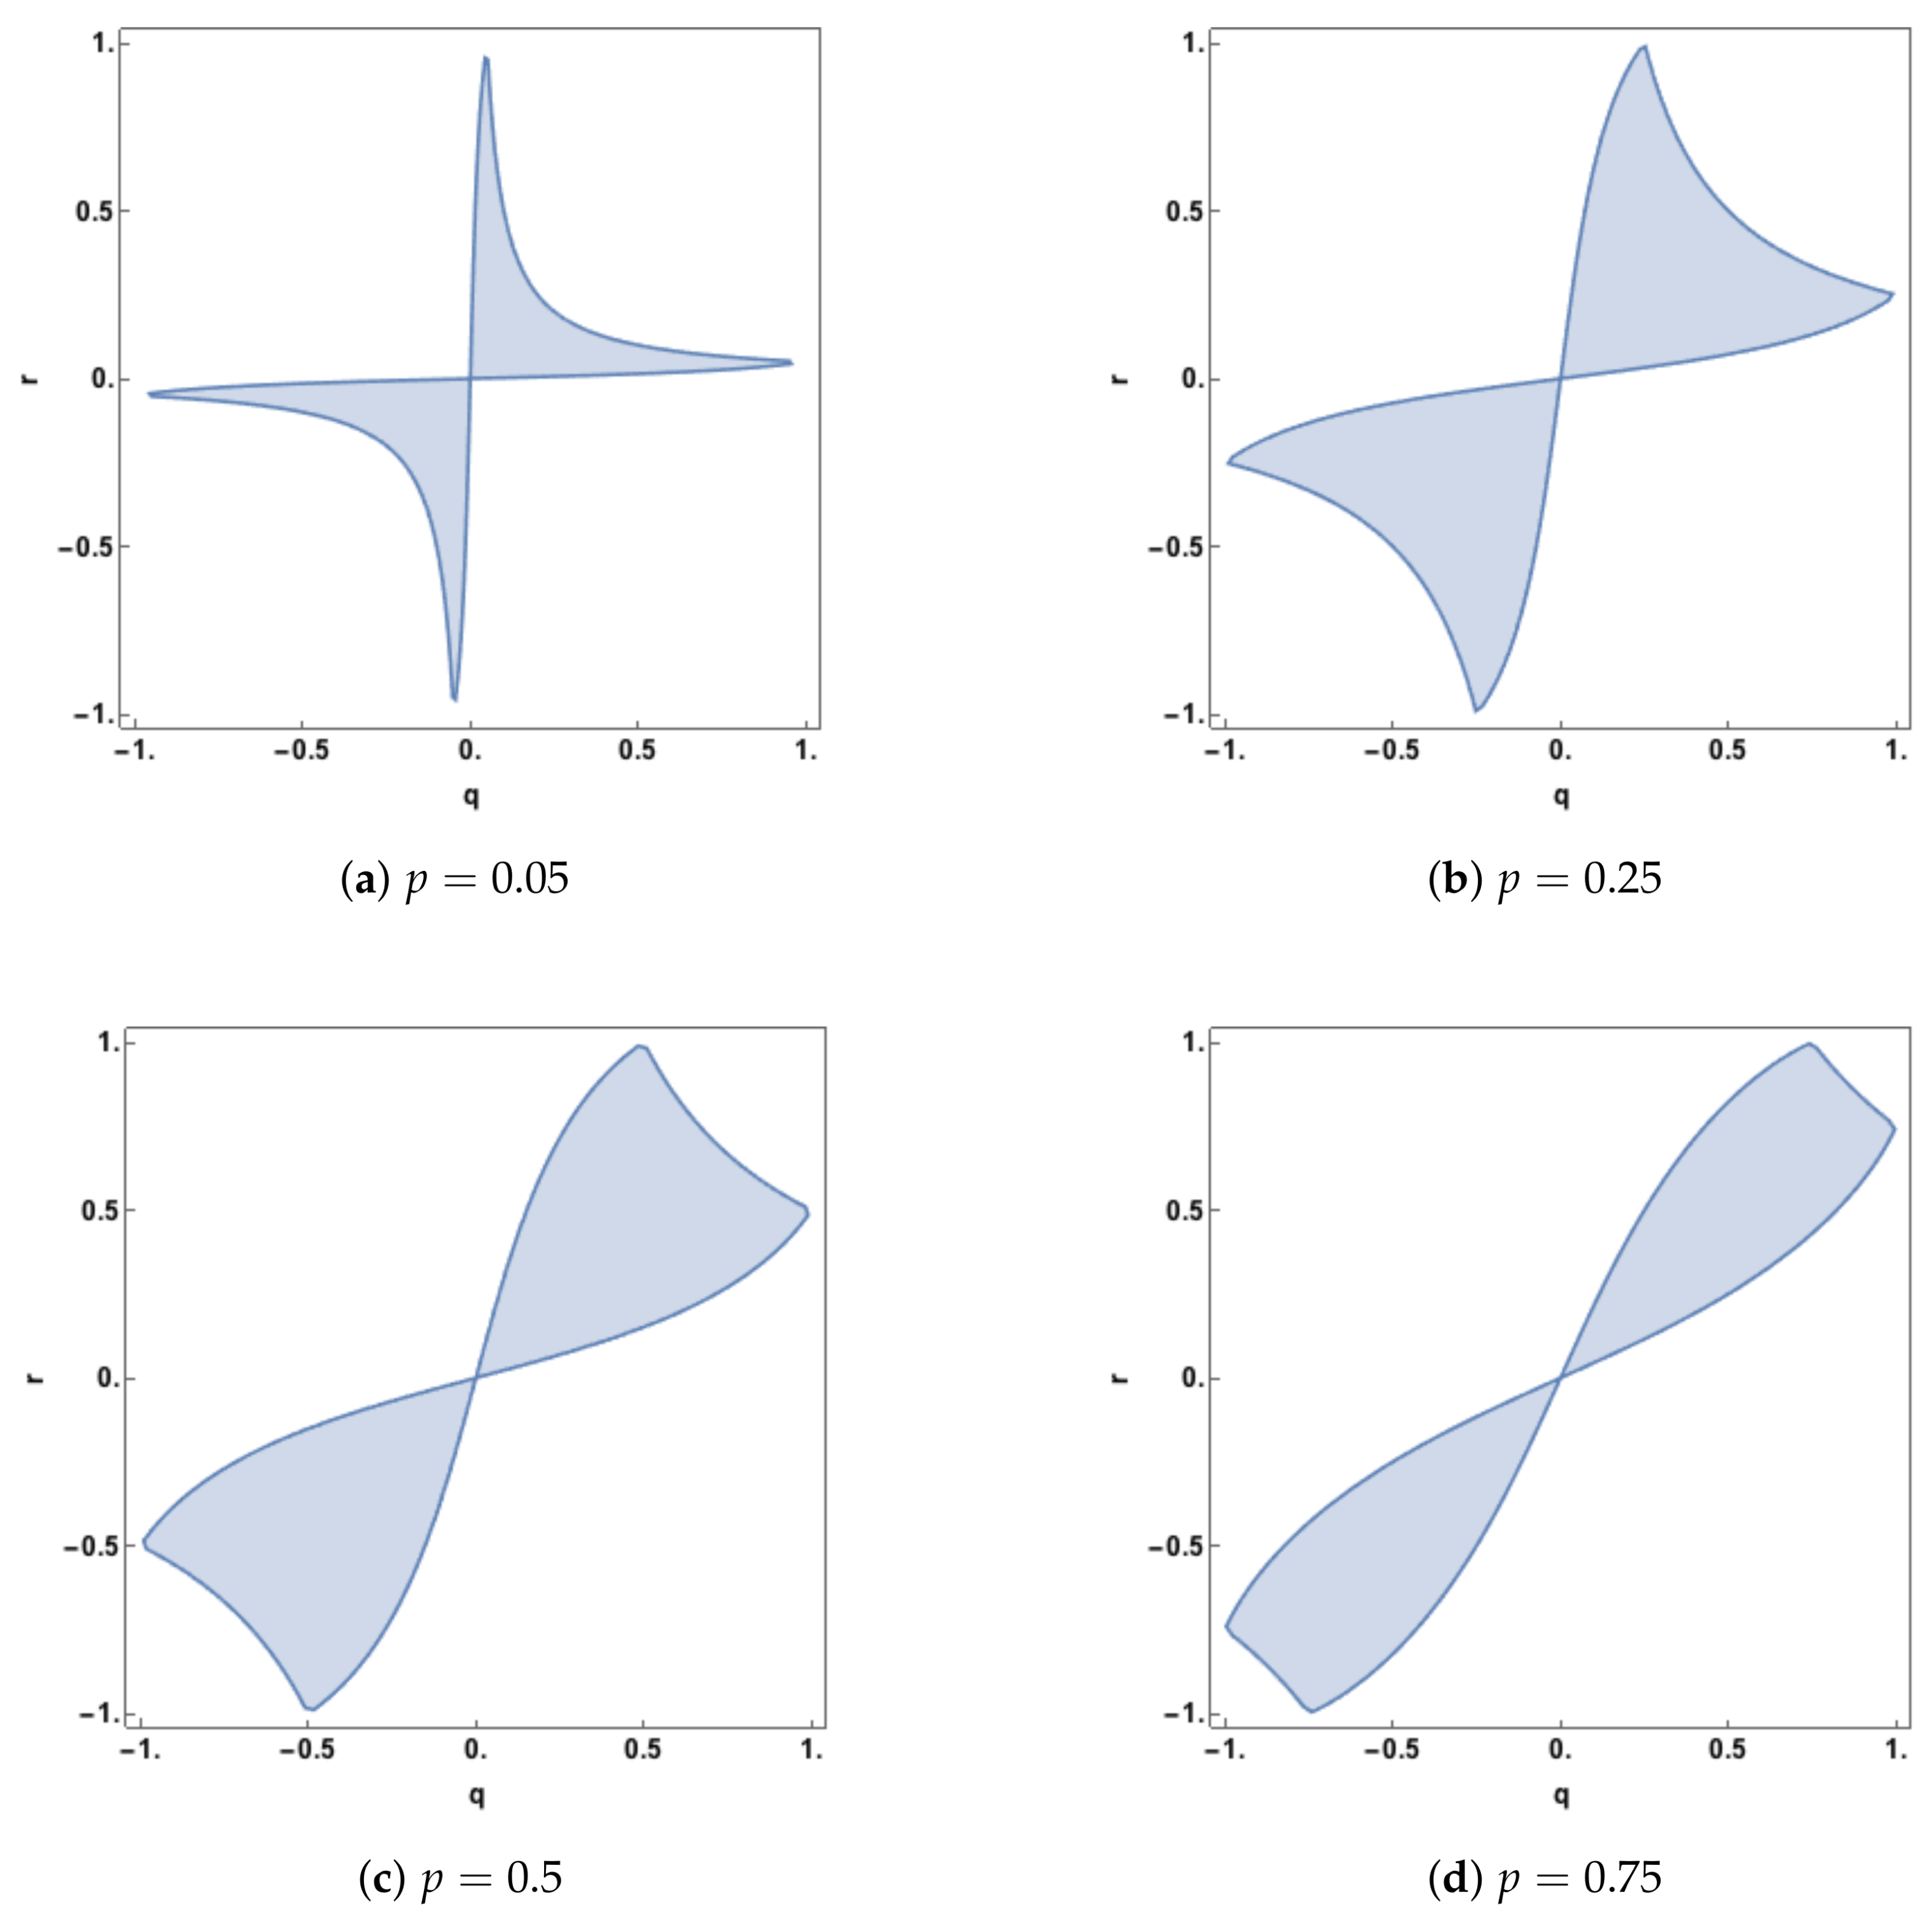
space at which such transitions take place. In
Figure 5, this region of zero synergy is shown, given four different values of
p. The boundary of each of the regions is where the synergy component changes from positive synergy to zero synergy, or vice-versa.
The plots in
Figure 5 show that synergy is non-zero (positive) whenever
q and
r are of opposite sign. When the predictor-predictor correlation,
p, is 0.05 there is also positive synergy for large regions, defined by
, when
q and
r have the same sign. As
p increases the regions of zero synergy change shape, initially increasing in area and then declining as
p becomes quite large (
). As
p is increased further the zero-synergy bands narrow and so zero synergy will only be found when
q and
r are close to being equal.
When p is negative, the corresponding plots are identical to those with positive p but rotated counter clockwise by about the point Hence, synergy is present when q and r have the same sign. When q and r have opposite signs, there is also positive synergy for regions defined by
The case of is of interest and there are no non-zero admissible values of q and r (where the covariance matrix is positive definite) where the synergy is equal to zero. Hence the system will have synergy in this case unless or . This can be seen from the synergy expression in Example 3.


