AD or Non-AD: A Deep Learning Approach to Detect Advertisements from Magazines


Abstract
1. Introduction
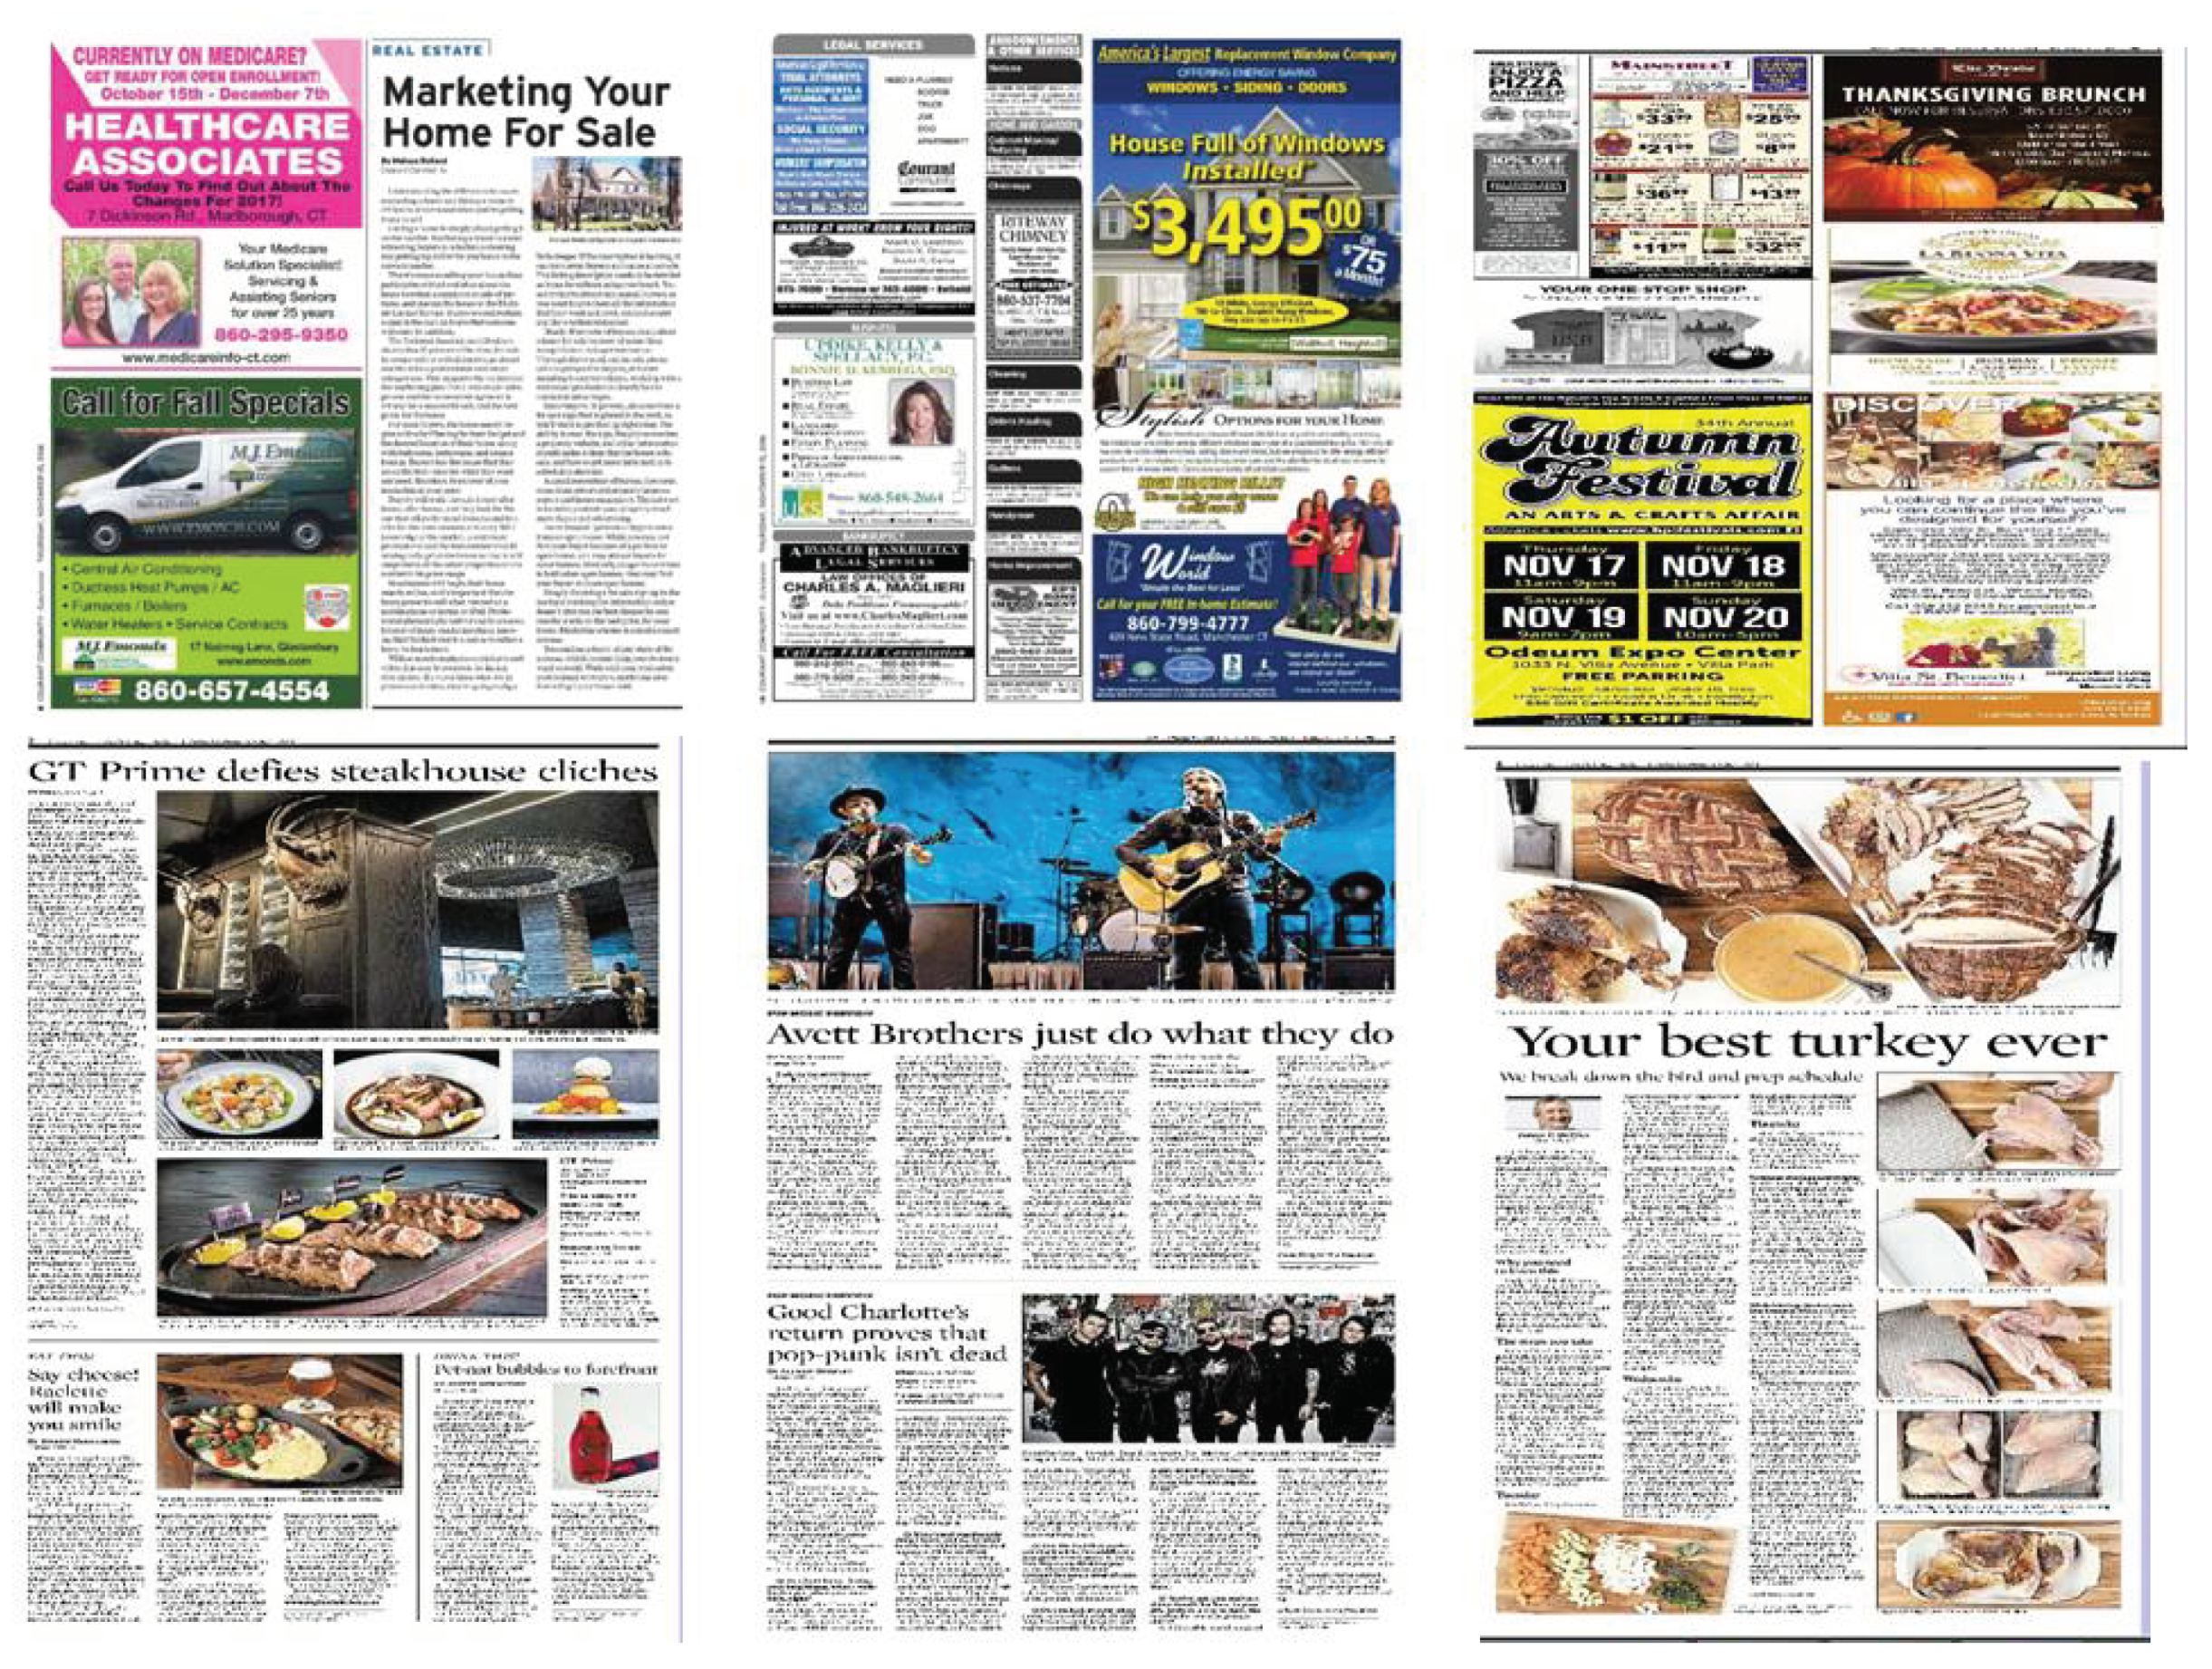
- The image dataset is a collection from various magazines, and it contains both advertisement and non-advertisement images in a variety of designs.
- We optimized the convolutional neural networks using different filters to classify images as advertisements or non-advertisements from magazines.
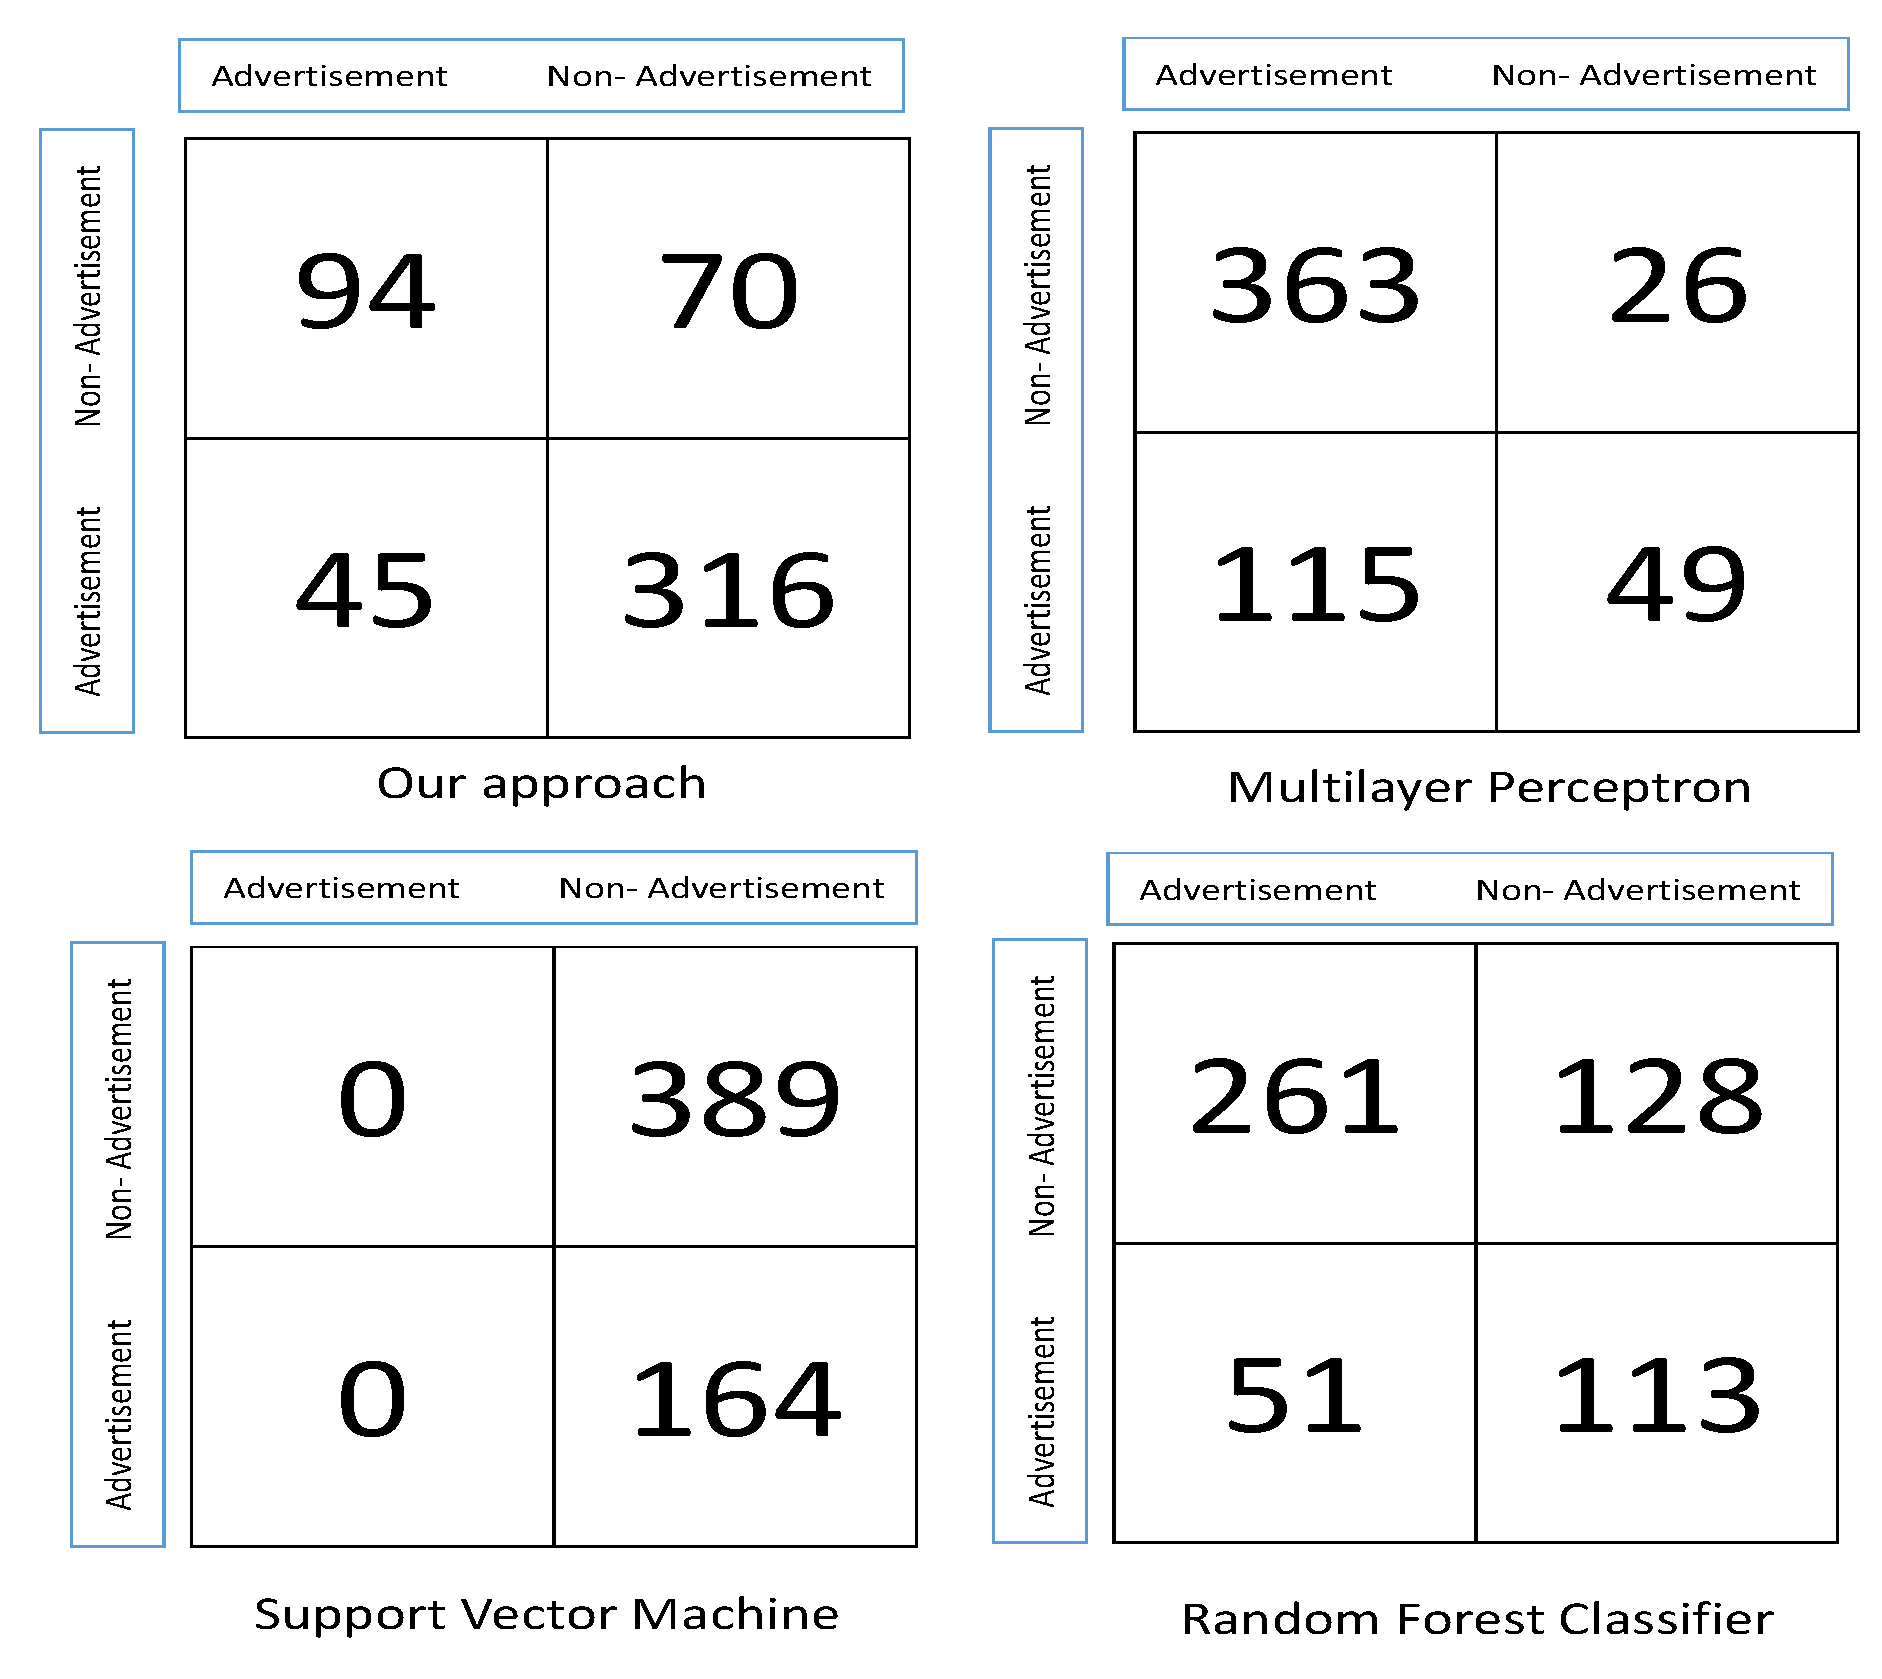
- A comparison was made with other classifiers, and it shows that our approach is feasible for detecting advertisements from a large dataset and outperforms other classifiers.
2. Related Work
3. Approach
- Feature extraction, and
- Classification.
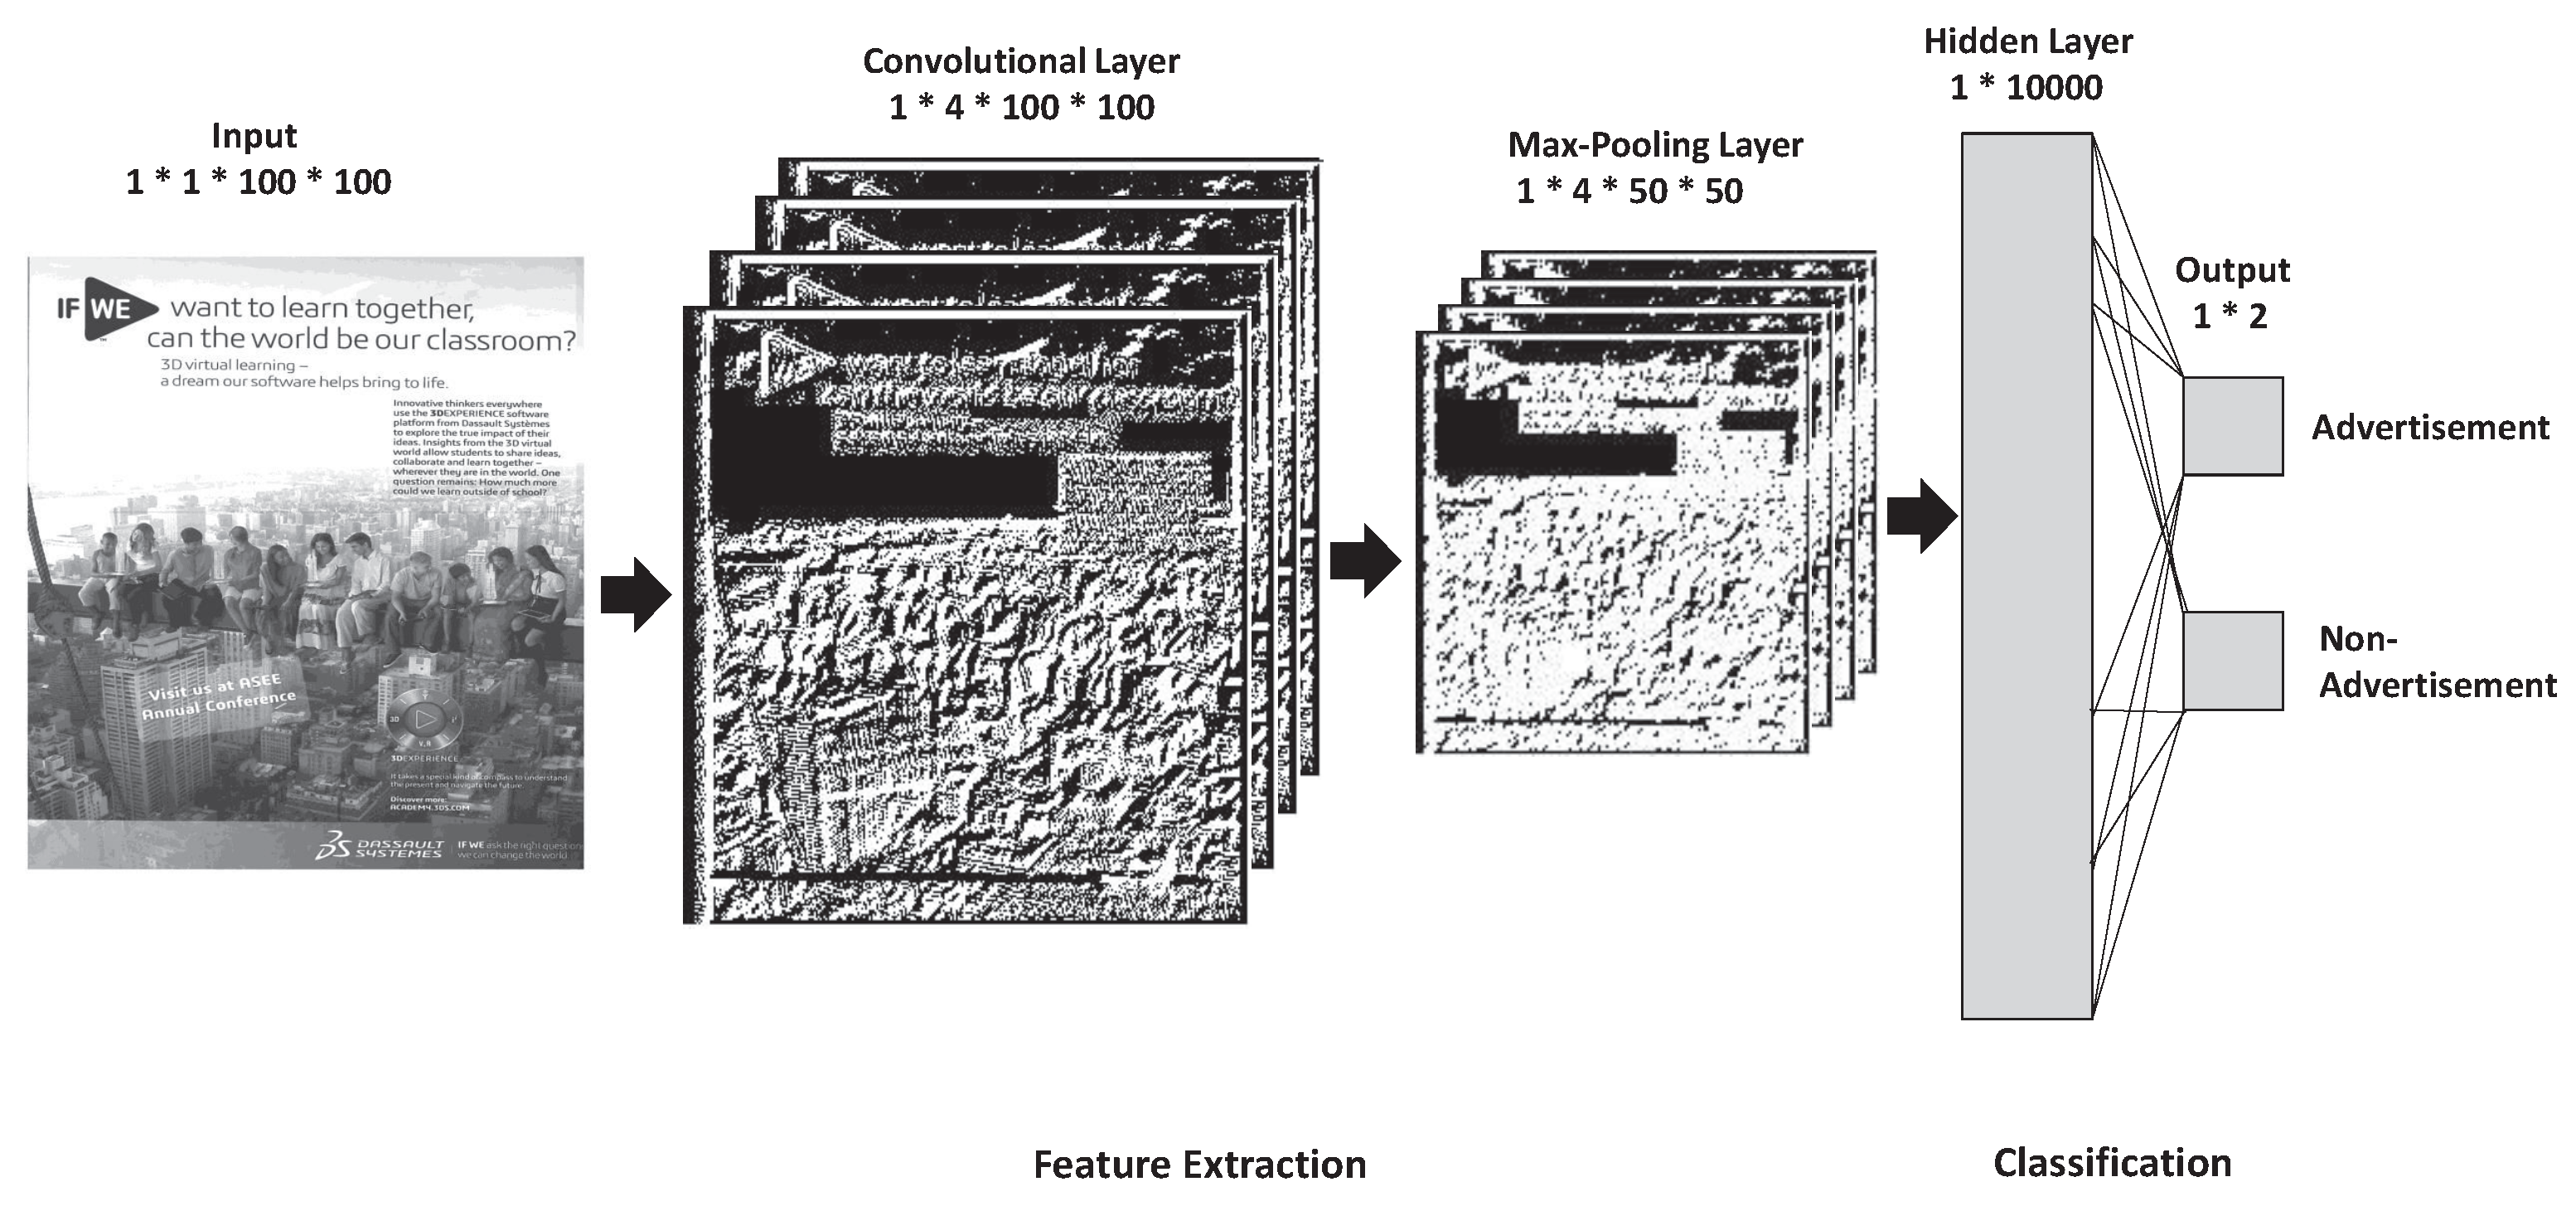
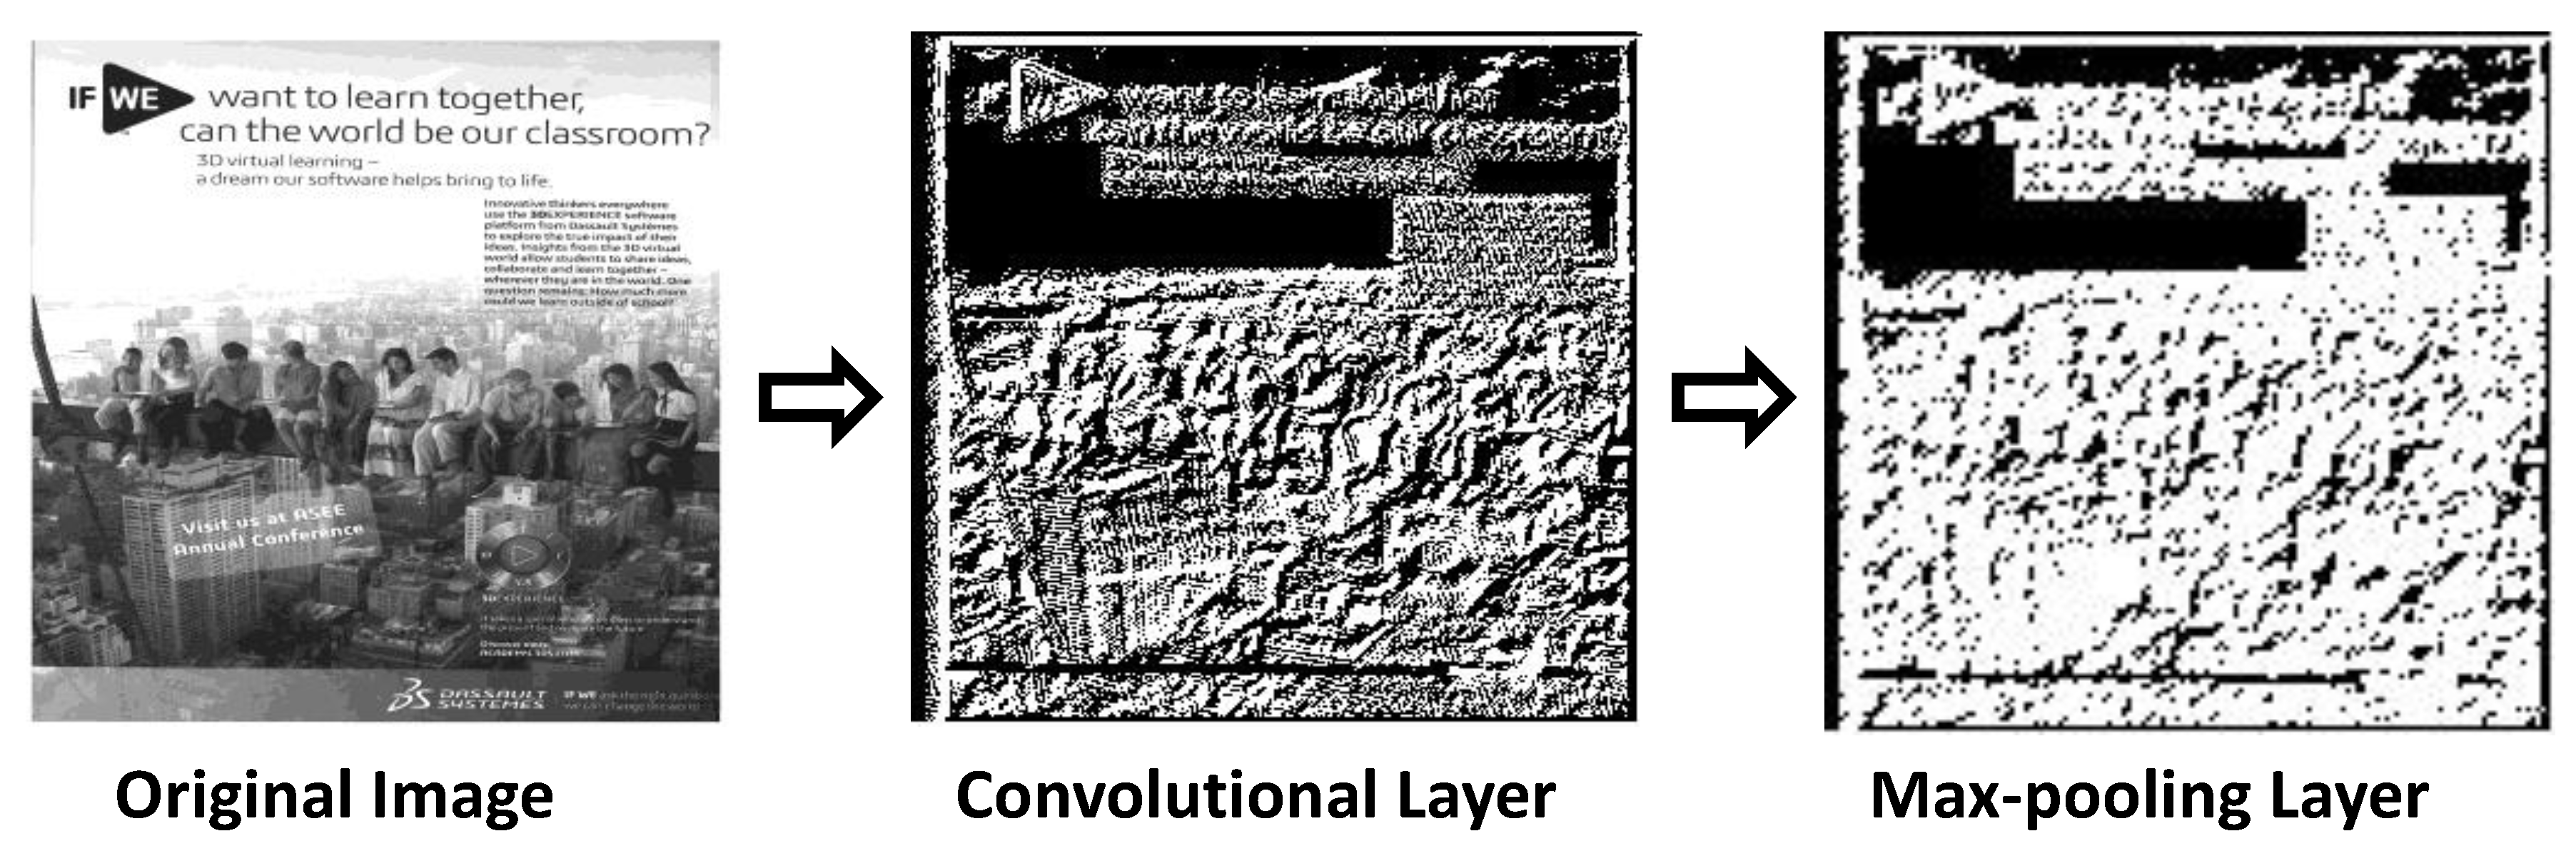
3.1. Feature Extraction Layer
- Reducing the number of parameters within the model. This is called downsampling (or subsampling), and it retains the most important feature, thus reducing the computational cost.
- Generalizing the results from a convolutional filter. This makes the detection of features invariant to scale or orientation changes.
3.2. Classification Layer
4. Experimental Setting
4.1. Dataset
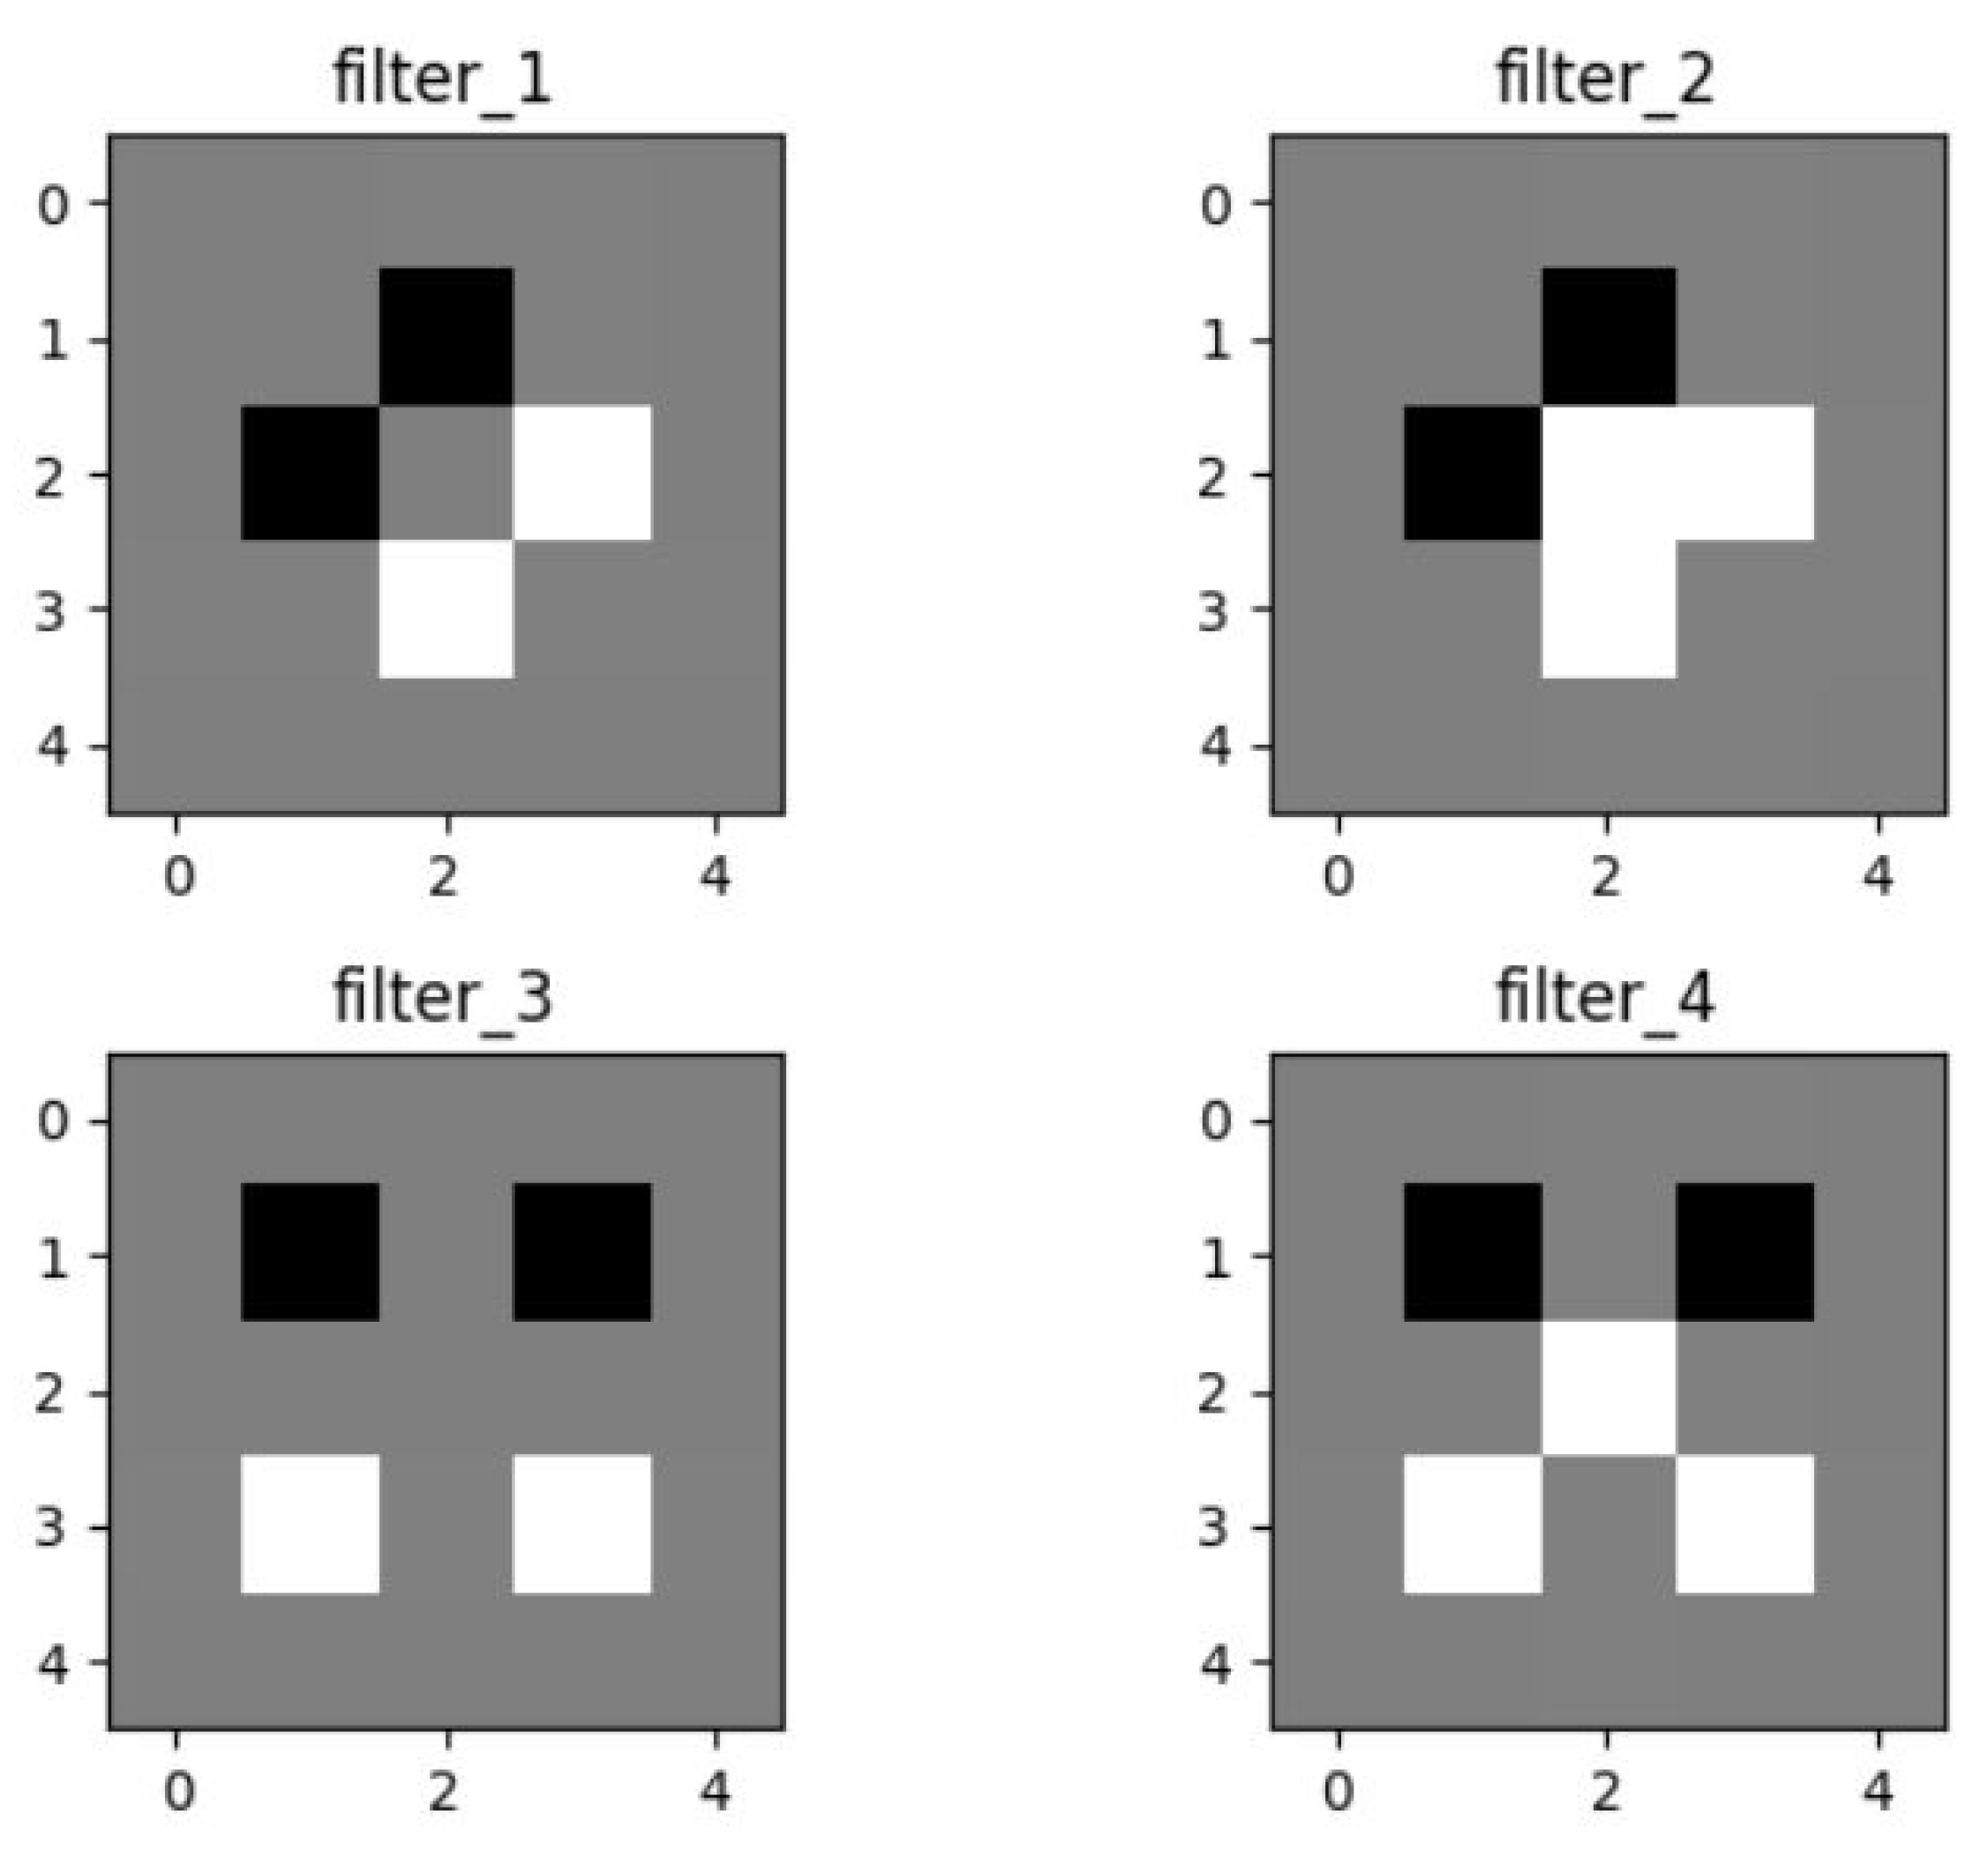
4.2. Filters
4.3. Implementation
- Convolution Layer: Convolving each filter with the input image.
- ReLU Layer: Applying ReLU activation on the feature maps.
- Max-Pooling Layer: Applying the pooling operation to the output of the ReLU layer.
- Fully Connected Layer: A neural network with one hidden layer to perform the classification.
4.4. Mini-Batch Gradient Descent
4.5. Evaluation
5. Results
6. Conclusions and Future Work
Author Contributions
Funding
Conflicts of Interest
References
- Heidemann, J.; Klier, M.; Probst, F. Online social networks: A survey of a global phenomenon. Comput. Netw. 2012, 56, 3866–3878. [Google Scholar] [CrossRef]
- Razavian, A.S.; Azizpour, H.; Sullivan, J.; Carlsson, S. CNN features off-the-shelf: An astounding baseline for recognition. In Proceedings of the 2014 IEEE Conference on Computer Vision and Pattern Recognition Workshops (CVPRW), Columbus, OH, USA, 24–27 June 2014; pp. 512–519. [Google Scholar]
- Wang, J.; Yang, Y.; Mao, J.; Huang, Z.; Huang, C.; Xu, W. Cnn-rnn: A unified framework for multi-label image classification. In Proceedings of the 2016 IEEE Conference on Computer Vision and Pattern Recognition (CVPR), Las Vegas, NV, USA, 27–30 June 2016; pp. 2285–2294. [Google Scholar]
- Woźniak, M.; Połap, D. Object detection and recognition via clustered features. Neurocomputing 2018, 320, 76–84. [Google Scholar] [CrossRef]
- Faust, O.; Hagiwara, Y.; Hong, T.J.; Lih, O.S.; Acharya, U.R. Deep learning for healthcare applications based on physiological signals: A review. Comput. Methods Programs Biomed. 2018. [Google Scholar] [CrossRef] [PubMed]
- Połap, D.; Woźniak, M.; Wei, W.; Damaševičius, R. Multi-threaded learning control mechanism for neural networks. Future Gener. Comput. Syst. 2018, 87, 16–34. [Google Scholar] [CrossRef]
- Połap, D.; Winnicka, A.; Serwata, K.; Kęsik, K.; Woźniak, M. An Intelligent System for Monitoring Skin Diseases. Sensors 2018, 18, 2552. [Google Scholar] [CrossRef] [PubMed]
- Lore, K.G.; Stoecklein, D.; Davies, M.; Ganapathysubramanian, B.; Sarkar, S. A deep learning framework for causal shape transformation. Neural Netw. 2018, 98, 305–317. [Google Scholar] [CrossRef] [PubMed]
- Qiao, J.; Wang, G.; Li, W.; Chen, M. An adaptive deep Q-learning strategy for handwritten digit recognition. Neural Netw. 2018. [Google Scholar] [CrossRef] [PubMed]
- Bazrafkan, S.; Thavalengal, S.; Corcoran, P. An end to end Deep Neural Network for iris segmentation in unconstrained scenarios. Neural Netw. 2018, 106, 79–95. [Google Scholar] [CrossRef] [PubMed]
- Petersen, P.; Voigtlaender, F. Optimal approximation of piecewise smooth functions using deep ReLU neural networks. Neural Netw. 2018, 108, 296–330. [Google Scholar] [CrossRef] [PubMed]
- Basu, S.; Mukhopadhyay, S.; Karki, M.; DiBiano, R.; Ganguly, S.; Nemani, R.; Gayaka, S. Deep neural networks for texture classification—A theoretical analysis. Neural Netw. 2018, 97, 173–182. [Google Scholar] [CrossRef] [PubMed]
- Kim, Y. Convolutional Neural Networks for Sentence Classification. arXiv, 2014; arXiv:1408.5882. [Google Scholar]
- Zhang, Y.; Wallace, B. A Sensitivity Analysis of (and Practitioners’ Guide to) Convolutional Neural Networks for Sentence Classification. arXiv, 2015; arXiv:1510.03820. [Google Scholar]
- Ouji, A.; Leydier, Y.; Lebourgeois, F. Advertisement detection in digitized press images. In Proceedings of the 2011 IEEE International Conference on Multimedia and Expo (ICME), Barcelona, Spain, 11–15 July 2011; pp. 1–6. [Google Scholar]
- Chu, W.T.; Chang, H.Y. Advertisement Detection, Segmentation, and Classification for Newspaper Images and Website Snapshots. In Proceedings of the 2016 International Computer Symposium (ICS), Chiayi, Taiwan, 15–17 December 2016; pp. 396–401. [Google Scholar]
- Jiang, Y.G.; Yang, J.; Ngo, C.W.; Hauptmann, A.G. Representations of keypoint-based semantic concept detection: A comprehensive study. IEEE Trans. Multimed. 2010, 12, 42–53. [Google Scholar] [CrossRef]
- Peleato, R.A.; Chappelier, J.C.; Rajman, M. Using information extraction to classify newspapers advertisements. In Proceedings of the 5th International Conference on the Statistical Analysis of Textual Data, Lausanne, Switzerland, 28–30 March 2000. [Google Scholar]
- Hubel, D.H.; Wiesel, T.N. Receptive fields and functional architecture of monkey striate cortex. J. Physiol. 1968, 195, 215–243. [Google Scholar] [CrossRef] [PubMed]
- Krizhevsky, A.; Sutskever, I.; Hinton, G.E. Imagenet classification with deep convolutional neural networks. In Advances in Neural Information Processing Systems; MIT Press Ltd.: Cambridge, MA, USA, 2012; pp. 1097–1105. [Google Scholar]
- Nair, V.; Hinton, G.E. Rectified linear units improve restricted boltzmann machines. In Proceedings of the 27th International Conference on Machine Learning (ICML-10), Haifa, Israel, 21–24 June 2010; pp. 807–814. [Google Scholar]
- Lawrence, S.; Giles, C.L.; Tsoi, A.C.; Back, A.D. Face recognition: A convolutional neural-network approach. IEEE Trans. Neural Netw. 1997, 8, 98–113. [Google Scholar] [CrossRef] [PubMed]
- Boureau, Y.L.; Bach, F.; LeCun, Y.; Ponce, J. Learning mid-level features for recognition. In Proceedings of the 2010 IEEE Computer Society Conference on Computer Vision and Pattern Recognition, San Francisco, CA, USA, 13–18 June 2010. [Google Scholar]
- LeCun, Y.; Bengio, Y. Convolutional networks for images, speech, and time series. Handb. Brain Theory Neural Netw. 1995, 3361, 1995. [Google Scholar]
- Fahlman, S.E.; Lebiere, C. The cascade-correlation learning architecture. In Advances in Neural Information Processing Systems; MIT Press Ltd.: Cambridge, MA, USA, 1990; pp. 524–532. [Google Scholar]
- Chollet, F. Keras (2015). 2017. Available online: https://github.com/ fchollet/keras (accessed on 12 December 2018).
- Pedregosa, F.; Varoquaux, G.; Gramfort, A.; Michel, V.; Thirion, B.; Grisel, O.; Blondel, M.; Prettenhofer, P.; Weiss, R.; Dubourg, V.; et al. Scikit-learn: Machine learning in Python. J. Mach. Learn. Res. 2011, 12, 2825–2830. [Google Scholar]
- Li, M.; Zhang, T.; Chen, Y.; Smola, A.J. Efficient mini-batch training for stochastic optimization. In Proceedings of the 20th ACM SIGKDD International Conference on Knowledge Discovery and Data Mining, New York, NY, USA, 24–27 August 2014; pp. 661–670. [Google Scholar]


| Layer | Feature Map Size | Kernel Size |
|---|---|---|
| Input | 1 × 1 × 100 × 100 | - |
| Convolution | 1 × 4 × 100 × 100 | 5 × 5 × 4 |
| Max-pooling | 1 × 4 × 50 × 50 | 2 × 2 |
| Fully connected | 1 × 10,000 | |
| Output | 1 × 2 |
| Dataset\Classes | Advertisements | Non-Advertisements | Total |
|---|---|---|---|
| Training | 1914 | 1418 | 3332 |
| Testing | 164 | 389 | 553 |
| Total | 2078 | 1807 | 3885 |
| Algorithm | Accuracy |
|---|---|
| Our approach | 78% |
| Multilayer Perceptron | 74% |
| Random Forest Classifier | 67% |
| Support Vector Machine | 29% |
| Algorithm | Sensitivity |
|---|---|
| Our approach | 57% |
| Multilayer Perceptron | 93% |
| Random Forest Classifier | 67% |
| Support Vector Machine | 0% |
| Algorithm | Specificity |
|---|---|
| Our approach | 87% |
| Multilayer Perceptron | 29% |
| Random Forest Classifier | 68% |
| Support Vector Machine | 100% |
© 2018 by the authors. Licensee MDPI, Basel, Switzerland. This article is an open access article distributed under the terms and conditions of the Creative Commons Attribution (CC BY) license (http://creativecommons.org/licenses/by/4.0/).
Share and Cite
Almgren, K.; Krishnan, M.; Aljanobi, F.; Lee, J. AD or Non-AD: A Deep Learning Approach to Detect Advertisements from Magazines. Entropy 2018, 20, 982. https://doi.org/10.3390/e20120982
Almgren K, Krishnan M, Aljanobi F, Lee J. AD or Non-AD: A Deep Learning Approach to Detect Advertisements from Magazines. Entropy. 2018; 20(12):982. https://doi.org/10.3390/e20120982
Chicago/Turabian StyleAlmgren, Khaled, Murali Krishnan, Fatima Aljanobi, and Jeongkyu Lee. 2018. "AD or Non-AD: A Deep Learning Approach to Detect Advertisements from Magazines" Entropy 20, no. 12: 982. https://doi.org/10.3390/e20120982
APA StyleAlmgren, K., Krishnan, M., Aljanobi, F., & Lee, J. (2018). AD or Non-AD: A Deep Learning Approach to Detect Advertisements from Magazines. Entropy, 20(12), 982. https://doi.org/10.3390/e20120982