Information Dynamics in Urban Crime


Abstract
:1. Introduction
2. Preliminaries
2.1. Crime Pattern Theory and Related Perspectives
2.2. Multifractal Analysis
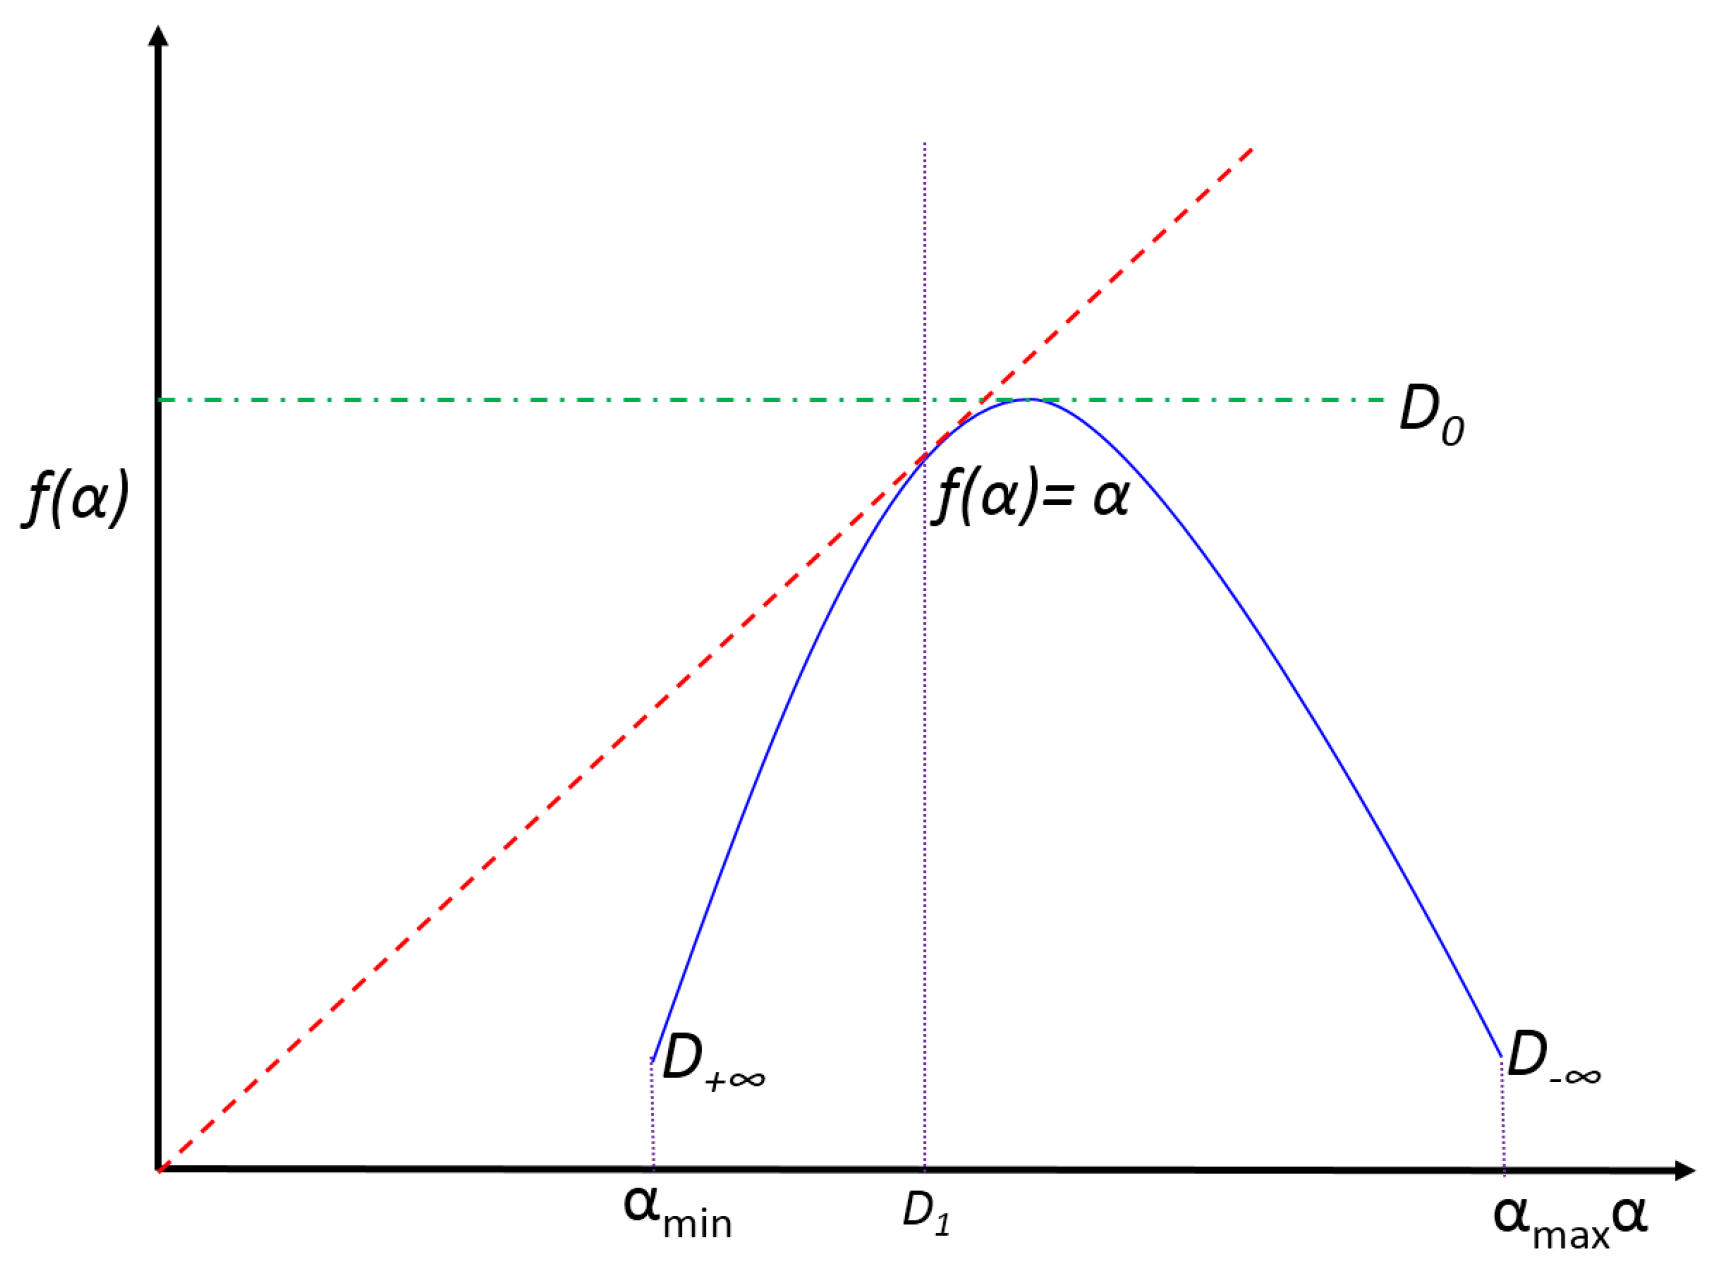
2.2.1. Multifractal Spectrum
2.2.2. Information Dimension
2.3. Analysis of Observed Chaotic Data
2.3.1. Taken’s Theorem
2.3.2. Average Mutual Information
2.3.3. False Nearest Neighbors
3. Materials and Methods
3.1. Criminal Reports
3.2. MF Time Series
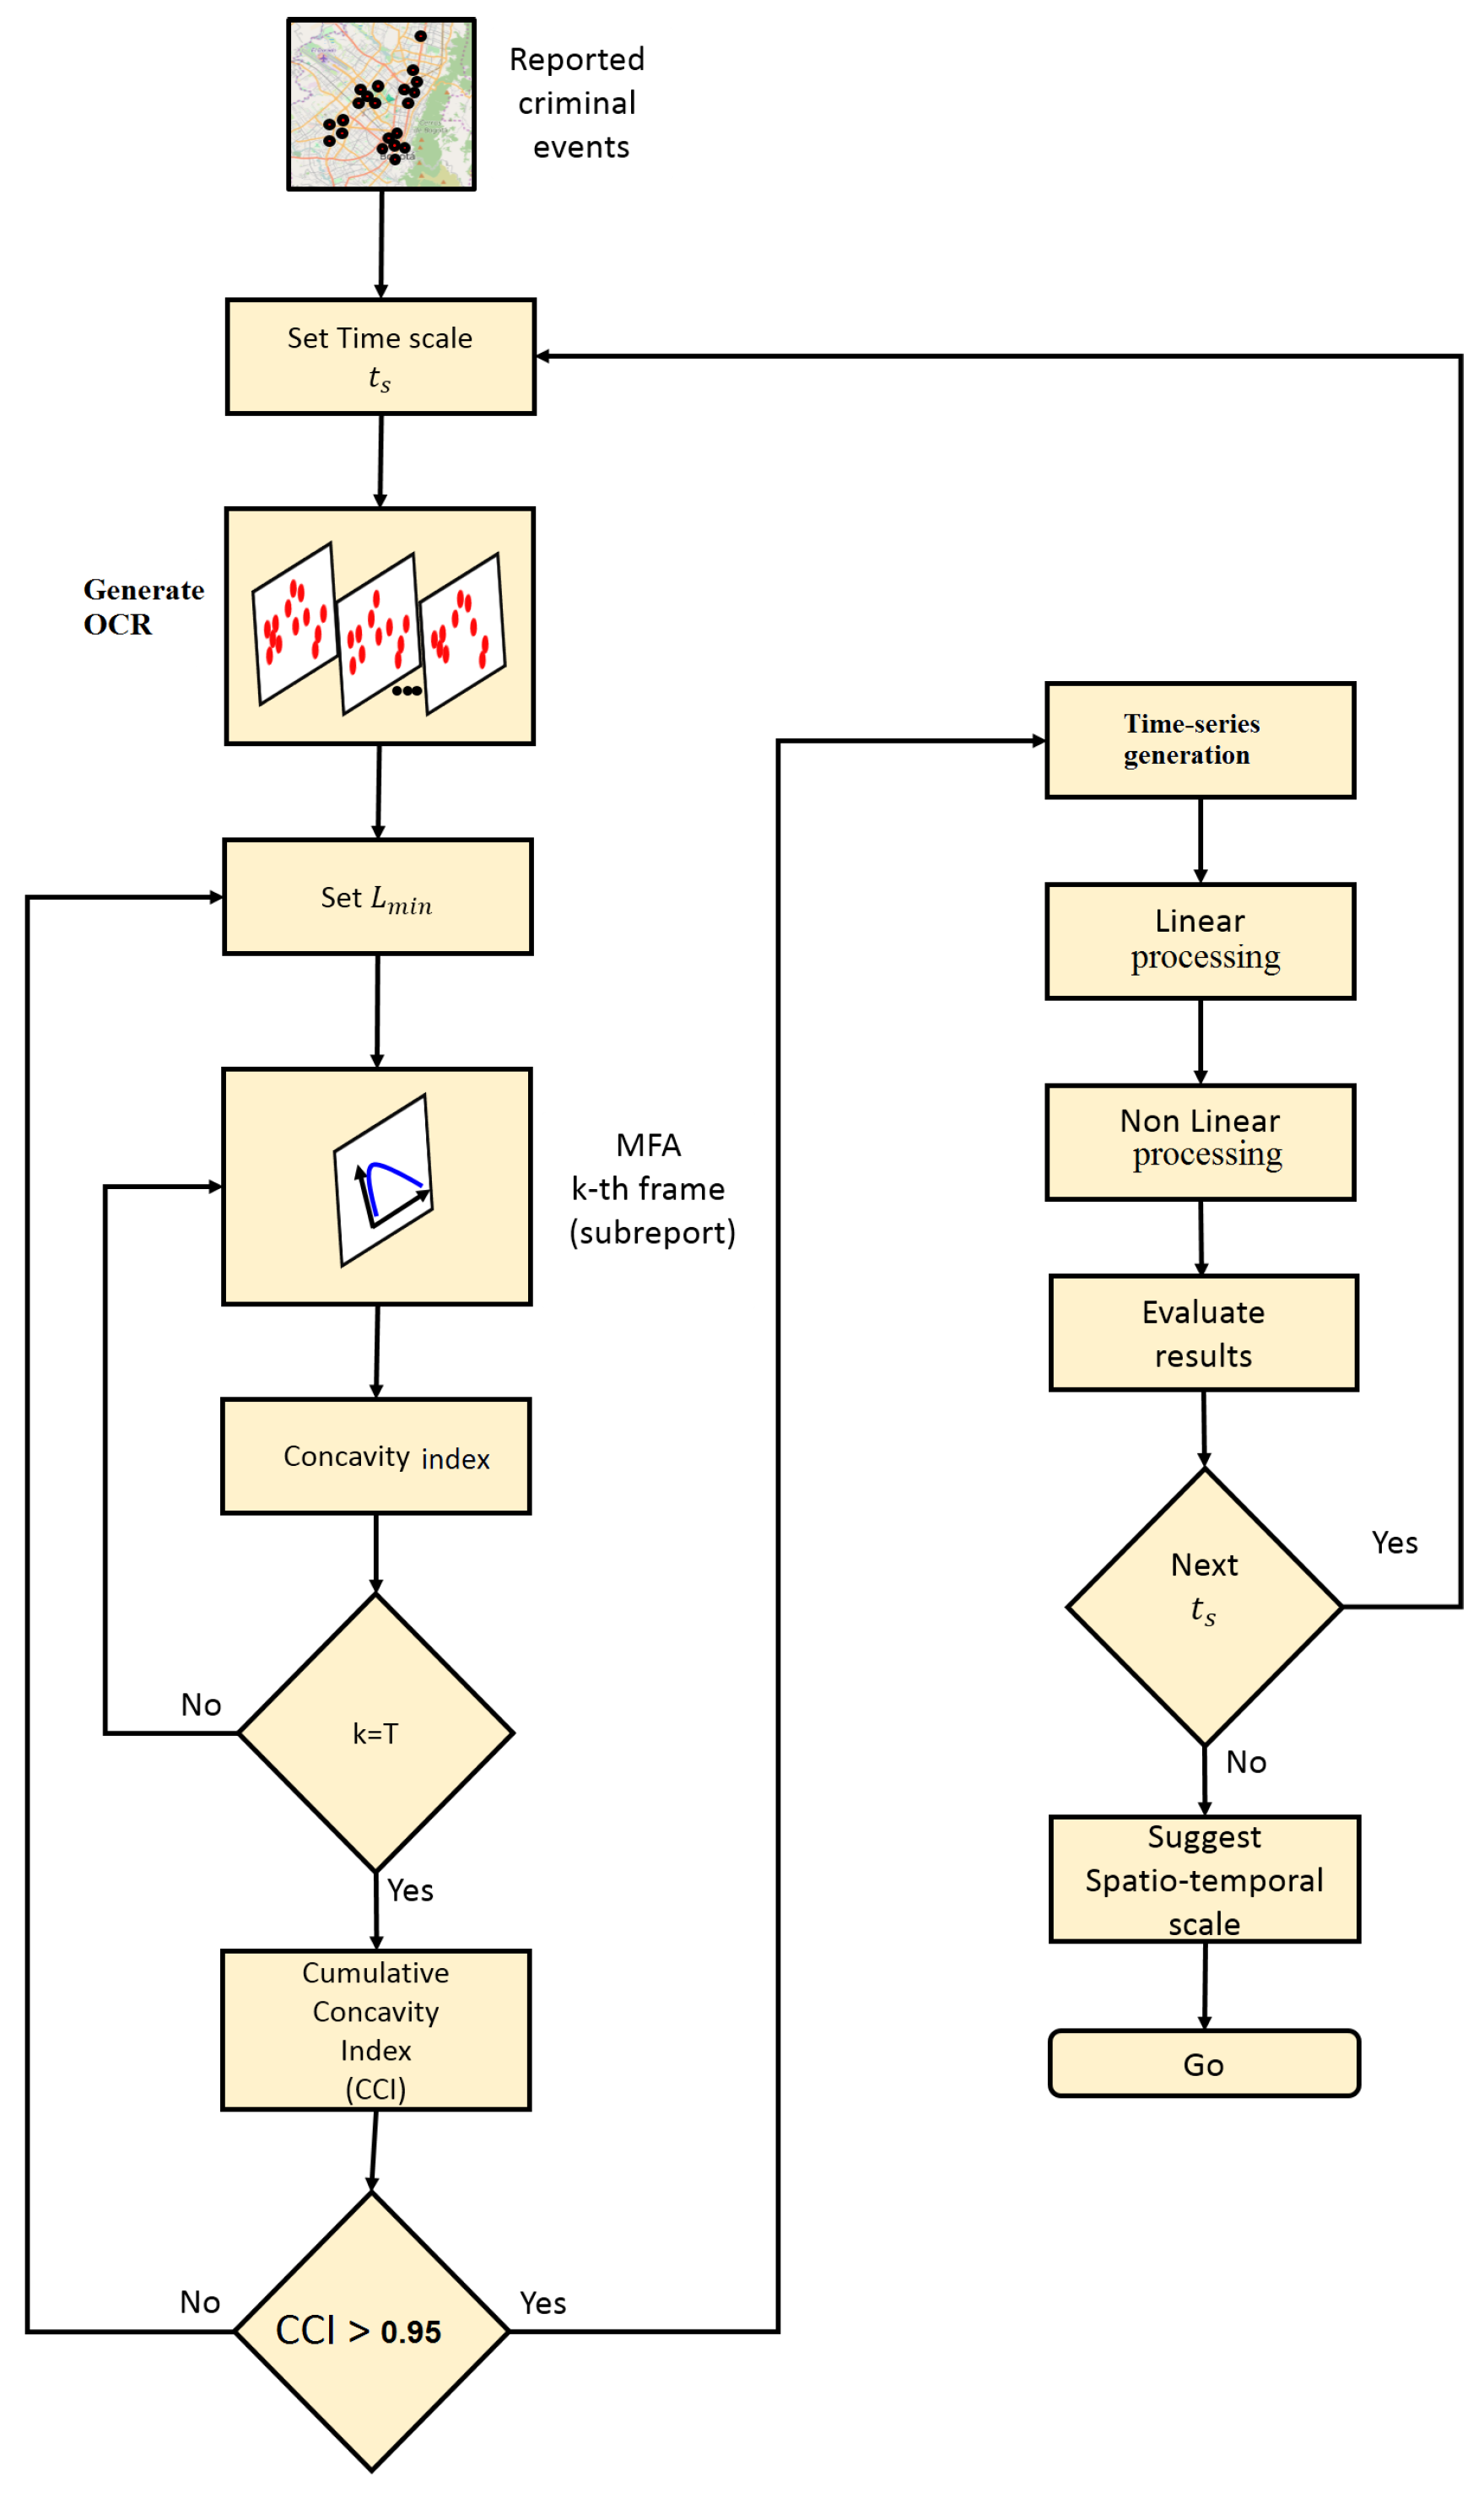
3.3. MF-A2-OCD Method
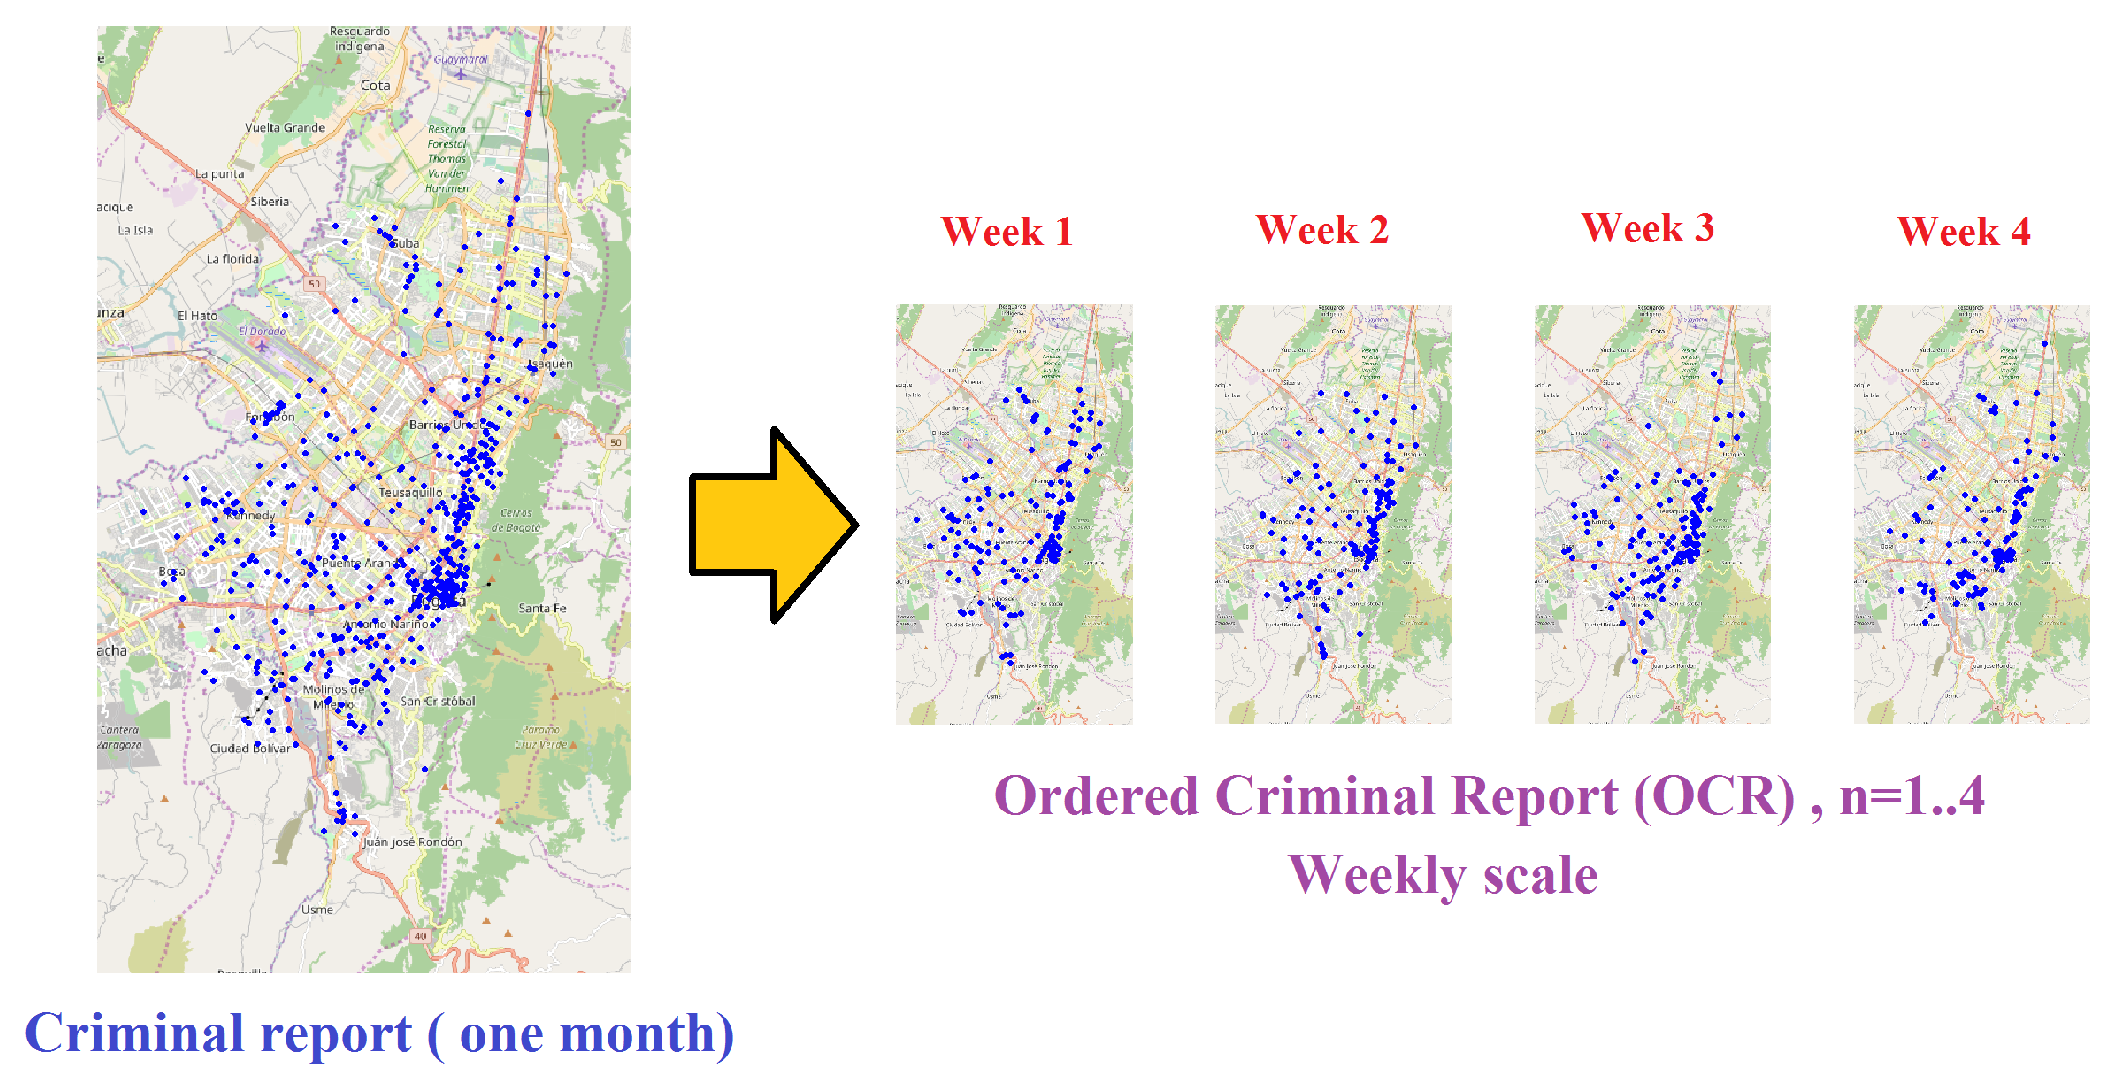
- Generate the OCR: Given the record of urban crime complaints in a time window , a temporary scale is defined for the construction of the OCR. Depending on the scale chosen, the report will contain T disjunctive subreports . The index n reveals the order in occurrence of the subreports over the OCR and will refer to the day, week, or month of the subreport within the OCR, depending on the selected scale.
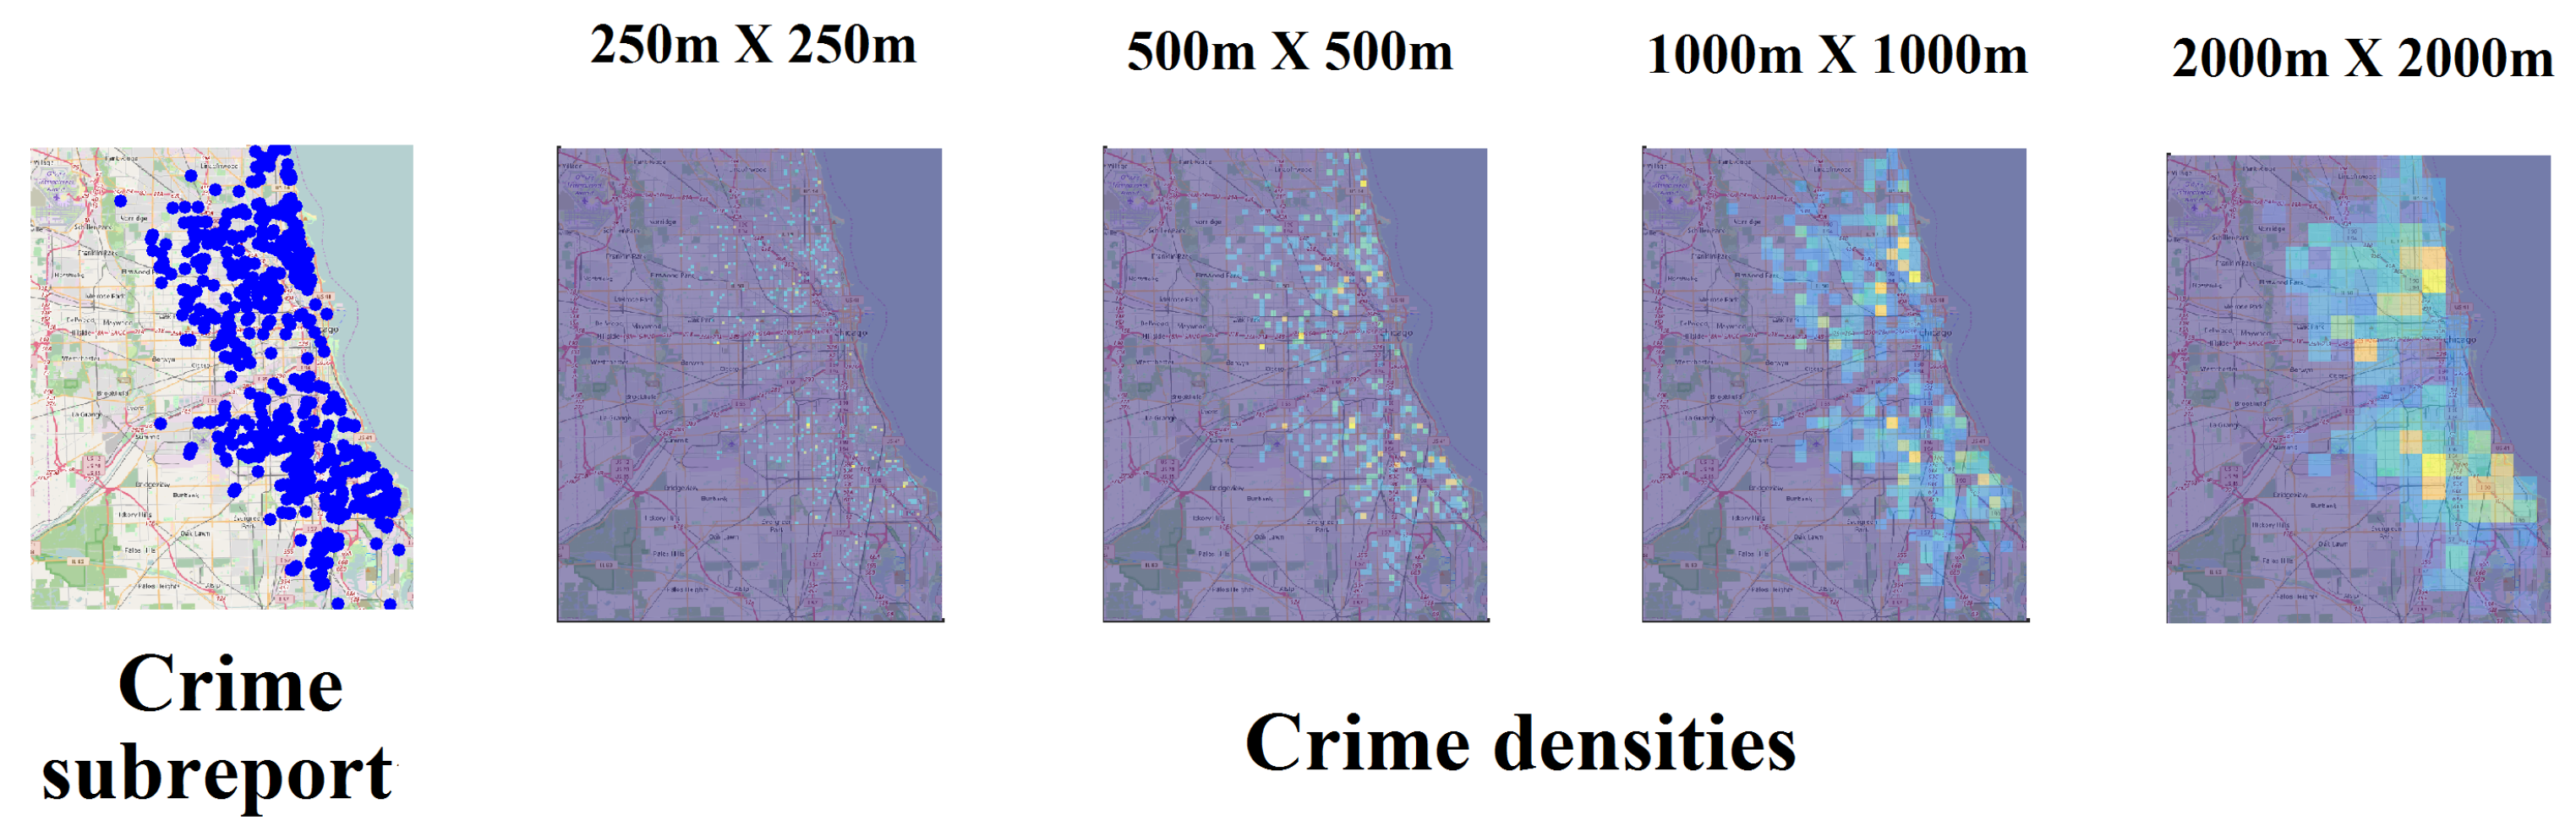
- Multifractal analysis and concavity test: Given a minimum spatial scale , multifractal analysis is executed for each of the subreports . The multifractal analysis is standardized considering for all the cases the same sizing of the support given by the maximum and minimum of the spatial coordinates of all complaints in the OCR. The concavity index of each spectrum is obtained according to Equation (28), until completing the length of the OCR M. Then, the CCI is obtained and the concavity test is verified, and if negative a new is chosen and the MF analysis is executed again. In practical terms it is desirable to start with a small and increase it until the test becomes positive, keeping in mind the possible degeneration of some multifractal spectra that should be corrected.
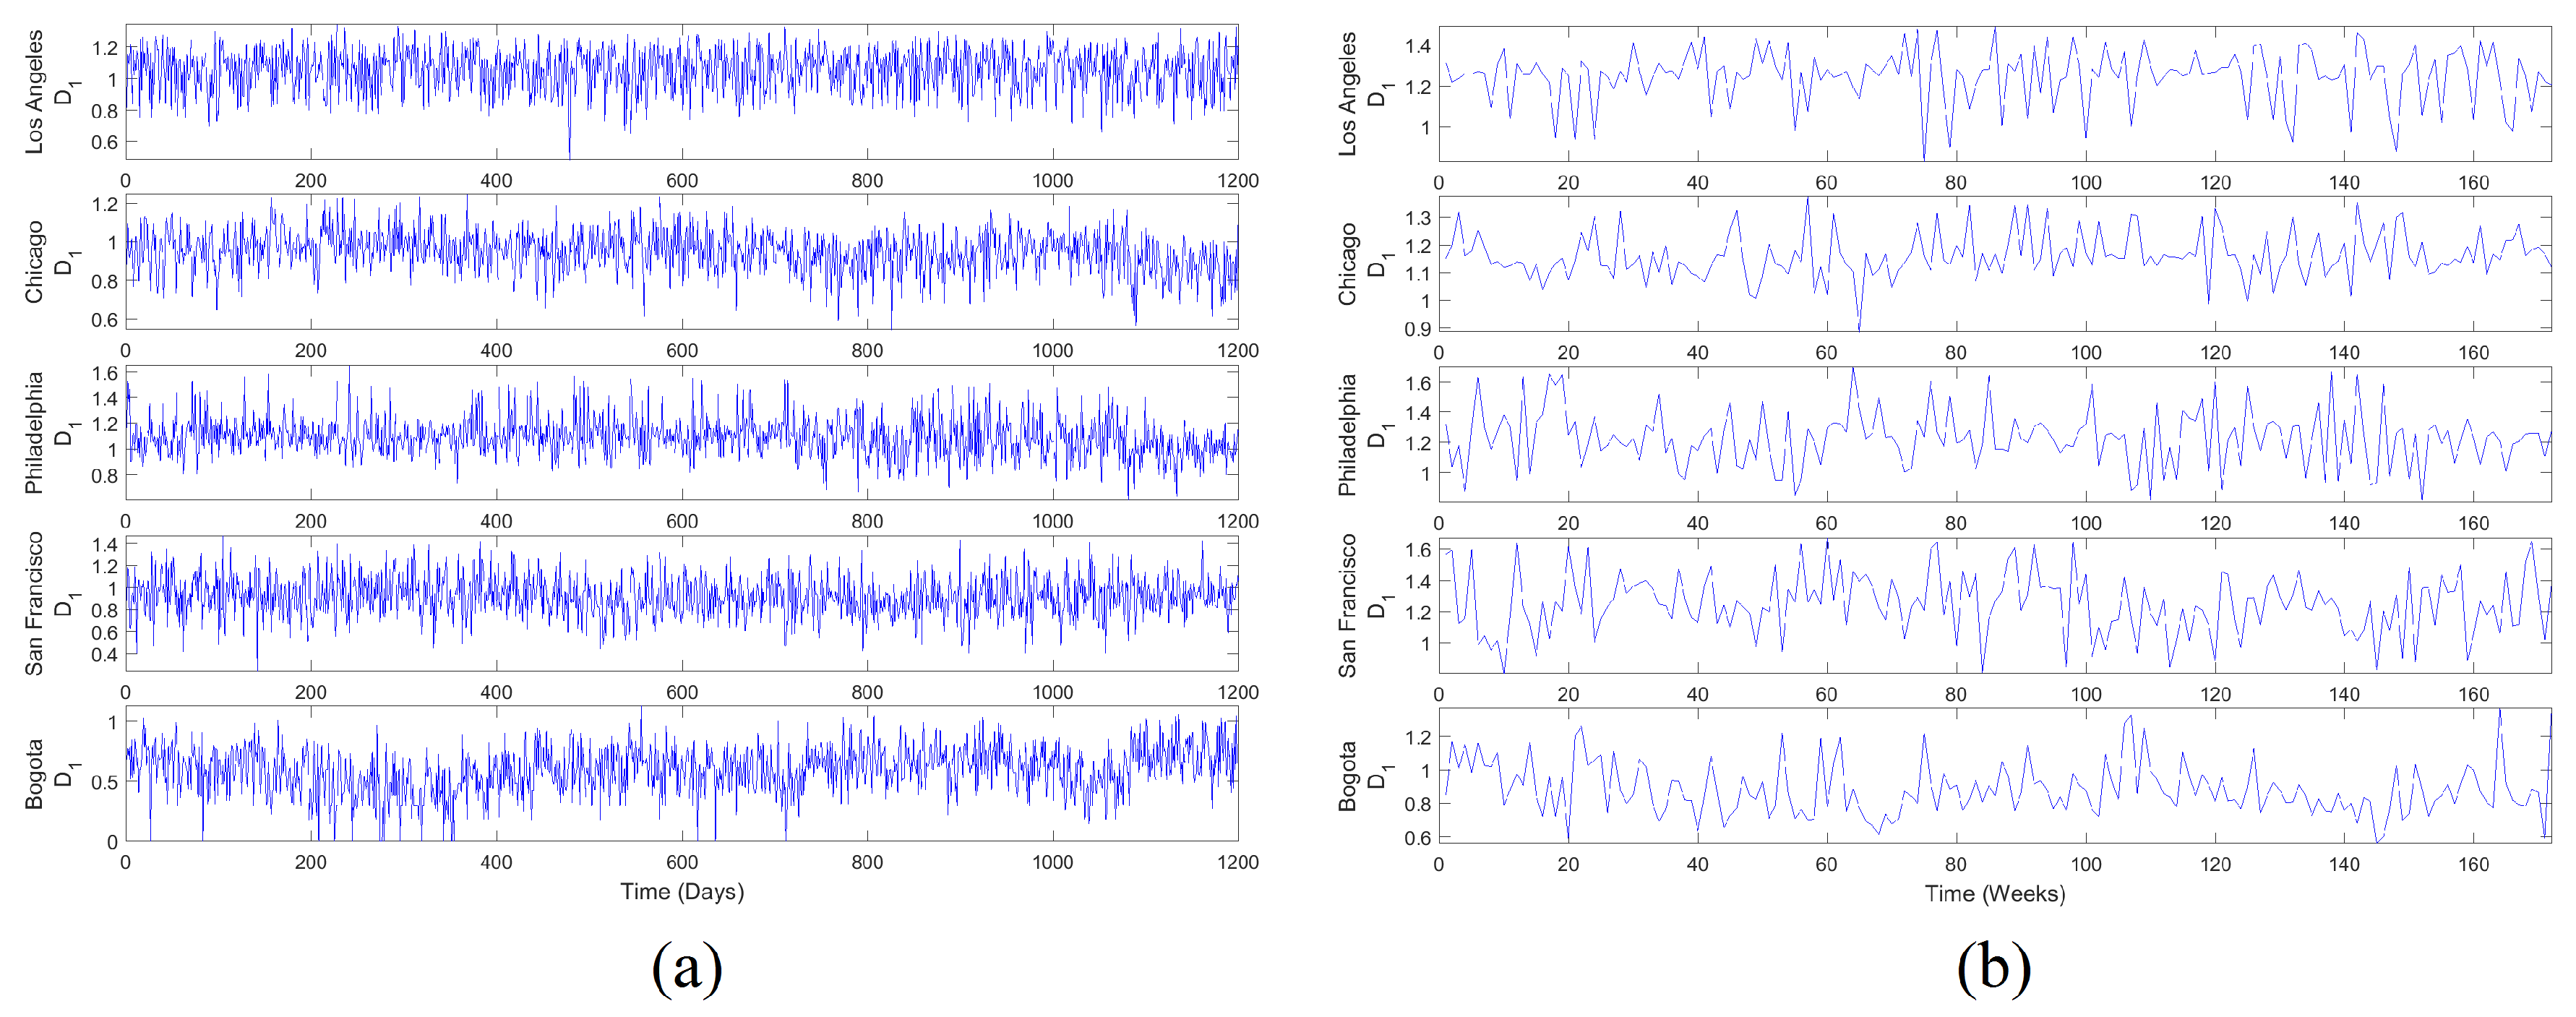
- Synthesis of MF time series: The signals , , , , and are constructed from the accepted dynamic multifractal spectrum . For those spectra whose concavity index is at zero, the value of MF time series can be recalculated using a larger . However, there is no guarantee of achieving the concavity of the spectrum despite this increase, because it will depend on whether there are enough complaints in the subreports that configure objects with at least monofractal behavior. Other mechanisms can be used to fix these values, such as filling methods that preserve local statistics of the signal around problematic values [58].
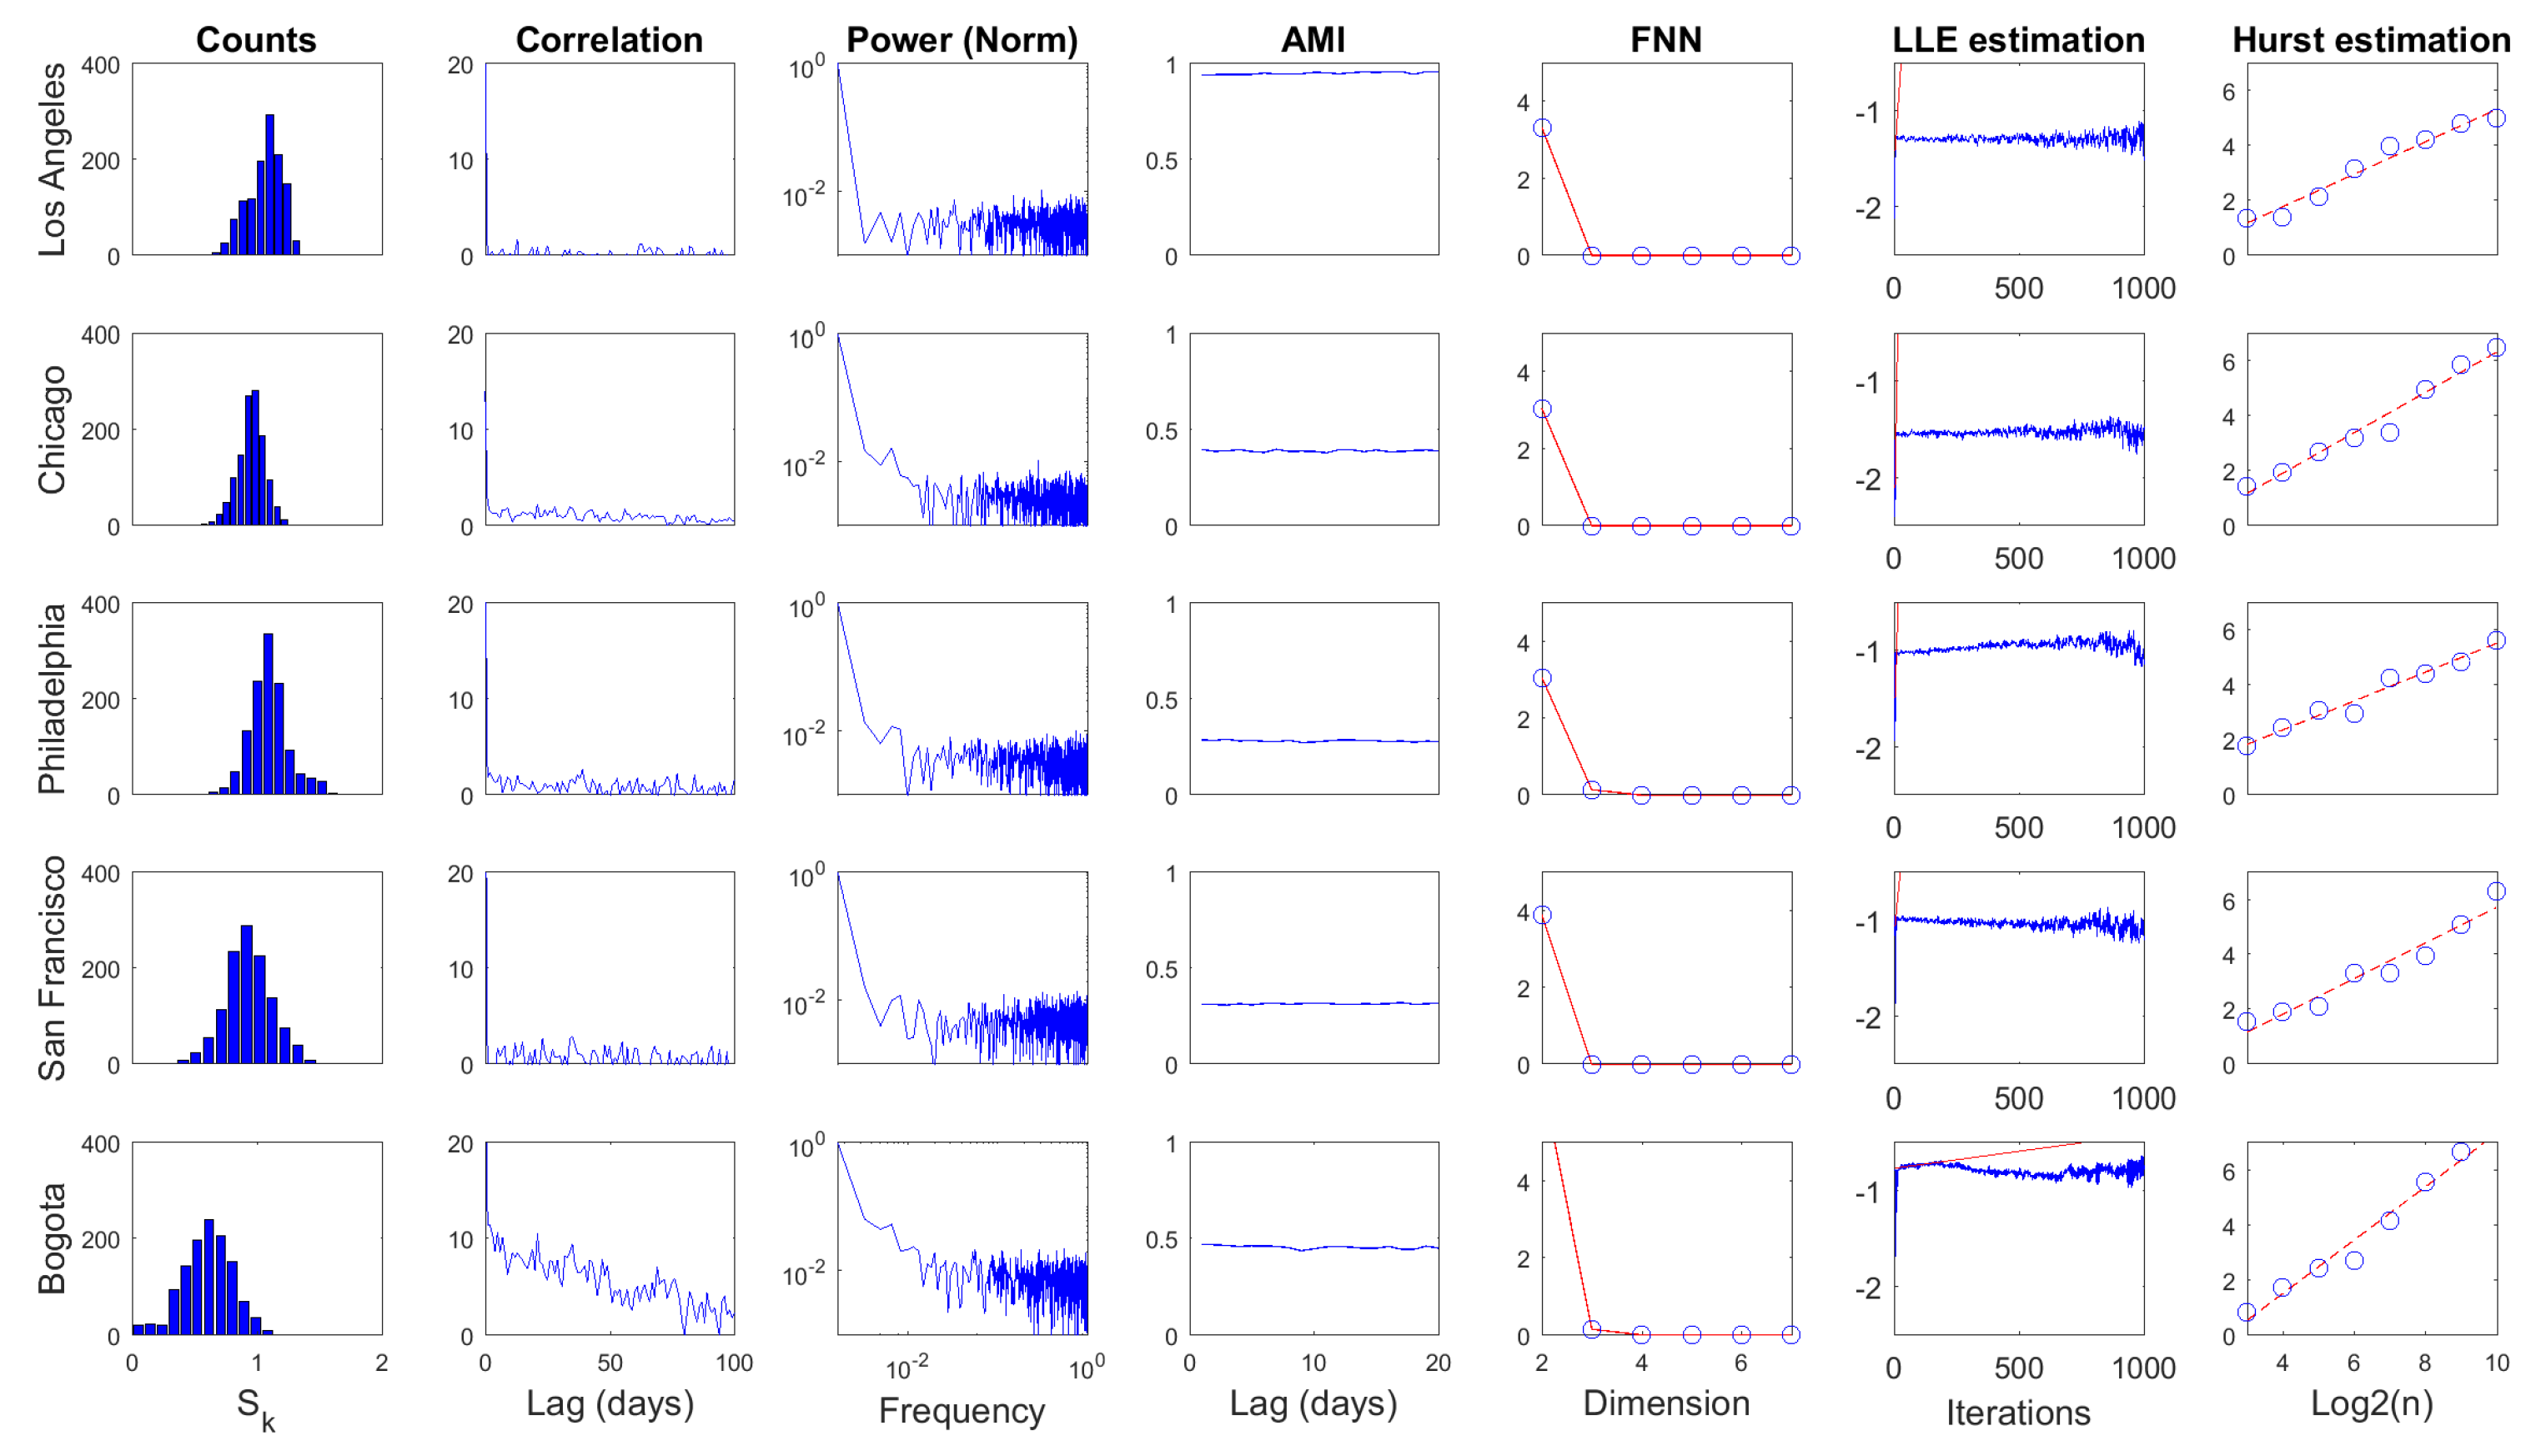
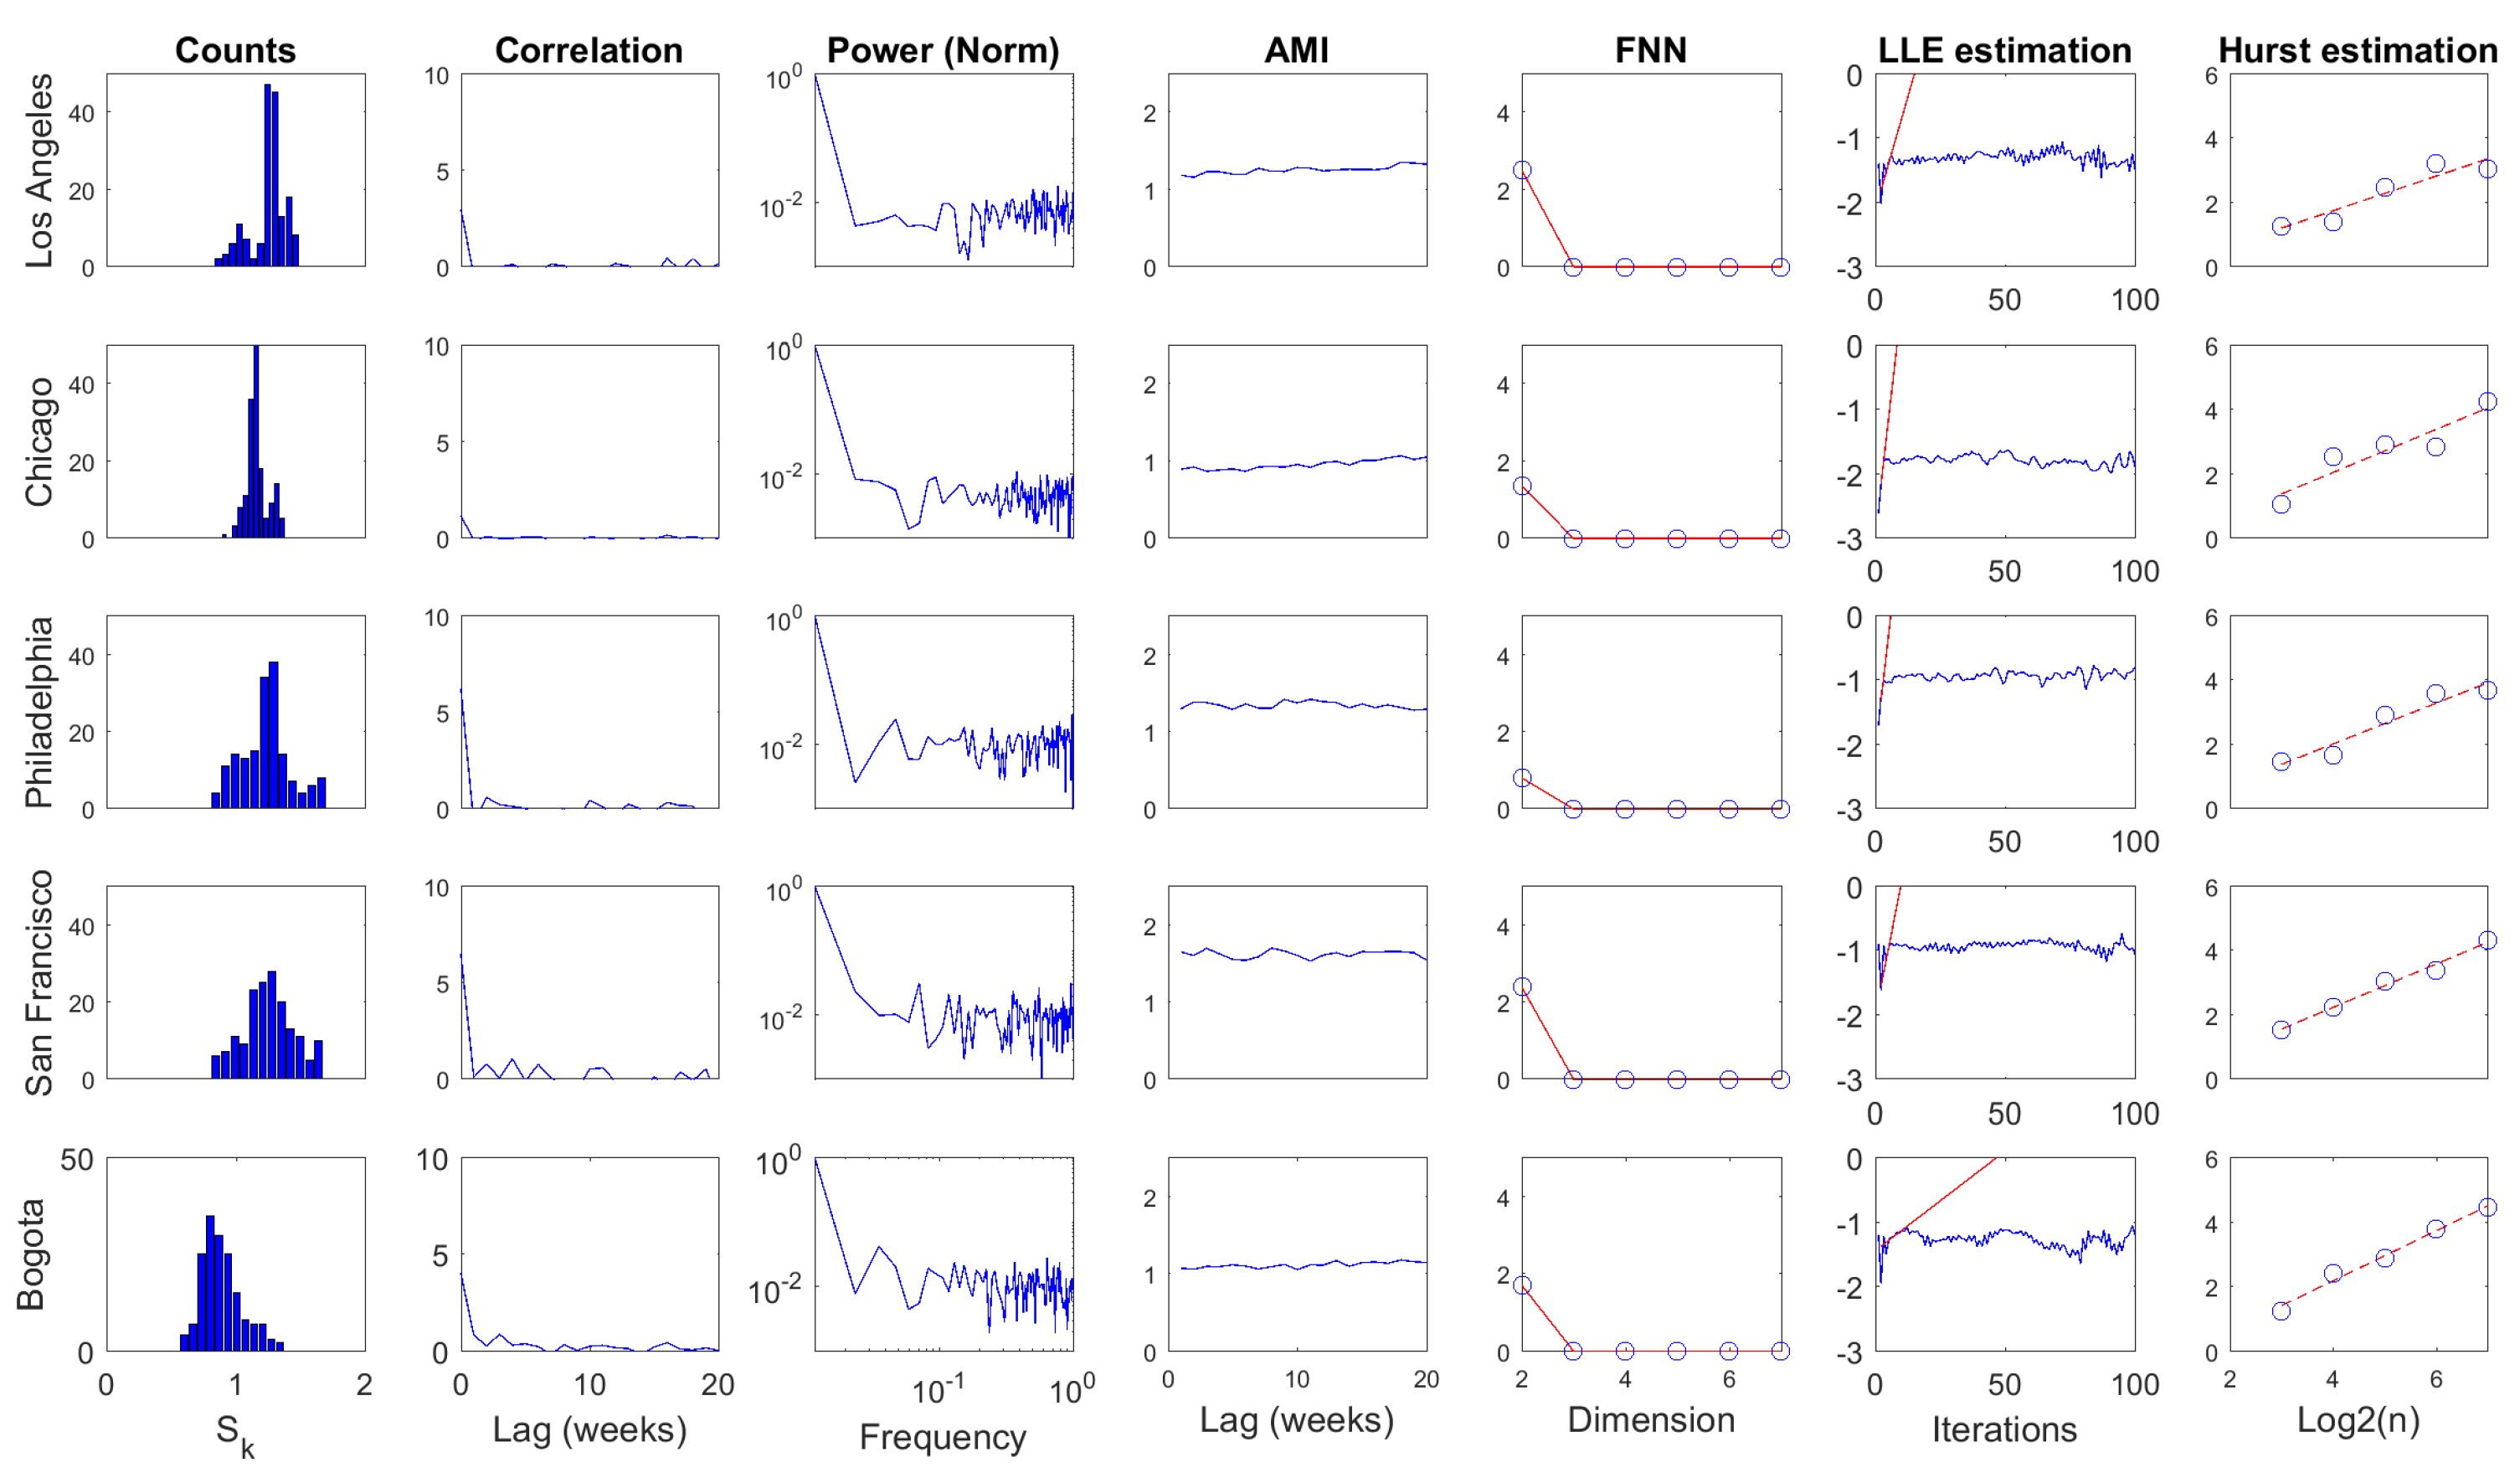
- Linear processing: Linear statistics are computed over produced MF time series, such as: autocorrelation function, power spectrum, mean estimation, variance estimation, and coefficient of variation, among others. It is recommended to complement this analysis with the calculation of the signal histogram. The autocorrelation and the power spectrum make it possible to determine if there are any periodic behaviors within the signal detectable in a linear sense. These two statistics have a special link through the Wiener–Khinchin [59] theorem. The other statistics are calculated in order to have an appreciation of the overall behavior of the signal [30,60].
- Nonlinear processing: In this stage, a battery of nonlinear statistics is applied to explore the structure of the time series to reveal details of its behavior that escape the linear analysis [30,50]. Some of the statistics that can be considered here are: average mutual information, dimension of the embedded phase space, and estimation of the maximum Lyapunov exponent, among others, which are based on the theory of dynamic systems, particularly nonlinear and chaotic systems [49,55,56]. Other approaches related to the detection of chaos in time series may consulted in [61]. This analysis can be complemented from a statistical perspective with an indicator of self-similarity and predictability, such as the Hurst exponent [14,29,37].
- Characteristic scales: In addition to the results produced from previous stages, spatio-temporal scales are suggested to approximate the understanding of the phenomenon. The reveals the minimum scale over which the temporal consistency in the mutifracatal properties of the phenomenon in space can be judged, manifesting itself as a sequence of coherent multifractal spectra, on which an attempt has been made to minimize the effect of degeneration. Results from linear processing may reveal the conservation of a spatial multifractal characteristic that can be predictable at a certain time scale. Meanwhile, the results from nonlinear processing indicate to what extent this characteristic may be chaotic, which would limit the prediction horizons in a certain time scale.
3.4. Information Scaling in Crime Reports
3.5. Information Patterns in Ordered Crime Reports
3.6. Research Data
4. Results
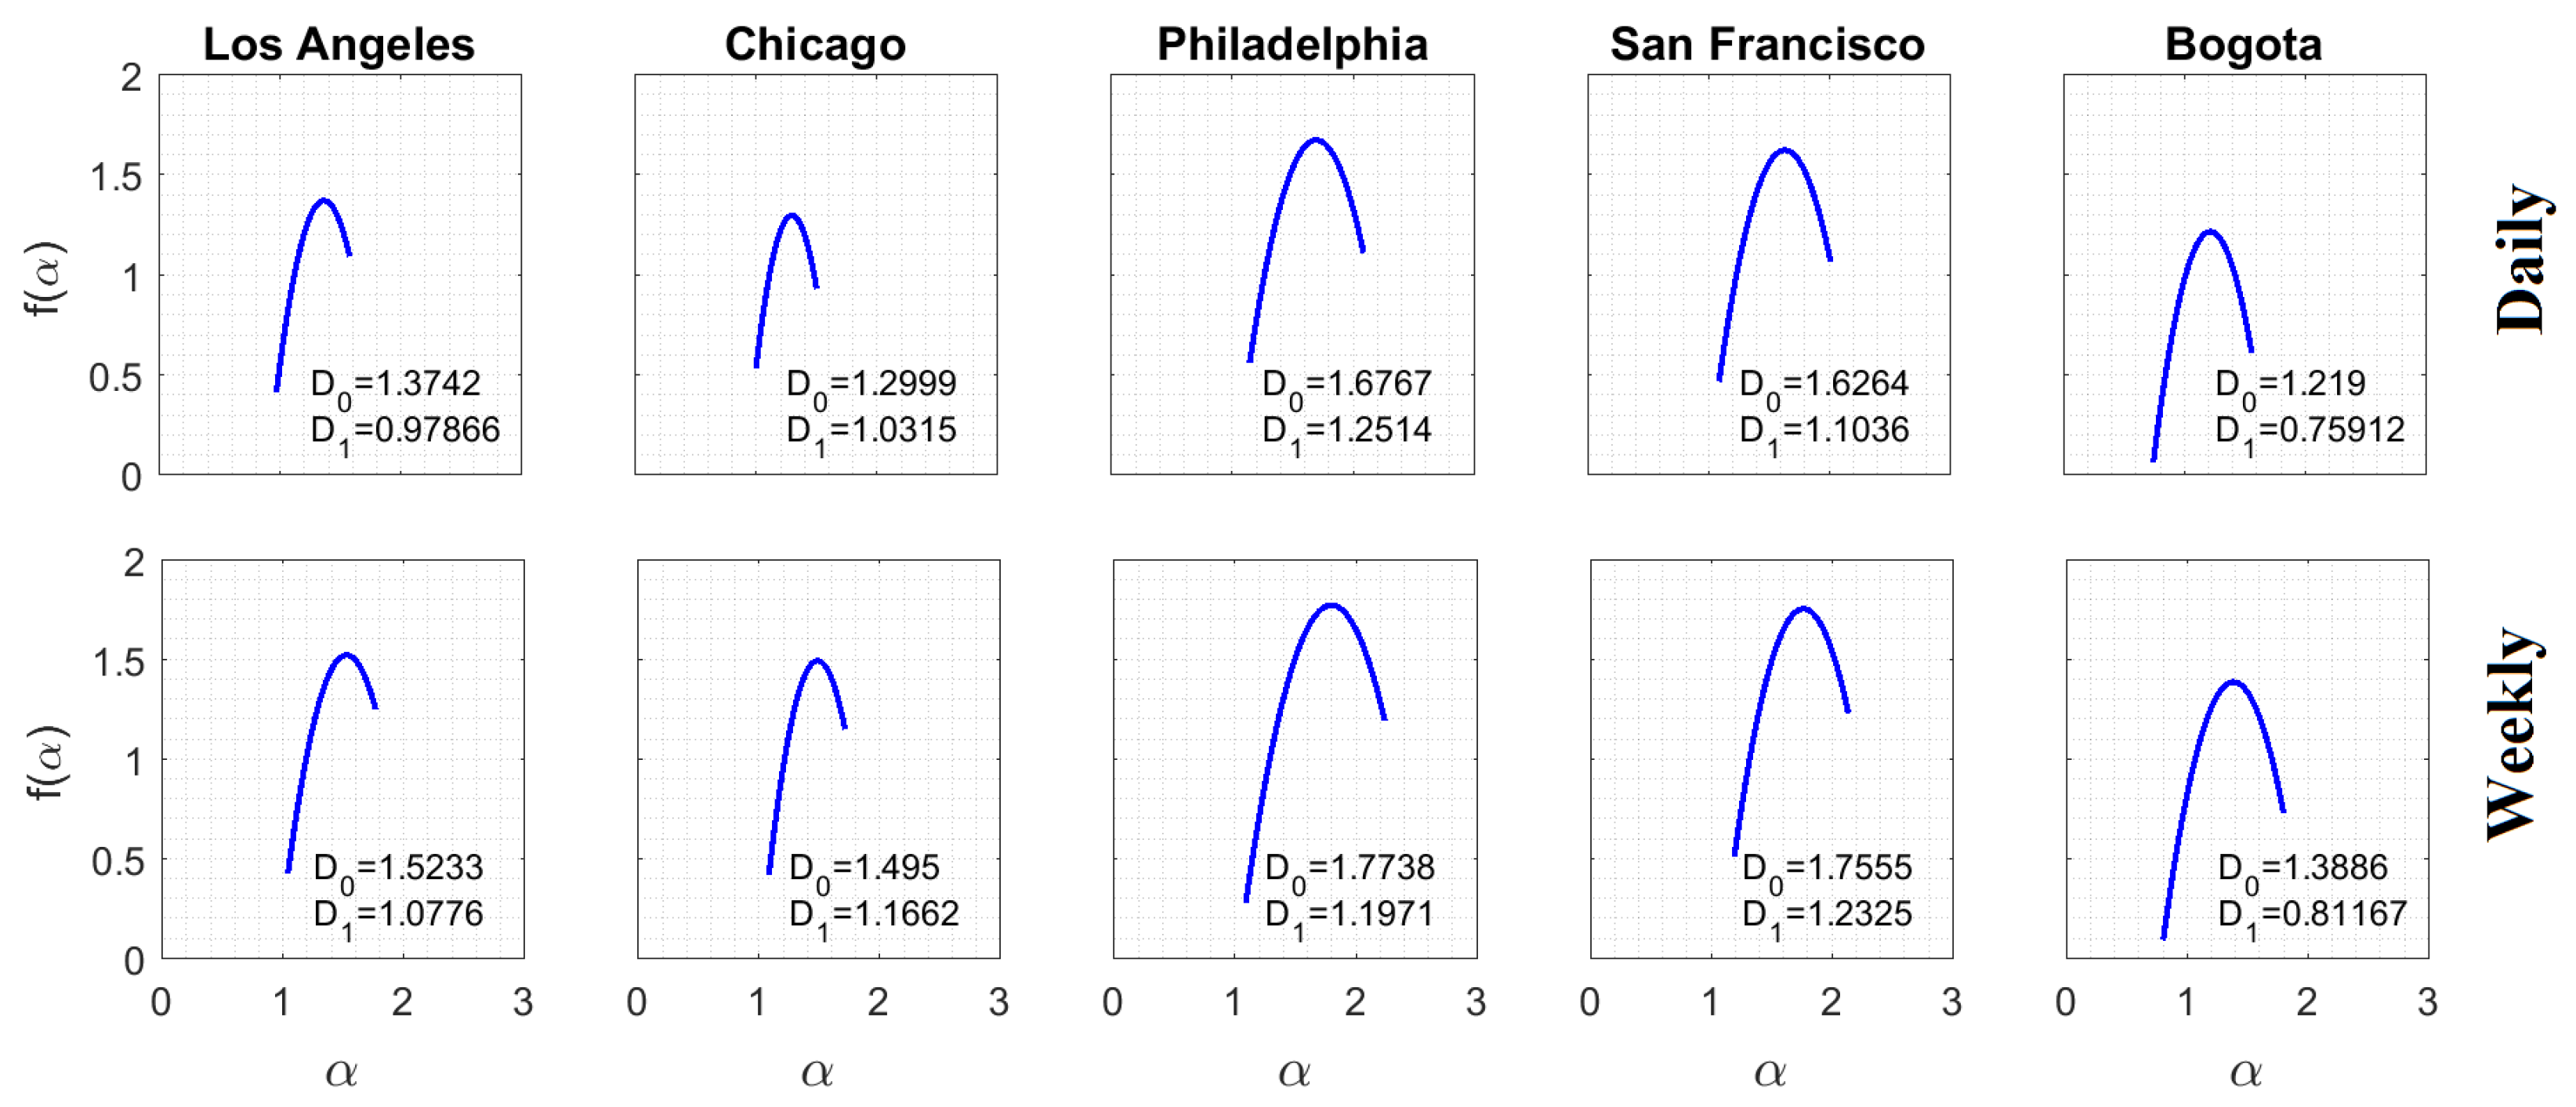
4.1. Multifractal Analysis of Crime Subreports
4.2. Cumulative Concavity Index
4.3. MF Time Series
4.4. Linear and Nonlinear Processing Results
5. Discussion
6. Conclusions
Author Contributions
Funding
Acknowledgments
Conflicts of Interest
References
- D’Orsogna, M.R.; Perc, M. Statistical physics of crime: A review. Phys. Life Rev. 2014, 12, 1–21. [Google Scholar] [CrossRef] [PubMed]
- Brantingham, P.J.; Brantingham, P.L. Crime Pattern Theory. In Environmental Criminology and Crime Analysis; Willian Publishing: Norwich, NY, USA, 2008; Chapter 5; pp. 78–93. [Google Scholar]
- Garnier, S.; Caplan, J.M.; Kennedy, L.W. Predicting Dynamical Crime Distribution From Environmental and Social Influences. Front. Appl. Math. Stat. 2018, 4, 13. [Google Scholar] [CrossRef]
- Perc, M.; Donnay, K.; Helbing, D. Understanding Recurrent Crime as System-Immanent Collective Behavior. PLoS ONE 2013, 8, e76063. [Google Scholar] [CrossRef] [PubMed]
- Helbing, D.; Brockmann, D.; Chadefaux, T.; Donnay, K.; Blanke, U.; Woolley-Meza, O.; Moussaid, M.; Johansson, A.; Krause, J.; Schutte, S.; et al. Saving Human Lives: What Complexity Science and Information Systems Can Contribute; Springer: Berlin/Heidelberg, Germany, 2014; Volume 158, pp. 735–781. [Google Scholar]
- Bettencourt, L.M.A.; Lobo, J.; Strumsky, D.; West, G.B. Urban scaling and its deviations: Revealing the structure of wealth, innovation and crime across cities. PLoS ONE 2010, 5, e13541. [Google Scholar] [CrossRef] [PubMed]
- Barnum, J.D.; Caplan, J.M.; Kennedy, L.W.; Piza, E.L. The crime kaleidoscope: A cross-jurisdictional analysis of place features and crime in three urban environments. Appl. Geogr. 2017, 79, 203–211. [Google Scholar] [CrossRef]
- Felson, M. Routine Activity Approach. In Environmental Criminology and Crime Analysis; Routledge: Abingdon, UK, 2008; pp. 70–77. [Google Scholar]
- Cornish, D.B.; Clarke, R.V. The rational choice perspective. In Environmental Criminology and Crime Analysis; Routledge: Abingdon, UK, 2008; pp. 21–45. [Google Scholar]
- Roth, R.E.; Ross, K.S.; Finch, B.G.; Luo, W.; MacEachren, A.M. Spatiotemporal crime analysis in U.S. law enforcement agencies: Current practices and unmet needs. Gov. Inf. Q. 2013, 30, 226–240. [Google Scholar] [CrossRef]
- Ratcliffe, J.H. CrimeMapping: Spatial and Temporal Challenges. In Handbook of Quantitative Criminology; Springer: Berlin/Heidelberg, Germany, 2010. [Google Scholar]
- Andresen, M.A.; Linning, S.J. The (in)appropriateness of aggregating across crime types. Appl. Geogr. 2012, 35, 275–282. [Google Scholar] [CrossRef]
- Mohler, G.O.; Short, M.B.; Brantingham, P.J.; Schoenberg, F.P.; Tita, G.E. Self-Exciting Point Process Modeling of Crime. J. Am. Stat. Assoc. 2011, 106, 100–108. [Google Scholar] [CrossRef] [Green Version]
- Melgarejo, M.; Obregon, N. Multifractal approach to the analysis of crime dynamics: Results for burglary in San Francisco. Fractals 2017, 25, 1750043. [Google Scholar] [CrossRef]
- Mohler, G. Marked point process hotspot maps for homicide and gun crime prediction in Chicago. Int. J. Forecast. 2014, 30, 491–497. [Google Scholar] [CrossRef]
- Mohler, G.; Short, M. Geographic profiling from kinetic models of criminal behavior. SIAM J. Appl. Math. 2012, 72, 163–180. [Google Scholar] [CrossRef]
- Short, M.B.; D’Orsogna, M.B.; Pasqour, V.B.; Tita, G.B.; Brantingham, P.J.; Bertozzi, A.L.; Chayes, L.B. A Statistical Model of Criminal Behavior. Math. Models Methods Appl. Sci. 2008, 18, 1249–1267. [Google Scholar] [CrossRef]
- Grubesic, T.H.; Wei, R.; Murray, A.T. Spatial Clustering Overview and Comparison: Accuracy, Sensitivity, and Computational Expense. Ann. Assoc. Am. Geogr. 2014, 104, 1134–1156. [Google Scholar] [CrossRef]
- Mayorga, D.; Melgarejo, M.; Obregon, N. A Fuzzy Clustering Based Method for the Spatiotemporal Analysis of Criminal Patterns. In Proceedings of the 2016 IEEE World Congress on Computational Intelligence, Vancouver, BC, Canada, 24–29 July 2016. [Google Scholar]
- Kang, H.W.; Kang, H.B. Prediction of crime occurrence from multi-modal data using deep learning. PLoS ONE 2017, 12, e0176244. [Google Scholar] [CrossRef] [PubMed]
- Kennedy, L.W.; Caplan, J.M.; Piza, E. Risk Clusters, Hotspots, and Spatial Intelligence: Risk Terrain Modeling as an Algorithm for Police Resource Allocation Strategies. J. Quant. Criminol. 2011, 27, 339–362. [Google Scholar] [CrossRef]
- Ohyama, T.; Amemiya, M. Applying Crime Prediction Techniques to Japan: A Comparison Between Risk Terrain Modeling and Other Methods. Eur. J. Crim. Policy Res. 2018, 1–19. [Google Scholar] [CrossRef]
- Drawve, G. A Metric Comparison of Predictive Hot Spot Techniques and RTM. Just. Q. 2016, 33, 369–397. [Google Scholar] [CrossRef]
- Oliveira, M.; Bastos-Filho, C.; Menezes, R. The scaling of crime concentration in cities. PLoS ONE 2017, 12, 1–13. [Google Scholar] [CrossRef] [PubMed]
- Davies, T.P.; Bishop, S.R. Modelling patterns of burglary on street networks. Crime Sci. 2013, 2, 10. [Google Scholar] [CrossRef]
- Malleson, N.; See, L.; Evans, A.; Heppenstall, A. Optimising an Agent-Based Model to Explore the Behaviour of Simulated Burglars. Intell. Syst. Ref. Libr. 2014, 52, 179–204. [Google Scholar]
- Gershenson, C.; Fernández, N. Complexity and information: Measuring emergence, self-organization, and homeostasis at multiple scales. Complexity 2012, 18, 29–44. [Google Scholar] [CrossRef] [Green Version]
- Frigg, R. In What Sense is the Kolmogorov-Sinai Entropy a Measure for Chaotic Behaviour? Bridging the Gap Between Dynamical Systems Theory and Communication Theory. Br. J. Philos. Sci. 2004, 55, 411–434. [Google Scholar] [CrossRef]
- Feder, J. Fractals; Plenum Press: New York, NY, USA, 1988. [Google Scholar]
- Abarbanel, H. Analysis of Observed Chaotic Data; Springer: New York, NY, USA, 1996. [Google Scholar]
- Lopes, R.; Betrouni, N. Fractal and multifractal analysis: A review. Med. Image Anal. 2009, 13, 634–649. [Google Scholar] [CrossRef] [PubMed]
- Puentes, C.; Obregon, N. A deterministic geometric representation of temporal rainfall: Results for a storm in Boston. Water Resour. Res. 1996, 32, 2825–2839. [Google Scholar] [CrossRef]
- Chen, Y. Zipf’s law, 1/f noise, and fractal hierarchy. Chaos Solitons Fractals 2012, 45, 63–73. [Google Scholar] [CrossRef]
- Bettencourt, L.M.a. The origins of scaling in cities. Science 2013, 340, 1438–1441. [Google Scholar] [CrossRef] [PubMed]
- Murcio, R.; Masucci, A.P.; Arcaute, E.; Batty, M. Multifractal to monofractal evolution of the London street network. Phys. Rev. E 2015, 92, 062130. [Google Scholar] [CrossRef] [PubMed]
- Semecurbe, F.; Tannier, C.; Roux, S.G. Spatial Distribution of Human Population in France: Exploring the Modifiable Areal Unit Problem Using Multifractal Analysis. Geogr. Anal. 2016, 48, 292–313. [Google Scholar] [CrossRef]
- Verma, A. The fractal dimension of Policing. J. Crim. Just. 1998, 26, 425–435. [Google Scholar] [CrossRef]
- Machado Filho, A.; Da Silva, M.F.; Zebende, G.F. Autocorrelation and cross-correlation in time series of homicide and attempted homicide. Phys. A Stat. Mech. Appl. 2014, 400, 12–19. [Google Scholar] [CrossRef]
- Brantingham, P.L.; Glasser, U.; Jackson, P.; Kinney, B.; Vajihollahi, M. Mastermind: A computational modeling and simulation of spatiotemporal aspects of crime in urban environments. In Artificial Crime Analysis Systems: Using Computer Simulations and Geographic Information Systems; Information Science Reference: Hershey, PA, USA, 2008; Chapter XIII; pp. 252–280. [Google Scholar]
- Brantingham, P.; Brantingham, P.; Vajihollahi, M.; Wuschke, K. Crime Analysis at Multiple Scales of Aggregation: A Topological Approach Patricia. In Putting Crimen in Its Place; Springer: New York, NY, USA, 2009; Chapter 4; pp. 87–107. [Google Scholar]
- Brantingham, P.L.; Brantingham, P.J. Criminality of place. Eur. J. Crim. Policy Res. 1995, 3, 5–26. [Google Scholar] [CrossRef]
- Ratcliffe, J.H. A Temporal Constraint Theory to Explain Opportunity-Based Spatial Offending Patterns. J. Res. Crime Delinq. 2006, 43, 261–291. [Google Scholar] [CrossRef] [Green Version]
- Rey, S.J.; Mack, E.A.; Koschinsky, J. Exploratory Space-Time Analysis of Burglary Patterns. J. Quant. Criminol. 2012, 28, 509–531. [Google Scholar] [CrossRef]
- Andresen, M.A.; Malleson, N. Testing the Stability of Crime Patterns: Implications for Theory and Policy. J. Res. Crime Delinq. 2011, 48, 58–82. [Google Scholar] [CrossRef]
- Felson, M. Crime and Nature; SAGE Publications: Newcastle upon Tyne, UK, 2006. [Google Scholar]
- Posadas, A.N.D.; Giménez, D.; Quiroz, R.; Protz, R. Multifractal Characterization of Soil Pore Systems. Soil Sci. Soc. Am. J. 2003, 67, 1361. [Google Scholar] [CrossRef]
- Lou, D.; Zhang, C.; Liu, H. The multifractal nature of the Ni geochemical field and implications for potential Ni mineral resources in the Huangshan-Jing’erquan area, Xinjiang, China. J. Geochem. Explor. 2015, 157, 169–177. [Google Scholar] [CrossRef]
- Nicolis, G.; Nicolis, C. Foundations of complex systems. Eur. Rev. 2009, 17, 237–248. [Google Scholar] [CrossRef]
- Strogatz, S.; Dichter, M. SET with Student Solutions Manual. In Nonlinear Dynamics and Chaos, 2nd ed.; Studies in Nonlinearity; Avalon Publishing: New York, NY, USA, 2016. [Google Scholar]
- Abarbanel, H.D.I.; Brown, R.; Sidorowich, J.J.; Tsimring, L.S. The analysis of observed chaotic data in physical systems. Rev. Mod. Phys. 1993, 65, 1331–1392. [Google Scholar] [CrossRef]
- Takens, F. Detecting strange attractors in turbulence. Lecture notes in mathematics. In Dynamical Systems and Turbulence; Springer: Berlin/Heidelberg, Germany, 1981; Volume 898, pp. 366–381. [Google Scholar]
- Grassberger, P.; Procaccia, I. Measuring the Strangeness of Strange Attractors. In The Theory of Chaotic Attractors; Hunt, B.R., Li, T.Y., Kennedy, J.A., Nusse, H.E., Eds.; Springer: New York, NY, USA, 2004; pp. 170–189. [Google Scholar]
- Kennel, M.B.; Brown, R.; Abarbanel, H.D.I. Determining embedding dimension for phase-space reconstruction using a geometrical construction. Phys. Rev. A 1992, 45, 3403–3411. [Google Scholar] [CrossRef] [PubMed]
- Wolf, A.; Swift, J.B.; Swinney, H.L.; Vastano, J.A. Determining Lyapunov exponents from a time series. Phys. D Nonlinear Phenom. 1985, 16, 285–317. [Google Scholar] [CrossRef] [Green Version]
- Rosenstein, M.T.; Collins, J.J.; De Luca, C.J. A practical method for calculating largest Lyapunov exponents from small data sets. Phys. D Nonlinear Phenom. 1993, 65, 117–134. [Google Scholar] [CrossRef] [Green Version]
- Maus, A.; Sprott, J.C. Evaluating Lyapunov exponent spectra with neural networks. Chaos Solitons Fractals Interdiscip. J. Nonlinear Sci. Nonequilib. Complex Phenom. 2013, 51, 13–21. [Google Scholar] [CrossRef]
- Xiong, G.; Yu, W.; Zhang, S. Time-singularity multifractal spectrum distribution based on detrended fluctuation analysis. Phys. A Stat. Mech. Its Appl. 2015, 437, 351–366. [Google Scholar] [CrossRef]
- Figueroa García, J.C.; Kalenatic, D.; Lopez Bello, C.A. Missing Data Imputation in Time Series by Evolutionary Algorithms. In 4th International Conference on Intelligent Computing; Springer: Berlin/Heidelberg, Germany, 2008; pp. 275–283. [Google Scholar]
- Ricker, D. Echo Signal Processing; Kluwer Academic Publishers: Norwell, MA, USA, 2003. [Google Scholar]
- Obregón, N.; Puente, C.E.; Sivakumar, B. Modeling High-Resolution Rain Rates Via a Deterministic Fractal-Multifractal Approach. Fractals 2002, 10, 387–394. [Google Scholar] [CrossRef]
- Kodba, S.; Perc, M.; Marhl, M. Detecting chaos from a time series. Eur. J. Phys. 2005, 26, 205–215. [Google Scholar] [CrossRef]
- Lin, Y.L.; Yen, M.F.; Yu, L.C. Grid-Based Crime Prediction Using Geographical Features. ISPRS Int. J. Geo-Inf. 2018, 7, 298. [Google Scholar] [CrossRef]
- Tompson, L.A.; Bowers, K.J. Testing time-sensitive influences of weather on street robbery. Crime Sci. 2015, 4. [Google Scholar] [CrossRef]
- Linning, S.J. Crime seasonality and the micro-spatial patterns of property crime in Vancouver, BC and Ottawa, ON. J. Crim. Just. 2015, 43, 544–555. [Google Scholar] [CrossRef]
- Malleson, N.; Andresen, M.A. Spatio-temporal crime hotspots and the ambient population. Crime Sci. 2015, 4, 10. [Google Scholar] [CrossRef]
- Sparks, C.S. Violent crime in San Antonio, Texas: An application of spatial epidemiological methods. Spat. Spatio-Temporal Epidemiol. 2011, 2, 301–309. [Google Scholar] [CrossRef] [PubMed]
- He, L.; Páez, A.; Liu, D.; Jiang, S. Temporal stability of model parameters in crime rate analysis: Anempirical examination. Appl. Geogr. 2015, 58, 141–152. [Google Scholar] [CrossRef]
- Hipp, J.R.; Kane, K. Cities and the larger context: What explains changing levels of crime? J. Crim. Just. 2017, 49, 32–44. [Google Scholar] [CrossRef] [Green Version]
- Phillis, Y.A.; Kouikoglou, V.S.; Verdugo, C. Urban sustainability assessment and ranking of cities. Comput. Environ. Urban Syst. 2017, 64, 254–265. [Google Scholar] [CrossRef]
- Chillar, V.; Drawve, G. Unpacking Spatio-temporal Differences of Risk for Crime: An Analysis in Little Rock, AR. Policy J. Policy Pract. 2018, pay018. [Google Scholar] [CrossRef]
- Caplan, J.M. Mapping the Spatial Influence of Crime and Implications for Crime Operationalization Schemes Correlates: A Comparison of Analysis and Criminal Justice Practice. Cityscape J. Policy Dev. Res. 2011, 13, 57–83. [Google Scholar]


| Case | Area (km) | Population (Billions USD) | Report Size (Complaints) | Mean Daily Complaints (Complaints per Day) | |
|---|---|---|---|---|---|
| Los Angeles (NA) | 12.15 | 860.45 | 121,974 | 99 | |
| Chicago (NA) | 8.6 | 563.18 | 57,745 | 47 | |
| Philadelphia (NA) | 5.44 | 346.45 | 91,806 | 75 | |
| San Francisco (NA) | 3.36 | 331.02 | 19,683 | 16 | |
| Bogota (SA) | 8.08 | 159.85 | 23,577 | 19 |
| (m) | CCI (Daily Scale) | CCI (Weekly Scale) | ||||
|---|---|---|---|---|---|---|
| 250 | 500 | 1000 | 250 | 500 | 1000 | |
| Los Angeles (NA) | 0.7500 | 0.6564 | 0.9742 | 0.8039 | 0.9755 | 0.9804 |
| Chicago (NA) | 0.6404 | 0.6507 | 0.9692 | 0.8798 | 0.9663 | 0.9760 |
| Philadelphia (NA) | 0.2889 | 0.9602 | 0.9767 | 0.9808 | 0.9760 | 0.9760 |
| San Francisco (NA) | 0.6188 | 0.9605 | 0.9757 | 0.9709 | 0.9757 | 0.9806 |
| Bogota (SA) | 0.8382 | 0.8732 | 0.9244 | 0.9657 | 0.9771 | 0.9771 |
| Average | 0.6273 | 0.8202 | 0.9640 | 0.9202 | 0.9741 | 0.9780 |
| Statistic | Mean | Std | CV | CorrLag | Specent | |||||
|---|---|---|---|---|---|---|---|---|---|---|
| Scale (Time) | Daily | Weekly | Daily | Weekly | Daily | Weekly | Daily | Weekly | Daily | Weekly |
| Los Angeles (NA) | 1.0578 | 1.2499 | 0.1367 | 0.1339 | 0.1292 | 0.1071 | 2 | 2 | 0.3342 | 0.2121 |
| Chicago (NA) | 0.9481 | 1.1616 | 0.1079 | 0.0838 | 0.1138 | 0.0722 | 4 | 2 | 0.2995 | 0.1606 |
| Philadelphia (NA) | 1.0936 | 1.2301 | 0.1536 | 0.1935 | 0.1405 | 0.1573 | 2 | 2 | 0.3328 | 0.2583 |
| San Francisco (NA) | 0.9252 | 1.2490 | 0.1839 | 0.1977 | 0.1988 | 0.1583 | 5 | 2 | 0.3774 | 0.2373 |
| Bogota (SA) | 0.5940 | 0.8870 | 0.1985 | 0.1556 | 0.3342 | 0.1755 | 2 | 3 | 0.3820 | 0.2356 |
| Statistic | AMILag | EmbD | LLE | Hurst | ||||
|---|---|---|---|---|---|---|---|---|
| Scale (Time) | Daily | Weekly | Daily | Weekly | Daily | Weekly | Daily | Weekly |
| Los Angeles (NA) | 1 | 2 | 3 | 3 | 76.1373 | 280.0472 | 0.5913 | 0.8043 |
| Chicago (NA) | 2 | 1 | 3 | 3 | 294.2945 | 698.2849 | 0.7356 | 0.8264 |
| Philadelphia (NA) | 2 | 1 | 4 | 3 | 156.3149 | 705.9980 | 0.5263 | 0.8143 |
| San Francisco (NA) | 3 | 2 | 3 | 3 | 53.3821 | 410.1712 | 0.6488 | 0.7790 |
| Bogota (SA) | 4 | 2 | 4 | 3 | 0.7062 | 61.7643 | 0.9718 | 0.8870 |
© 2018 by the authors. Licensee MDPI, Basel, Switzerland. This article is an open access article distributed under the terms and conditions of the Creative Commons Attribution (CC BY) license (http://creativecommons.org/licenses/by/4.0/).
Share and Cite
Melgarejo, M.; Obregon, N. Information Dynamics in Urban Crime. Entropy 2018, 20, 874. https://doi.org/10.3390/e20110874
Melgarejo M, Obregon N. Information Dynamics in Urban Crime. Entropy. 2018; 20(11):874. https://doi.org/10.3390/e20110874
Chicago/Turabian StyleMelgarejo, Miguel, and Nelson Obregon. 2018. "Information Dynamics in Urban Crime" Entropy 20, no. 11: 874. https://doi.org/10.3390/e20110874
APA StyleMelgarejo, M., & Obregon, N. (2018). Information Dynamics in Urban Crime. Entropy, 20(11), 874. https://doi.org/10.3390/e20110874