Article

Characterisation of the Effects of Sleep Deprivation on the Electroencephalogram Using Permutation Lempel–Ziv Complexity, a Non-Linear Analysis Tool

1
Centre for Biomedical Engineering, Department of Mechanical Engineering Sciences, Faculty of Engineering and Physical Sciences, University of Surrey, Guildford GU2 7XH, UK
2
Surrey Sleep Research Centre, Department of Clinical and Experimental Medicine, Faculty of Health and Medical Sciences, University of Surrey, Guildford GU2 7XH, UK
*
Author to whom correspondence should be addressed.
Entropy 2017, 19(12), 673; https://doi.org/10.3390/e19120673
Submission received: 30 October 2017 / Revised: 2 December 2017 / Accepted: 5 December 2017 / Published: 8 December 2017
(This article belongs to the Special Issue Symbolic Entropy Analysis and Its Applications)

Abstract

:
Specific patterns of brain activity during sleep and waking are recorded in the electroencephalogram (EEG). Time-frequency analysis methods have been widely used to analyse the EEG and identified characteristic oscillations for each vigilance state (VS), i.e., wakefulness, rapid-eye movement (REM) and non-rapid-eye movement (NREM) sleep. However, other aspects such as change of patterns associated with brain dynamics may not be captured unless a non-linear-based analysis method is used. In this pilot study, Permutation Lempel–Ziv complexity (PLZC), a novel symbolic dynamics analysis method, was used to characterise the changes in the EEG in sleep and wakefulness during baseline and recovery from sleep deprivation (SD). The results obtained with PLZC were contrasted with a related non-linear method, Lempel–Ziv complexity (LZC). Both measure the emergence of new patterns. However, LZC is dependent on the absolute amplitude of the EEG, while PLZC is only dependent on the relative amplitude due to symbolisation procedure and thus, more resistant to noise. We showed that PLZC discriminates activated brain states associated with wakefulness and REM sleep, which both displayed higher complexity, compared to NREM sleep. Additionally, significantly lower PLZC values were measured in NREM sleep during the recovery period following SD compared to baseline, suggesting a reduced emergence of new activity patterns in the EEG. These findings were validated using PLZC on surrogate data. By contrast, LZC was merely reflecting changes in the spectral composition of the EEG. Overall, this study implies that PLZC is a robust non-linear complexity measure, which is not dependent on amplitude variations in the signal, and which may be useful to further assess EEG alterations induced by environmental or pharmacological manipulations.

1. Introduction

Sleep is an essential part of everyday life. It affects a wide range of processes from cognitive performance and learning capabilities [1] to physical and emotional well-being that are thought to be related to neuronal plasticity [2,3]. Cortical and subcortical brain structures contribute to the generation of oscillatory dynamic activities that are reflected in the electroencephalogram (EEG). The characterisation of these oscillatory dynamics has received a lot of interest in sleep medicine for the past 50 years in the context of mental health, including neurodegeneration [4,5]. Sleep is subdivided into non-rapid-eye movement (NREM) and rapid-eye movement (REM) sleep [6]. Maintenance and transitions between vigilances states (VS) are regulated by changes in neural networks resulting in the cortical activity recorded by the EEG [7]. These dynamic changes in the EEG display various amplitudes (i.e., low amplitude in wakefulness and REM sleep and high amplitude in NREM sleep) and specific spectral features. Analysis of the EEG is based on the visual and/or automated scoring of vigilance states on epochs of various durations using defined criteria both in humans [8,9] and rodents [10,11]. Fourier Transform-based signal analysis has provided essential information about the amplitude and frequency features of the EEG associated with the different vigilance states, characterised by power density spectra revealing frequency components of the signal [12]. For instance, under physiological, baseline conditions, frequency distribution of the EEG power is characterised in rodents by theta (6–9 Hz) activity during wakefulness and REM sleep, while NREM sleep is associated with slow wave activity (SWA; 0.5–4.5 Hz) and spindle activity (10–15 Hz) [13,14] and power density in NREM sleep exhibits a decreasing trend in the time course of light (inactive) phase [15]. During recovery sleep after sleep deprivation (SD), increased levels of SWA is consistently observed both in rodents [16] and humans [6]. Fast Fourier Transform (FFT) analysis primarily identifies changes occurring in the sleep-wake cycle based on the frequency spectrum of the signal. Therefore, local changes which could be indications of brain activity changes are interpreted as a frequency component.
In order to further understand underlying changes of brain activity, non-linear analysis methods are valuable tools [17]. Numerous algorithms including traditional non-linear analysis methods, such as correlation dimension [18,19], Lyapunov exponent [20,21] or entropy [22,23,24] and artificial neural networks analyses [25,26], have been used to investigate the inherently non-linear nature of the EEG signal, where brain dynamics change due to different physiological states, pathologies, and manipulations [27]. Permutation Lempel–Ziv complexity (PLZC) is a novel symbolic dynamics analysis method which combines using the order of the data points in the symbolisation of the signal and measuring the emergence of new patterns within this new symbolised time series [28]. PLZC may be particularly useful in analysing biomedical signals as no assumption about the probability distribution of the data is necessary. It is also applicable to any time series that is long enough to ensure all possible patterns can be obtained in the symbolisation process (i.e., factorial of the length of order patters must be greater than the length of the time series). The length of the order patterns also allows the use of multiple symbols in the symbolisation process which overcomes the limited number of symbols (i.e., 0 and 1) used in measuring complexity with a related method, Lempel–Ziv complexity (LZC). This is of importance as LZC analysis is dependent to amplitude changes which are typical in signals such as the EEG. This is especially the case when a subset of a time-series has a large amplitude: some fast-frequency components within this subset maybe be lost due to same symbol being assigned to them, hence some aspects may be overlooked [29,30]. All the aforementioned features of PLZC suggest that it is useful to analyse any time-series without a priori information on how the time-series are generated and also provides an advantage in computation performance [28].
In this study, PLZC values were computed on baseline EEG recordings obtained in mice, as well as during recovery following SD to assess its effects on brain EEG activity. It was hypothesised that PLZC would identify differences in complexity between VS. In activated brain states (i.e., wakefulness and REM sleep), complexity was expected to be high and lower in NREM sleep episodes. Additionally, baseline and recovery sleep comparison would reveal dynamic changes due to SD in addition to the well-characterised changes in EEG power spectrum. The application of surrogate data analysis would validate our findings to be a measure of brain dynamics change in different VS (i.e., not mere changes in the spectra). Lastly, comparison with another non-linear analysis method such as LZC would generate complementary information to the state-of-the-art linear signal processing techniques.

2. Materials and Methods

2.1. Dataset

EEG and electromyogram (EMG) signals were recorded in seven, adult (11–13 weeks old at the time of surgery) wild-type male mice. All experimental procedures were carried out in accordance with the UK Animals (Scientific Procedures) Act 1986. The data were recorded using telemetry transmitter devices, as previously described [31]. The dataset consists of continuous 48-h EEG/EMG recordings. The first 24-h period include a 12-h light and a 12-h dark baseline recording periods. Sleep deprivation was performed in the last 6-h of the dark period, by gentle procedures [32]. The 6-h sleep deprivation period was then followed by a 24-h recovery period where subjects were allowed to sleep ad libitum.
EEG and EMG signals were sampled at 250 Hz at the time of recording. VS were classified for 4-s epochs by visual inspection of the EEG/EMG signals, according to standard criteria [10]. Rodents display “polyphasic” sleep, with very short NREM-REM sleep cycle, which are interrupted by brief awakenings (defined as episodes between 4 to 16 s) or more consolidated wake episodes. Selecting a 4-s epoch basis allows a higher precision and refinement of scoring of VS, including identifying transitions between VS. Based on the criterion, VS were classified as follows: wakefulness (high and variable EMG activity, high theta activity and low-amplitude EEG signal); NREM sleep (low EMG and high EEG amplitude, dominated by slow waves); and REM sleep (low EEG amplitude, loss of EMG muscle tone).

2.2. Lempel–Ziv Complexity

LZC is a non-linear method which includes coarse-graining of the original signal to form a symbol series and parsing of these to estimate complexity from the emergence of new sub-sequences within the symbol series [33,34]. The value used in the coarse-graining determines the amount of information extracted from the original time series and there are various techniques available [35]. In the current study, the median was chosen for the symbolic decomposition process due to its robustness to any deviant value within the time series [34,36,37]. The algorithm used in the analysis was based on [34] and can be detailed as:
(1)
The original signal X = x(i), x(i + 1), …, x(n), is symbolised according to the value of the original time series sample compared to the median value (Td) of the time series as:
s ( i ) = { 0 , if   x ( i ) < T d 1 , otherwise
(2)
The symbol series, P = s(1), s(2), …, s(n), is created. P is then parsed and used for the calculation of the complexity measure where,
(3)
S and Q (substrings of the symbol series) are allocated with the first and second symbols of the symbol series respectively and complexity counter c(n) is set to 1.
(4)
S and Q are merged together to form SQ and, SQv by deleting the last character of the string SQ. For example if, S = x(1), x(2), …, x(i) and Q = x(i + 1), …, x(i + j − 1), x(i + j), then SQ = x(1), x(2), …, x(i), x(i + 1), …, x(i + j) and SQv = x(1), x(2), …, x(i + j − 1).
(5)
Substring Q is sought in SQv. If Q is found in SQv, Q is updated by adding next symbol from the symbol series and step 4 is repeated. If not, S is updated to be SQ and Q is set to be the next symbol of {P(n)} and complexity counter is increased by one, lastly step 4 and 5 are repeated until all the series is parsed.
(6)
c(n) is the complexity counter of symbol sequence {P(n)} which denotes the number of distinct words found in the sequence. The total number of substrings present in {P(n)} has an upper bound [37] denoted as b(n):
b ( n ) = n l o g 2 n
The LZC output is then normalised as seen in Equation (3) where n denotes the total length of the symbol sequence. This step ensures calculated measures to be independent of time series. When n is very large:
C ( n ) = c ( n ) b ( n )

2.3. Permutation Lempel–Ziv Complexity

PLZC is a complexity measure combining ordinal patterns and the LZC algorithm to evaluate changes in the dynamics of the EEG [28]. In this method, the order of the patterns (i.e., permutation vectors known as “motifs”) is used in the symbolisation process of the time series. In the traditional permutation process, the length of the motifs is usually selected to be between 3 and 7 [38]. In our study, following notation introduced in [39], m represents the number of data points in each of the motifs [40]. In Figure 1A, all possible motifs that can be obtained with m = 3 and the symbolisation process are illustrated.
Motif length is an important criterion in the parameter selection of the permutation process, as the number of possible patterns is equal to m! and, thereby, the time series of interest has to be long enough to ensure all possible patterns can be obtained to allow reliable statistical analysis (e.g., patterns occur enough times in the time series) [41]. On the other hand, it was suggested that if data points allow (e.g., a 4-s epoch from a signal sampled at 250 Hz consist N = 1000 data points making 6 the limit of pattern length), larger values of m should be tried in order to quantify the dynamics changes happening over large time scales [42]. In addition to length, time delay “τ ” is another essential parameter in generating ordinal patterns; τ determines the location of sample points in the time series to be included within each motif according to the lag chosen (e.g., consecutive data points for τ = 1) [43]. Effects of time delay were extensively discussed in [40,44]. High time delay is equivalent to down-sampling the time series and τ = 1 was reported to provide the highest coverage within the signal’s frequency range. Time delay retains the maximum frequency range which can be achieved with the input parameters, thus, for larger m, smaller τ should be used [44]. Therefore, τ = 1 was selected as one of the input parameters in this study which provided the use of every data point in the symbolisation of the signal.
The original time series is transformed into a finite sequence {R(n)} based on permutation algorithm, i.e., the positions of time points in an embedded vector creates a motif and this corresponds to a symbol (Figure 1A) which forms the symbol sequence (Figure 1B). Complexity is then computed using step 3–5 detailed in the previous section. The upper bound denoted as L(n) is a combination of the complexity counter c(n) and the number of distinct patterns found in the symbol series can be estimated as in Equation (4):
L ( n ) = c ( n ) [ l o g m ! { c ( n ) } + 1 ]
The PLZC output is then normalised as seen in Equation (5) where n denotes the total length of the symbol sequence. This step ensures calculated measures to be independent of time series and motif lengths. When n is very large:
P L Z C = c ( n ) [ l o g m ! n ] n
In this study, m = 6 and τ = 1 were chosen as the input parameters to compute PLZC. PLZC was calculated for each 4-s epoch (N = 1000 data points). Results obtained from this analysis were then grouped and averaged over 1.5 h time intervals according to VS. Different combinations of input parameters were tested, including m = 3, τ = 1; m = 4, τ = 1; m = 5, τ = 1 and m = 6, τ = 1. The chosen input parameters have provided the highest percentage of significant epochs (1350 epochs in total) in a time interval by epoch-by-epoch comparisons between PLZC values in real time series (RTS) and surrogate time series (STS). In Table 1, these numbers were presented for only one subject in all periods (i.e., baseline light (BL), baseline dark (BD), recovery light (RL) and recovery dark (RD)).

2.4. Surrogate Data Analysis

Various algorithms have been developed to generate surrogate datasets characterised by the same power spectrum of the original signal while modifications were implemented to alter the signal preserving amplitude distribution or embedded coherence [45,46]. Surrogate data allow investigating whether the time series of interest cannot be only described by linear models (e.g., FFT used in preserving power spectrum and autocorrelation function of the time series) and that the non-linear analysis of interest allows identifying non-linear structures embedded in the signal underlying dynamic physiological variations. In order to validate our findings, LZC and PLZC were also performed using surrogate data. Our aim was to evaluate if differences identified by LZC and PLZC associated with VS and SD were a result of alterations in the brain dynamics. The algorithm introduced in [47] was used. First, Fourier coefficients of the signal were obtained by FFT. Next, the phases of these coefficients were randomised but the magnitudes were not altered to ensure spectral consistency. Finally, the Inverse FFT into time domain was performed. The resulting surrogate data could not be discriminated from the original data set with respect to the spectral characteristics (Figure 2). When a non-linear method is used on the surrogate dataset and the results obtained from the real and surrogate data are statistically significant, the method is reflecting a non-linear feature i.e., complexity of the signal due to emergence of new patterns in the signal. Figure 2 illustrates original and surrogate time series with their corresponding power spectral density graphs where the same spectral features were achieved for two completely different time series (i.e., blue lines for RTS and red lines for STS).

2.5. Statistical Analysis

Statistical analyses were performed using the IBM SPSS Statistics v.23 software with probabilities of p < 0.05 considered as significant.
In this study, the EEG was analysed per vigilance state by 1.5-h interval (i.e., time intervals) per 12-h light and 12-h dark periods during baseline and recovery sleep. To determine the difference between complexity values calculated from RTS and STS, a non-parametric Related Samples Wilcoxon Signed Rank Test was performed on both LZC and PLZC results in 4 periods, i.e., BL, BD, RL and RD.
In order to investigate the possible effects of the periods, time intervals and VS on PLZC values were investigated only on the real time series. A mixed model repeated measures analysis of variance-ANOVA (RMA) was used to determine the main effects. Subsequently, recovery period PLZC values were used to characterise the effects of SD on the brain dynamics from the EEG. Post-hoc Bonferroni and Dunnett’s tests were applied and significance set at p < 0.05.

3. Results

3.1. Non-Linear Complexity Measures-Surrogate Data Analysis

LZC and PLZC values were calculated for each epoch (4-s), averaged over 1.5-h intervals and, grouped per VS and period to determine whether the complexity measured with LZC and PLZC reflects changes in the dynamics using RTS and STS (non-parametric Related Samples Wilcoxon Signed Rank Test). Table 2 shows that complexity measures computed from RTS and STS were only significantly different for the majority of the time intervals with PLZC, while complexity values assessed with LZC were not significantly different between RTS and STS. In Table 2, no p-values were computed in the time intervals which were marked with N/A, due to insufficient numbers of NREM and/or REM sleep episodes within these time intervals in the bout of SD.
The differences in complexity measure obtained between RTS and STS were observed throughout the 48-h time course for PLZC (Figure 3B).
On the upper panels, wakefulness was characterised with the highest complexity in all periods. This was observed both in LZC (left panel) and PLZC (right panel) indicating the most complex brain activity in this VS. Complexity in REM sleep was lower than in wakefulness, but higher than NREM sleep in all periods. NREM sleep was characterised by the lowest complexity measures in both LZC and PLZC. This was consistent in all periods reflecting lower brain activity during NREM sleep compared to wakefulness and REM sleep. There were almost no changes in complexity between RTS and STS in LZC analysis (Table 2). This suggests that LZC analysis was affected by the amplitude content whereas PLZC reflected changes in the brain dynamics. On the lower panels, LZC and PLZC values were plotted in BL to show the differences in complexity obtained by these methods in each VS. Complexity in wakefulness and NREM sleep were not significantly different (black error bars in STS and red error bars in RTS in Figure 3) and yielded to the high p-values in LZC analysis. On the other hand, PLZC analysis reflected marked differences in NREM sleep which contributed to higher significance obtained in Table 2.

3.2. Effects of Sleep Deprivation

As significant differences between RTS and STS were only obtained with PLZC, all subsequent statistical analyses were performed on PLZC results for RTS EEG (Table 3) using RMA. During baseline EEG recordings, wakefulness and REM sleep were characterised by significantly higher PLZC values compared to NREM sleep (p < 0.001; Table 3), suggesting increased complexity in brain activity during waking and REM sleep. This was found for all periods (i.e., BL, BD, RL, RD; upper right panel Figure 3). Figure 4 also illustrates the significant effects of SD during the recovery light period which follows SD.
To determine the effects of SD on brain dynamics assessed by PLZC, RMA was performed to investigate the effects of time intervals, periods and VS. According to Mauchly’s test results assumptions of sphericity for complexity values in time intervals (x2(27) = 403.16, p < 0.001) was violated therefore the degree of freedom, df, was corrected using Huynh–Feldt estimates of sphericity (ε = 0.262). Significant main effect of “Time interval” (F(1.83, 93.49) = 18.69, p < 0.001) was found. Interactions including, “Time interval” × “period”, “Time interval” × “VS” and “Time interval” × “period” × “VS” were also considered (F(5.50, 93.49) = 11.62, p < 0.001; F(3.67, 93.49) = 2.25, p = 0.075 and F(7.33, 93.49) = 2.12, p = 0.047 respectively). PLZC measures changed significantly in the time course within a period (e.g., BL, BD, RL and RD), but also reflected significantly different complexity in the EEG between periods (“Time” × “Sleep period”, p < 0.001). Moreover, pairwise comparisons of complexity values of periods were performed to evaluate the interaction effects of the SD. For time intervals #1 to 4, F(3, 60) = 11.33, p < 0.001, r = 0.800, F(3, 60) = 11.72, p < 0.001, r = 0.776, F(3, 60) = 10.46, p < 0.001, r = 0.905 and F(3, 60) = 4.40, p = 0.008, r = 0.941 were obtained respectively suggesting a significant change at the time course of within a period. Main effect of time intervals was also found with 30-min time intervals analysis. This was performed in addition to 1.5-h time intervals analysis, which reflected proportional significant changes in complexity (i.e., PLZC in time intervals #1–12 were markedly lower following SD). Bonferroni comparisons between periods revealed that complexity in BL was significantly higher compared to RL (p < 0.001) and BD was significantly higher compared to RD (p < 0.001) in wakefulness. This marked difference in complexity was observed both in NREM sleep and REM sleep between BL and RL (p < 0.001). These changes in the complexity within periods (BL, BD, RL and RD) are illustrated in Figure 4D–F. Compared to BL, RL was significantly lower within the first half of the sleep course. Particularly in NREM sleep, complexity was significantly lower than in BL which suggest a further reduction on the brain activity in addition to the change associated with VS. When the two recovery periods were compared, it was observed that the brain activity in RL was affected by SD more than RD where changes in complexity were similar to those in BD (Table 3).

4. Discussion

In this pilot study, the usability of the PLZC method to identify changes in complexity of EEG signals was investigated. We first validated our results using surrogate data analysis. This analysis compared complexity measures of real and surrogate time series in both LZC and PLZC. Related Samples Wilcoxon Signed Test was performed revealing PLZC was superior in that it was able to identify changes in the non-linear dynamics of the signal, while LZC merely reflected the spectral (amplitude) signature of the EEG signal (Table 2; Figure 3). These results support the hypothesis that PLZC would reveal changes in brain dynamics, and hence can be used as a non-linear analysis tool.
Different non-linear analysis methods have been previously applied to the sleep EEG. The pioneering studies used methods such as correlation dimension (D2) [48,49,50], Hurst exponent (H) [51] and detrended fluctuations analysis (DFA) [52,53,54]. Complexity of brain activity was quantified by a relative increase or decrease where D2 and H measures decreased from wakefulness to NREM sleep and increased during REM sleep. Additionally, lower D2 values in NREM sleep were observed compared to baseline EEG following SD [55]. In DFA, different types of processes (e.g., 1/f noise, Brownian Noise etc.) were used to describe different sleep stages. Wakefulness and REM stages resulted in values similar to pink noise (1/f) and Brownian noise as sleep deepened. These first approaches to characterise complexity were based on quantifying the degree of compressibility, using small sequences of time series to describe the series’ complexity. It was hypothesised that the complexity of a simple/regular series could be estimated easily and concisely as a ratio of its small sequence to the time series whereas this estimation would be difficult for complex time series [27]. A signal that could not be compressed into smaller sequences, e.g., white or random noise would result in high complexity and a periodic signal would result in low complexity. To address this aspect, entropy based methods were developed to measure the uncertainty of the system and the probability distributions of samples used in the system’s complexity estimation. Entropy-based methods revealed fundamental mechanisms of physiological time series by showing a continuous loss of complexity in ageing and disease, and reduced adaptability of these systems in sudden changes [27]. In sleep research, permutation entropy (PE), approximate entropy (ApEn) and sample entropy (SampEn) have been previously used. All these methods measure the regularity of a time series which results in lower entropy in regular (e.g., periodic) signals or higher if the signal is irregular or complex. Our study is consistent with previous reports using PE [56], ApEn [57,58] and SampEn [59] in the characterisation of sleep stages. These resulted in the highest entropy values obtained from wakefulness episodes and REM sleep values being higher than in NREM sleep stages 2–4. Also, a gradual increase in the entropy values in NREM sleep due to reduced regularity in brain activity in the course of a period was reported [56]. This is consistent with our findings in RL where complexity increased during the period. However, when other periods were investigated, no significant changes in complexity were found in the time course which is maybe reflecting the fact that background brain activity remains at a certain level during NREM sleep.
In our study, PLZC identified differences in complexity measure between vigilance states (Table 3). Our results also revealed that PLZC in NREM sleep was markedly affected by SD which is consistent with previous studies using FFT analysis [13,16,31,60,61] and non-linear analysis [55]. In wakefulness and REM sleep, we did not find any significant effect of SD. In NREM sleep following SD, our measurements resulted in lower PLZC values due to decreased complexity in brain activity. This is likely a consequence of increased SWA activity (0.5–4.5 Hz), and increased levels of SWA was reported in SD compensation [13,16,62] during recovery sleep and particularly in the first half of recovery sleep [60,61]. In our analysis, PLZC values in NREM sleep in RL were significantly lower than baseline levels in the first four time intervals (Figure 4). This indicates that our results might be reflecting the increased levels of SWA, which is a hallmark of sleep need. Changes in SWA would need to be confirmed by FFT analysis. Nevertheless, surrogate data analysis corroborates the change in the signal complexity following SD. Additionally, in NREM sleep, complexity values increased in the course of RL suggesting an increase in complexity in brain activity. This result is compatible with the decreasing SWA in NREM sleep during recovery [16], which in our study resulted in increased complexity values potentially due to the reduced SWA toward the end of the period and sleep compensation process. Therefore, this was reflected in PLZC analysis as increased complexity possibly due to reduced neuronal synchronisation [62,63]. In other periods, non-significant changes in PLZC values were observed both in wakefulness and REM sleep (Figure 3A, right panel).
Only a limited number of non-linear analyses were performed in rodent studies. Abasolo et al. [36] assessed the effect of SD in rats using two different symbolisation processes in LZC and compared LZC measures with power spectral density measures. LZC values were high in wakefulness and REM sleep and low in NREM sleep. Additionally, decreased LZC values were also obtained following SD due to increased SWA obtained by FFT. Our PLZC results are consistent with these complexity measures. LZC was also used in other studies [64,65,66,67,68] to estimate the information content in spike trains during different brain states. To exclude external stimuli, spike trains were recorded during the dark period. Sleep episodes were characterised by lower levels of information compared to wakefulness, which were measured as low complexity in sleep and high complexity in wakefulness.
While PLZC is a novel and promising method to analyse the EEG, some aspects of the algorithm need to be standardised. Tononi et al. [69] put forward multiple definitions of complexity, which is important for the interpretation of the results using non-linear analysis methods. In this study, a permutation vector length of six and a lag of one were used. However, different combinations of permutation vector lengths and time delays could reveal additional information about the sleep EEG. Future studies should evaluate the effects of these parameters, not only on the EEG but also for other biological signals with a non-linear nature. Effects of these input parameters should also be confirmed and correlated with FFT based methods to characterise how these input parameters might limit the analyses for some frequency ranges [44] in sleep research. Validation of PLZC analysis should also be performed on larger datasets to confirm the usefulness of this method even though previous studies reported consistent findings of complexity in altered consciousness (i.e., higher complexity in wakefulness [70] and REM sleep compared to NREM) in EEG durations as short as two to four minutes [71].
In summary, our findings suggest that PLZC could be a valuable non-linear analysis method and could complement standard FFT analyses of the EEG. PLZC proved to be reliable in discriminating between vigilance states and capturing the changing brain dynamics due to a manipulation such as sleep deprivation. Non-linear symbolic dynamic analysis of the EEG is a promising tool to gain further insights into the interpretation of brain activity during the sleep-wake cycle as a complementary approach to methods based on the Fourier transform.

Acknowledgments

The data used in this study were collected in a Biological Sciences Research Council research grant (BB/I008926/1) to R. Winsky-Sommerer. We would like to thank the Turkish Republic Ministry of Education for their Higher Education Bursary Scheme which provided funding for the PhD of P.D. Tosun. We also thank Derk-Jan Dijk for helpful comments on the manuscript and Peter Williams from Statistical Advice Centre at University of Surrey for advice and support for the statistical analyses.

Author Contributions

Raphaelle Winsky-Sommerer designed the experimental study, oversaw data collection and analysis. Gillian Stenson collected and scored the data. Pinar Deniz Tosun wrote the MATLAB codes and analysed the data. Pinar Deniz Tosun, Daniel Abasolo and Raphaelle Winsky-Sommerer contributed to data analysis, interpretation of the data and wrote the manuscript. All authors have read, revised and approved the final manuscript.

Conflicts of Interest

The authors declare no conflict of interest.

References

  1. Muto, V.; Jaspar, M.; Meyer, C.; Kusse, C.; Chellappa, S.L.; Degueldre, C.; Balteau, E.; Shaffii-Le Bourdiec, A.; Luxen, A.; Middleton, B.; et al. Local modulation of human brain responses by circadian rhythmicity and sleep debt. Science 2016, 353, 687–690. [Google Scholar] [CrossRef] [PubMed]
  2. Navarro-Sanchis, C.; Brock, O.; Winsky-Sommerer, R.; Thuret, S. Modulation of Adult Hippocampal Neurogenesis by Sleep: Impacts on Mental Health. Front. Neural Circuits 2017, 11, 1–14. [Google Scholar] [CrossRef] [PubMed]
  3. Raven, F.; Van der Zee, E.A.; Meerlo, P.; Havekes, R. The role of sleep in regulating structural plasticity and synaptic strength: Implications for memory and cognitive function. Sleep Med. Rev. 2017, in press. [Google Scholar] [CrossRef] [PubMed]
  4. Baglioni, C.; Navoska, S.; Regen, W.; Spiegelhalder, K.; Feige, B.; Nissen, C.; Reynolds, C.F.; Riemann, D. Sleep and mental disorders: A meta-analysis of polysomnographic research. Psychol. Bull. 2016, 142, 969–990. [Google Scholar] [CrossRef] [PubMed]
  5. Mander, B.A.; Winer, J.R.; Jagust, W.J.; Walker, M.P. Sleep: A novel mechanistic pathway, biomarker and treatment target in the pathology of Alzheimer’s disease. Trends Neurosci. 2016, 39, 552–566. [Google Scholar] [CrossRef] [PubMed]
  6. Dijk, D.J. Regulation and functional correlates of slow wave sleep. J. Clin. Sleep Med. 2009, 5 (Suppl. 2), 6–15. [Google Scholar]
  7. Scammell, T.E.; Arrigoni, E.; Lipton, J.O. Neural circuitry of wakefulness and sleep. Neuron 2017, 93, 747–765. [Google Scholar] [CrossRef] [PubMed]
  8. Rechtschaffen, A.; Kales, A. A Manual of Standardized Terminology, Techniques, and Scoring Systems for Sleep Stages of Human Subjects; University of California: Los Angeles, CA, USA, 1968. [Google Scholar]
  9. American Academy of Sleep Medicine. The AASM manual for the scoring of sleep and associated events: Rules. In Terminology and Technical Specifications; AASM: Westchester, NY, USA, 2007. [Google Scholar]
  10. Winsky-Sommerer, R.; Vyazovskiy, V.V.; Homanics, G.E.; Tobler, I. The effects of THIP (Gabaxadol) on sleep and waking are mediated by the GABAAδ-subunit-containing receptors. Eur. J. Neurosci. 2007, 25, 1893–1899. [Google Scholar] [CrossRef] [PubMed]
  11. McCarthy, A.; Loomis, S.; Eastwood, B.; Wafford, K.A.; Winsky-Sommerer, R. Gilmour, G. Modelling maintenance of wakefulness in rats: Comparing potential non-invasive sleep-restriction methods and theirs effects on sleep and attentional performance. J. Sleep Res. 2017, 26, 179–187. [Google Scholar] [CrossRef] [PubMed]
  12. Prerau, M.J.; Brown, R.E.; Bianchi, M.T.; Ellenbogen, M.J.; Purdon, P.L. Sleep neurophysiological dynamics through the lens of multitaper spectral analysis. Physiology 2017, 32, 60–92. [Google Scholar] [CrossRef] [PubMed]
  13. Borbély, A.A.; Tobler, I.; Hanagasioglu, H. Effect of sleep deprivation on sleep and EEG power spectra in the rat. Behav. Brain Res. 1984, 14, 171–182. [Google Scholar]
  14. Franken, P.; Malafosse, A.; Tafti, M. Genetic variation in EEG activity during sleep in inbred mice. Am. J. Physiol. 1998, 275 Pt 2, 1127–1137. [Google Scholar]
  15. Borbély, A.A.; Neuhaus, N.U. Sleep-deprivation: Effects on sleep and EEG in the rat. J. Comp. Physiol. 1979, 133, 71–87. [Google Scholar] [CrossRef]
  16. Rechtschaffen, A.; Gilliland, M.A.; Bergmann, B.M.; Winter, J.B. Physiological correlates of prolonged sleep deprivation in rats. Science 1983, 221, 182–184. [Google Scholar] [CrossRef] [PubMed]
  17. Akay, M. Detection and Estimation Methods for Biomedical Signals; Academic Press: Cambridge, MA, USA, 1996. [Google Scholar]
  18. Meyer-Lindenberg, A. The evolution of complexity in human brain development: An EEG study. Electroencephalogr. Clin. Neurophysiol. 1996, 99, 405–411. [Google Scholar] [CrossRef]
  19. Pijn, J.P.; Van Neerven, J.; Noest, A.; Lopes da Silva, F.H. Chaos or noise in EEG signals; dependence on state and brain site. Electroencephalogr. Clin. Neurophysiol. 1991, 79, 371–381. [Google Scholar] [CrossRef]
  20. Röschke, J.; Fell, J.; Beckmann, P. The calculation of the first positive Lyapunov exponent in sleep EEG data. Electroencephalogr. Clin. Neurophysiol. 1993, 86, 348–352. [Google Scholar] [CrossRef]
  21. Güler, N.F.; Übeyli, E.D.; Güler, I. Recurrent neural networks employing Lyapunov exponents for EEG signals classification. Expert Syst. Appl. 2005, 29, 506–514. [Google Scholar] [CrossRef]
  22. Pardey, J.; Roberts, S.; Tarassenko, L. A review of parametric modelling techniques for EEG analysis. Med. Eng. Phys. 1996, 18, 2–11. [Google Scholar] [CrossRef]
  23. Ma, Y.; Shi, W.; Peng, C.; Yang, A.C. Nonlinear dynamical analysis of sleep electroencephalography using fractal and entropy approaches. Sleep Med. Rev. 2017, in press. [Google Scholar] [CrossRef] [PubMed]
  24. Cao, Y.; Tung, W.; Gao, J.; Protopopescu, V.A.; Hively, L.M. Detecting dynamical changes in time series using the permutation entropy. Phys. Rev. E 2004, 70, 046217. [Google Scholar] [CrossRef] [PubMed]
  25. Turchetti, C.; Crippa, P.; Pirani, M.; Biagetti, G. Representation of nonlinear random transformations by non-Gaussian stochastic neural networks. IEEE Trans. Neural Netw. 2008, 19, 1033–1060. [Google Scholar] [CrossRef] [PubMed]
  26. Grech, R.; Cassar, T.; Muscat, J.; Camilleri, K.P.; Fabri, S.G.; Zervakis, M.; Xanthopoulos, P.; Sakkalis, V.; Vanrumste, B. Review on solving the inverse problem in EEG source analysis. J. NeuroEng. Rehab. 2008, 5, 1–33. [Google Scholar] [CrossRef] [PubMed]
  27. Stam, C.J. Nonlinear dynamical analysis of EEG and MEG: Review of an emerging field. Clin. Neurophysiol. 2005, 116, 2266–2301. [Google Scholar] [CrossRef] [PubMed]
  28. Bai, Y.; Liang, Z.; Li, X. A permutation Lempel–Ziv complexity measure for EEG analysis. Biomed. Signal Process. Control 2015, 19, 102–114. [Google Scholar] [CrossRef]
  29. Azami, H.; Escudero, J. Amplitude-aware permutation entropy: Illustration in spike detection and signal segmentation. Comput. Methods Programs Biomed. 2016, 128, 40–51. [Google Scholar] [CrossRef] [PubMed]
  30. Ibáñez-Molina, A.J.; Iglesias-Parro, S.; Soriano, M.F.; Aznarte, J.I. Multiscale Lempel–Ziv complexity for EEG measures. Clin. Neurophysiol. 2015, 126, 541–548. [Google Scholar] [CrossRef] [PubMed]
  31. Hasan, S.; van der Veen, D.R.; Winsky-Sommerer, R.; Dijk, D.J.; Archer, S.N. Altered sleep and behavioural activity phenotypes in PER3-deficient mice. Am. J. Physiol. Regul. Integr. Comp. Physiol. 2011, 301, 1821–1830. [Google Scholar] [CrossRef] [PubMed]
  32. Palchykova, S.; Winsky-Sommerer, R.; Shen, H.Y.; Boison, D.; Gerling, A.; Tobler, I. Manipulation of adenosine kinase affects sleep regulation in mice. J. Neurosci. 2010, 30, 13157–13165. [Google Scholar] [CrossRef] [PubMed] [Green Version]
  33. Lempel, A.; Ziv, J. On the complexity of finite sequences. IEEE Trans. Inf. Theory 1976, 22, 75–81. [Google Scholar] [CrossRef]
  34. Aboy, M.; Hornero, R.; Abasolo, D.; Alvarez, D. Interpretation of the Lempel-Ziv complexity measure I the context of biomedical signal analysis. IEEE Trans. Biomed. Eng. 2006, 53, 2282–2288. [Google Scholar] [CrossRef] [PubMed]
  35. Nagarajan, R. Quantifying physiological data with Lempel-Ziv complexity-certain issues. IEEE Trans. Biomed. Eng. 2002, 49, 1371–1373. [Google Scholar] [CrossRef] [PubMed]
  36. Abasolo, D.; Simons, S.; Morgado da Silva, R.; Tononi, G.; Vyazovskiy, V.V. Lempel-Ziv complexity of cortical activity during sleep and waking in rats. J. Neurophysiol. 2015, 113, 2742–2752. [Google Scholar] [CrossRef] [PubMed] [Green Version]
  37. Hu, J.; Gao, J.; Principe, J.C. Analysis of biomedical signals by the Lempel-Ziv complexity: The effect of finite data size. IEEE Trans. Biomed. Eng. 2006, 53, 2606–2609. [Google Scholar] [PubMed]
  38. Bandt, C.; Pompe, B. Permutation entropy: A natural complexity measure for time series. Phys. Rev. Lett. 2002, 88, 174102. [Google Scholar] [CrossRef] [PubMed]
  39. Bian, C.; Qin, C.; Ma, Q.D.; Shen, Q. Modified permutation-entropy analysis of heartbeat dynamics. Phys. Rev. E 2012, 85, 0219061. [Google Scholar] [CrossRef] [PubMed]
  40. Keller, K.; Unakafov, A.M.; Unakafova, V.A. Ordinal patterns, entropy, and EEG. Entropy 2014, 16, 6212–6239. [Google Scholar] [CrossRef]
  41. Li, D.; Li, X.; Liang, Z.; Voss, L.J.; Sleigh, J.W. Multiscale permutation entropy analysis of EEG recordings during sevoflurane anaesthesia. J. Neural Eng. 2010, 7, 046010. [Google Scholar] [CrossRef] [PubMed]
  42. Olofsen, E.; Sleigh, J.W.; Dahan, A. Permutation entropy of the electroencephalogram: A measure of anaesthetic drug effect. Br. J. Anaesth. 2008, 101, 810–821. [Google Scholar] [CrossRef] [PubMed]
  43. Unakafova, V.A.; Keller, K. Efficiently measuring complexity on the basis of real-world data. Entropy 2013, 15, 4392–4415. [Google Scholar] [CrossRef]
  44. King, J.; Sitt, J.D.; Faugeras, F.; Rohaut, B.; El Karoui, I.; Cohen, L.; Naccache, L.; Dehaene, S. Information sharing in the brain indexes consciousness in noncommunicative patients. Curr. Biol. 2013, 23 (Suppl. 1), 1914–1919. [Google Scholar] [CrossRef] [PubMed]
  45. Dolan, K.T.; Spano, M.L. Surrogate for nonlinear time series analysis. Phys. Rev. E 2001, 64, 046128. [Google Scholar] [CrossRef] [PubMed]
  46. Schreiber, T.; Schmitz, A. Surrogate time series. Physics D 2000, 142, 346–382. [Google Scholar] [CrossRef]
  47. Palus, M.; Hoyer, D. Detecting nonlinearity and phase synchronization with surrogate data. IEEE Eng. Med. Biol. Mag. 1998, 17, 40–45. [Google Scholar] [CrossRef] [PubMed]
  48. Achermann, P.; Hartmann, R.; Gunzinger, A.; Guggenbüh, W.; Borbély, A.A. Correlation dimension of the human sleep electroencephalogram: Cyclic changes in the course of the night. Eur. J. Neurosci. 1994, 6, 497–500. [Google Scholar] [CrossRef] [PubMed]
  49. Rapp, P.; Zimmerman, I.; Albano, A.; Deguzman, G.; Greenbaun, N. Dynamics of spontaneous neural activity in the simian motor cortex: The dimension of chaotic neurons. Phys. Lett. A 1985, 110, 335–338. [Google Scholar] [CrossRef]
  50. Acharya, R.; Faust, O.; Kannathal, N.; Chua, T.; Laxminarayan, S. Non-linear analysis of EEG signals at various sleep stages. Comput. Methods Programs Biomed. 2005, 80, 37–45. [Google Scholar] [CrossRef] [PubMed]
  51. Achermann, P.; Hartmann, R.; Gunzinger, A.; Guggenbühl, W.; Borbély, A.A. All-night sleep EEG and artificial stochastic control signals have similar correlation dimensions. Electroencephalogr. Clin. Neurophysiol. 1994, 90, 384–387. [Google Scholar] [CrossRef]
  52. Fell, J.; Röschke, J.; Mann, K.; Schäffner, C. Discrimination of sleep stages: A comparison between spectral and nonlinear EEG measures. Electroencephalogr. Clin. Neurophysiol. 1996, 98, 401–410. [Google Scholar] [CrossRef]
  53. Weiss, B.; Clemens, Z.; Bódizs, R.; Vágó, Z.; Halász, P. Spatio-temporal analysis of monofractal and multifractal properties of the human sleep EEG. J. Neurosci. Methods 2009, 185, 116–124. [Google Scholar] [CrossRef] [PubMed]
  54. Lee, J.; Kim, D.; Kim, I.; Park, K.S.; Kim, S.I. Nonlinear-analysis of human sleep EEG using detrended fluctuation analysis. Med. Eng. Phys. 2004, 26, 773–776. [Google Scholar] [CrossRef] [PubMed]
  55. Dai-Jin Kim, M. Effect of total sleep deprivation on the dimensional complexity of the waking EEG. Sleep 2001, 24, 197–202. [Google Scholar]
  56. Nicolaou, N.; Georgiou, J. The use of permutation entropy to characterize sleep electroencephalograms. Clin. EEG Neurosci. 2011, 42, 24–28. [Google Scholar] [CrossRef] [PubMed]
  57. Bruhn, J.; Röpcke, H.; Rehberg, B.; Bouillon, T.; Hoeft, A. Electroencephalogram approximate entropy correctly classifies the occurrence of burst suppression pattern as increasing anaesthetic drug effect. J. Am. Soc. Anesthesiol. 2000, 93, 981–985. [Google Scholar] [CrossRef]
  58. Burioka, N.; Miyata, M.; Cornélissen, G.; Halberg, F.; Takeshima, T.; Kaplan, D.T. Approximate entropy in the electroencephalogram during wake and sleep. Clin. EEG Neurosci. 2005, 36, 21–24. [Google Scholar] [CrossRef] [PubMed]
  59. Bruce, E.N.; Bruce, M.C.; Vennelaganti, S. Sample entropy tracks changes in electroencephalogram power spectrum with sleep state and aging. J. Clin. Neurophysiol. 2009, 26, 257–266. [Google Scholar] [CrossRef] [PubMed]
  60. Franken, P.; Dijk, D.J.; Tobler, I.; Borbély, A.A. Sleep deprivation in rats: Effects on EEG power spectra, vigilance states, and cortical temperature. Am. J. Physiol. 1991, 261 Pt 2, 198–208. [Google Scholar]
  61. Tobler, I.; Borbély, A.A. The effect of 3-h and 6-h sleep deprivation on sleep and EEG spectra of the rat. Behav. Brain Res. 1990, 36, 73–78. [Google Scholar] [CrossRef]
  62. Steriade, M. The corticothalamic system in sleep. Front. Biosci. 2003, 878–899. [Google Scholar] [CrossRef]
  63. Timofeev, I.; Bazhenov, M.; Seigneur, J.; Sejnowski, T. Neuronal synchronization and thalamocortical rhythms in sleep, wake and epilepsy. In Jasper’s Basic Mechanisms of the Epilepsies, 4th ed.; Noebels, J.L., Avoli, M., Rogawski, M.A., Olsen, R.W., Delgado-Escueta, A.V., Eds.; National Centre for Biotechnology Information (US): Bethesda, MD, USA, 2012. [Google Scholar]
  64. Amigo, J.M.; Szczepanski, J.; Wajnryb, E.; Sanchez-Vives, M.V. Estimating the entropy rate of spike trains via Lempel-Ziv complexity. Neural Comput. 2004, 16, 717–736. [Google Scholar] [CrossRef] [PubMed]
  65. Amigo, J.M.; Szczepanski, J.; Wajnryb, E.; Sanchez-Vives, M.V. On the number of states of the neuronal sources. Biosystems 2003, 68, 57–66. [Google Scholar] [CrossRef]
  66. Arnold, M.M.; Szczepanski, J.; Montejo, N.; Amigo, J.M.; Sanchez-Vives, M.V. Information content in cortical spike trains during brain state transitions. J. Sleep Res. 2013, 22, 13–21. [Google Scholar] [CrossRef] [PubMed]
  67. Szczepański, J.; Amigo, J.M.; Wajnryb, E.; Sanchez-Vives, M.V. Application of Lempel–Ziv complexity to the analysis of neural discharges. Network 2003, 14, 335–350. [Google Scholar] [CrossRef] [PubMed]
  68. Szczepański, J.; Amigo, J.M.; Wajnryb, E.; Sanchez-Vives, M.V. Characterizing spike trains with Lempel–Ziv complexity. Neurocomputing 2004, 58 (Suppl. C), 79–84. [Google Scholar] [CrossRef]
  69. Tononi, G.; Edelman, G.M.; Sporns, O. Complexity and coherency: Integrating information in the brain. Trends Cogn. Sci. 1998, 2, 474–484. [Google Scholar] [CrossRef]
  70. Bai, Y.; Liang, Z.; Li, X.; Voss, L.J.; Sleigh, J.W. Permutation Lempel-Ziv complexity measure of electroencephalogram in GABAergic anaesthetics. Physiol. Meas. 2015, 36, 2483–2501. [Google Scholar] [CrossRef] [PubMed]
  71. Mateos, D.M.; Guevara Erra, R.; Wennberg, R.; Perez Velaquez, J.L. Measures of entropy and complexity in altered states of consciousness. arXiv, 2017; arXiv:1701.07061. [Google Scholar]
Figure 1. Symbolisation process using m = 3 with different time delays (τ). (A) Possible motifs achieved with m = 3. (B) Different symbol sequences obtained with different time delays (τ) (adapted and replotted from [28]).
Entropy 19 00673 g001
Figure 2. Phase randomised surrogate data in a non-rapid-eye movement (NREM) episode. (Left panel): real time series (RTS) and surrogate time series (STS) are plotted in blue and in red respectively. (Right panels): Power Spectral Density values against frequency are plotted for RTS at the top and STS at the bottom graph.
Entropy 19 00673 g002
Figure 3. LZC (Td = median) and PLZC (m = 6, τ = 1) values throughout the course of electroencephalogram (EEG)/ electromyogram (EMG) recordings. (A,B) LZC and PLZC values obtained from real (RTS) and surrogate time series (STS) are plotted in wakefulness ( Entropy 19 00673 i001), NREM sleep ( Entropy 19 00673 i002) and REM sleep ( Entropy 19 00673 i003
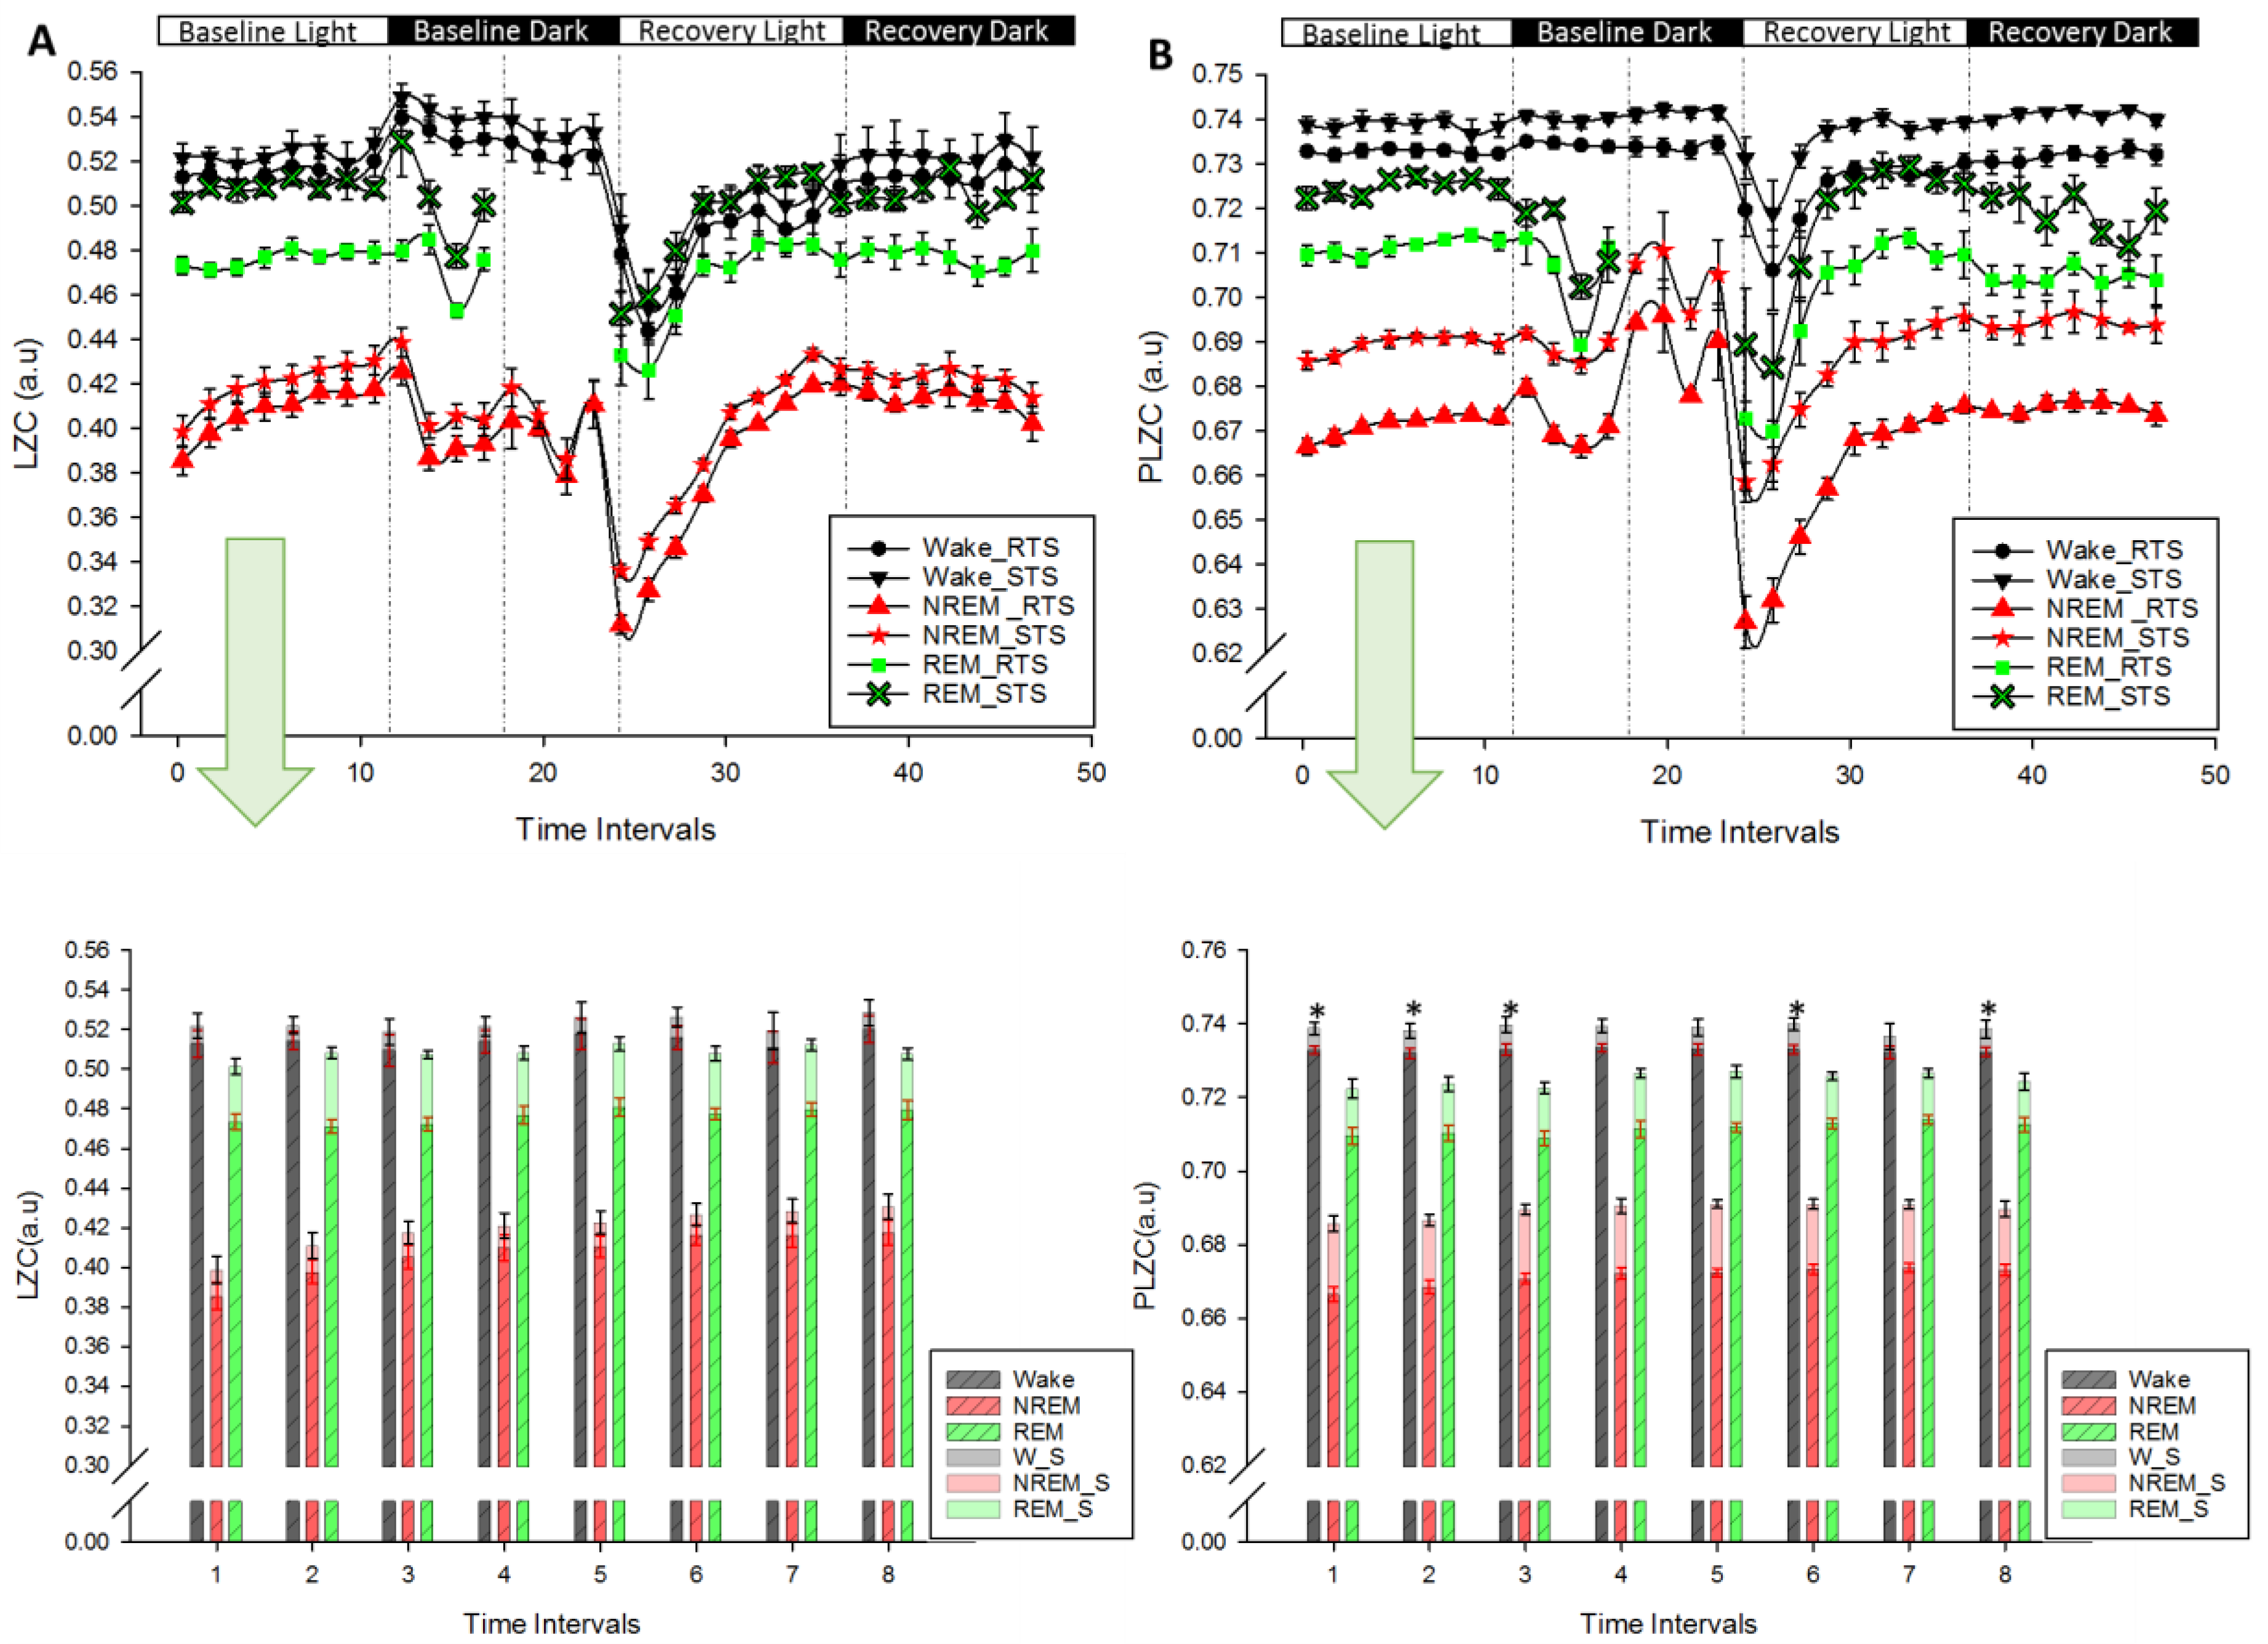
). Recordings start at light onset (Baseline Light) and continued with Baseline Dark followed by recovery sleep at light (Recovery Light) and dark (Recovery Dark). Lower panels (A) and (B): LZC and PLZC values (Mean ± SEM; red in RTS, black in STS) in each vigilance state during the course of baseline. * p < 0.05 (Related Samples Wilcoxon Signed Test between RTS and STS).
Entropy 19 00673 g003
Figure 4. PLZC (m = 6, τ = 1) values in the course of electroencephalogram (EEG)/electromyogram (EMG) recordings in periods Baseline Light ( Entropy 19 00673 i004 left panel graphs, Entropy 19 00673 i005 right panels) BL; Baseline Dark ( Entropy 19 00673 i006) BD; Recovery Light ( Entropy 19 00673 i007) RL; Recovery Dark (
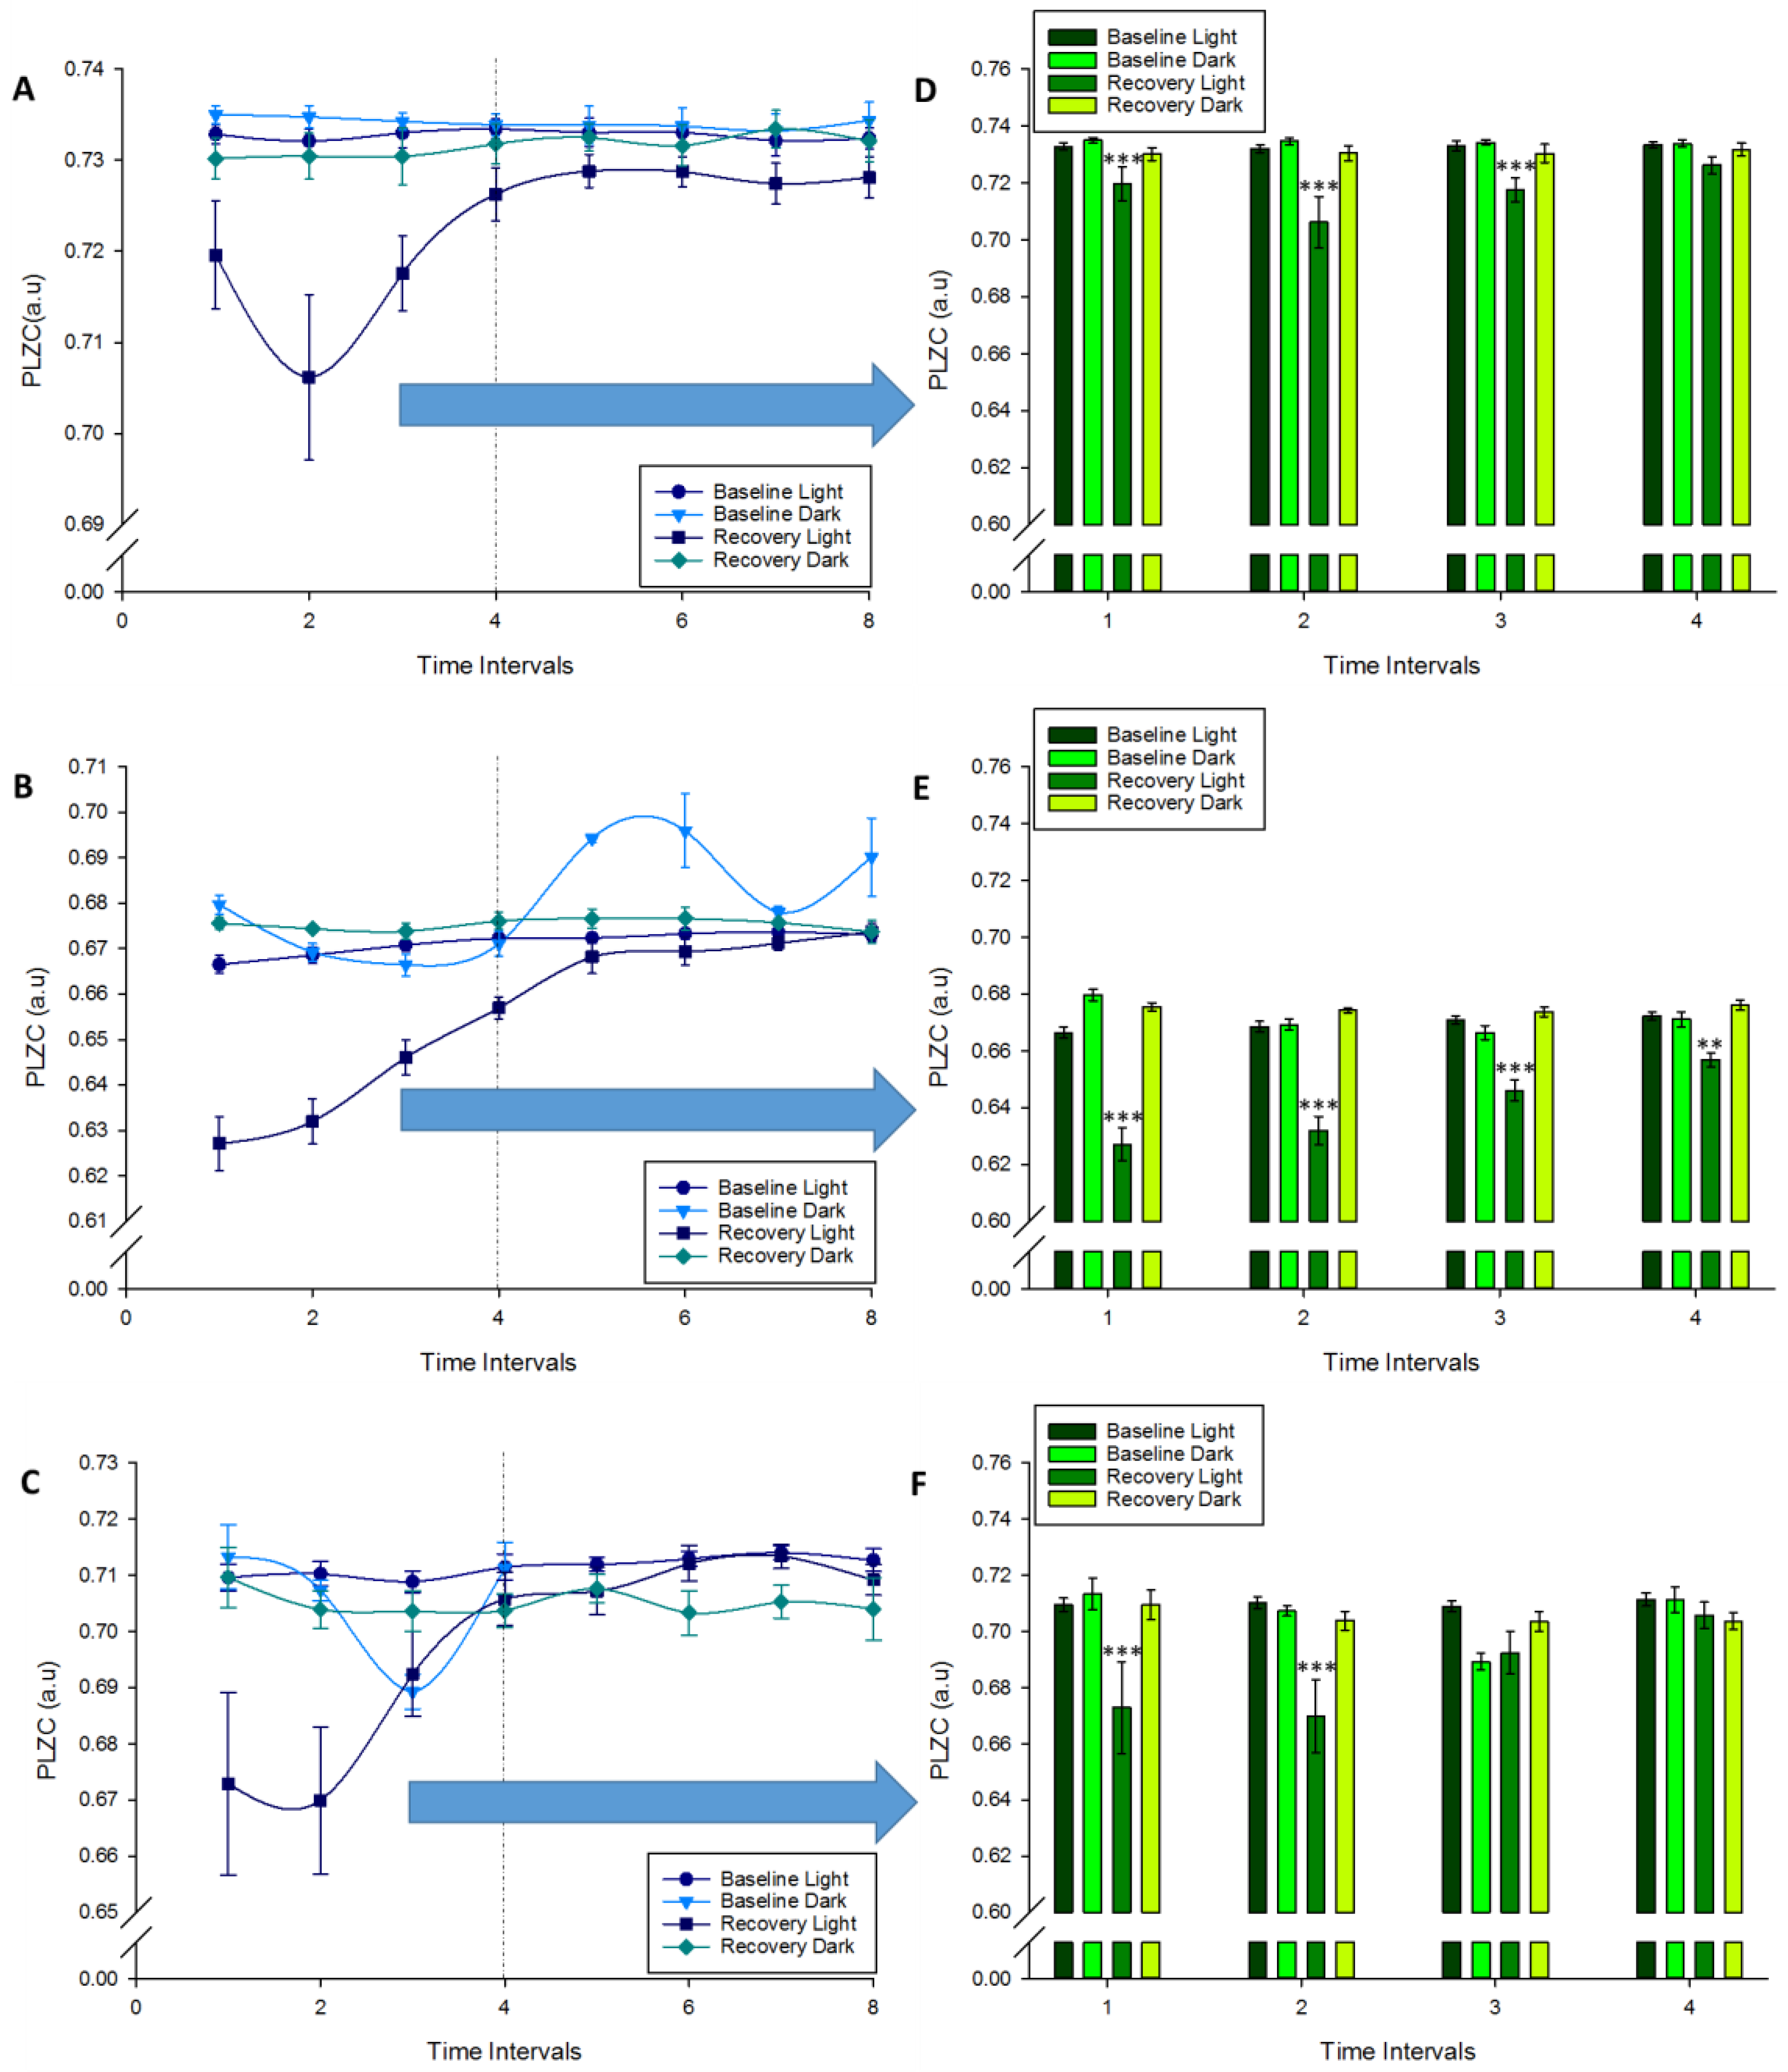
 Entropy 19 00673 i008) RD. (AC): Changes at complexity in wakefulness, NREM and REM sleep respectively were plotted over the bout of periods. (DF): Significant changes in complexity in the time intervals were marked (Repeated measures ANOVA, Factors: “Time Intervals”, “VS”, “Period”), Bonferroni comparisons in time intervals #1 to 4 (** p < 0.01, *** p < 0.001).
Entropy 19 00673 g004
Table 1. Percentage of significantly different epochs in a time interval with various input parameters (i.e., m = 3 and τ = 1; m = 4 and τ = 1; m = 5 and τ = 1 and m = 6 and τ = 1) in periods baseline light (BL), baseline dark (BD), recovery light (RL) and recovery dark (RD) for one subject.
Input Parameters/PeriodsBL
(% of Epochs)
BD
(% of Epochs)
RL
(% of Epochs)
RD
(% of Epochs)
m = 3 and τ = 191.6784.2185.2582.14
m = 4 and τ = 110094.7496.7294.05
m = 5 and τ = 195.8392.1195.0894.05
m = 6 and τ = 110094.7496.7296.43
Table 2. Related Samples Wilcoxon Signed Test between real (RTS) and surrogate time series (STS) obtained for Lempel–Ziv complexity and Permutation Lempel–Ziv complexity. Significant complexity (p < 0.05) are marked with * for different periods (i.e., Baseline Light, BL; Baseline Dark, BD; Recovery Light, RL; Recovery Dark, RD).
Lempel–Ziv ComplexityPermutation Lempel–Ziv Complexity
PeriodBLBDRLRDBLBDRLRD
Time Intervals10.0980.2400.0180.1290.029 *0.039 *0.0510.042 *
20.1660.039 *0.1170.0930.046 *0.028 *0.0920.073
30.1640.0650.1180.0900.033 *0.016 *0.0600.072
40.1510.0730.0910.1240.0660.2060.008 *0.018 *
50.145N/A0.1300.2160.069N/A0.0570.021 *
60.140N/A0.1150.1220.032 *N/A0.031 *0.043 *
70.166N/A0.1330.1360.063N/A0.046 *0.101
80.130N/A0.1660.1210.029 *N/A0.047 *0.027 *
Table 3. PLZC (m = 6, τ = 1) values in each vigilance state (VS) during baseline light (BL) and dark (BD) and recovery light (RL) and dark periods (RD). Repeated measures ANOVA (RMA), Factor: “VS” in each period was characterised by significant differences (described in text).
Period/VSWakefulnessNREM SleepREM Sleep
Baseline Light (Mean ± SEM)0.733 ± 0.0010.671 ± 0.0020.711 ± 0.002
Baseline Dark (Mean ± SEM)0.734 ± 0.0020.681 ± 0.0040.705 ± 0.004
Recovery Light (Mean ± SEM)0.723 ± 0.0040.656 ± 0.0030.698 ± 0.007
Recovery Dark (Mean ± SEM)0.732 ± 0.0020.675 ± 0.0020.705 ± 0.004

