2. Experimental
The Al
7.5Cr
22.5Fe
35Mn
20Ni
15 alloy studied in this paper was received from the Yeh group. The Al
7.5Cr
22.5Fe
35Mn
20Ni
15 alloy were first prepared by arc melting using appropriate amounts of pure elements with purity higher than 99.9%. After that, the alloy was hot forged at 1200 °C and air cooled to room temperature. Then the alloy was warm rolled at 500 °C until the thickness reached 2 mm. Finally, the alloy was annealed at 700 °C for 4 h. The compositions of the Al
7.5Cr
22.5Fe
35Mn
20Ni
15 alloy phases analyzed by Scanning Electron Microscope (SEM, JEOL Ltd., Tokyo, Japan) and Energy Dispersive Spectroscopy (EDS, JEOL Ltd., Tokyo, Japan) are listed in
Table 1. The structures were characterized by X-ray diffraction (XRD) using a Rigagu ME510-FM2 (Rigagu Ltd., Tokyo, Japan) with Cu-Kα (λ = 0.1541 nm) radiation operated at 30 kV. The microstructural evolution of the alloy was monitored using a scanning electron microscope (SEM) and a transmission electron microscope (TEM, JEOL Ltd., Tokyo, Japan). SEM observations were made using a JEOL JSM-6335 field emission scanning electron microscope operated at 15 kV. Samples were metallographically prepared and electrochemically etched in 1M H
2SO
4 solution operated at a potential of 2 V. TEM observations were made using a JEOL JEM-3000F high resolution transmission electron microscope operated at 300 kV. The corresponding selected area diffraction patterns (SAD) were calculated from the high resolution lattice image by fast Fourier transforms (FFT) in Gatan digital micrograph software. Thin foil specimens for TEM observation were electrochemically prepared in a digital Fischione twin-jet electropolisher, model 110, in a solution of 10 vol.% perchloric acid and 90 vol.% methanol at a potential of 30 V.
The polarization curves of the alloys were measured in a Autolab PGSTAT302N potentiostat/galvanostat (Metrohm Autolab B.V., Utrecht, Netherlands) and a three-electrode system at a scanning rate of 1 mV/s. The test temperature range was 30–60 °C in steps of 10 °C. The alloy characteristics were determined, such as corrosion potential (
Ecorr), corrosion current density (
icorr), primary passivation potential (
Epp, the potential of the first anodic peak), anodic critical current density of the primary anodic peak (
ipp), secondary passivation potential (
Esp, the potential of the second anodic peak), anodic critical current density of secondary anodic peak (
isp), third passivation potential (
Etp, the potential of the third anodic peak), anodic critical current density of the third anodic peak (
itp), passive current density (
ipass), and breakdown potential (
Eb). The results were also compared with the properties of commercial 304 stainless steel (304SS), which has a composition in weight percent of 71.61% Fe, 18.11% Cr, 8.24% Ni, 1.12% Mn, 0.75% Si, 0.05% Co, 0.02% Mo, 0.05% C, 0.03% P, and 0.02% S. Specimens for polarization tests were mounted in epoxy resin, and the exposed surface area of the specimens were fixed at 0.1964 cm
2 (0.5 cm in diameter). The reference electrode was a saturated silver chloride electrode (Ag/AgCl), and a smooth Pt sheet was used as the counter electrode. All the values of potential given below are expressed on the saturated silver chloride electrode (SSE), whose reduction potential is 222 mV higher than that on the standard hydrogen electrode (SHE) scale at 25 °C [
15,
16]. The specimens for measuring the polarization curves were all mechanically wet polished with 1200 SiC grit paper. The test solutions of 1M concentration were prepared from reagent-grade sulfuric acid, nitric acid, hydrochloric acid and sodium chloride, dissolved in distilled water. To eliminate the effect of dissolved oxygen, the solutions were deaerated by bubbling nitrogen gas through the solution prior to and during the polarization experiments.
3. Results and Discussion
The as-cast Al
7.5Cr
22.5Fe
35Mn
20Ni
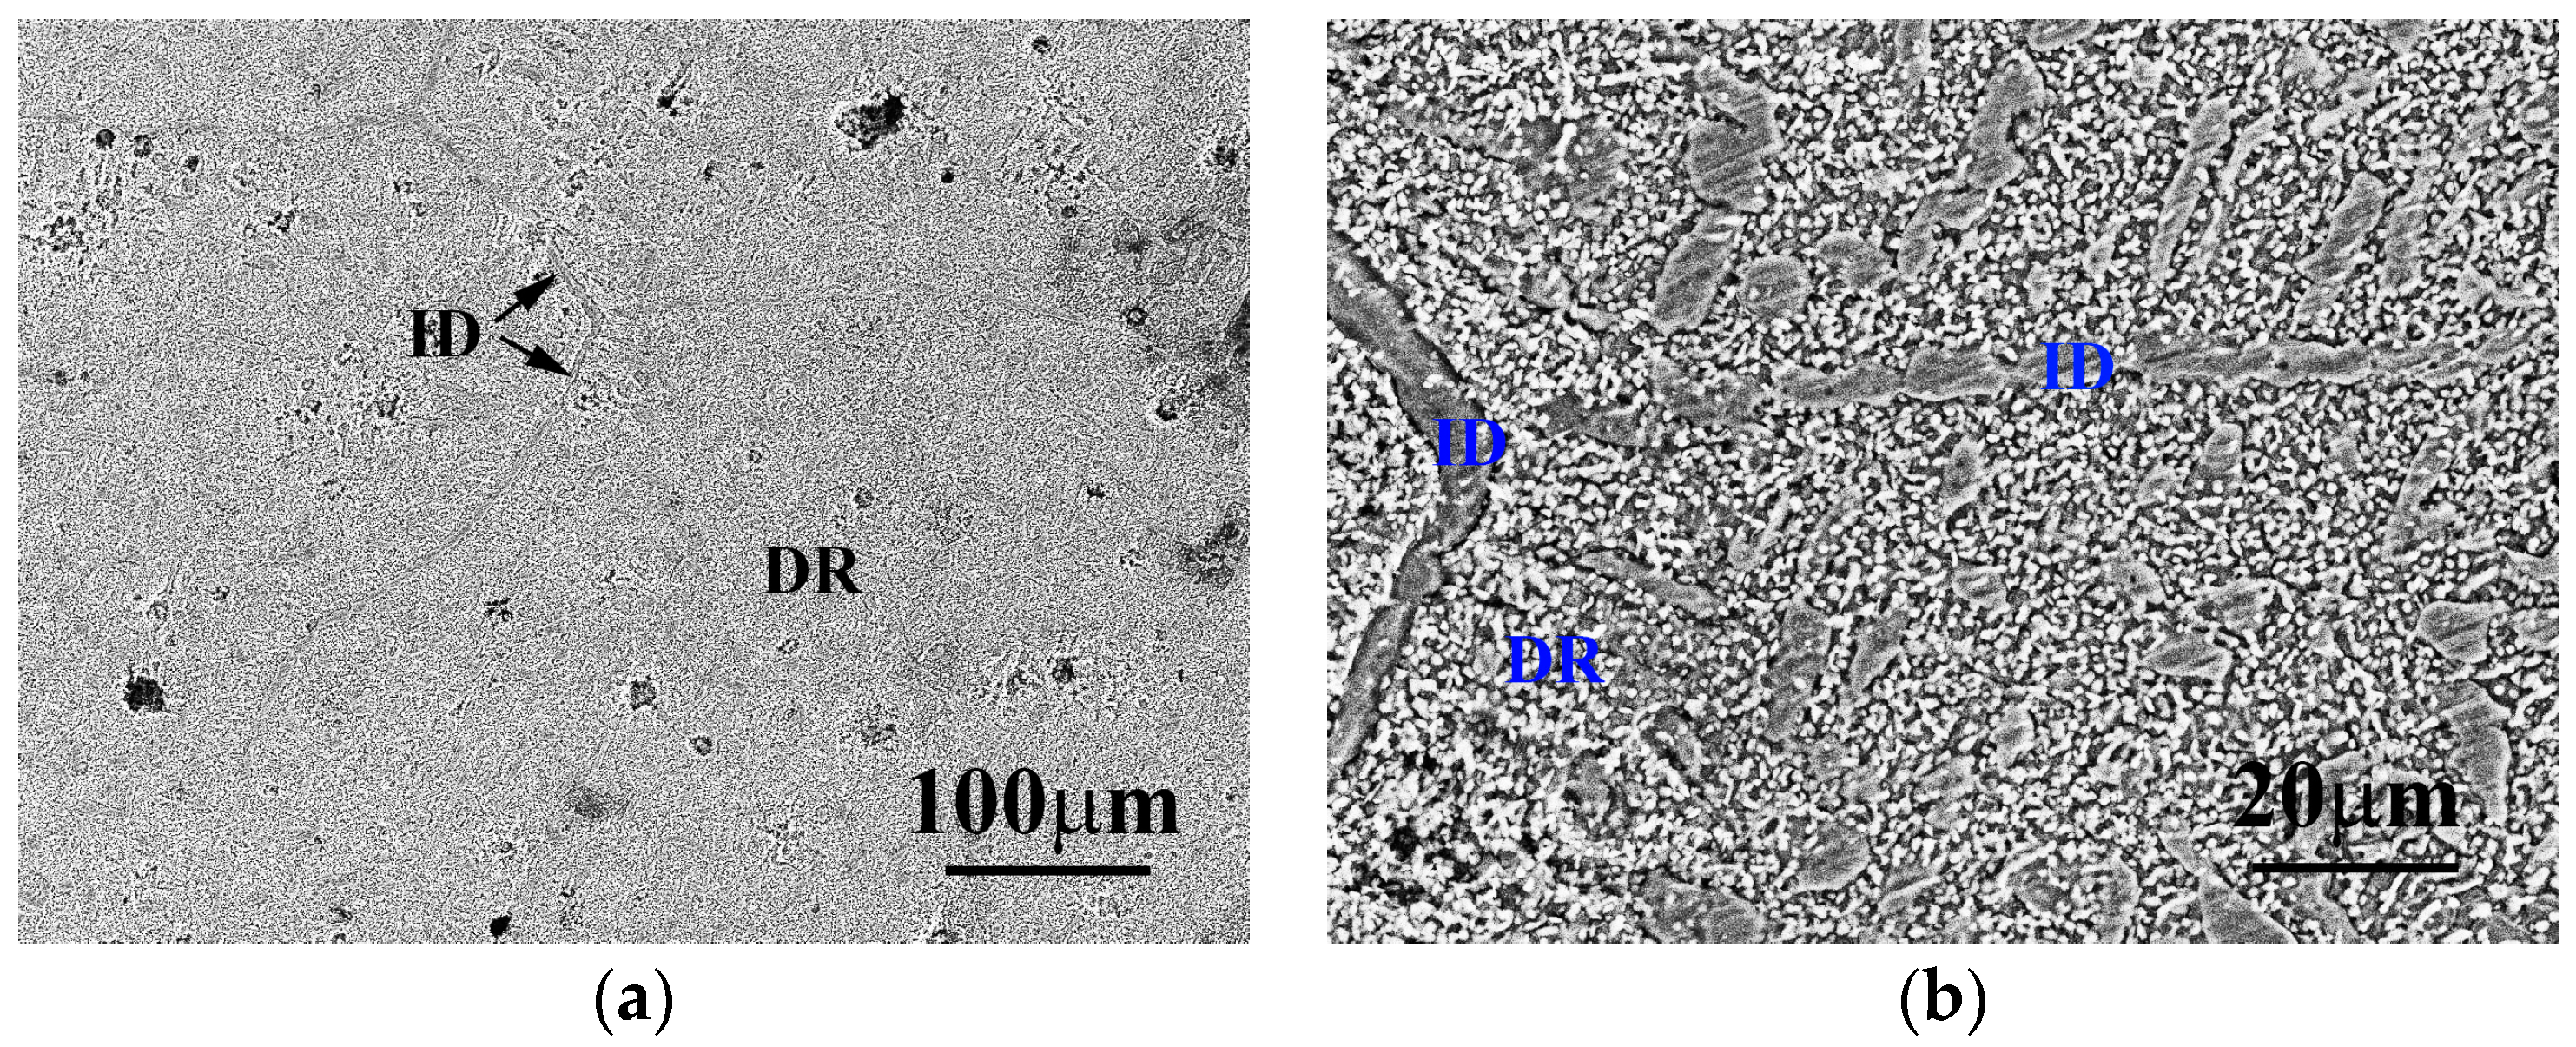
15 alloy has a dendritic microstructure, but its morphology changes during hot forging, warm rolling, and subsequent annealing. Therefore, some interdendrite fragments are broken and dispersed into the dendrite matrix during deformation.
Figure 1 displays the low- and high-magnitude SEM micrographs of the as-received Al
7.5Cr
22.5Fe
35Mn
20Ni
15 alloy. Large amounts of submicron precipitates are present in the dendrite. In addition, a portion of the interdendrite fragments still arranges in lines, and a portion of the interdendrite fragments randomly distributes within the dendrite.
Table 1 lists the compositions of the phases in Al
7.5Cr
22.5Fe
35Mn
20Ni
15 alloy; the precipitates are a NiAl-rich phase, the interdendrites are an FeMn-rich phase, and the dendrites are a CrFeMn-rich phase.
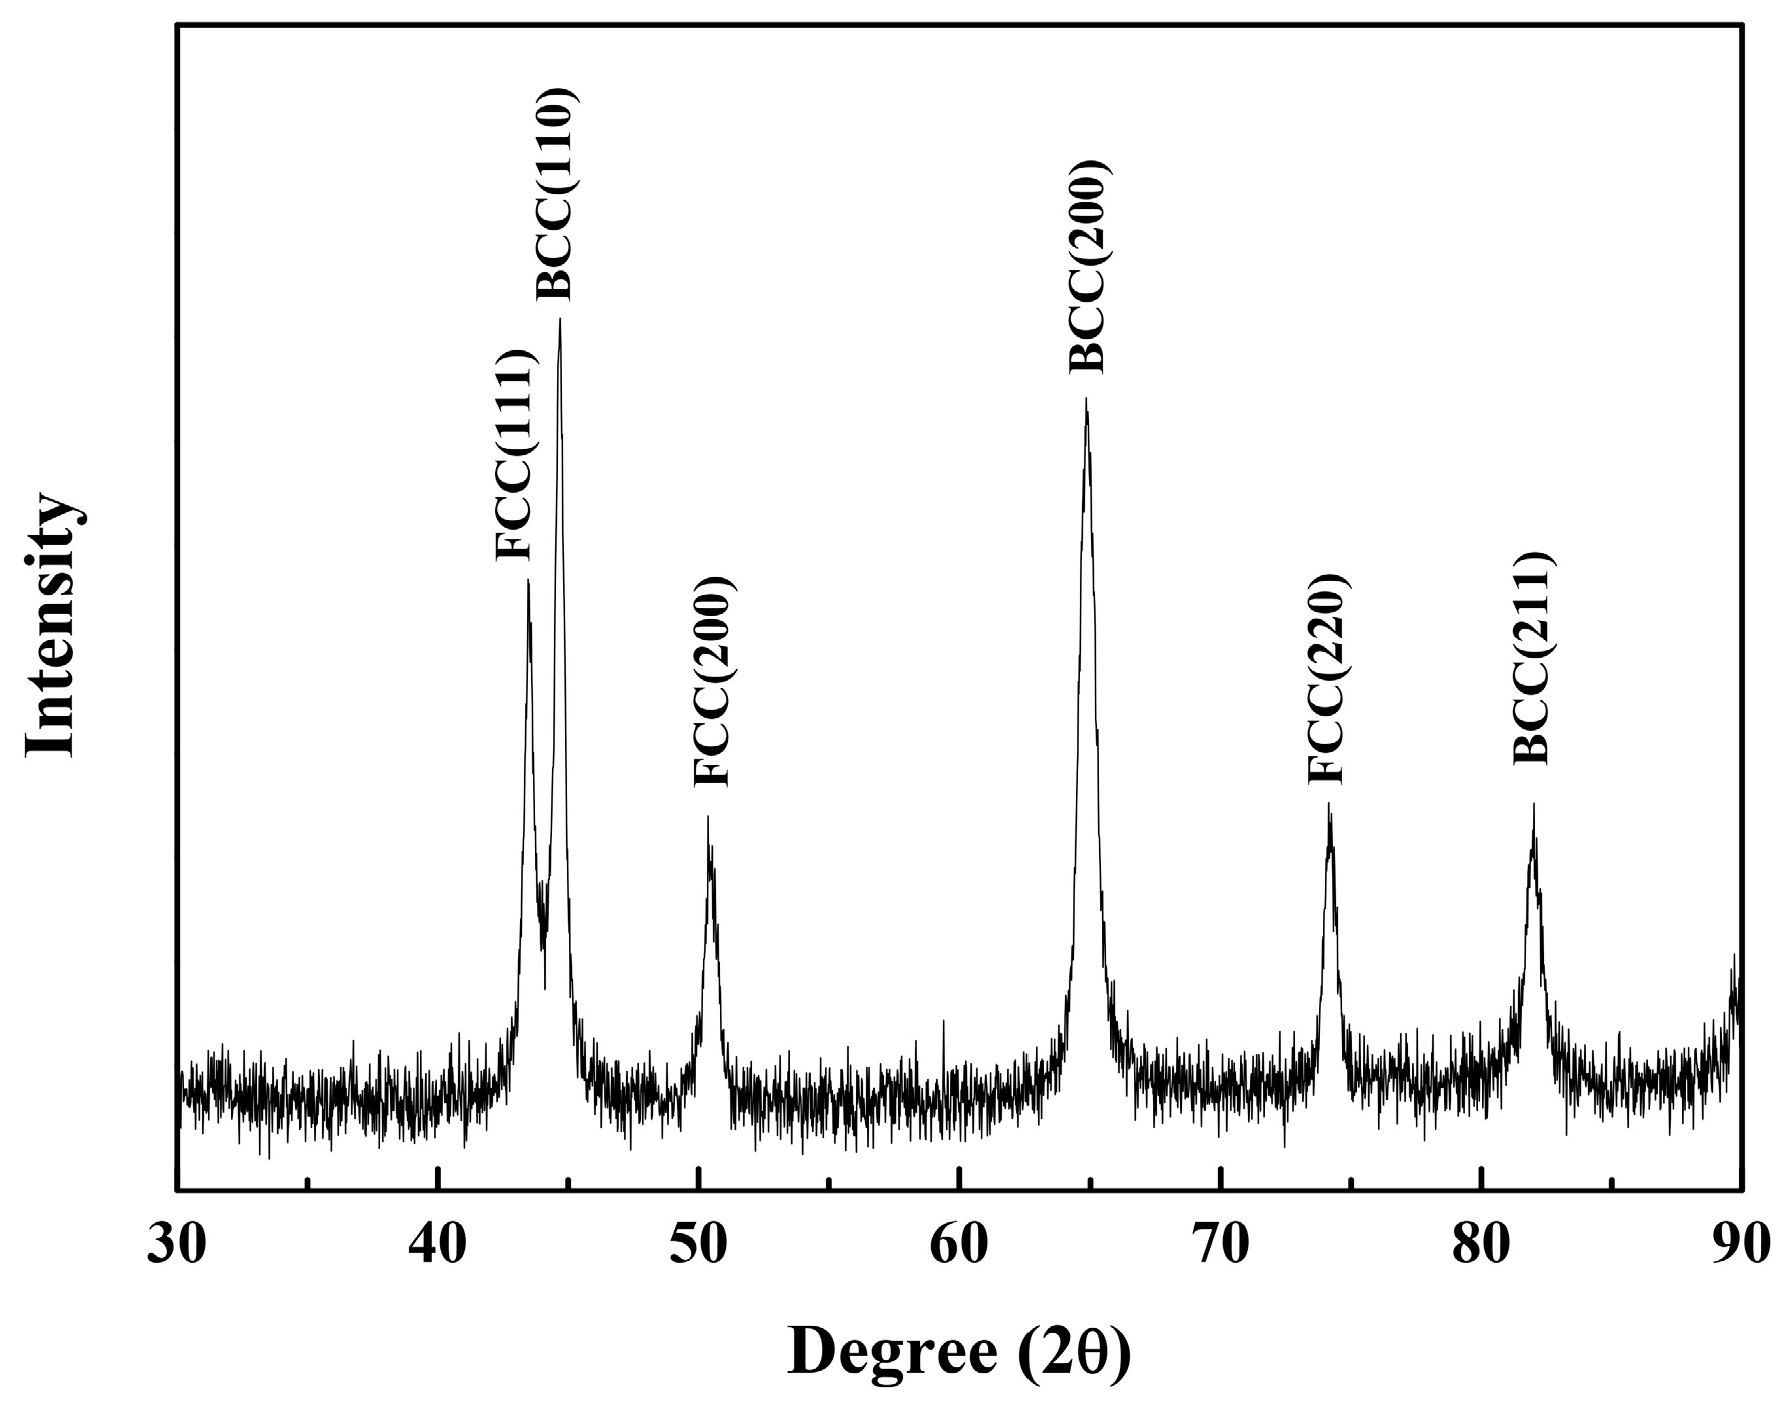
Figure 2 shows the XRD pattern of the Al
7.5Cr
22.5Fe
35Mn
20Ni
15 alloy, and only two phases are detected. One is a BCC phase with a lattice constant of 0.287 nm; and the other is an FCC phase with a lattice constant of 0.360 nm. Apparently, the BCC phase is the dendrite matrix and the FCC phase is the interdendrite by comparing the intensities of the XRD peaks and the SEM micrograph. This is also later proven by the TEM observation described below.
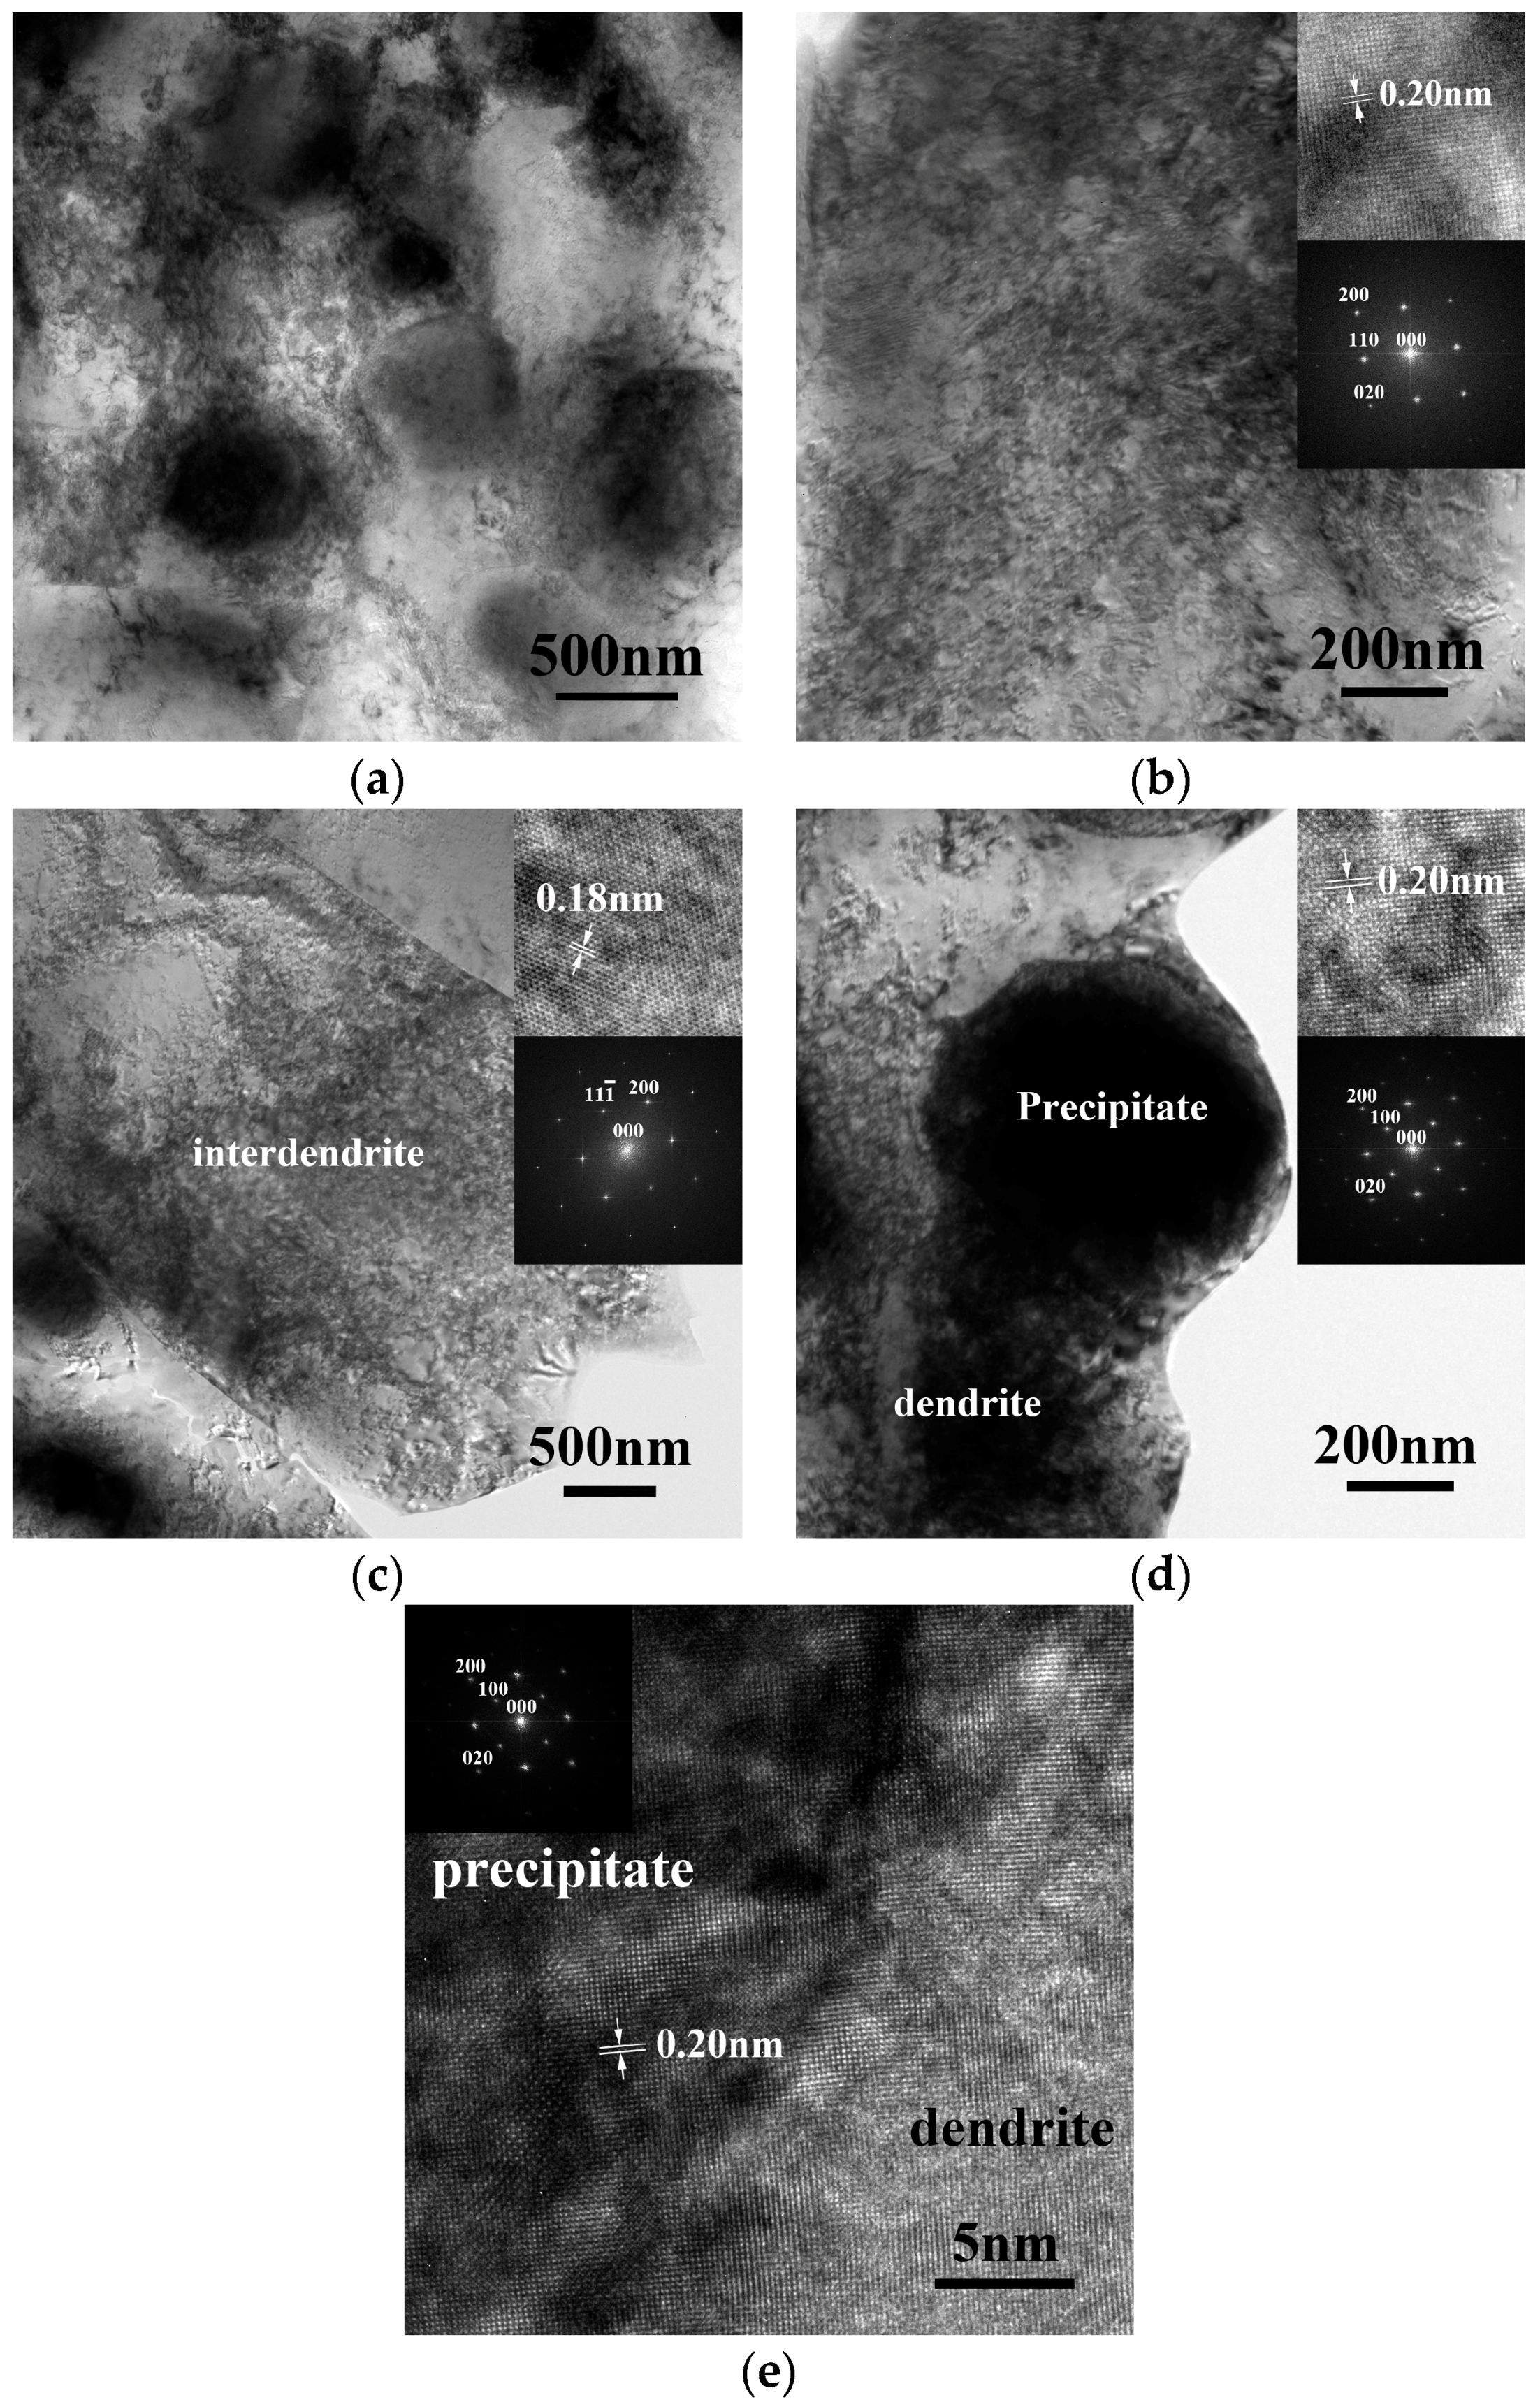
TEM observation of the Al
7.5Cr
22.5Fe
35Mn
20Ni
15 alloy is shown in
Figure 3.
Figure 3a is a bright field (BF) image of the dendrite; there are several precipitates dispersed in the dendrite matrix. The matrix evidently shows a cell structure because of recovery during the annealing process after hot working. Moreover, the alloy was annealed at 700 °C for 4 h after hot working; this cell structure indicates that the annealing conditions were not enough for full annealing.
Figure 3b is a high-magnitude BF image of a dendrite; the inserts are the corresponding lattice image taken from the [001] direction and the SAD from FFT, which indicates a BCC structure.
Figure 3c is a BF image of an interdendrite; the inserts are the corresponding lattice image taken from the [011] direction and the SAD from FFT, which indicates an FCC structure. All of these TEM micrographs were proof of the description above, that dendrites have a BCC structure and that interdendrites have a FCC structure.
Figure 3d is a BF image of a precipitate; inserts are the corresponding lattice image taken from the [001] direction and the SAD from FFT, which indicates an ordered BCC structure.
Figure 3e is the lattice image taken from the [001] direction of an ordered BCC precipitate, which shows the interface between the precipitate and the dendrite matrix. The upper-left portion is the ordered BCC precipitate, and the lower-right portion is the BCC dendrite. The insert is the corresponding SAD from FFT. The interface shown is almost perfectly coherent.
Figure 4 shows the polarization behaviors of the Al
7.5Cr
22.5Fe
35Mn
20Ni
15 alloy in 1M deaerated H
2SO
4 solution and the SEM micrograph of the alloy after the polarization test.
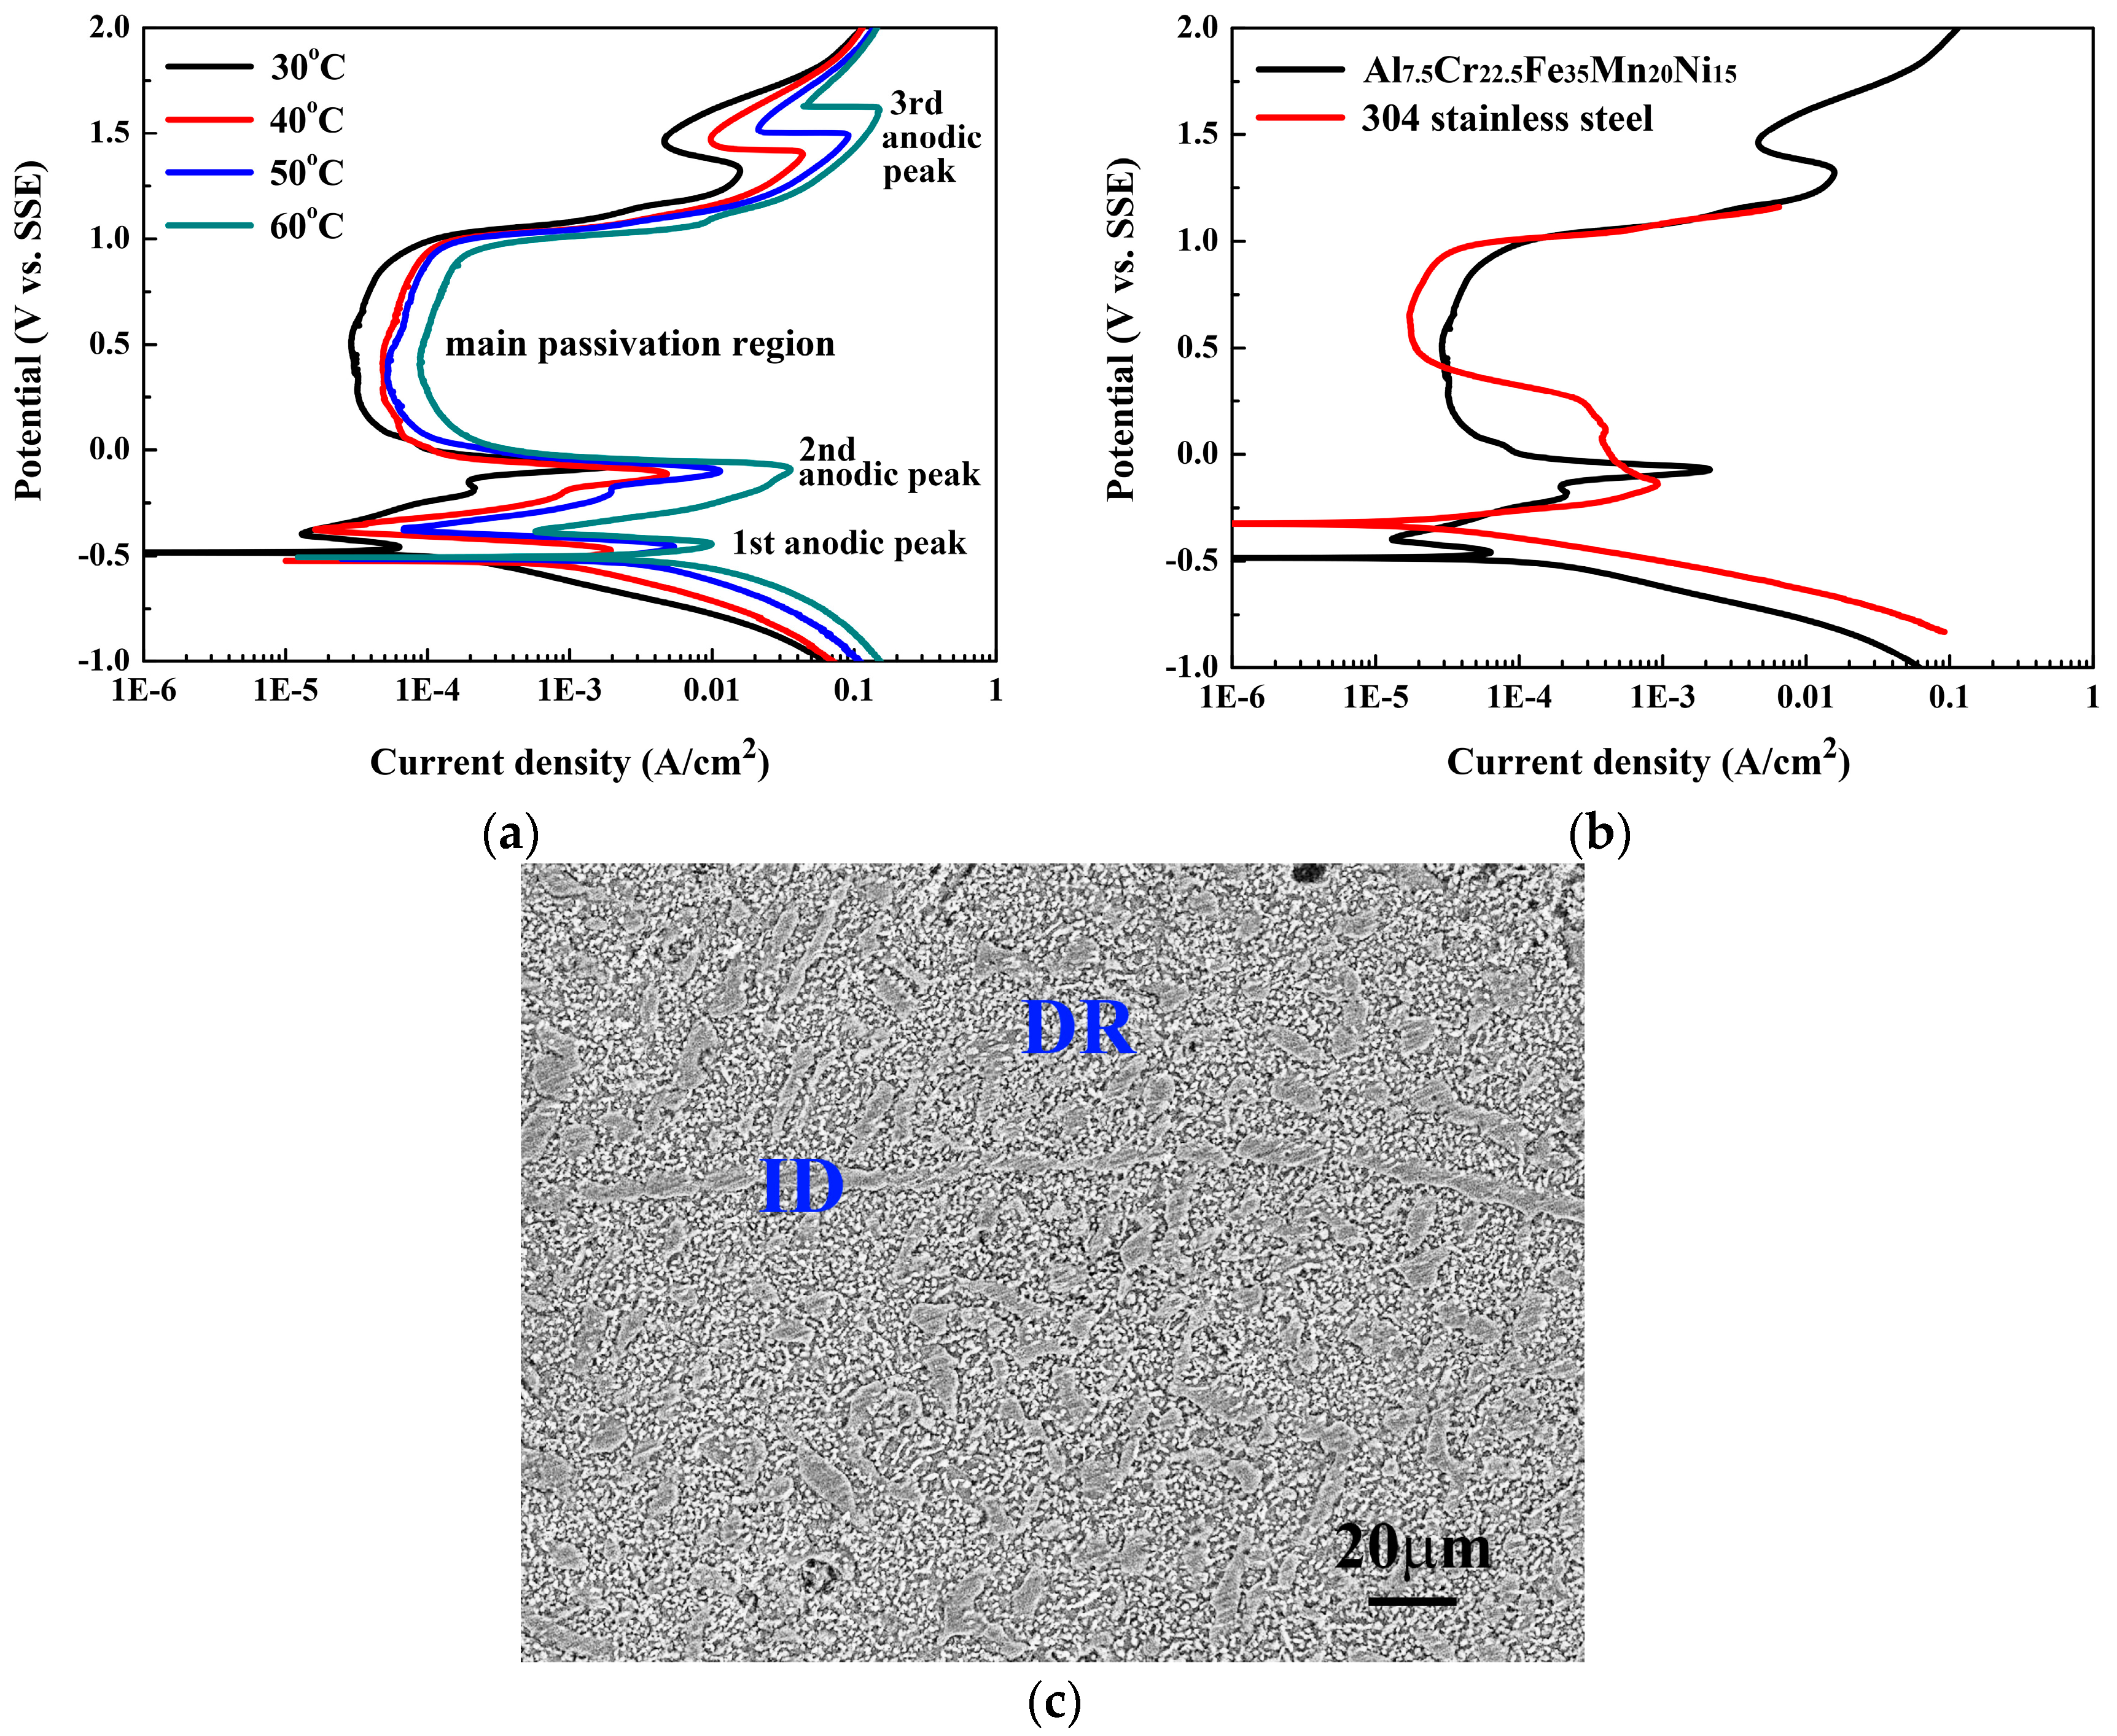
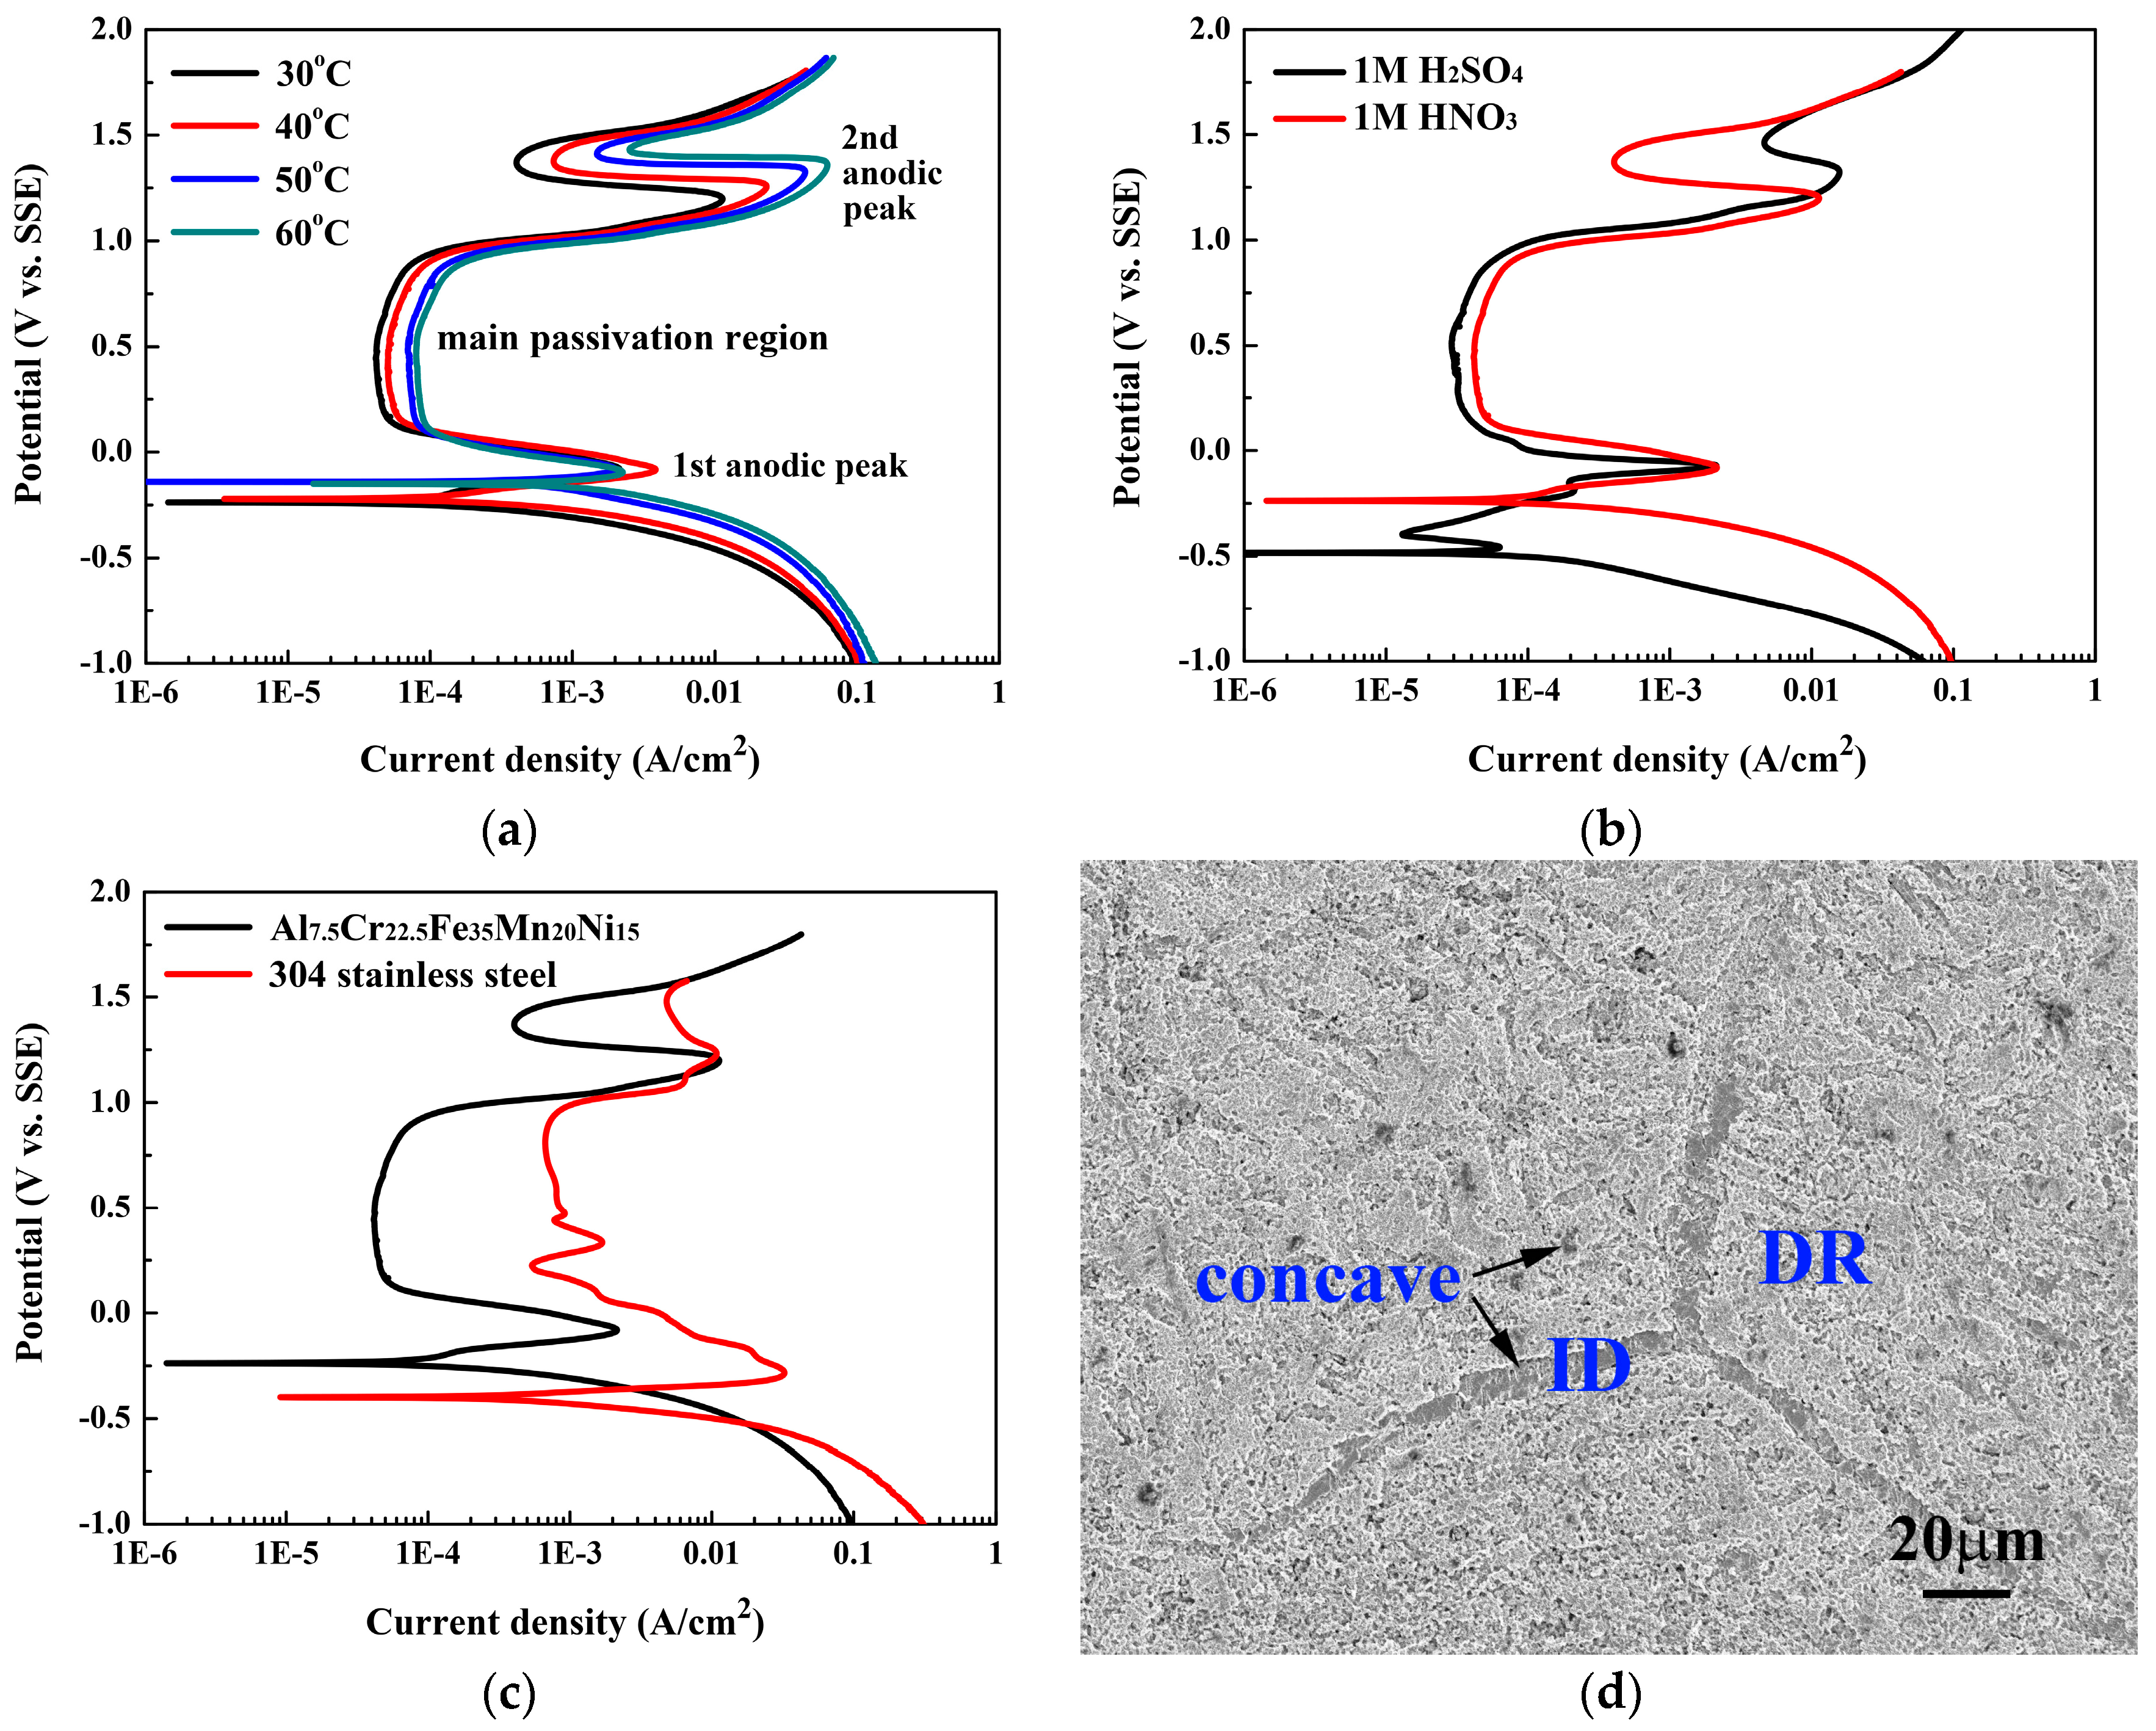
Figure 4a shows the polarization curves of the Al
7.5Cr
22.5Fe
35Mn
20Ni
15 alloy in 1M H
2SO
4 solution at different temperatures.
Table 2 presents the data from which the curves are plotted. The
Ecorr of the Al
7.5Cr
22.5Fe
35Mn
20Ni
15 alloy was almost temperature-independent, and stayed at about −0.5 V (SSE) at this temperature range of 30 to 60 °C. However, the
icorr increased from 0.13 to 7.28 mA/cm
2 as the temperature increased from 30 to 60 °C, indicating that the reaction was sensitive to temperature. Subsequently, three anodic peaks were observed in each polarization curve; the passivation range for each curve was thus divided into three sub-domains. Abdallah studied the corrosion behavior of 304SS in 0.5M H
2SO
4 solution, and described that the formation of the three anodic peaks was due to the iron, cobalt, and nickel hydroxide formation that occurred through the dissolution and precipitation mechanism [
17]. The first anodic peak of 304SS in 0.5M H
2SO
4 solution was due to the formation of iron hydroxide; the secondary anodic peak was due to the formation of higher oxides of iron and chromium [
17,
18]; and the third anodic peak was due to the formation of iron, cobalt, and nickel oxyhydroxides [
19]. The contents of iron, chromium, and nickel in the Al
7.5Cr
22.5Fe
35Mn
20Ni
15 alloy are more than 74 weight percent, and this study suggests the formation of the three anodic peaks is also due to this similar reason.
The passivation potential and the anodic critical current density for the primary, secondary, and third anodic peaks (i.e.,
Epp,
ipp,
Esp,
isp,
Etp, and
itp) of the Al
7.5Cr
22.5Fe
35Mn
20Ni
15 alloy are listed in
Table 2. The
Epp and
Esp of the alloy were not sensitive to the temperature, but the
Etp increased with increasing temperature. All the anodic critical current densities (
ipp,
isp, and
itp) increased significantly with increasing temperature. However, the main passivation region for each polarization curve was located in the region between the secondary and the third anodic peaks, because the extent of passivity of this region was the broadest among these three sub-domains. The
Eb of the main passivation regions for all of the polarization curves did not change with temperature and held the same value of 0.98 V (SSE). The passive current density (
ipass) of the main passivation regions only slightly increased from 0.03 to 0.09 mA/cm
2 with increasing temperature from 30 to 60 °C.
Figure 4b compares the polarization curves of the Al
7.5Cr
22.5Fe
35Mn
20Ni
15 alloy and 304SS in 1M H
2SO
4 solution at 30 °C. The
Ecorr for 304SS, −0.32 V (SSE), was higher than that of the Al
7.5Cr
22.5Fe
35Mn
20Ni
15 alloy; and the
icorr for 304SS, 0.03 mA/cm
2, was lower than that of the Al
7.5Cr
22.5Fe
35Mn
20Ni
15 alloy. Both the
Ecorr and
icorr indicated that the 304SS was nobler than the Al
7.5Cr
22.5Fe
35Mn
20Ni
15 alloy; this is due to the fact that the elements of aluminum and manganese are more active than iron, chromium, and nickel which are the major elements of 304SS. However, the main passivation region of the Al
7.5Cr
22.5Fe
35Mn
20Ni
15 alloy (
ΔE = 1.05 V) was broader than that of 304SS; although the
ipass for 304SS, 0.02 mA/cm
2, was smaller than that of the Al
7.5Cr
22.5Fe
35Mn
20Ni
15 alloy. Both of these two alloys had the same breakdown potential of the main passivation region,
Eb = 0.98 V (SSE).
Figure 4c shows the SEM micrograph of the Al
7.5Cr
22.5Fe
35Mn
20Ni
15 alloy after polarization test. The major corrosion region was the BCC dendrite matrix; the precipitates and the interdendrites were almost unchanged, and the scratches on the interdendrites due to the polish were still visible. Therefore, 1M H
2SO
4 solution corroded BCC dendrites rather than ordered BCC precipitates and FCC interdendrites in the alloy.
Figure 5 shows the polarization behaviors of the Al
7.5Cr
22.5Fe
35Mn
20Ni
15 alloy in 1M deaerated HNO
3 solution and the SEM micrograph of the alloy after the polarization test. The polarization behaviors of the Al
7.5Cr
22.5Fe
35Mn
20Ni
15 alloy in 1M HNO
3 solution at different temperatures are shown in
Figure 5a, and
Table 3 lists the data from which curves are plotted. The
Ecorr of the Al
7.5Cr
22.5Fe
35Mn
20Ni
15 alloy in 1M HNO
3 solution increased markedly from −0.24 to −0.15 V (SSE) when the temperature increased from 30 to 60 °C. The
icorr also increased significantly with increasing temperature. The
Epp and
ipp only slightly changed in this temperature range. The anodic started to fall down and form the passive region after the end of the first anodic peak. However, two anodic peaks were observed in each polarization curve; the passivation region for each curve was thus divided into two sub-domains, and the first sub-domain was the main passivation region for each polarization curve. The
ipass for the main passivation regions also slightly increased with increasing temperature, and the
Eb of the main passivation regions for the polarization curves only slightly changed with increasing temperature.
Figure 5b shows the polarization curves of the Al
7.5Cr
22.5Fe
35Mn
20Ni
15 alloy in both the 1M H
2SO
4 and 1M HNO
3 solutions at 30 °C. It is interesting to note that the polarization behaviors of the Al
7.5Cr
22.5Fe
35Mn
20Ni
15 alloy in 1M H
2SO
4 and 1M HNO
3 solutions are quite similar; because the reactions between the metals and the H
2SO
4 or HNO
3 solution were of similar oxidation behavior. The
Ecorr of the Al
7.5Cr
22.5Fe
35Mn
20Ni
15 alloy in 1M HNO
3 solution was higher than that in 1M H
2SO
4 solution; even higher than the
Epp of the alloy in 1M H
2SO
4 solution. The first anodic peak for the alloy in 1M HNO
3 solution was almost matched with the secondary anodic peak of the alloy in 1M H
2SO
4 solution. The secondary anodic peak of the alloy in 1M HNO
3 solution was close to the third anodic peak of the alloy in 1M H
2SO
4 solution. Therefore, the extent of passivity for the alloy in both of these two solutions were very close.
Figure 5c compares the polarization curves for the Al
7.5Cr
22.5Fe
35Mn
20Ni
15 alloy and 304SS in 1M HNO
3 solution at 30 °C. The
Ecorr for 304SS, −0.41 V (SSE), was lower than that of the Al
7.5Cr
22.5Fe
35Mn
20Ni
15 alloy; and the
icorr for 304SS was larger than that of the Al
7.5Cr
22.5Fe
35Mn
20Ni
15 alloy. In addition, the main passivation region of the Al
7.5Cr
22.5Fe
35Mn
20Ni
15 alloy was broader than that of 304SS; the
ipass of the Al
7.5Cr
22.5Fe
35Mn
20Ni
15 alloy was also smaller than that of 304SS. The
Eb of the main passivation regions of both alloys were quite close. All of these data indicated that the Al
7.5Cr
22.5Fe
35Mn
20Ni
15 alloy had a better corrosion resistance than 304SS in 1M HNO
3 solution.
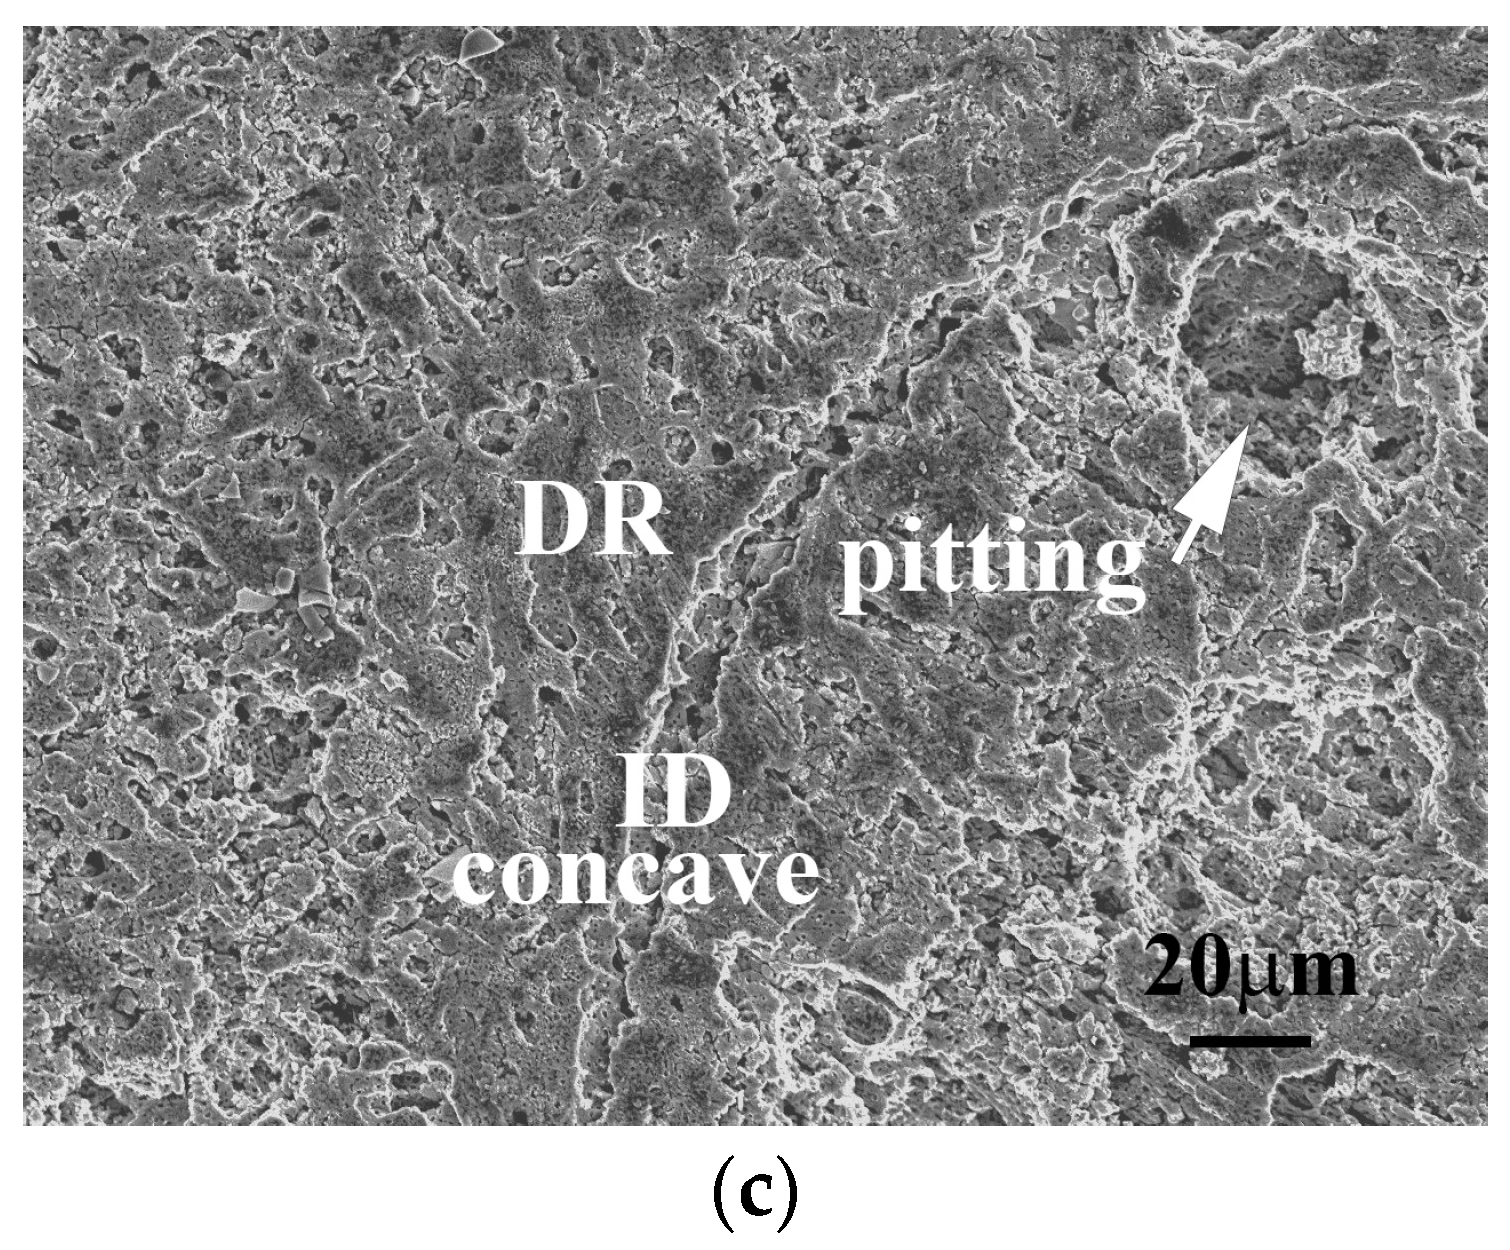
Figure 5d shows the SEM micrograph of the Al
7.5Cr
22.5Fe
35Mn
20Ni
15 alloy after the polarization test. The micrograph reveals that the entire surface was corroded. However, the FCC interdendrites were concave and there was a large number of small holes; which indicated that the corrosion resistance of both the FCC interdendrites and the ordered BCC precipitates were less than that of the BCC dendrites in 1M HNO
3 solution.
Figure 6 shows the polarization behaviors of the Al
7.5Cr
22.5Fe
35Mn
20Ni
15 alloy in 1M deaerated HCl solution and the SEM micrograph of the alloy after the polarization test. The polarization behaviors of the Al
7.5Cr
22.5Fe
35Mn
20Ni
15 alloy in 1M HCl solution at different temperatures are shown in
Figure 6a. The shapes of the polarization curves of the Al
7.5Cr
22.5Fe
35Mn
20Ni
15 alloy in 1M HCl solution are different in comparison to that in 1M H
2SO
4 and 1M HNO
3 solutions; because the corrosion mechanism of the alloy in 1M HCl solution included the attack of chlorine ions, and reaction in an acidic solution.
Table 4 lists the data from which the curves are plotted. The
Ecorr and
icorr both increased with increasing temperature; the highest value of
icorr of the Al
7.5Cr
22.5Fe
35Mn
20Ni
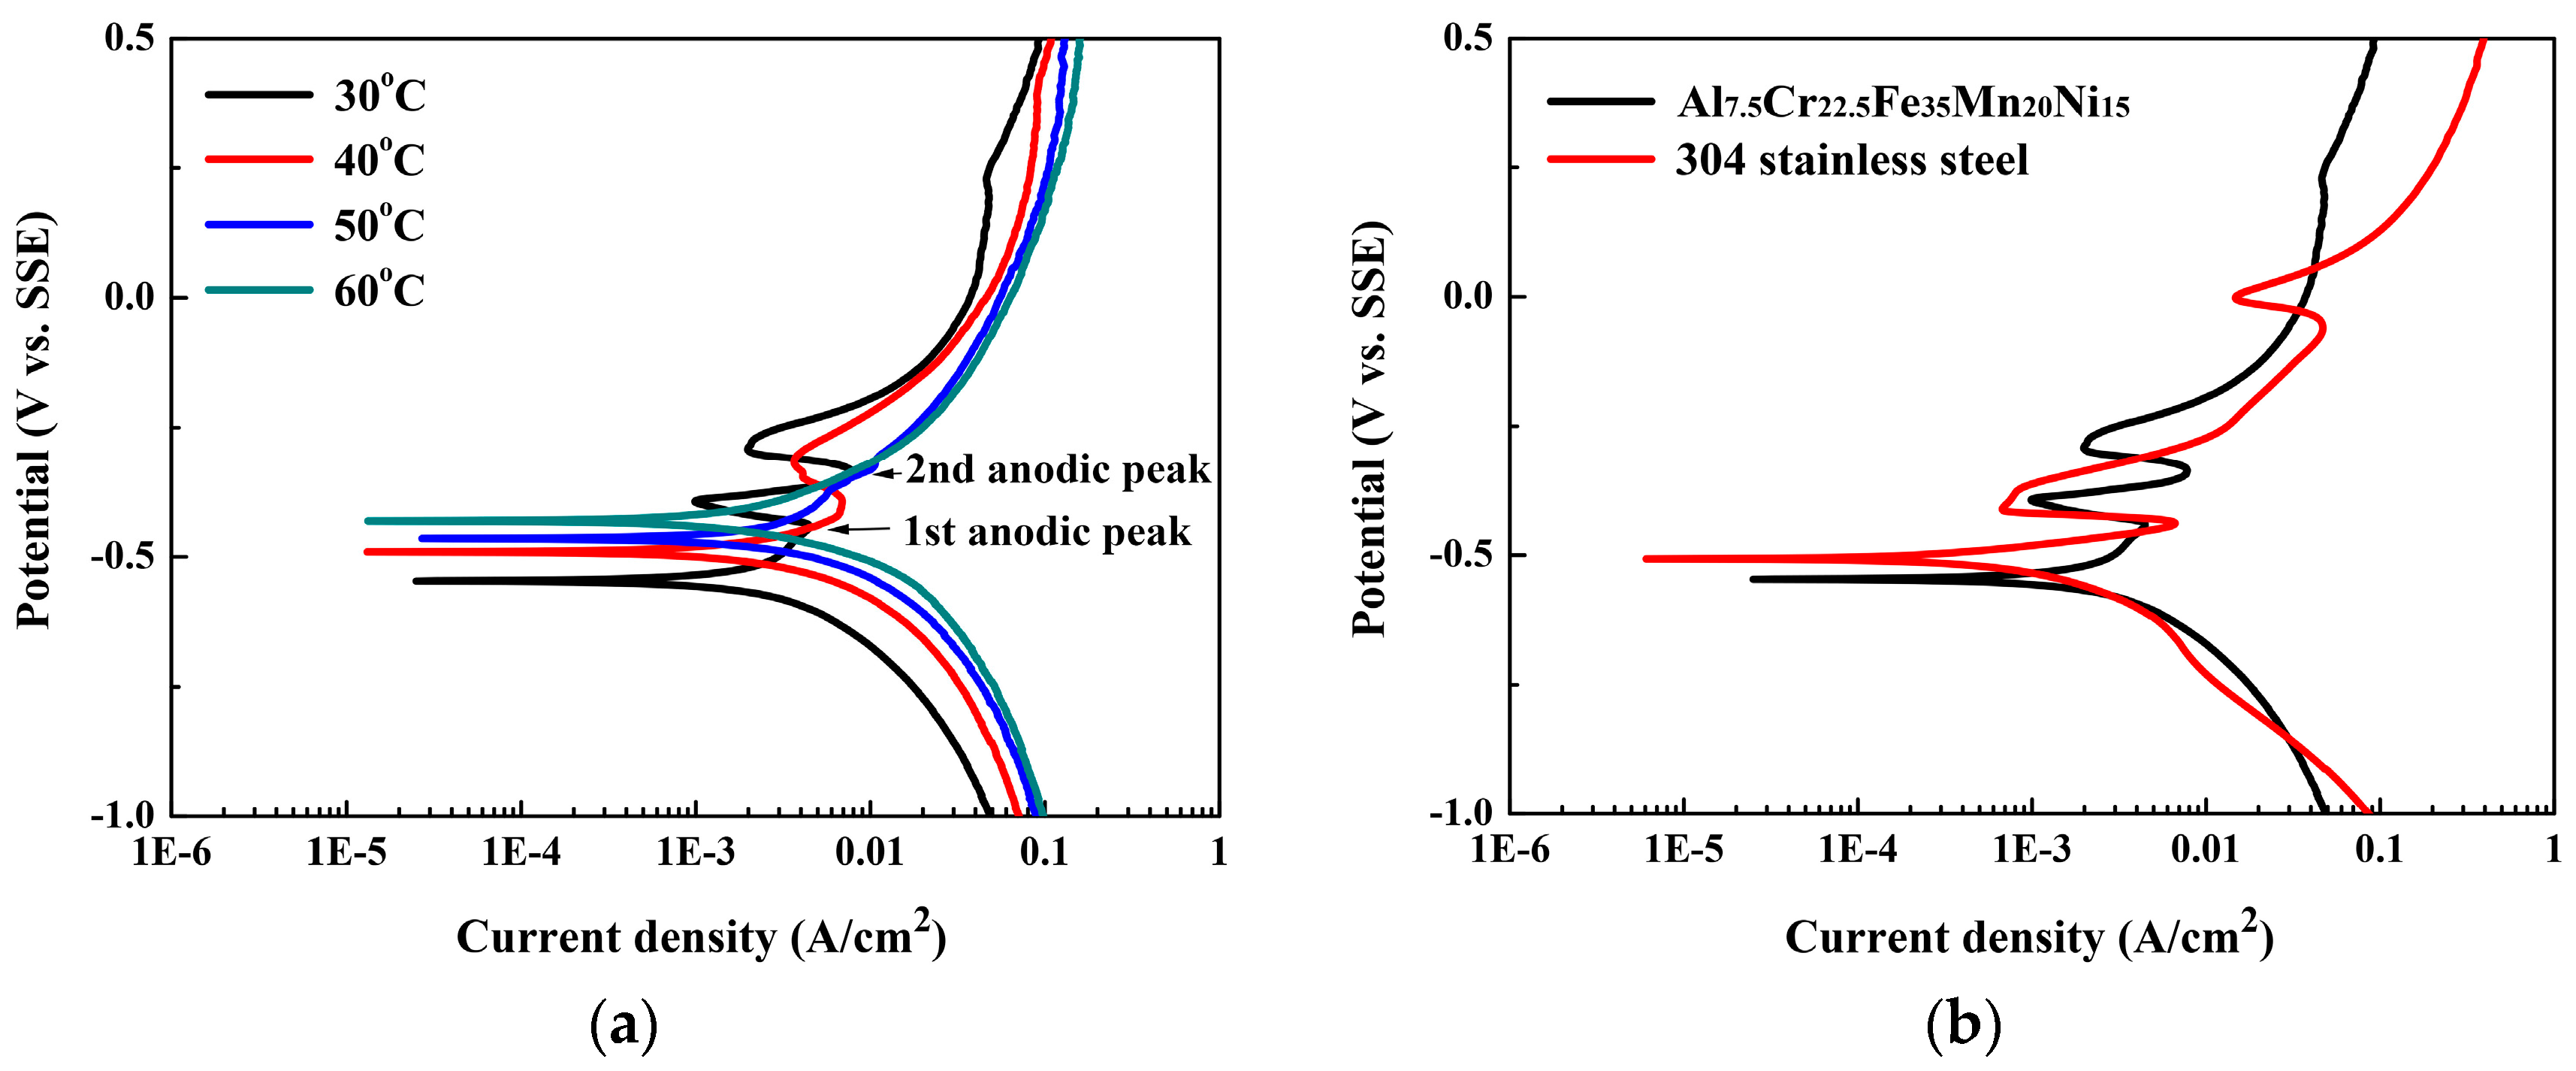
15 alloy in 1M HCl solution also revealed the highest corrosion rate of the alloy in these three solutions. Two anodic peaks exist in the polarization curve tested at 30 °C, whereas only one anodic peak exists in the polarization curve tested at 40 °C, and the anodic peak is almost eliminated when the temperature reached 50 °C. The polarization curves for the alloy in 1M HCl solution had a narrower passivation region than that in the other solutions, and the passivation region became smaller with increasing temperature.
Figure 6b compares the polarization curves of the Al
7.5Cr
22.5Fe
35Mn
20Ni
15 alloy and 304SS in 1M HCl solution at 30 °C. The
Ecorr for 304SS, −0.51 V (SSE), was higher than that of the Al
7.5Cr
22.5Fe
35Mn
20Ni
15 alloy, and the
icorr for 304SS, 2.0 mA/cm
2, was also smaller than that of the Al
7.5Cr
22.5Fe
35Mn
20Ni
15 alloy. The polarization curves for these two alloys indicated that 304SS had better corrosion resistance than the Al
7.5Cr
22.5Fe
35Mn
20Ni
15 alloy in 1M HCl solution.
Figure 6c shows the SEM micrograph of the Al
7.5Cr
22.5Fe
35Mn
20Ni
15 alloy after the polarization test. The micrograph also reveals that the entire surface was corroded. The FCC interdendrites were concave; a large number of small holes indicated the loss of ordered BCC precipitates; and some bigger holes indicated pitting due to the attack of chlorine ions. However, the SEM micrograph indicated that corrosion resistance of both of the FCC interdendrites and the ordered BCC precipitates were less than that of the BCC dendrites in 1M HCl solution.
The polarization behaviors of the Al
7.5Cr
22.5Fe
35Mn
20Ni
15 alloy in 1M NaCl solution, and in the mixed solution of 1M NaCl and 1M H
2SO
4, were also studied to understand the effect of chlorine ions on the passive film.
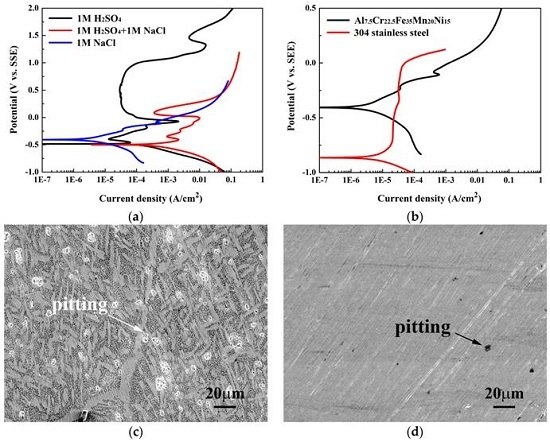
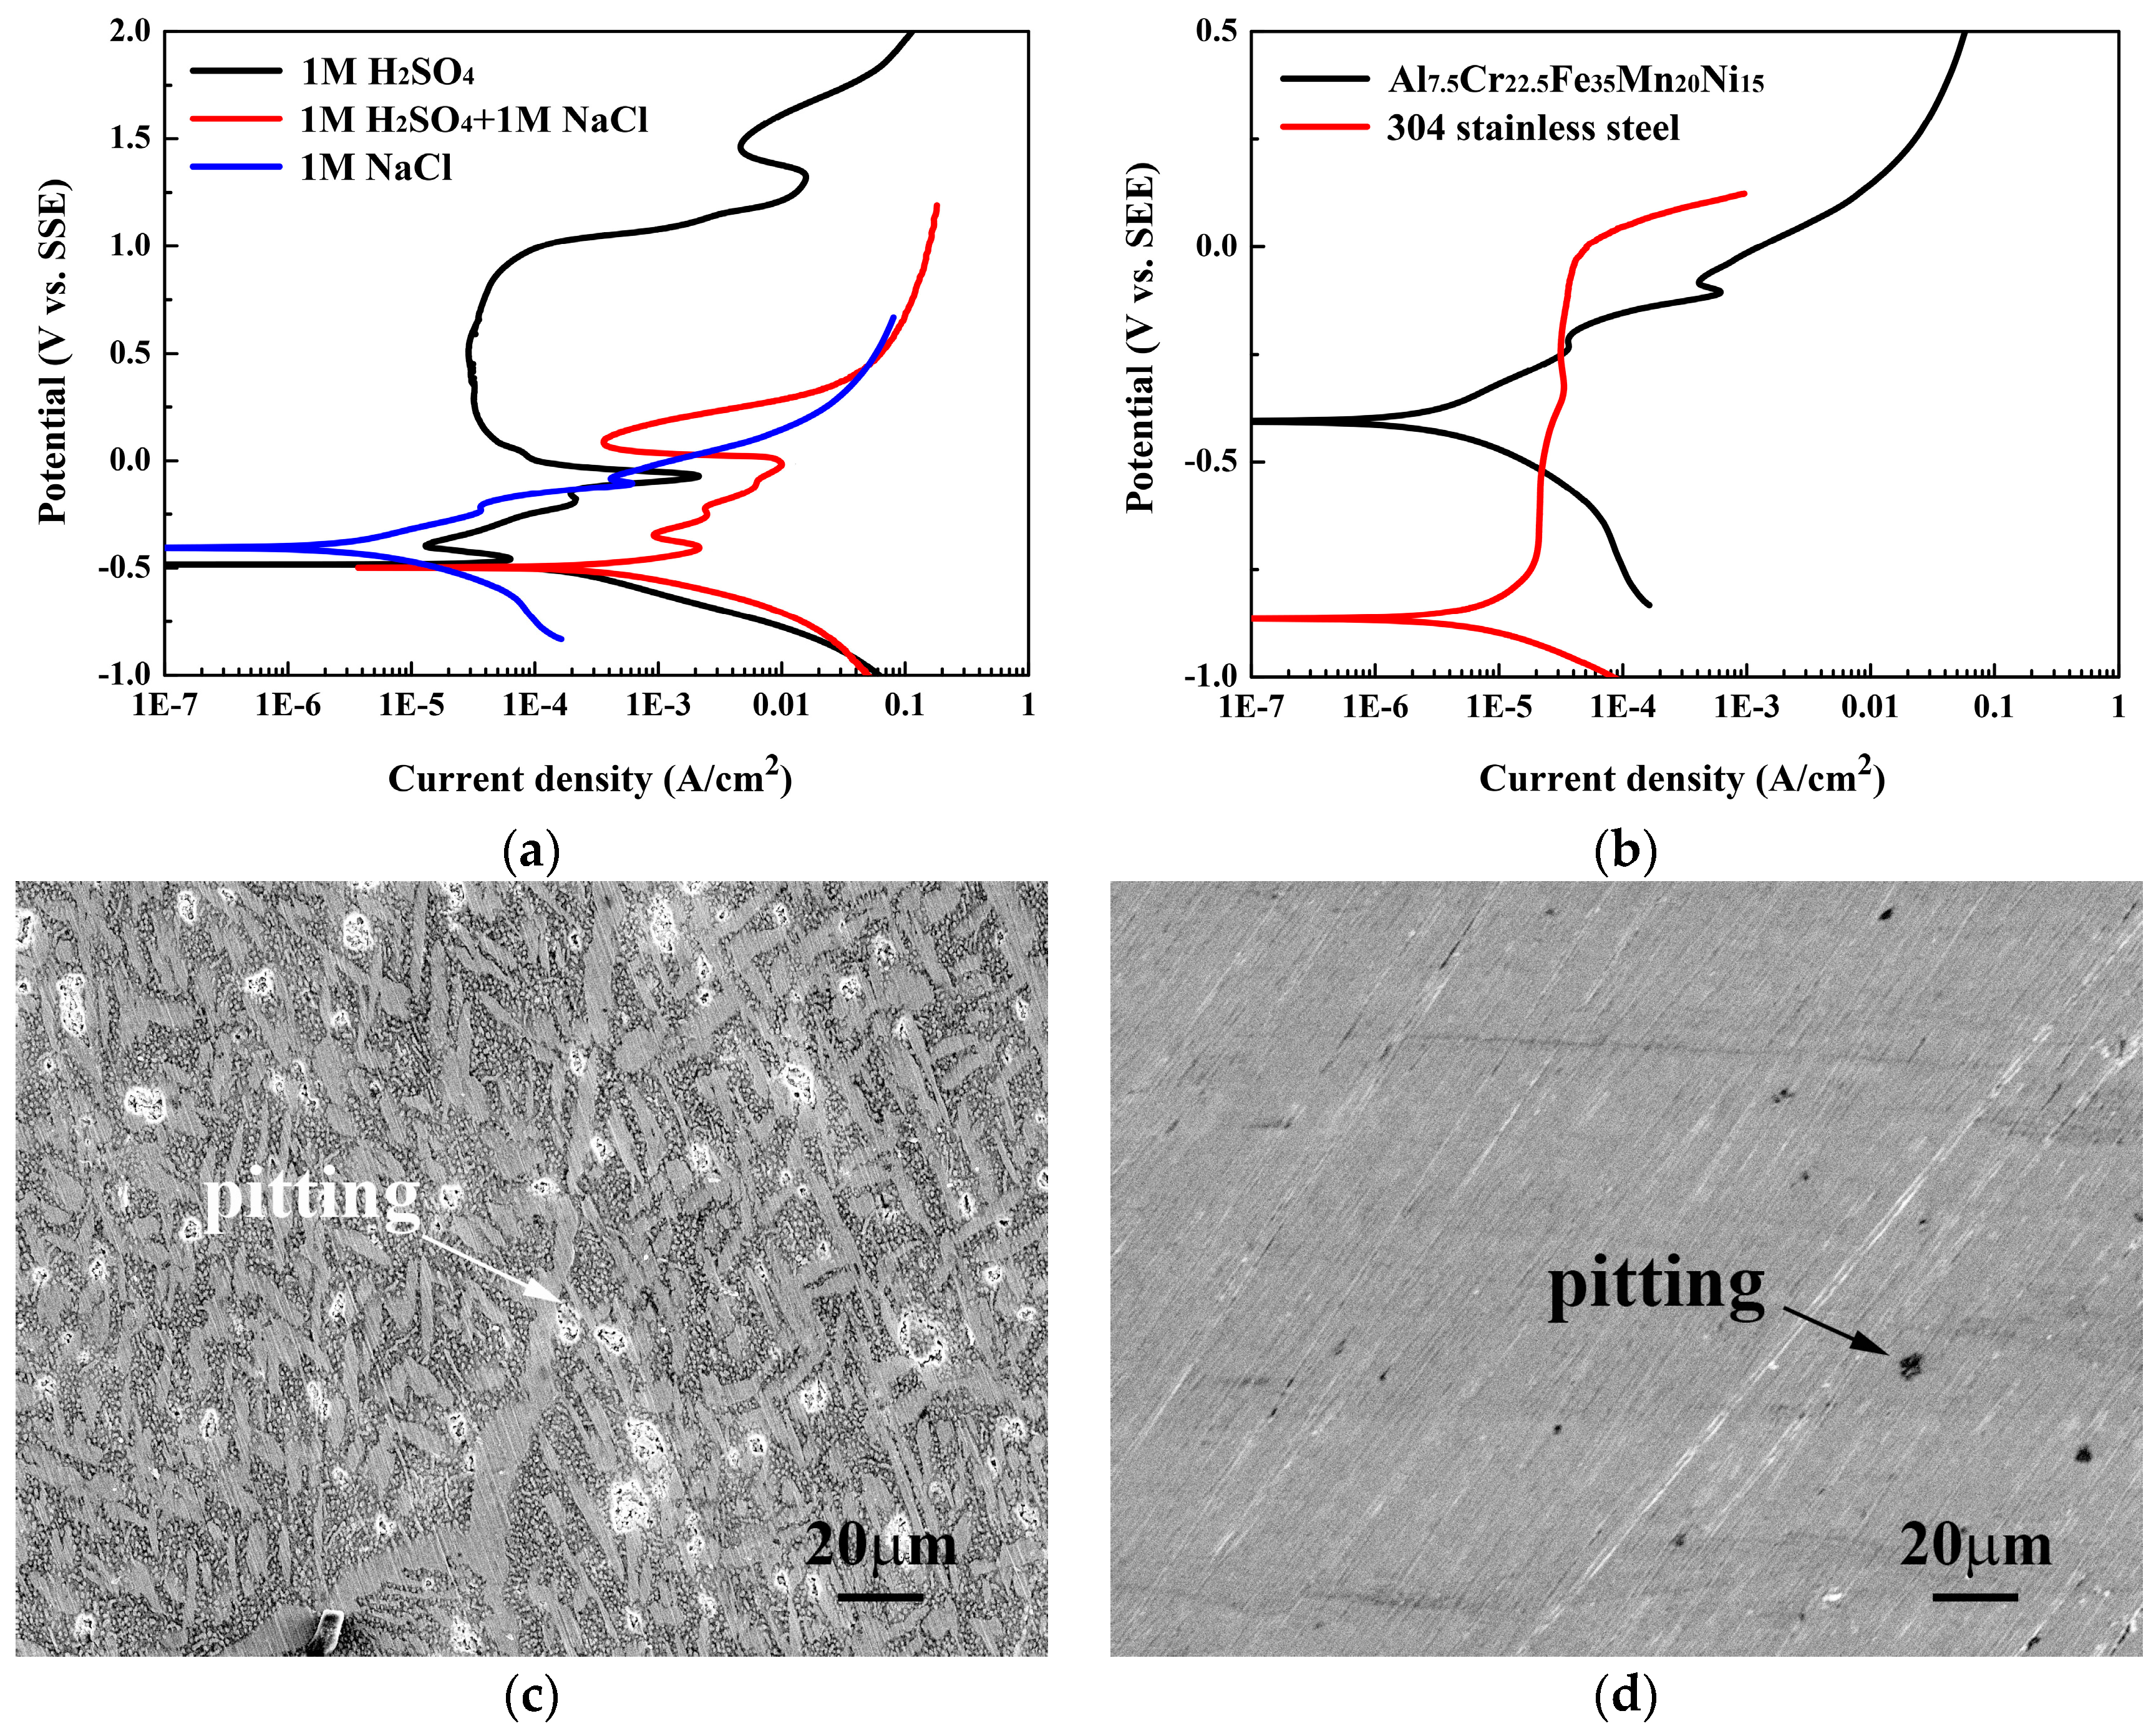
Figure 7a presents the polarization curves of the Al
7.5Cr
22.5Fe
35Mn
20Ni
15 alloy in the 1M H
2SO
4 acid, 1M NaCl solution, and the mixed solution of 1M NaCl and 1M H
2SO
4 at 30 °C.
Table 5 lists the data from which the curves are plotted. The
Ecorr of the Al
7.5Cr
22.5Fe
35Mn
20Ni
15 alloy in the mixed solution of 1M NaCl and 1M H
2SO
4 was almost the same as the alloy in 1M H
2SO
4 solution; but the
icorr increased significantly, from 0.13 to 8.00 mA/cm
2. Both the
Epp and
Esp for the alloy in the mixed solution of 1M NaCl and 1M H
2SO
4 were slightly higher than that in the 1M H
2SO
4 solution; but the
ipp and
isp were also markedly increased. The shape of the passivation region was also seriously destroyed by the attack of chlorine ions; the extent of passivity thus decreased. Moreover, the polarization curve of the alloy in 1M NaCl solution indicated that no passivation region was observed.
Figure 7b compares the polarization curves of the Al
7.5Cr
22.5Fe
35Mn
20Ni
15 alloy and 304SS in 1M NaCl solution at 30 °C. The
Ecorr for 304SS, −0.86 V (SSE), was lower than that of the Al
7.5Cr
22.5Fe
35Mn
20Ni
15 alloy, and the
icorr for 304SS, 0.07 mA/cm
2, was higher than that of the Al
7.5Cr
22.5Fe
35Mn
20Ni
15 alloy. Additionally, the
Eb for 304SS, −0.02 V (SSE), was higher than that of the Al
7.5Cr
22.5Fe
35Mn
20Ni
15 alloy, indicated that 304SS had better pitting resistance than the Al
7.5Cr
22.5Fe
35Mn
20Ni
15 alloy.
Figure 7c,d show the SEM micrographs of the Al
7.5Cr
22.5Fe
35Mn
20Ni
15 alloy after the polarization test in the mixed solution of 1M NaCl and 1M H
2SO
4, and 1M NaCl solution, respectively.
Figure 7c shows two types of corrosion; one is the corrosion in the BCC dendrite matrix because of H
2SO
4; the other is pitting due to NaCl. This micrograph also proves that the FCC interdendrites were not corroded after the polarization test in 1M H
2SO
4 solution.
Figure 7d shows that only pitting was observed on the surface of the alloy after the polarization test in 1M NaCl solution.


