
Acoustic Entropy of the Materials in the Course of Degradation


Abstract
:
1. Introduction
2. Information Entropy Estimation of Acoustic Emissions
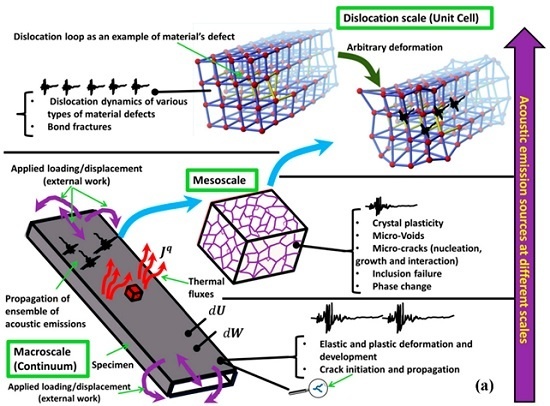
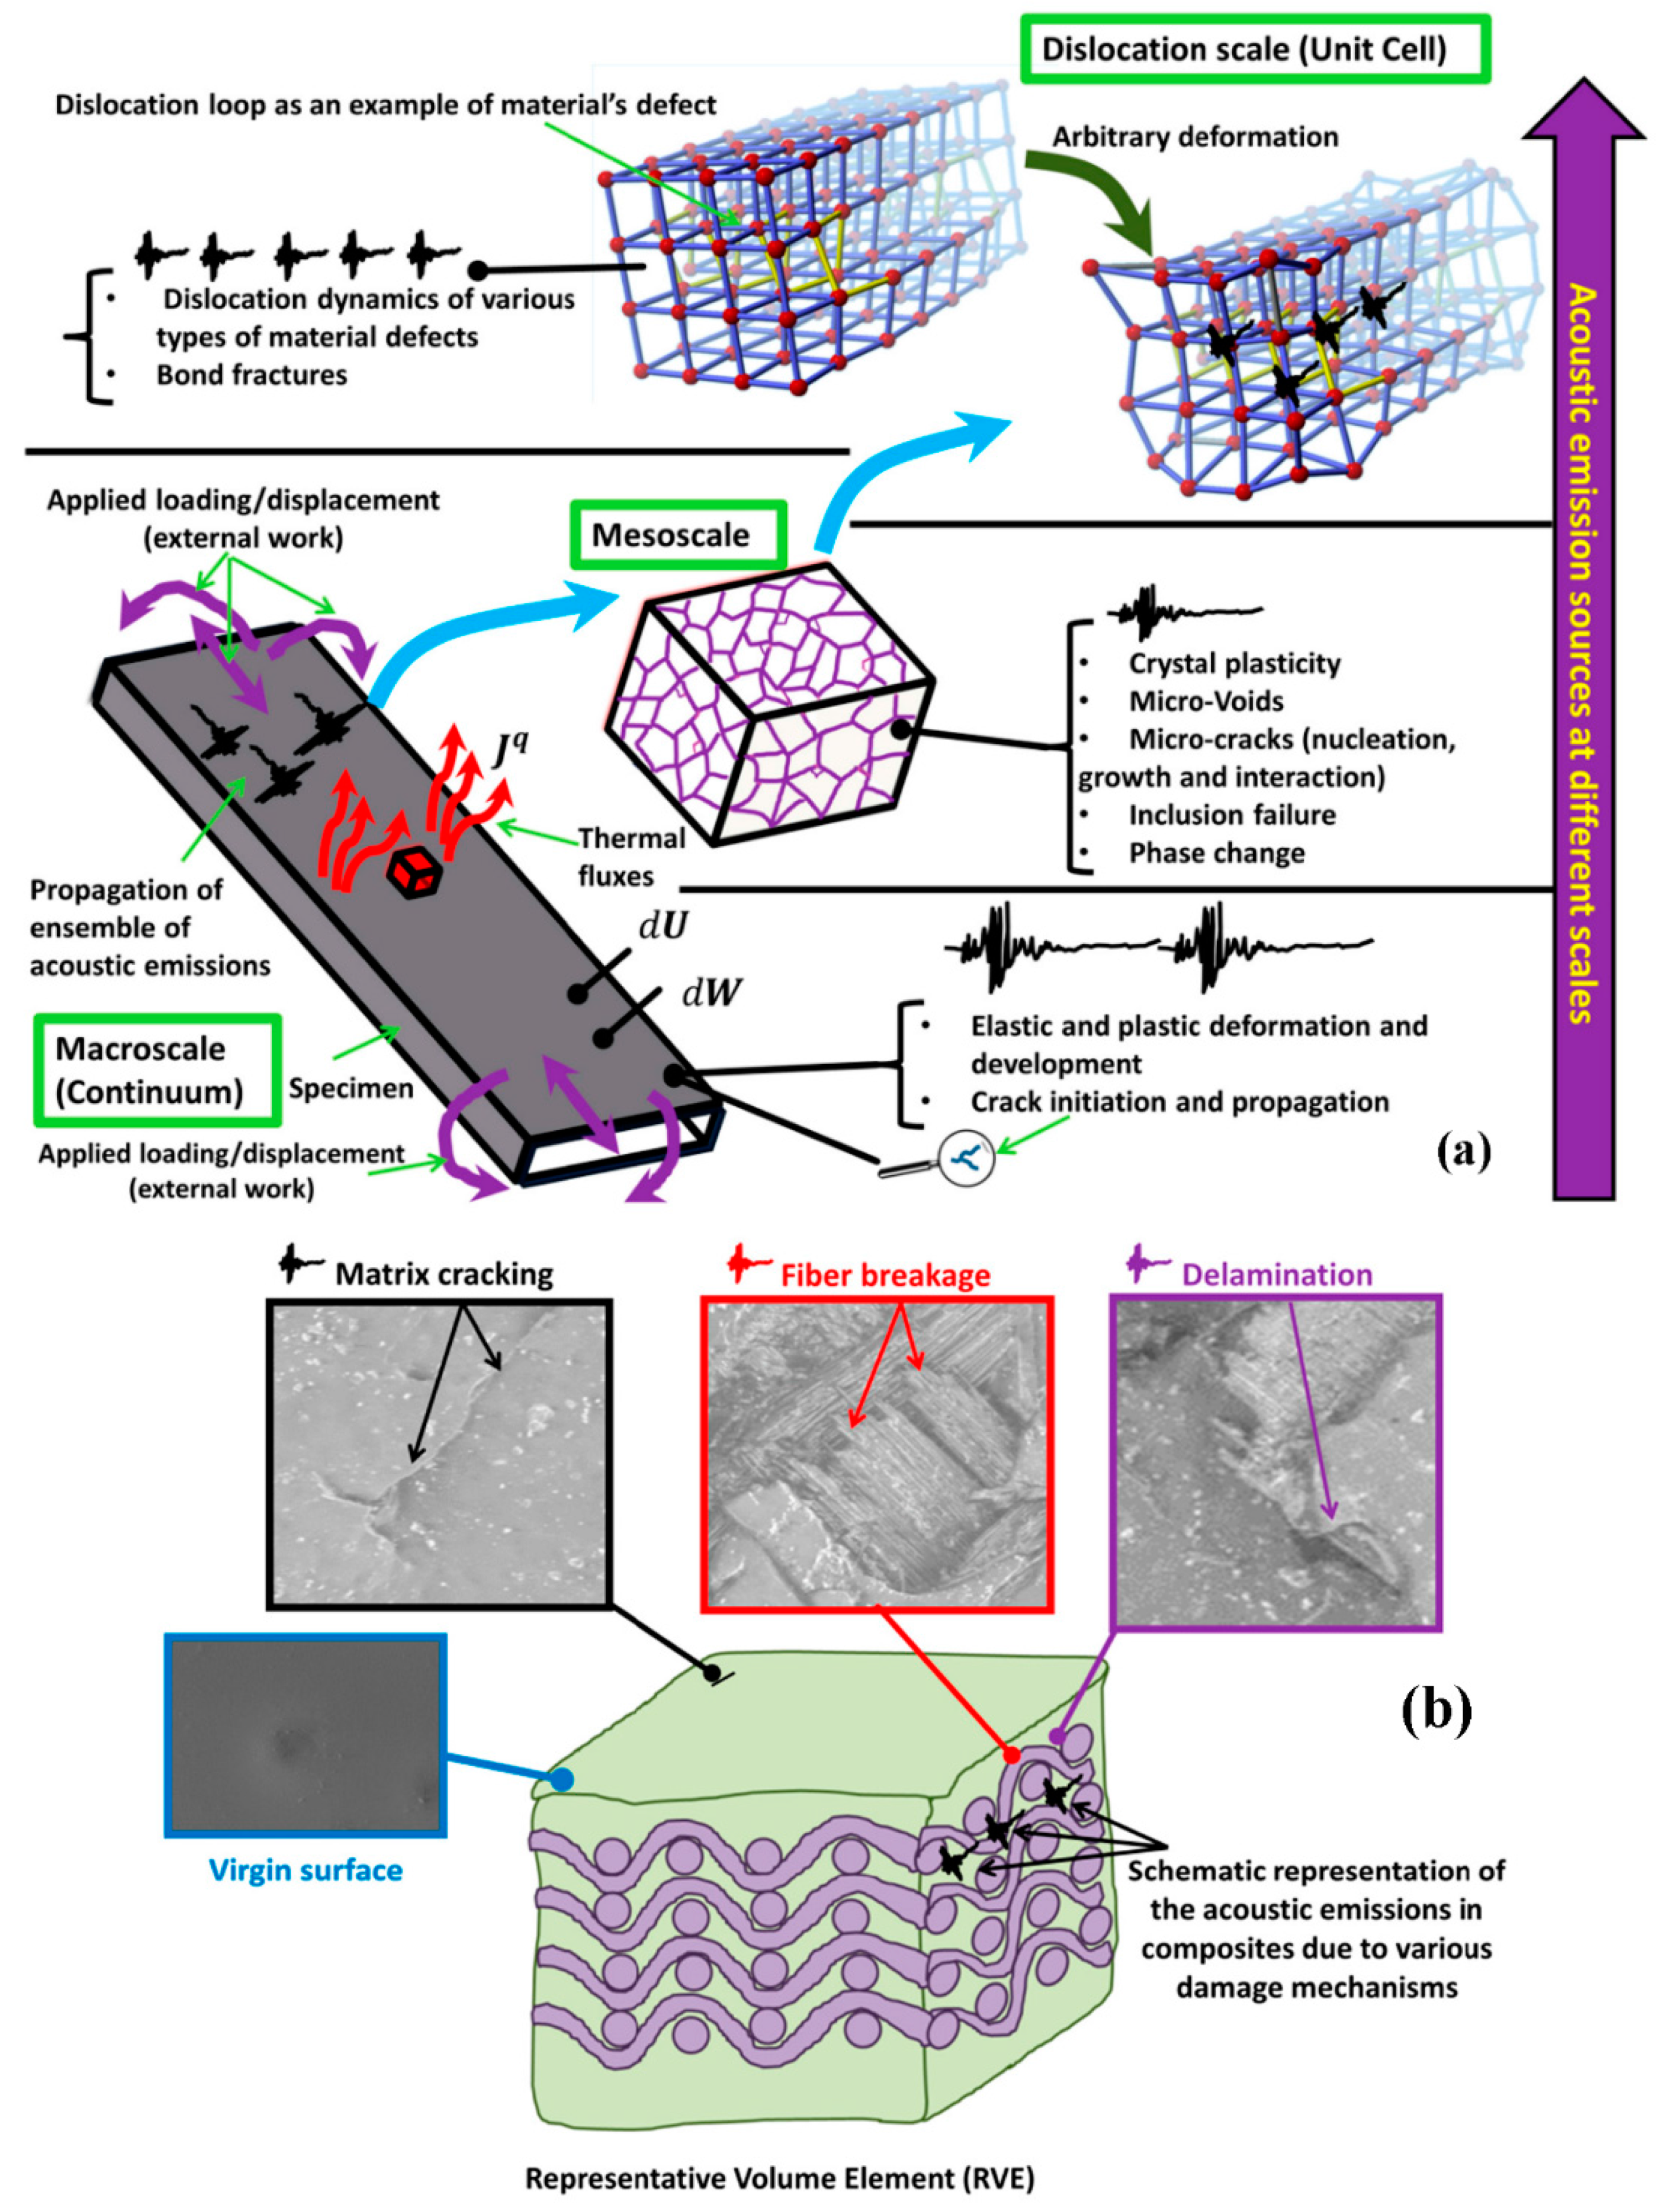
2.1. Acoustic Emission Sources in Metals and Composites
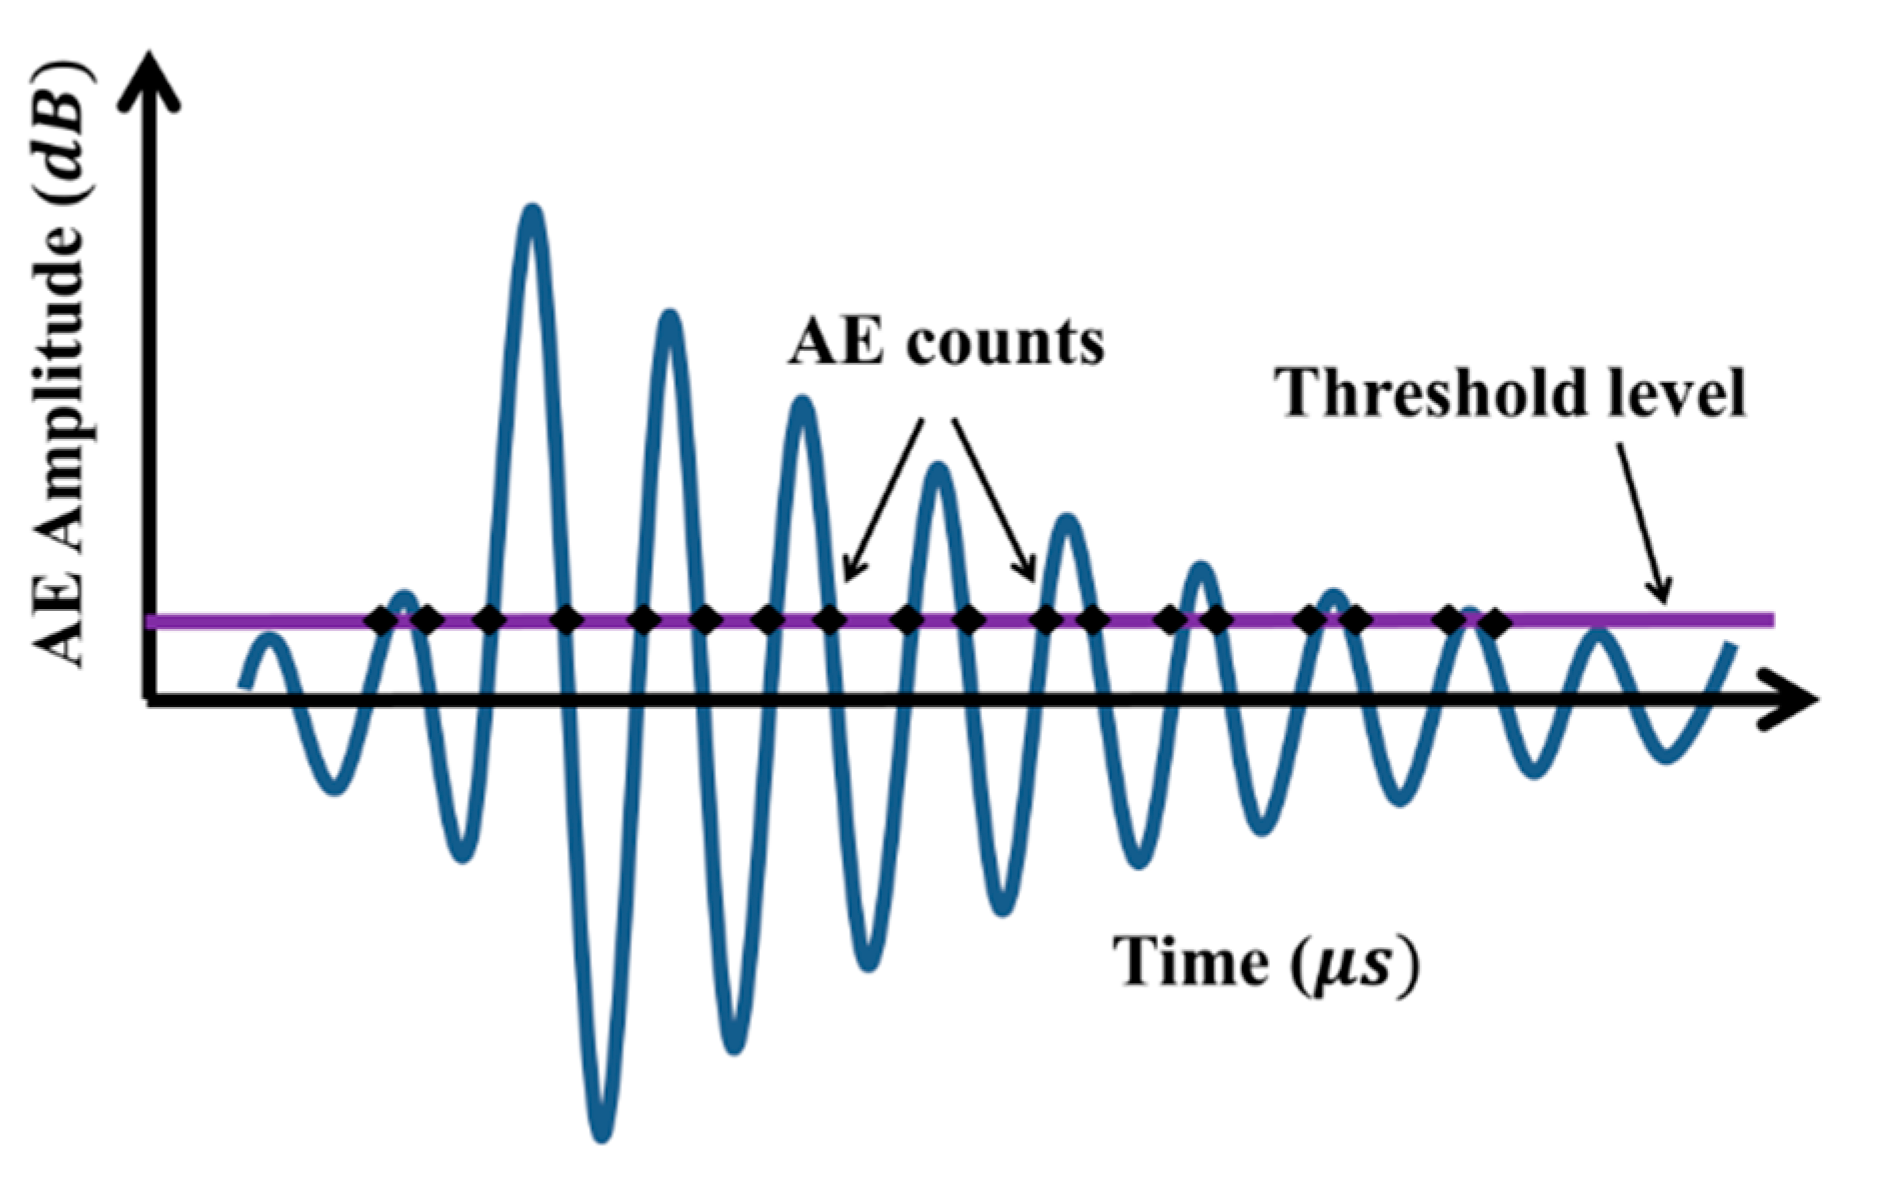
2.2. Entropy of the Acoustic Response
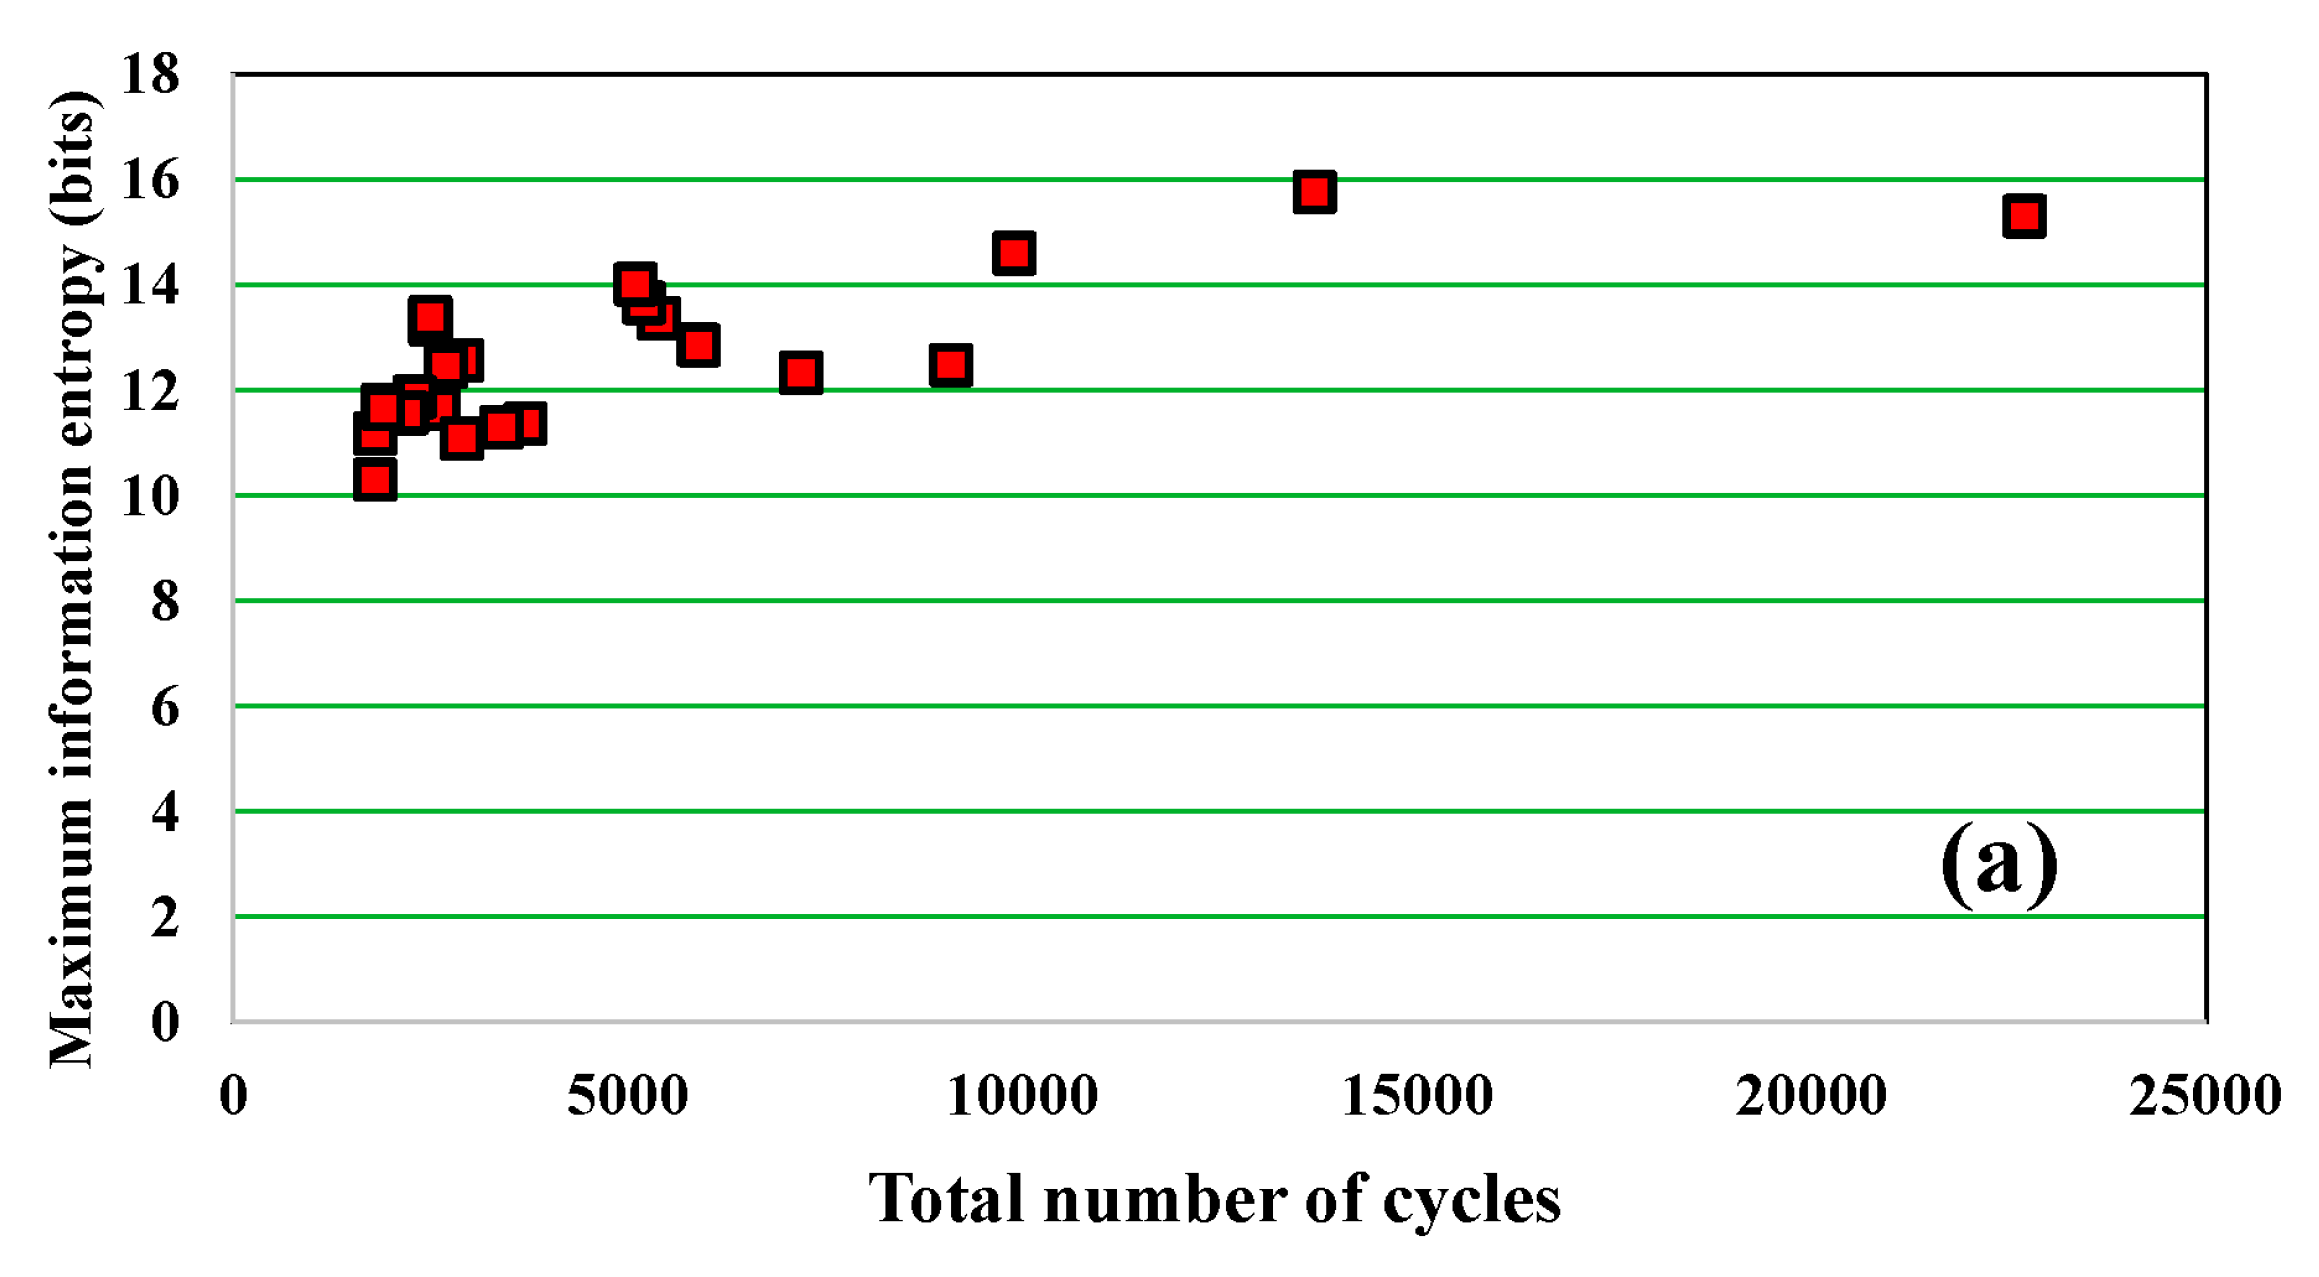
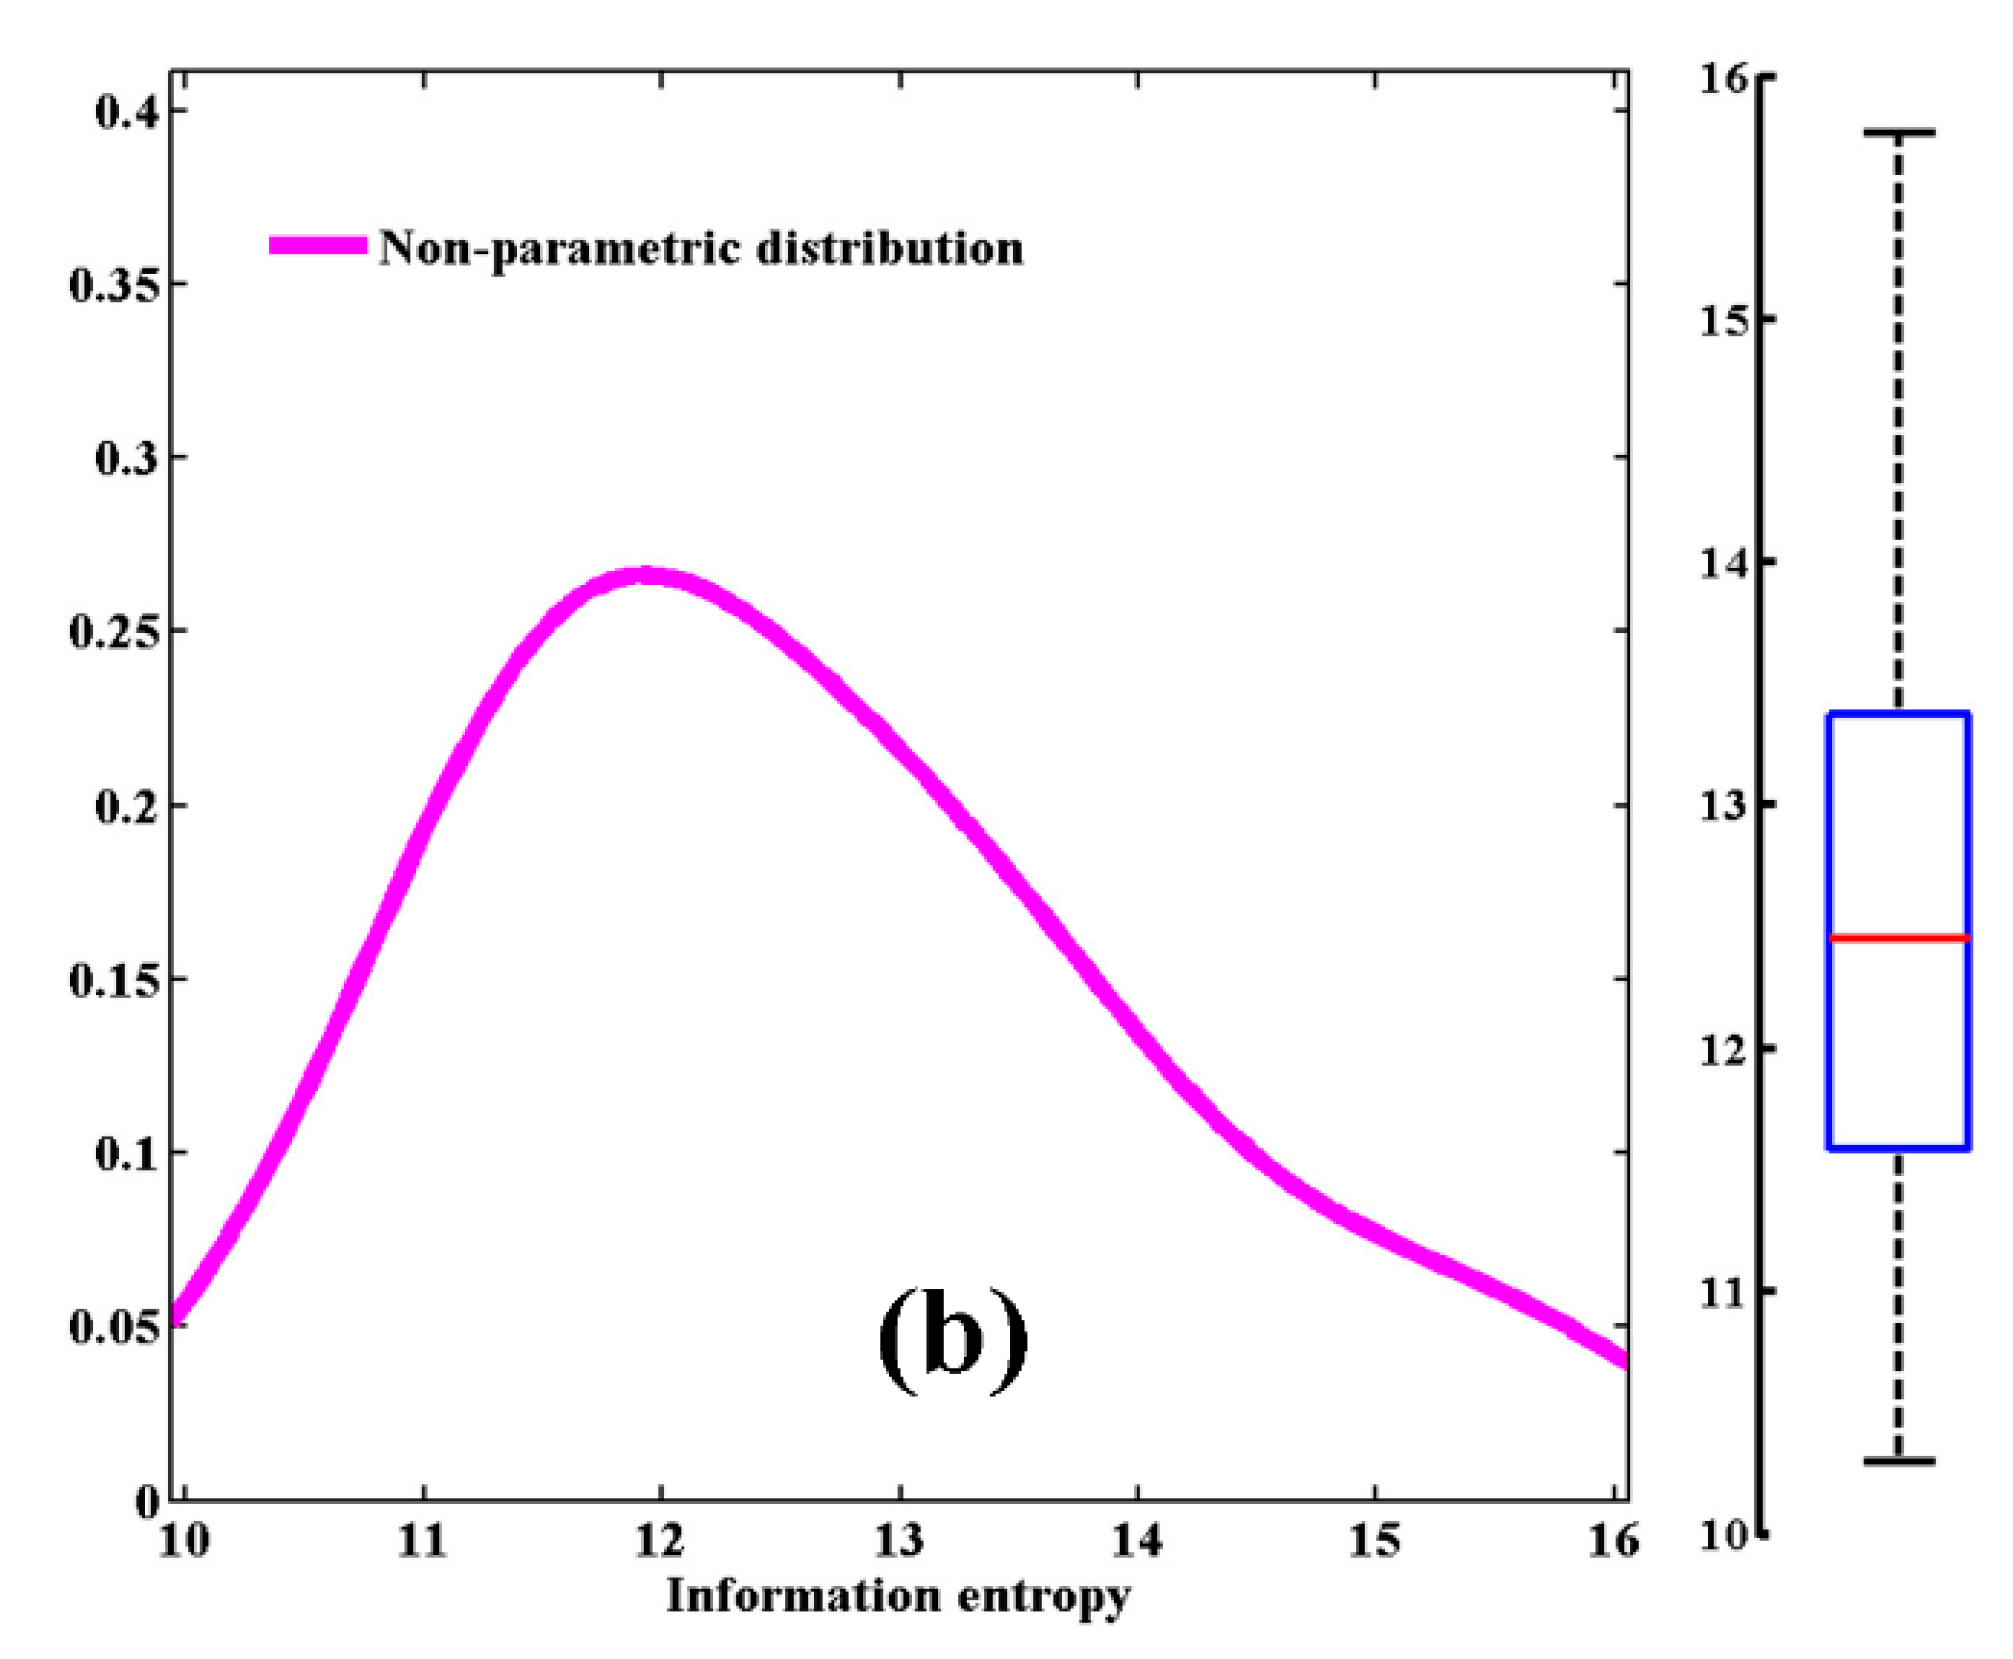
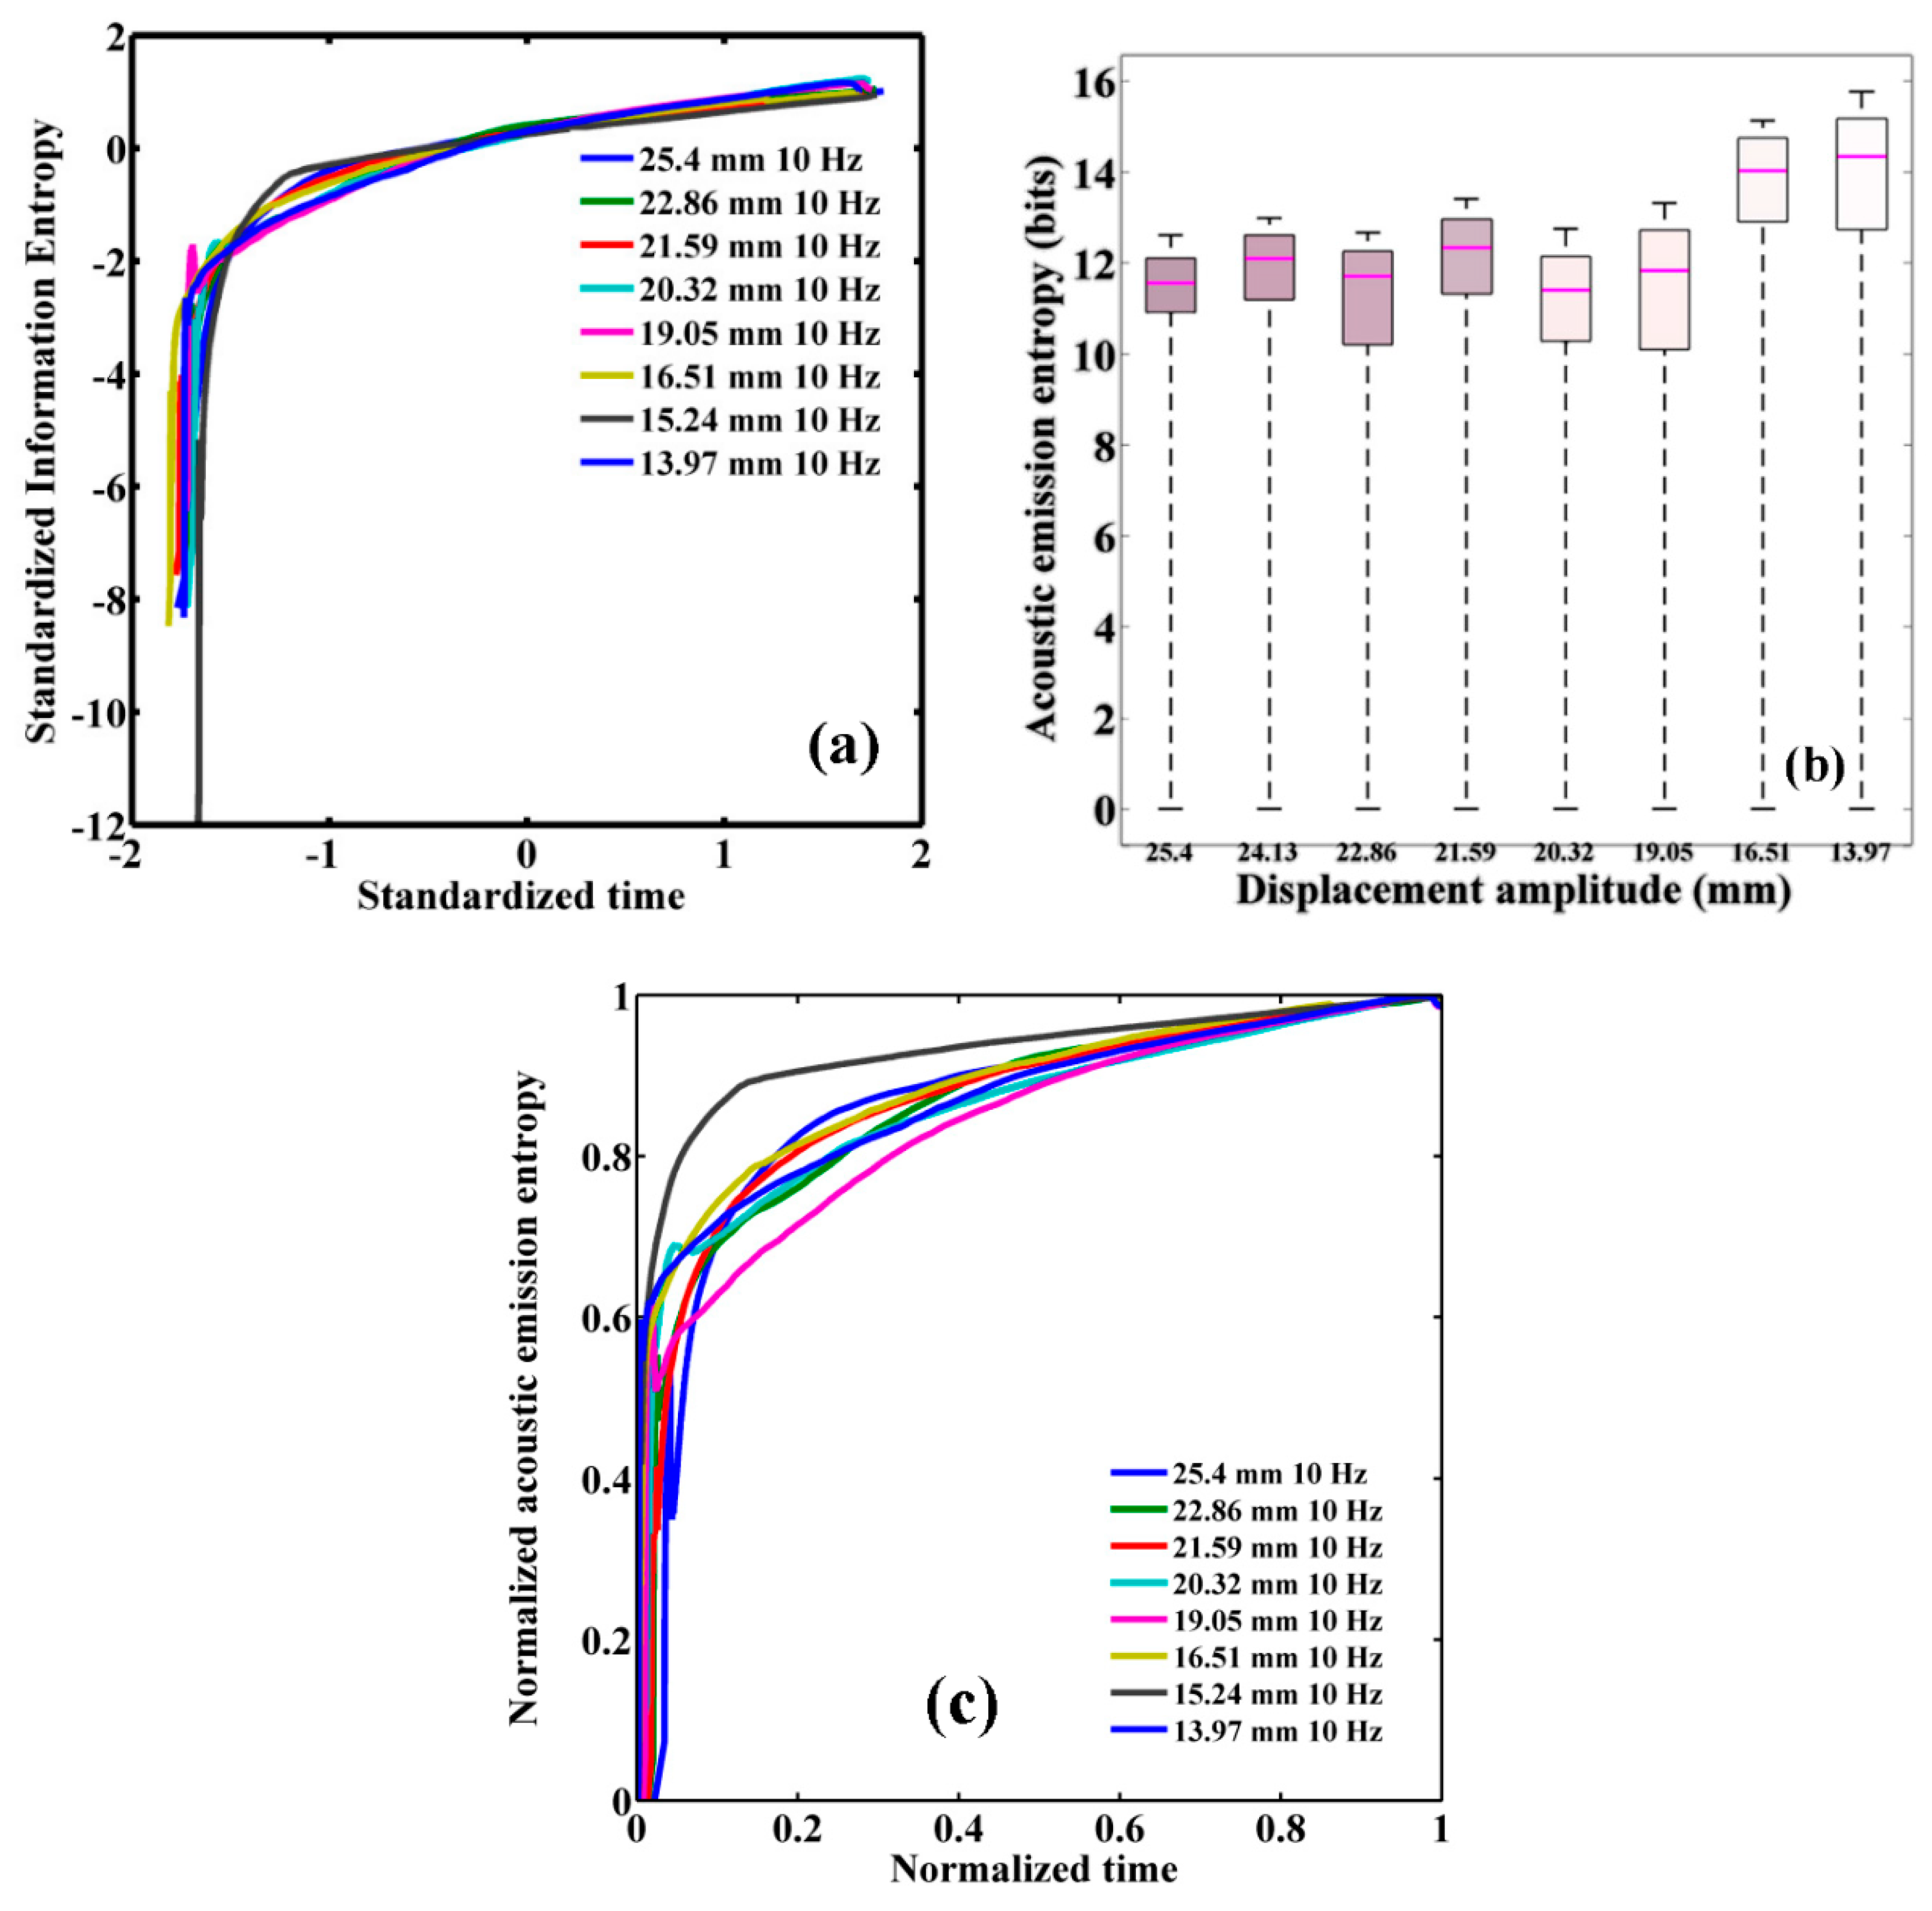
3. Information Entropy Results
4. Discussion and Concluding Remarks
Author Contributions
Conflicts of Interest
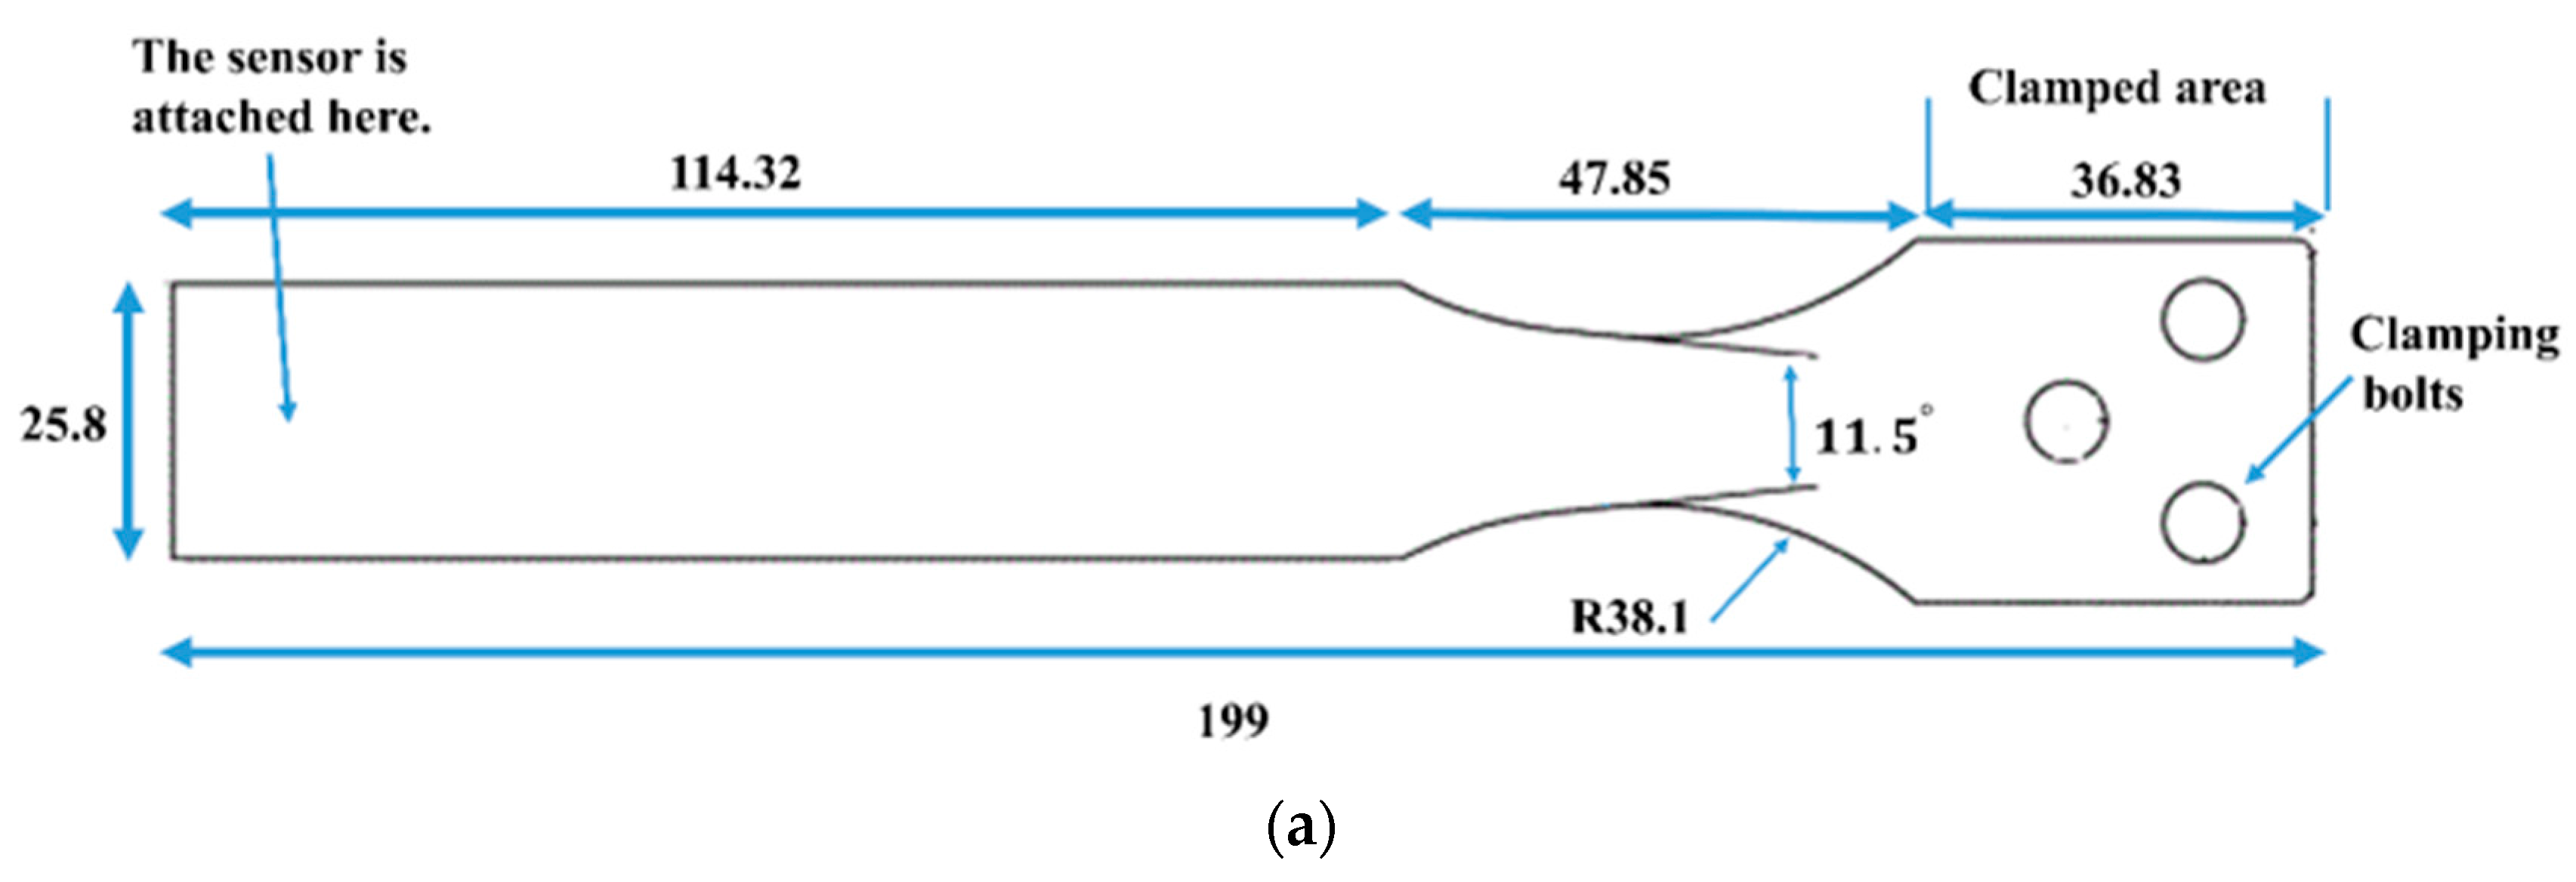
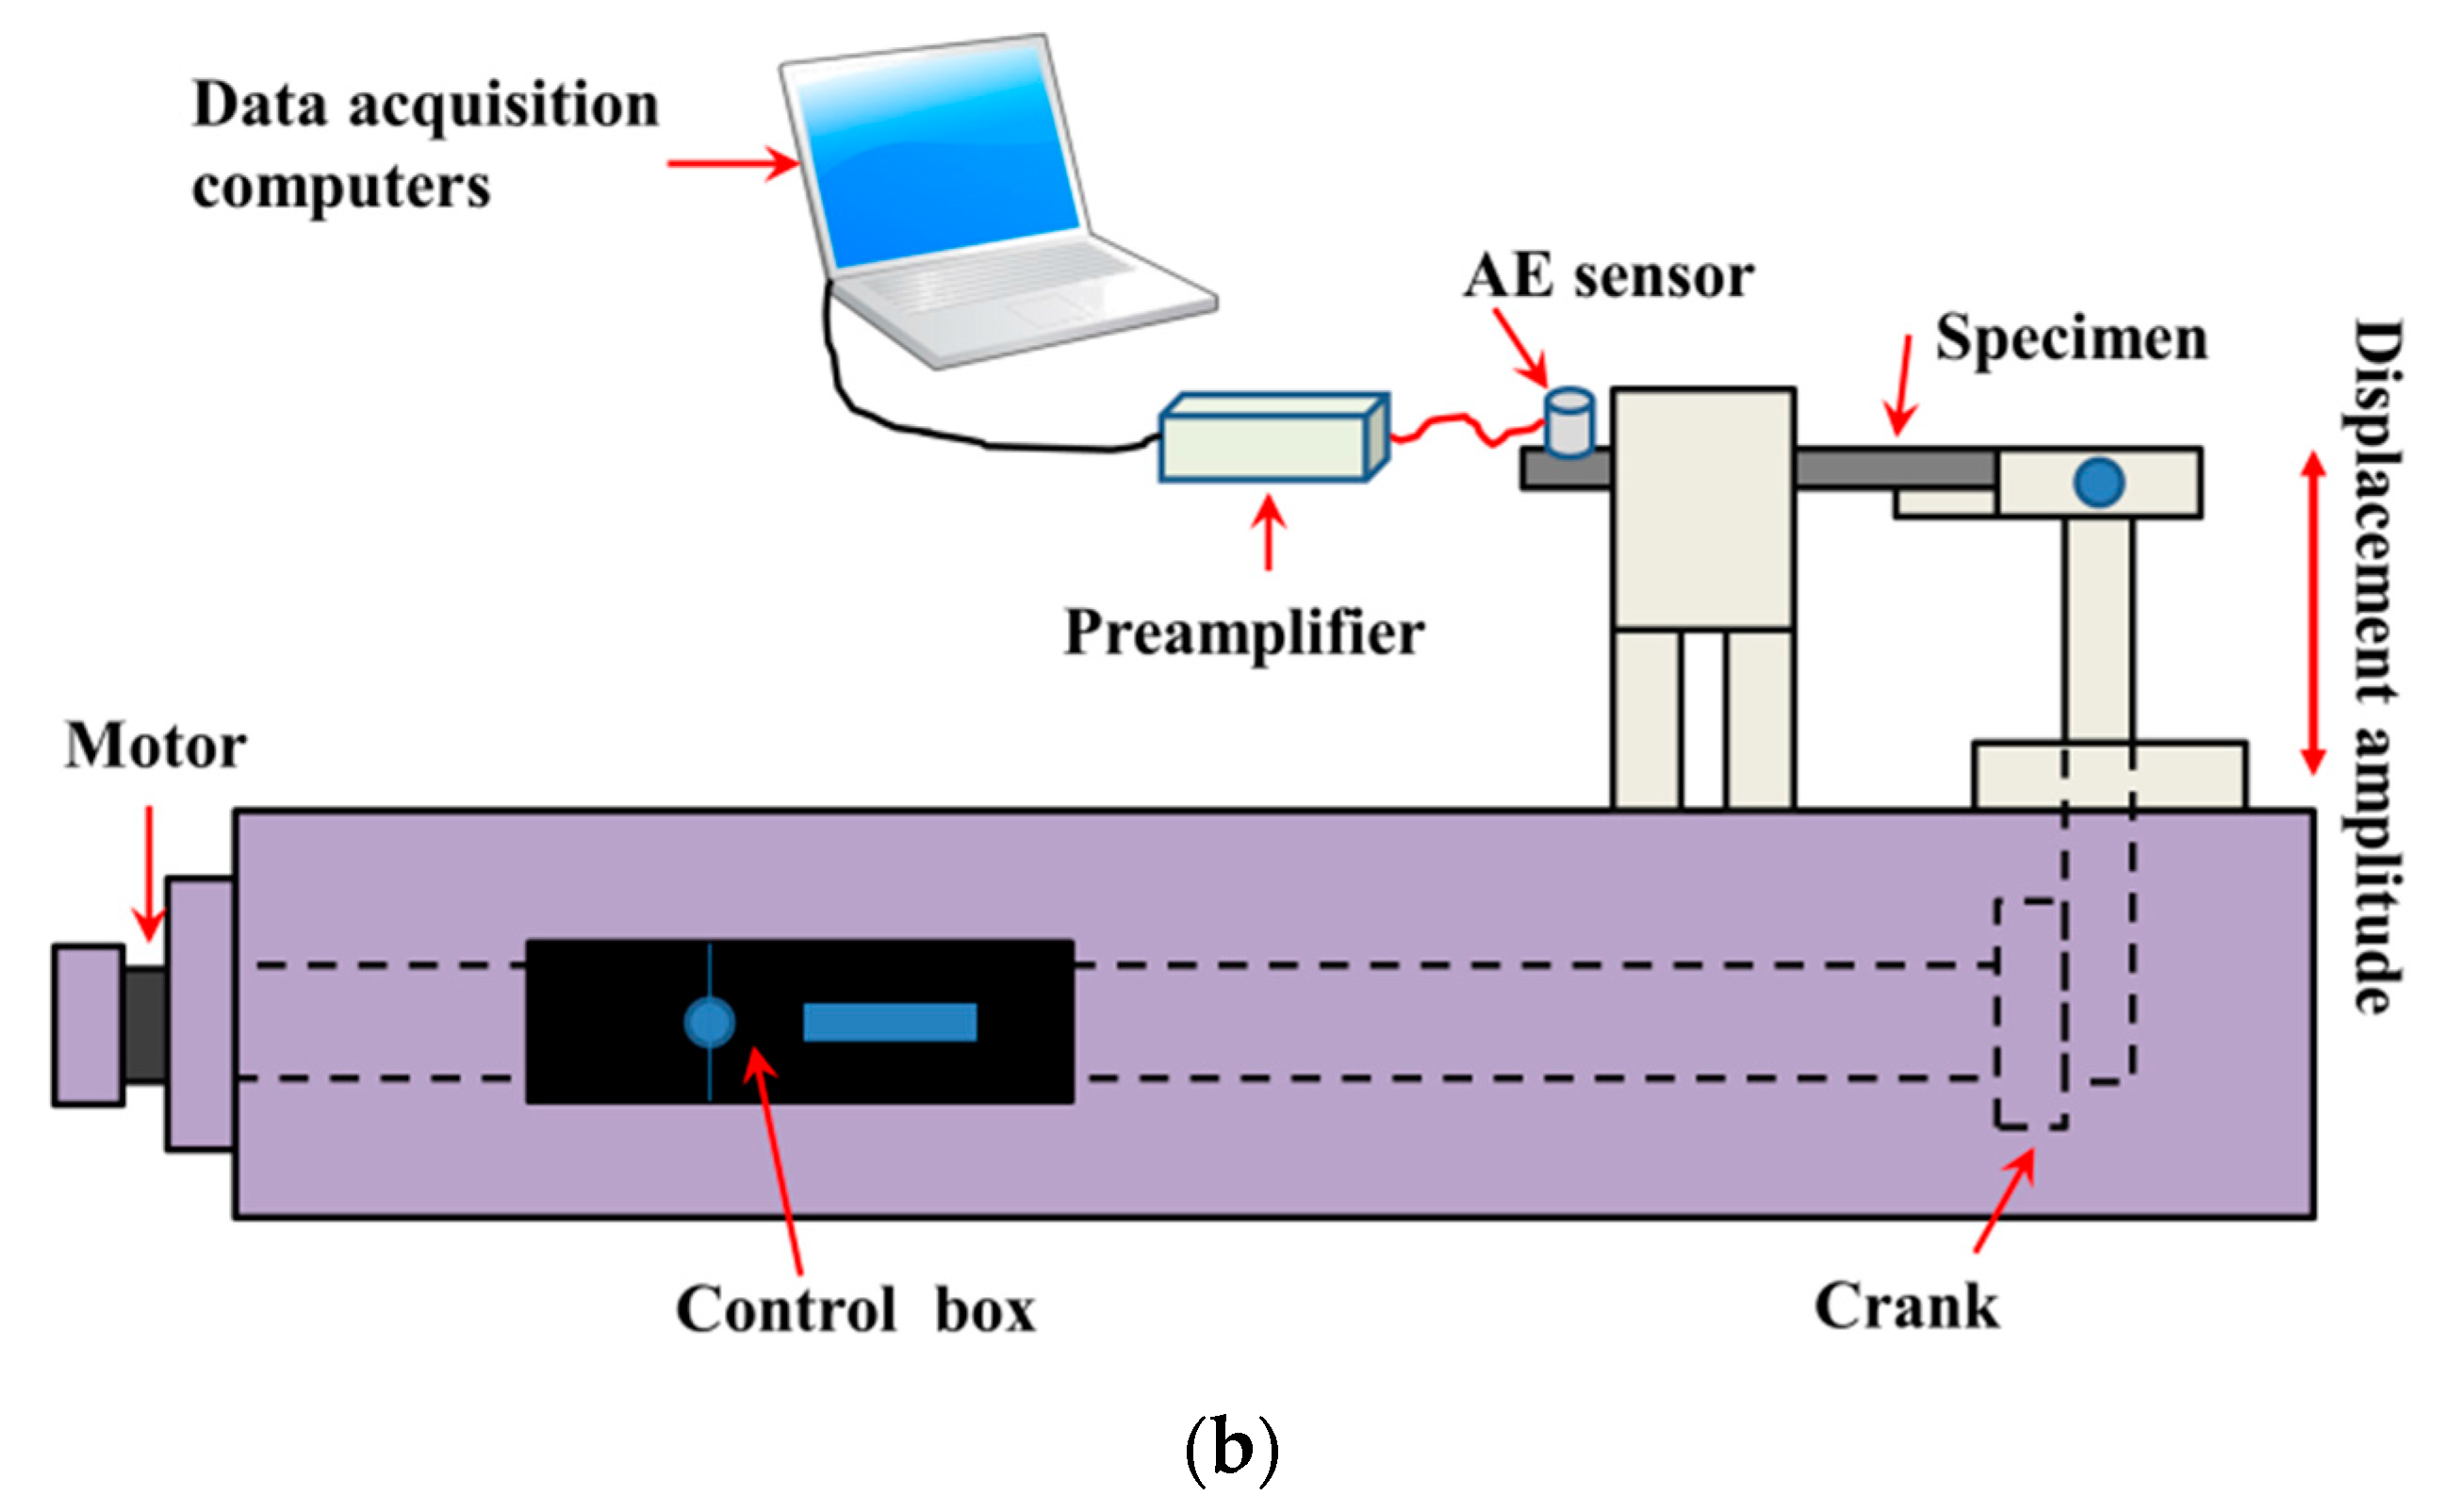
Appendix. Materials, Experimental Apparatus, and Procedure

References
- Moura, A.; Lei, X.; Nishisawa, O. Prediction scheme for the catastrophic failure of highly loaded brittle materials or rocks. J. Mech. Phys. Solids 2005, 53, 2435–2455. [Google Scholar] [CrossRef]
- Moura, A.; Lei, X.; Nishisawa, O. Self-similarity in rock cracking and related complex critical exponents. J. Mech. Phys. Solids 2006, 54, 2544–2553. [Google Scholar] [CrossRef]
- Maire, J.F.; Chaboche, J.L. A new formulation of continuum damage mechanics (CDM) for composite materials. Aerosp. Sci. Technol. 1997, 1, 247–257. [Google Scholar] [CrossRef]
- Kahirdeh, A.; Khonsari, M.M. Energy dissipation in the course of the fatigue degradation: Mathematical derivation and experimental quantification. Int. J. Solids Struct. 2015, 77, 74–85. [Google Scholar] [CrossRef]
- Bryant, M.D.; Khonsari, M.M.; Ling, F.F. On the Thermodynamics of Degradation. Proc. R. Soc. Lond. A 2008, 2096. [Google Scholar] [CrossRef]
- Basaran, C.; Nie, S. An irreversible thermodynamics theory for damage mechanics of solids. Int. J. Damage Mech. 2004, 13, 205–223. [Google Scholar] [CrossRef]
- Temfack, T.; Basaran, C. Experimental verification of thermodynamic fatigue life prediction model using entropy as damage metric. Mater. Sci. Technol. 2015, 31, 1627–1632. [Google Scholar] [CrossRef]
- Letcher, T.; Shen, M.H.H.; Scott-Emuakpor, O.; George, T.; Cross, C. An energy-based critical fatigue life prediction method for AL6061-T6. Fatigue Fract. Eng. Mater. Struct. 2012, 35, 861–870. [Google Scholar] [CrossRef]
- Scott-Emuakpor, O.; George, T.; Cross, C.; Shen, M.-H.H. Hysteresis-loop representation for strain energy calculation and fatigue assessment. J. Strain Anal. Eng. Design 2010, 45, 275–282. [Google Scholar] [CrossRef]
- Ozaltun, H.; Shen, M.H.H.; George, T.; Cross, C. An energy based fatigue life prediction framework for in-service structural components. Exp. Mech. 2011, 51, 707–718. [Google Scholar] [CrossRef]
- Liakat, M.; Khonsari, M.M. Entropic characterization of metal fatigue with stress concentration. Int. J. Fatigue 2015, 70, 223–234. [Google Scholar] [CrossRef]
- Imanian, A.; Modarres, M. A thermodynamic entropy approach to reliability assessment with applications to corrosion fatigue. Entropy 2015, 17, 6995–7020. [Google Scholar] [CrossRef]
- Ontiveros, V.L.; Modarres, M.; Amiri, M. Estimation of reliability of structures subject to fatigue loading using plastic strain energy and thermodynamic entropy generation. Proc. Inst. Mech. Eng. Part O 2015, 229, 220–236. [Google Scholar] [CrossRef]
- Toubal, L.; Karama, M.; Lorrain, B. Damage evolution and infrared thermography in woven composite laminates under fatigue loading. Int. J. Fatigue 2006, 28, 1867–1872. [Google Scholar] [CrossRef]
- Naderi, M.; Kahirdeh, A.; Khonsari, M.M. Dissipated thermal energy and damage evolution of glass/epoxy using infrared thermography and acoustic emission. Compos. Part B 2012, 43, 1613–1620. [Google Scholar] [CrossRef]
- Meneghetti, G.; Quaresimin, M. Fatigue strength assessment of a short fiber composite based on the specific heat dissipation. Compos. Part B 2011, 42, 217–225. [Google Scholar] [CrossRef]
- Meneghetti, G.; Ricotta, M. The use of the specific heat loss to analyse the low- and high-cycle fatigue behaviour of plain and notched specimens made of a stainless steel. Eng. Fract. Mech. 2012, 81, 2–16. [Google Scholar] [CrossRef]
- Katunin, A. Thermal fatigue of polymeric composites under repeated loading. J. Reinf. Plast. Compos. 2012, 31, 1037–1044. [Google Scholar] [CrossRef]
- Katunin, A.; Fidali, M. Self-heating of polymeric laminated composite plates under the resonant vibrations: Theoretical and experimental study. Polym. Compos. 2012, 33, 138–146. [Google Scholar] [CrossRef]
- Reis, P.B.; Ferreira, J.M.; Richardson, M.W. Fatigue damage characterization by ndt in polypropylene/glass fibre composites. Appl. Compos. Mater. 2011, 18, 409–419. [Google Scholar] [CrossRef]
- Kahirdeh, A.; Khonsari, M.M. Criticality of degradation in composite materials subjected to cyclic loading. Compos. Part B 2014, 61, 375–382. [Google Scholar] [CrossRef]
- Farhidzadeh, A.; Mpalaskas, A.C.; Matikas, T.E.; Farhidzadeh, H.; Aggelis, D.G. Fracture mode identification in cementitious materials using supervised pattern recognition of acoustic emission features. Construct. Build. Mater. 2014, 67, 129–138. [Google Scholar] [CrossRef]
- Silva, J.M.A.; Devezas, T.C.; Silva, A.P.; Ferreira, J.A.M. Mechanical characterization of composites with embedded optical fibers. J. Compos. Mater. 2005, 39, 1261–1281. [Google Scholar] [CrossRef]
- Bravo, A.; Toubal, L.; Koffi, D.; Erchiqui, F. Development of novel green and biocomposite materials: Tensile and flexural properties and damage analysis using acoustic emission. Mater. Design 2015, 66, 16–28. [Google Scholar] [CrossRef]
- Kordatos, E.Z.; Aggelis, D.G.; Matikas, T.E. Monitoring mechanical damage in structural materials using complimentary nde techniques based on thermography and acoustic emission. Compos. Part B 2012, 43, 2676–2686. [Google Scholar] [CrossRef]
- Bridgman, P.W. The thermodynamics of plastic deformation and generalized entropy. Rev. Mod. Phys. 1950, 22, 56–63. [Google Scholar] [CrossRef]
- Whaley, P.W.; Chen, P.S.; Smith, G.M. Continuous measurement of material damping during fatigue tests. Exp. Mech. 1984, 24, 342–348. [Google Scholar] [CrossRef]
- Whaley, P.W. A mathematical model for internal friction and local fatigue damage based on populations of yielding microelements. J. Vib. Acoust. Stress Reliabil. Design 1987, 109, 201–206. [Google Scholar] [CrossRef]
- Basaran, C.; Yan, C.Y. A thermodynamic framework for damage mechanics of solder joints. J. Electron. Packag. 1998, 120, 379–384. [Google Scholar] [CrossRef]
- Basaran, C.; Tang, H. Implementation of a thermodynamic framework for damage mechanics of solder interconnects in microelectronics packaging. Int. J. Damage Mech. 2002, 11, 87–108. [Google Scholar] [CrossRef]
- Basaran, C.; Lin, M.; Ye, H. A thermodynamic model for electrical current induced damage. Int. J. Solids Struct. 2003, 40, 7315–7327. [Google Scholar] [CrossRef]
- Gunel, E.M.; Basaran, C. Damage characterization in non-isothermal stretching of acrylics. Part II: Experimental validation. Mech. Mater. 2011, 43, 992–1012. [Google Scholar] [CrossRef]
- Naderi, M.; Amiri, M.; Khonsari, M.M. On the thermodynamic entropy of fatigue fracture. Proc. R. Soc. Lond. A 2010, 466, 423–438. [Google Scholar] [CrossRef]
- Kakakasery, J.; Arumugam, V.; Abdul Rauf, K.; Bull, D.; Chambers, A.R.; Scarponi, C.; Santulli, C. Cure cycle effect on impact resistance under elevated temperatures in carbon prepreg laminates investigated using acoustic emission. Compos. Part B 2015, 75, 298–306. [Google Scholar] [CrossRef]
- Hoffmann, M.J.; Hammer, M.; Endriss, A.; Lupascu, D.C. Correlation between microstructure, strain behavior, and acoustic emission of soft pzt ceramics. Acta Mater. 2001, 49, 1301–1310. [Google Scholar] [CrossRef]
- Shannon, C.E. A mathematical theory of communication. Bell Syst. Tech. J. 1948, 27, 379–423. [Google Scholar] [CrossRef]
- Coifman, R.R.; Wickerhauser, M.V. Entropy-based algorithms for best basis selection. IEEE Trans. Inf. Theory 1992, 38, 713–718. [Google Scholar] [CrossRef]
- Kapur, J.N.; Sahoo, P.K.; Wong, A.K.C. A new method for gray-level picture thresholding using the entropy of the histogram. Comput. Vis. Graph. Image Process. 1985, 29, 273–285. [Google Scholar] [CrossRef]
- Sabuncu, M.R. Entropy-Based Image Registration. Ph.D. Thesis, Princeton University, Princeton, NJ, USA, 2004. [Google Scholar]
- Elforjani, M.; Mba, D. Accelerated natural fault diagnosis in slow speed bearings with acoustic emission. Eng. Fract. Mech. 2010, 77, 112–127. [Google Scholar] [CrossRef]
- Niven, R.K. Steady state of a dissipative flow-controlled system and the maximum entropy production principle. Phys. Rev. E 2009, 80, 021113. [Google Scholar] [CrossRef] [PubMed]
- Strait, B.J.; Dewey, T.G. The shannon information entropy of protein sequences. Biophys. J. 1996, 71, 148–155. [Google Scholar] [CrossRef]
- Guan, X.; Giffin, A.; Jha, R.; Liu, Y. Maximum relative entropy-based probabilistic inference in fatigue crack damage prognostics. Probabil. Eng. Mech. 2012, 29, 157–166. [Google Scholar] [CrossRef]
- Montgomery, D.C.; Jennings, C.L.; Kulahci, M. Introduction to Time Series Analysis and Forecasting; John Wiley & Sons: Hoboken, NJ, USA, 2011. [Google Scholar]
- Sethna, J. Statistical Mechanics: Entropy, Order Parameters and Complexity; Oxford University Press: Oxford, UK, 2006. [Google Scholar]
- Caticha, A. Lectures on Probability, Entropy, and Statistical Physics. In Proceedings of the 28th International Workshop on Bayesian Inference and Maximum Entropy Methods in Science and Engineering, Sao Paulo, Brazil, 8–13 July 2008.
- Swanson, S.R. Handbook Of Fatigue Testing, STP566-EB. Available online: http://dx.doi.org/10.1520/STP566-EB (accessed on 27 July 2016).
- PCI-2—PCI-Based Two-Channel AE Board & System. Available online: http://www.physicalacoustics.com/by-product/pci-2/ (accessed on 27 July 2016).


© 2016 by the authors; licensee MDPI, Basel, Switzerland. This article is an open access article distributed under the terms and conditions of the Creative Commons Attribution (CC-BY) license (http://creativecommons.org/licenses/by/4.0/).
Share and Cite
Kahirdeh, A.; Khonsari, M.M. Acoustic Entropy of the Materials in the Course of Degradation. Entropy 2016, 18, 280. https://doi.org/10.3390/e18080280
Kahirdeh A, Khonsari MM. Acoustic Entropy of the Materials in the Course of Degradation. Entropy. 2016; 18(8):280. https://doi.org/10.3390/e18080280
Chicago/Turabian StyleKahirdeh, Ali, and M. M. Khonsari. 2016. "Acoustic Entropy of the Materials in the Course of Degradation" Entropy 18, no. 8: 280. https://doi.org/10.3390/e18080280
APA StyleKahirdeh, A., & Khonsari, M. M. (2016). Acoustic Entropy of the Materials in the Course of Degradation. Entropy, 18(8), 280. https://doi.org/10.3390/e18080280