
Expected Logarithm of Central Quadratic Form and Its Use in KL-Divergence of Some Distributions


Abstract
:
1. Introduction
1.1. Contributions
- -
- Introducing three methods for computing the expected logarithm of a CQF.
- -
- Proposing a procedure for computing the expected logarithm of an arbitrary positive random variable.
- -
- Deriving expressions for the entropy and the KL-divergence of ZEG and ACG distributions (the form of KL-divergence between ZEG distributions appeared in [38] but without its derivations).
1.2. Outline
2. Calculating the Expected Logarithm of a Central Quadratic Form
2.1. Integral Method
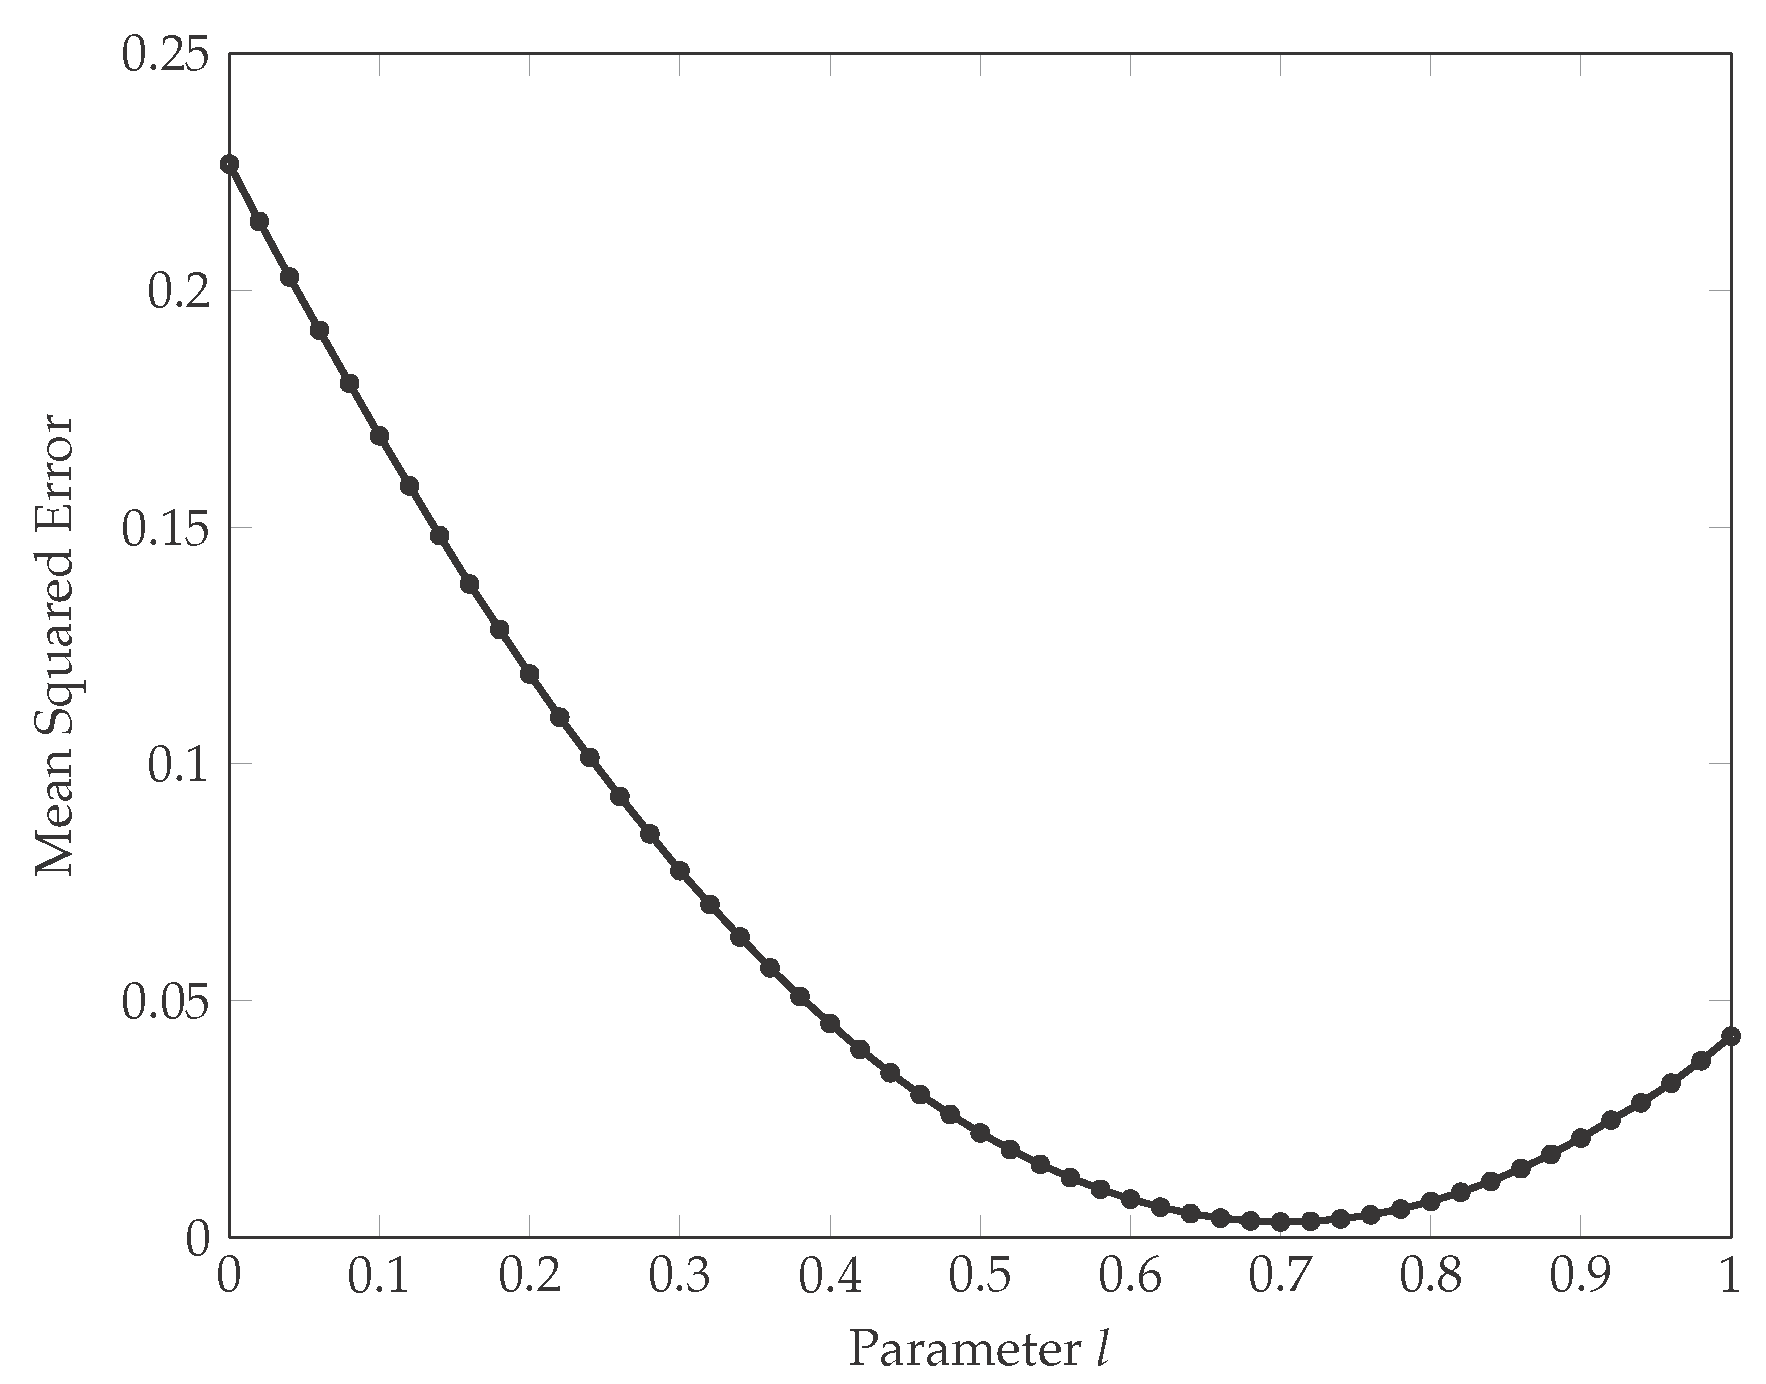
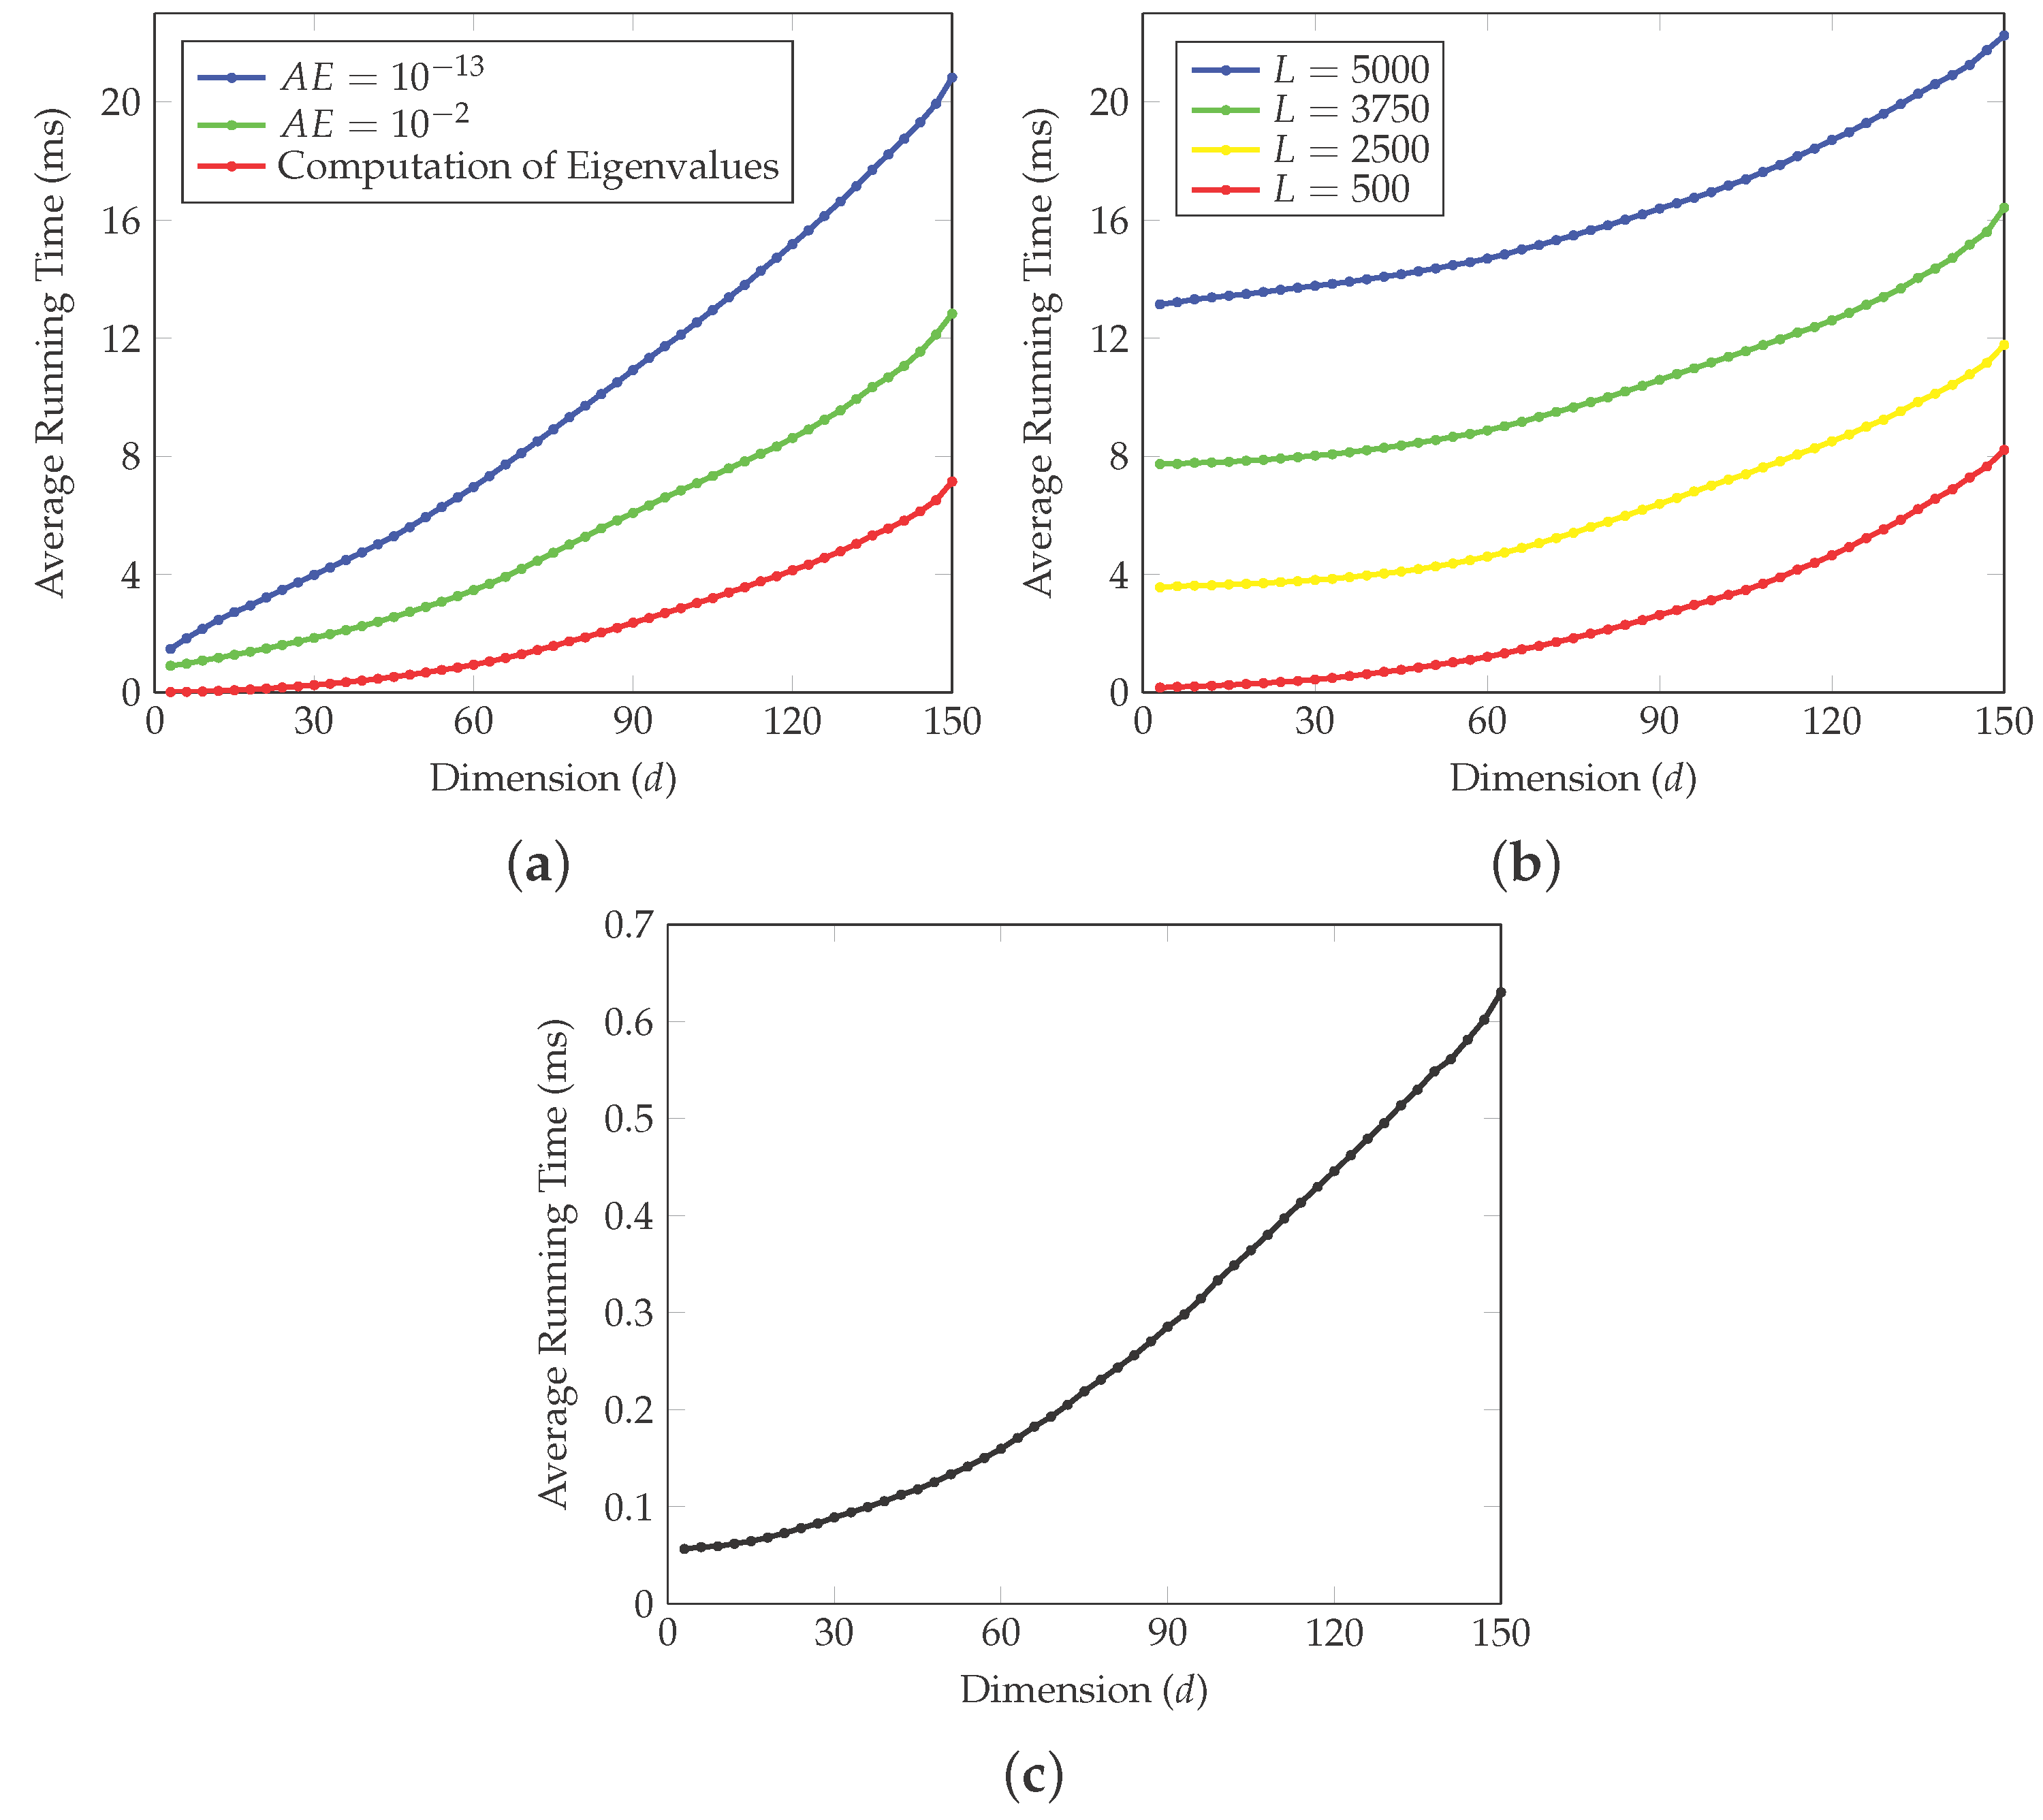
2.2. Fast Methods
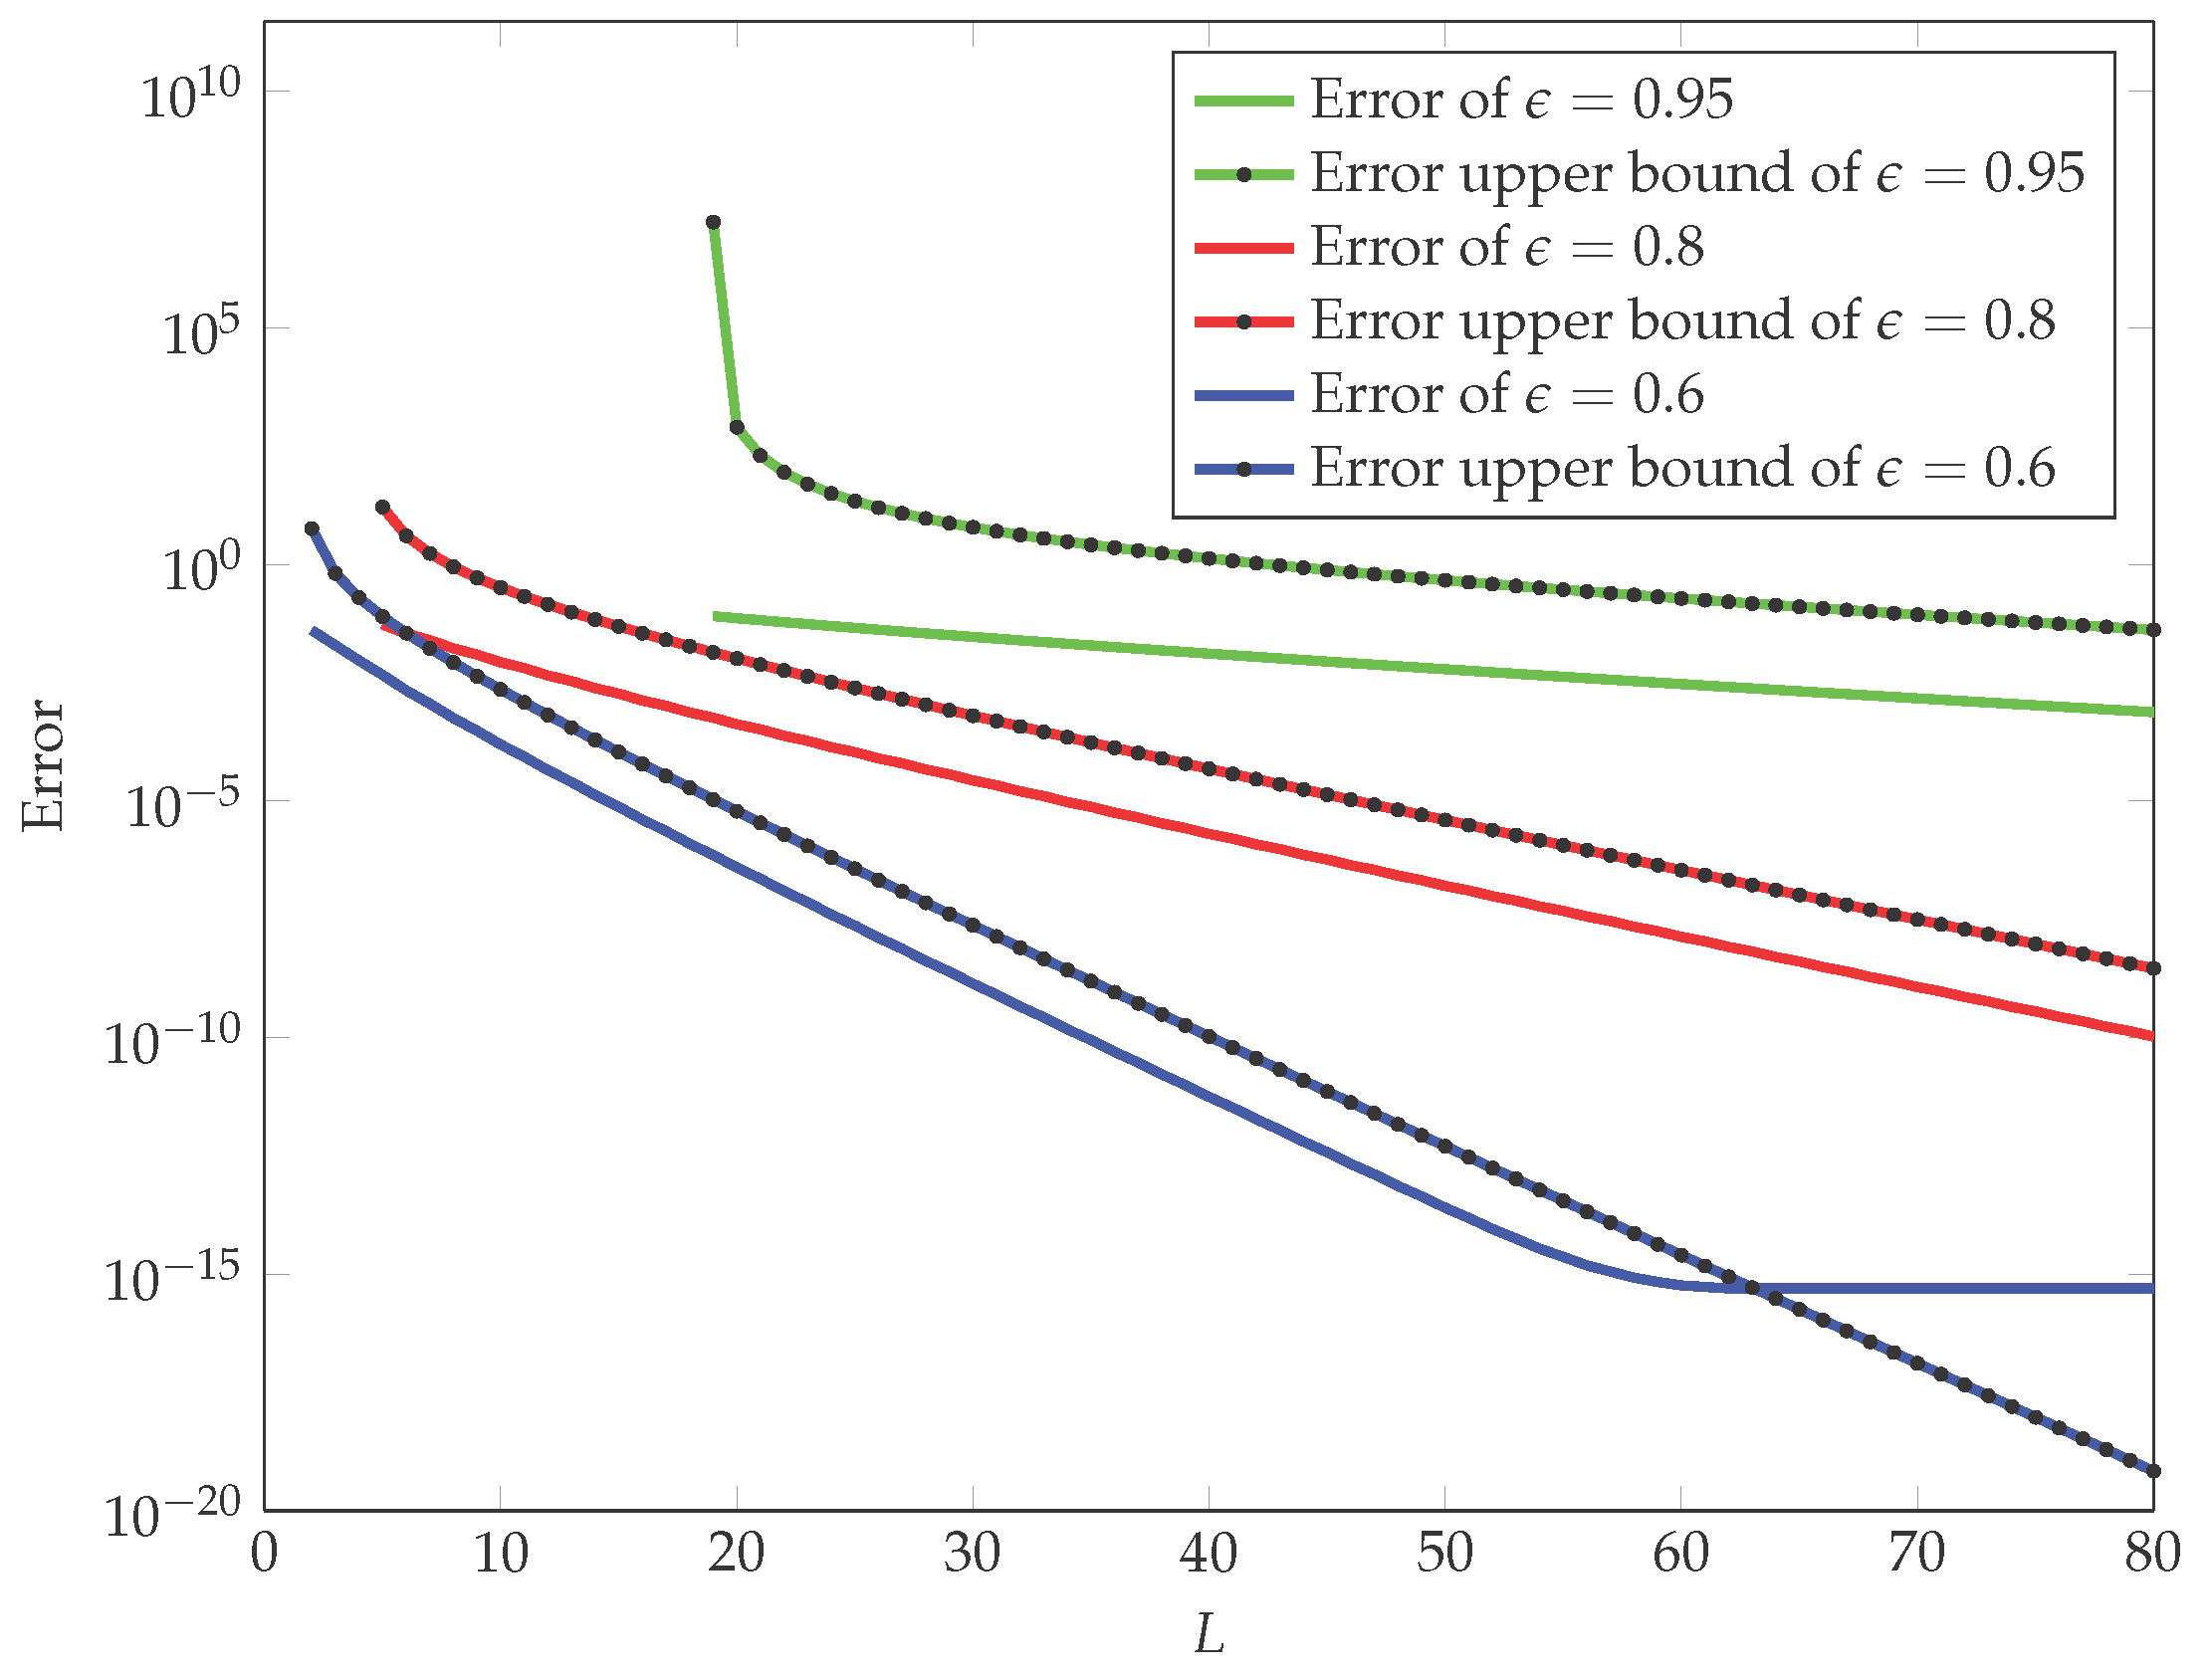
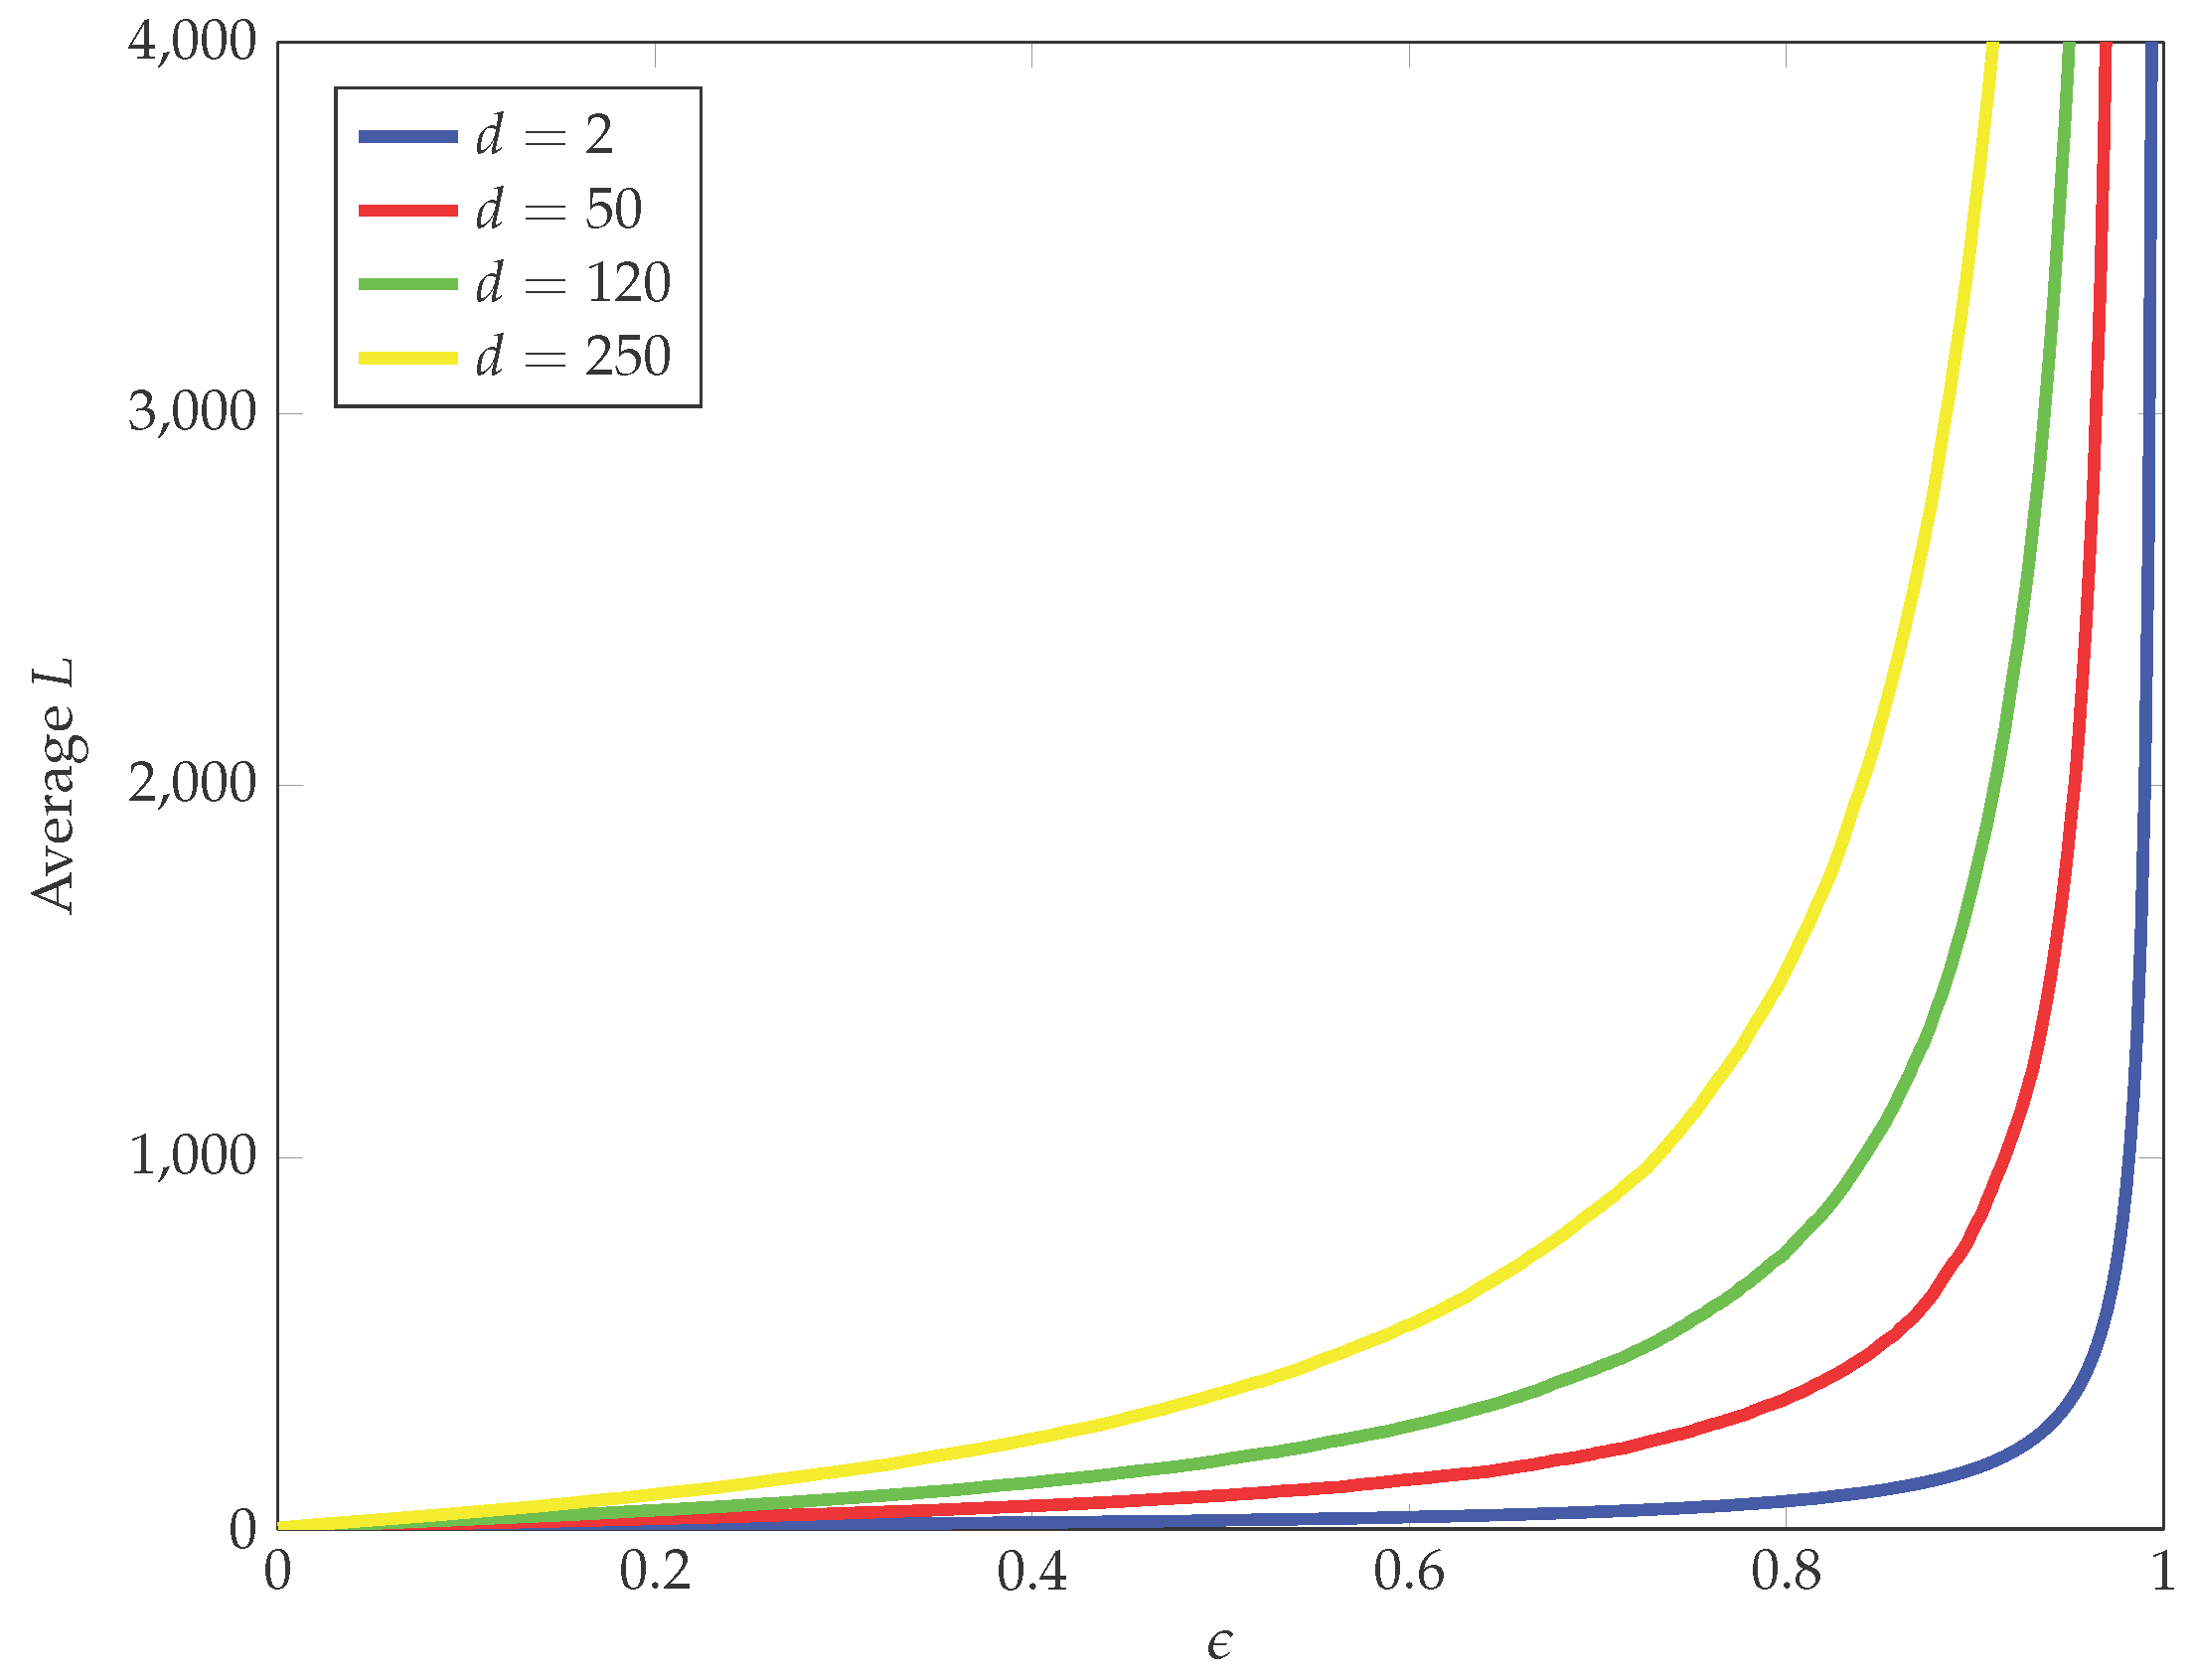
2.3. Series Method
3. KL-Divergence of Two Generalized Elliptical Distributions
3.1. Some Background on the Elliptical Distributions
3.2. KL-Divergence between ZEG Distributions
3.3. KL-Divergence between ACG Distributions
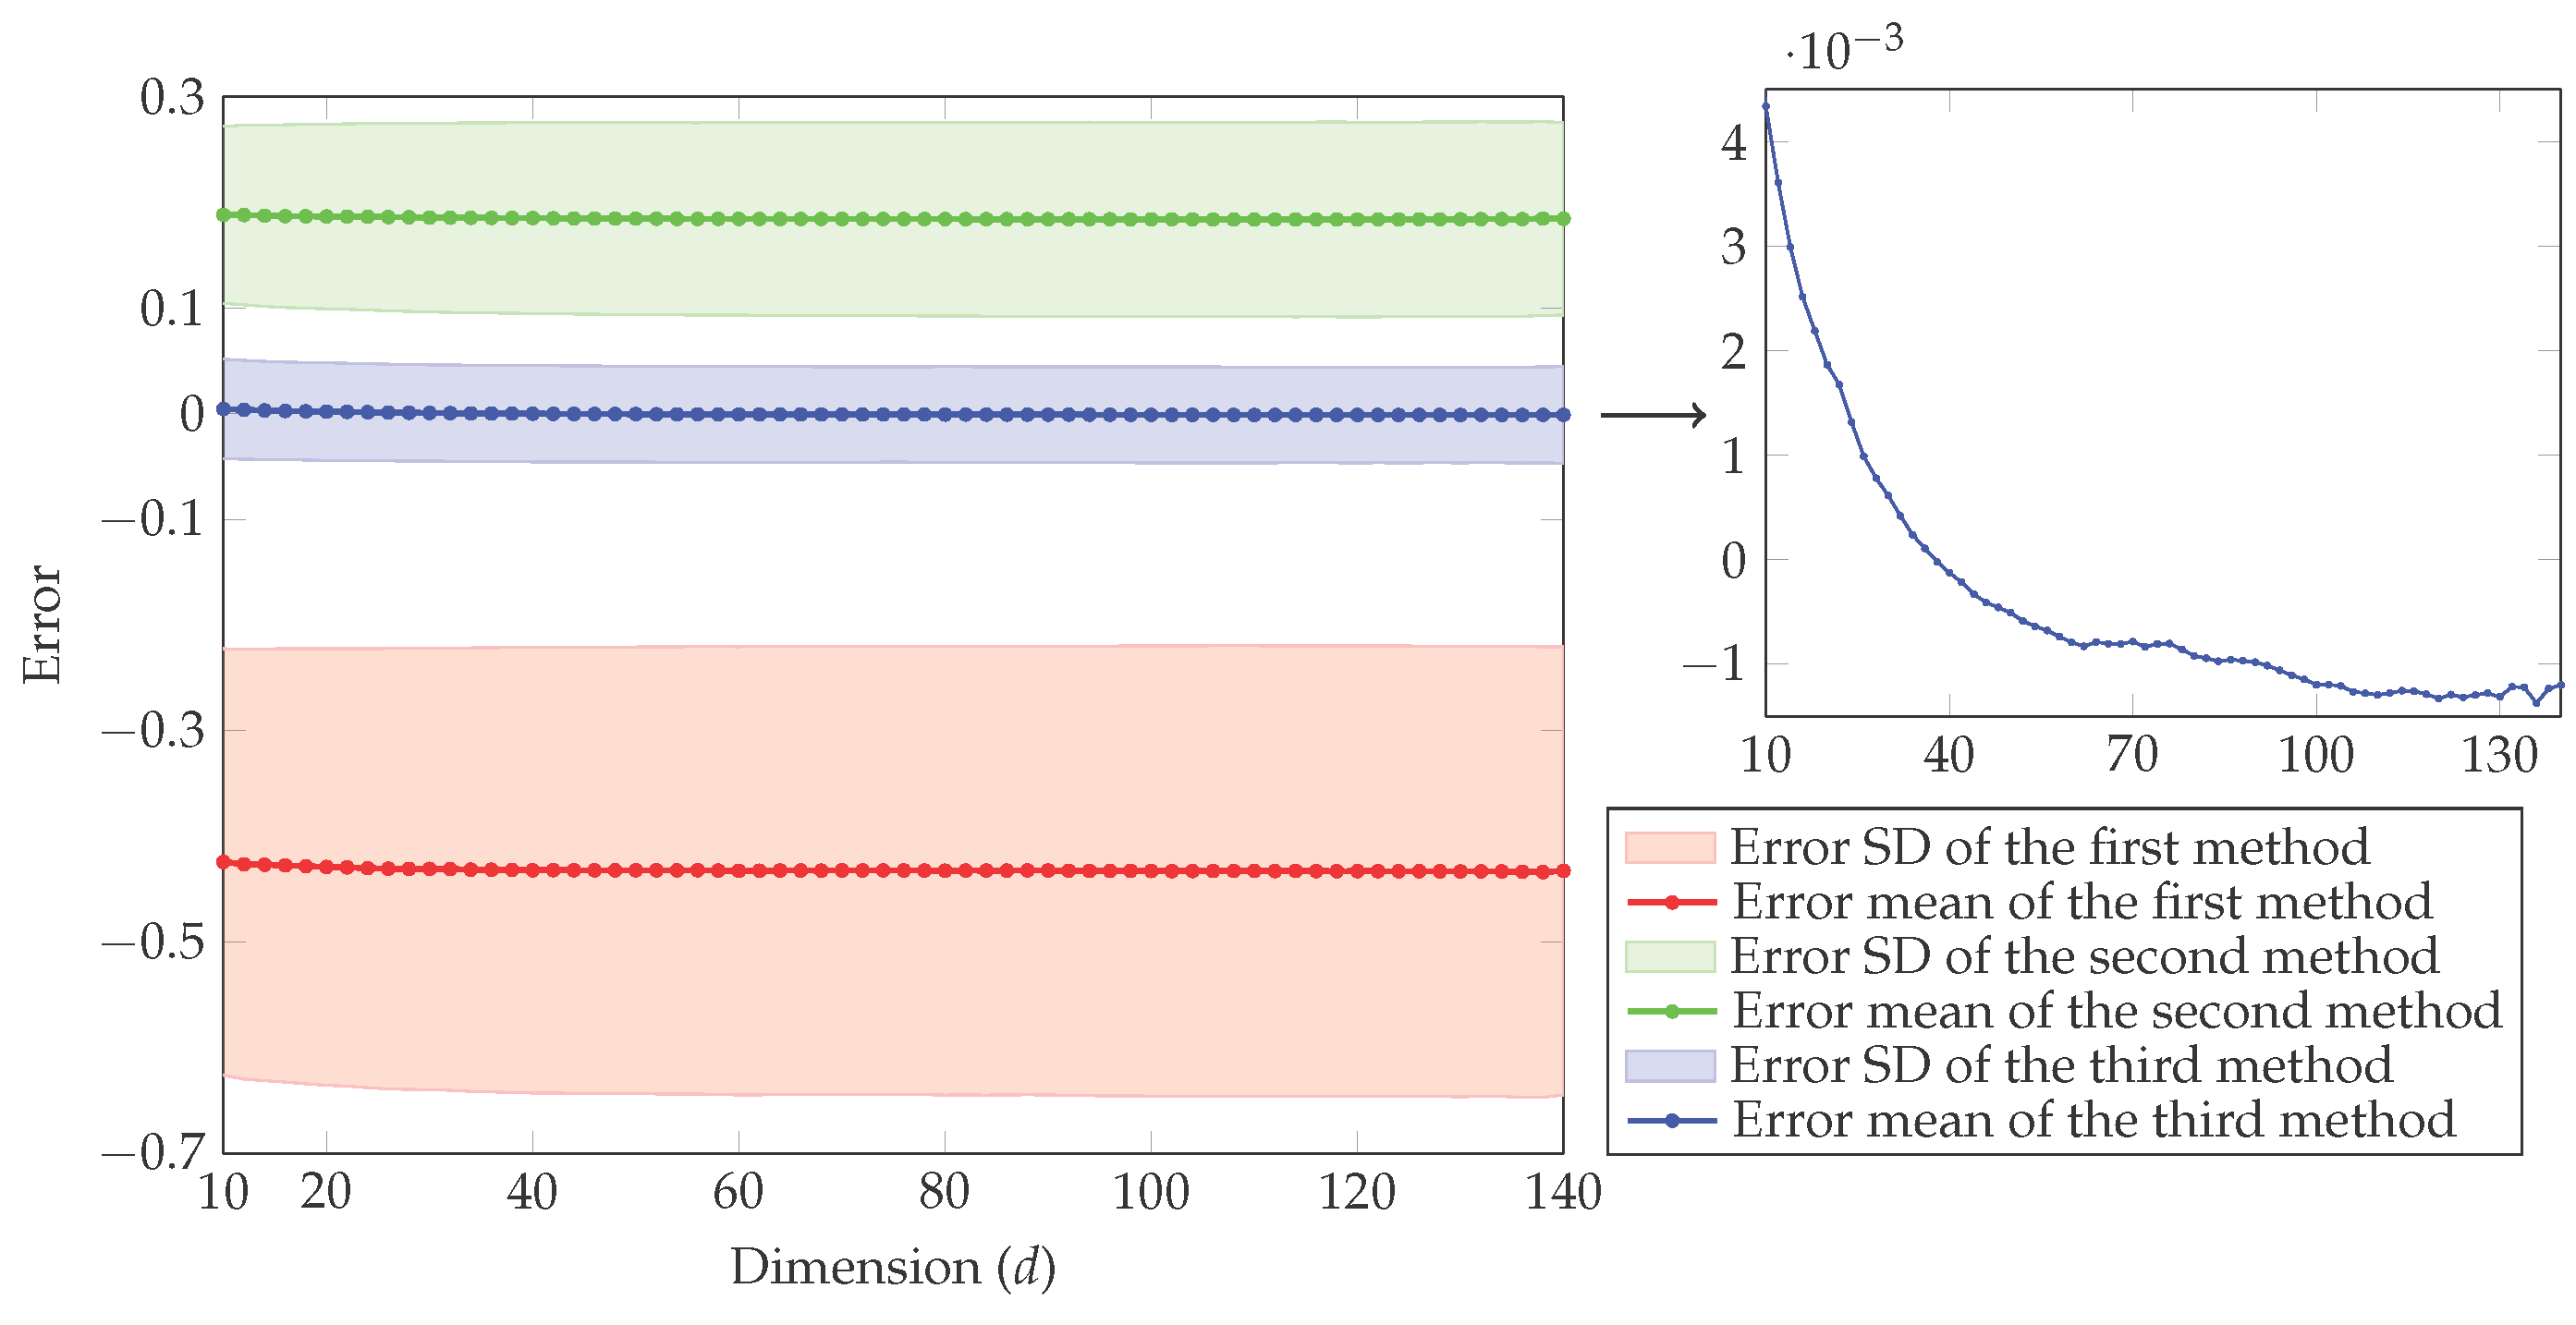
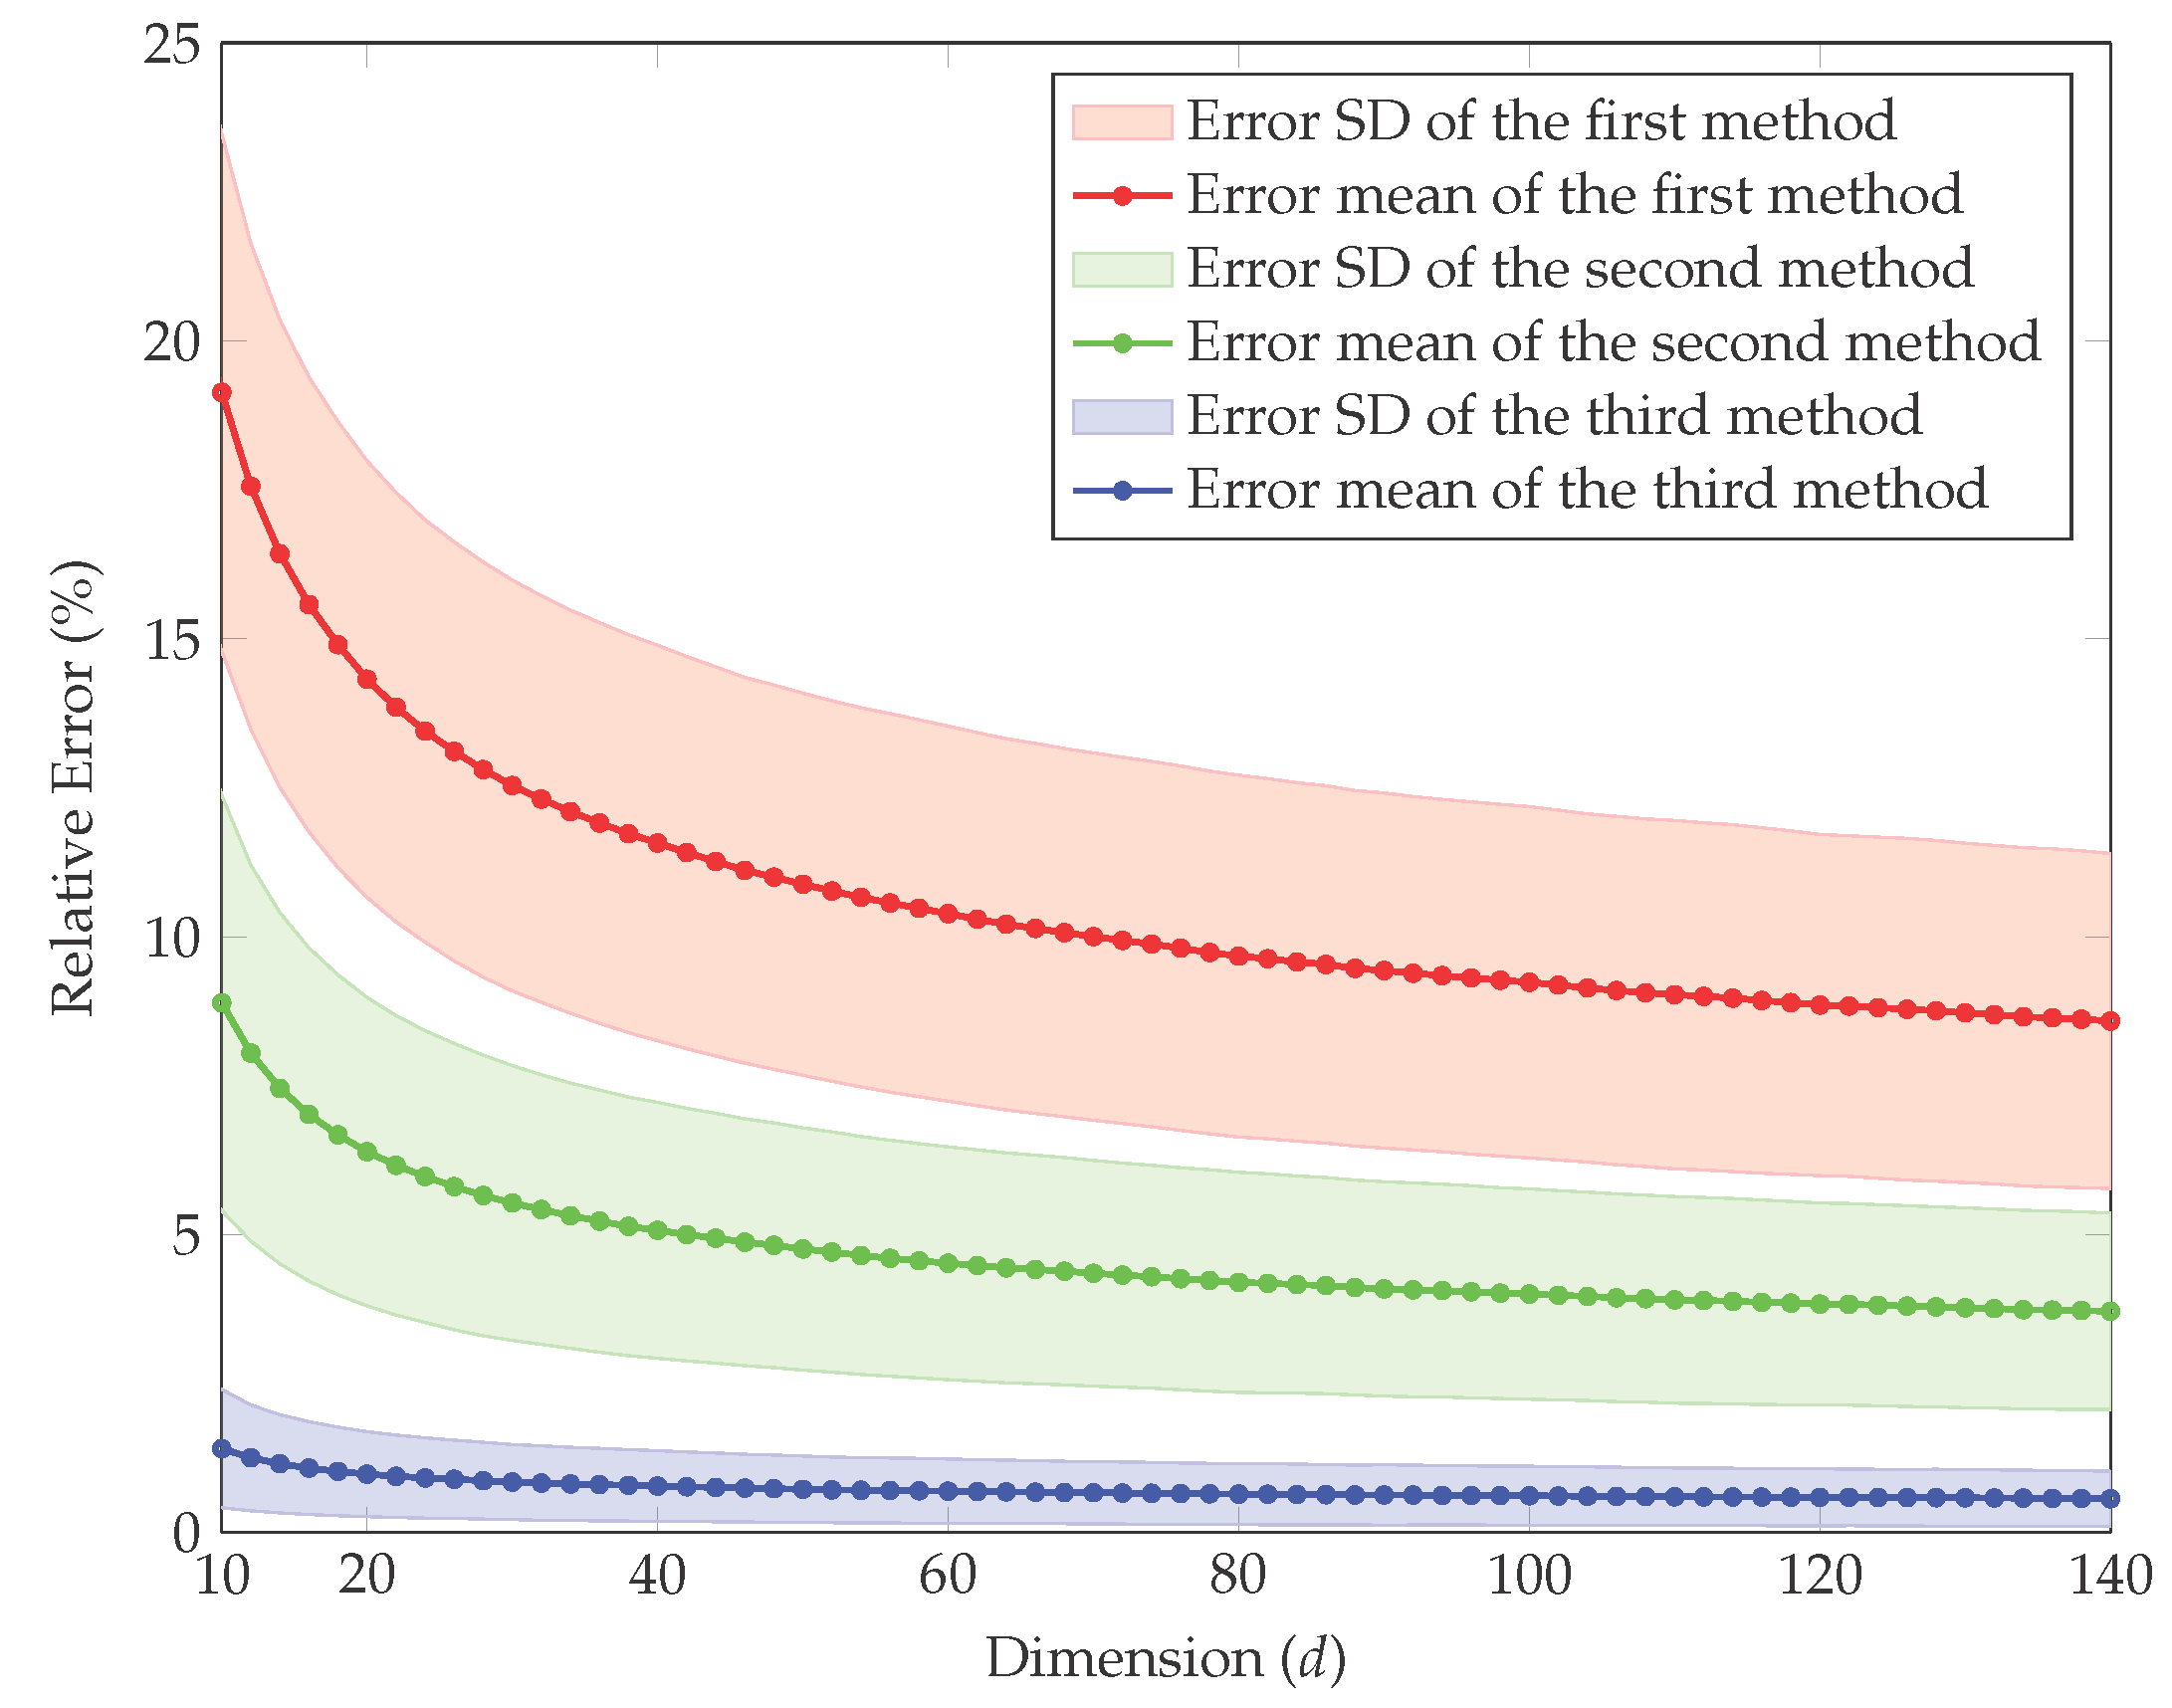
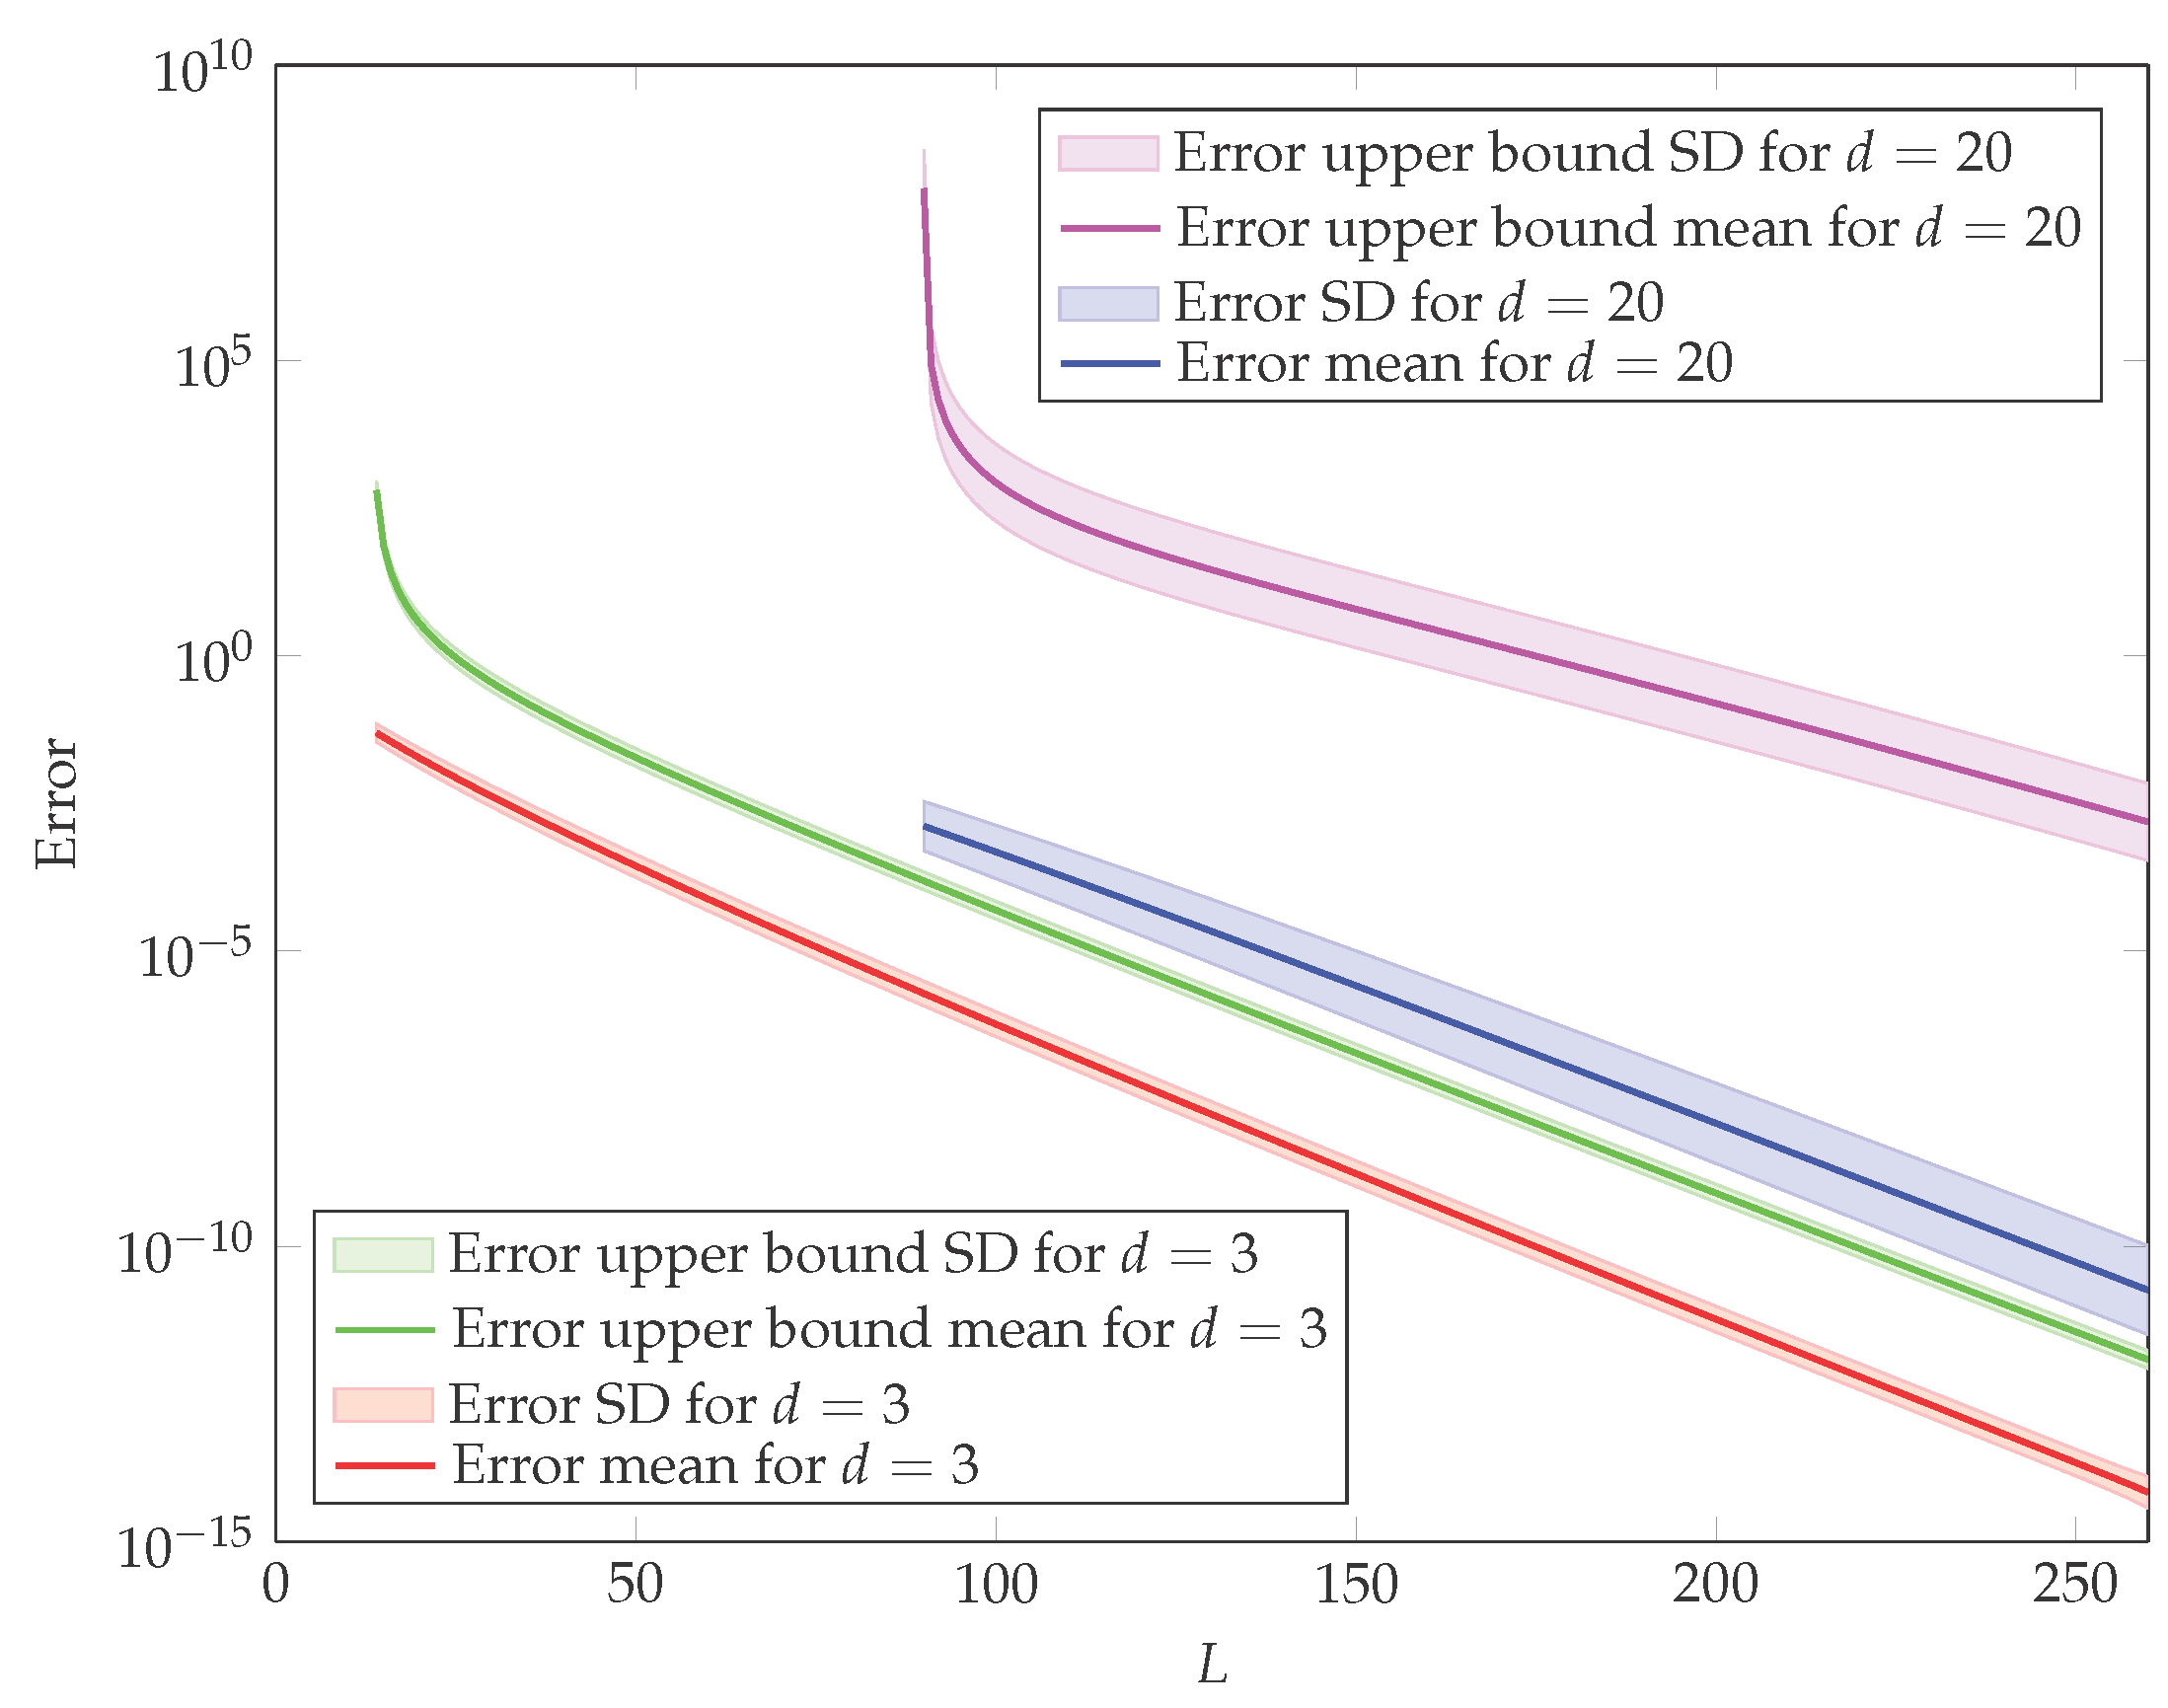
4. Simulation Study
5. Conclusions
Acknowledgments
Author Contributions
Conflicts of Interest
Appendix A. Proof of Lemma 2
Appendix B. Proof of Lemma 3
Appendix C. Proof of Theorem 2
Appendix D. Proof of Lemma 4
References
- Lapidoth, A.; Moser, S.M. Capacity bounds via duality with applications to multiple-antenna systems on flat-fading channels. IEEE Trans. Inf. Theory 2003, 49, 2426–2467. [Google Scholar] [CrossRef]
- Khodabin, M.; Ahmadabadi, A. Some properties of generalized gamma distribution. Math. Sci. 2010, 4, 9–28. [Google Scholar]
- Eccardt, T.M. The use of the logarithm of the variate in the calculation of differential entropy among certain related statistical distributions. 2007; arXiv:0705.4045. [Google Scholar]
- Nicolas, J.M. Introduction to second kind statistics: Application of log-moments and log-cumulants to SAR image law analysis. Trait. Signal 2002, 19, 139–167. [Google Scholar]
- Nicolas, J.M.; Tupin, F. Gamma mixture modeled with “second kind statistics”: Application to SAR image processing. In Proceedings of the IEEE International Geoscience and Remote Sensing Symposium, Toronto, ON, Canada, 24–28 June 2002; Volume 4, pp. 2489–2491.
- Teh, Y.W.; Newman, D.; Welling, M. A collapsed variational Bayesian inference algorithm for latent Dirichlet allocation. Adv. Neural Inf. Process. Syst. 2006, 19, 1353–1360. [Google Scholar]
- Bishop, C.M. Pattern Recognition and Machine Learning; Springer: Berlin/Heidelberg, Germany, 2006. [Google Scholar]
- Jean, W.H. The geometric mean and stochastic dominance. J. Financ. 1980, 35, 151–158. [Google Scholar] [CrossRef]
- Hakansson, N.H. Multi-period mean-variance analysis: Toward a general theory of portfolio choice. J. Financ. 1971, 26, 857–884. [Google Scholar] [CrossRef]
- Lo, Y.; Mendell, N.R.; Rubin, D.B. Testing the number of components in a normal mixture. Biometrika 2001, 88, 767–778. [Google Scholar] [CrossRef]
- Moore, D.S.; Spruill, M.C. Unified large-sample theory of general chi-squared statistics for tests of fit. Ann. Stat. 1975, 3, 599–616. [Google Scholar]
- Li, K.C. Sliced inverse regression for dimension reduction. J. Am. Stat. Assoc. 1991, 86, 316–327. [Google Scholar] [CrossRef]
- Ruben, H. Probability content of regions under spherical normal distributions, IV: The distribution of homogeneous and non-homogeneous quadratic functions of normal variables. Ann. Math. Stat. 1962, 33, 542–570. [Google Scholar] [CrossRef]
- Kotz, S.; Johnson, N.L.; Boyd, D.W. Series representations of distributions of quadratic forms in normal variables. I. Central case. Ann. Math. Stat. 1967, 38, 823–837. [Google Scholar] [CrossRef]
- Box, G.E. Some theorems on quadratic forms applied in the study of analysis of variance problems, I. Effect of inequality of variance in the one-way classification. Ann. Math. Stat. 1954, 25, 290–302. [Google Scholar] [CrossRef]
- Ha, H.T.; Provost, S.B. An accurate approximation to the distribution of a linear combination of non-central chi-square random variables. REVSTAT Stat. J. 2013, 11, 231–254. [Google Scholar]
- Kullback, S.; Leibler, R.A. On information and sufficiency. Ann. Math. Stat. 1951, 22, 79–86. [Google Scholar] [CrossRef]
- Shannon, C.E. A mathematical theory of communication. Bell Syst. Tech. J. 1948, 27, 379–423. [Google Scholar] [CrossRef]
- Basseville, M. Divergence measures for statistical data processing—An annotated bibliography. Signal Process. 2013, 93, 621–633. [Google Scholar] [CrossRef]
- Kanamori, T. Scale-invariant divergences for density functions. Entropy 2014, 16, 2611–2628. [Google Scholar] [CrossRef]
- Burnham, K.P.; Anderson, D.R. Model Selection and Multimodel Inference: A Practical Information-Theoretic Approach; Springer: New York, NY, USA, 2002. [Google Scholar]
- Pardo, L. Statistical Inference Based on Divergence Measures; CRC Press: London, UK, 2005. [Google Scholar]
- Blekas, K.; Lagaris, I.E. Split–Merge Incremental LEarning (SMILE) of mixture models. In Artificial Neural Networks–ICANN 2007; Springer: Berlin/Heidelberg, Germany, 2007; Volume 4669, pp. 291–300. [Google Scholar]
- Runnalls, A.R. Kullback–Leibler approach to Gaussian mixture reduction. IEEE Trans. Aerosp. Electron. Syst. 2007, 43, 989–999. [Google Scholar] [CrossRef]
- Dhillon, I.S.; Mallela, S.; Kumar, R. A divisive information theoretic feature clustering algorithm for text classification. J. Mach. Learning Res. 2003, 3, 1265–1287. [Google Scholar]
- Imseng, D.; Bourlard, H.; Garner, P.N. Using Kullback–Leibler divergence and multilingual information to improve ASR for under-resourced languages. In Proceedings of the IEEE International Conference on Acoustics, Speech and Signal Processing (ICASSP), Kyoto, Japan, 25–30 March 2012; pp. 4869–4872.
- Do, M.N.; Vetterli, M. Wavelet-based texture retrieval using generalized Gaussian density and Kullback–Leibler distance. IEEE Trans. Image Process. 2002, 11, 146–158. [Google Scholar] [CrossRef] [PubMed]
- Mathiassen, J.R.; Skavhaug, A.; Bø, K. Texture Similarity Measure Using Kullback–Leibler Divergence Between Gamma Distributions. In Computer Vision—ECCV 2002; Springer: Berlin/Heidelberg, Germany, 2002; Volume 2352, pp. 133–147. [Google Scholar]
- Koutras, M. On the generalized noncentral chi-squared distribution induced by an elliptical gamma law. Biometrika 1986, 73, 528–532. [Google Scholar] [CrossRef]
- Fang, K.T.; Zhang, Y.T. Generalized Multivariate Analysis; Springer: Berlin/Heidelberg, Germany, 1990. [Google Scholar]
- Hosseini, R.; Sra, S.; Theis, L.; Bethge, M. Inference and mixture modeling with the elliptical gamma distribution. Comput. Stat. Data Anal. 2016, 101, 29–43. [Google Scholar] [CrossRef]
- Watson, G.S. Statistics on Spheres; Wiley: New York, NY, USA, 1983. [Google Scholar]
- Kent, J.T. The complex Bingham distribution and shape analysis. J. R. Stat. Soc. Ser. B 1994, 56, 285–299. [Google Scholar] [CrossRef]
- Bethge, M.; Hosseini, R. Method and Device for Image Compression. U.S. Patent 8,750,603, 10 June 2014. [Google Scholar]
- Zhang, T. Robust subspace recovery by Tyler’s M-estimator. Inf. Inference 2015, 5. [Google Scholar] [CrossRef]
- Franke, J.; Redenbach, C.; Zhang, N. On a mixture model for directional data on the sphere. Scand. J. Stat. 2015, 43, 139–155. [Google Scholar] [CrossRef]
- Tyler, D.E. A distribution-free M-estimator of multivariate scatter. Ann. Stat. 1987, 15, 234–251. [Google Scholar] [CrossRef]
- Sra, S.; Hosseini, R.; Theis, L.; Bethge, M. Data modeling with the elliptical gamma distribution. In Proceedings of the Eighteenth International Conference on Artificial Intelligence and Statistics, San Diego, CA, USA, 9–12 May 2015; pp. 903–911.
- Davis, P.J.; Rabinowitz, P. Methods of Numerical Integration; Dover: New York, NY, USA, 2007. [Google Scholar]
- Benaroya, H.; Han, S.M.; Nagurka, M. Probability Models in Engineering and Science; CRC Press: Boca Raton, FL, USA, 2005; Volume 193. [Google Scholar]
- Satterthwaite, F.E. Synthesis of variance. Psychometrika 1941, 6, 309–316. [Google Scholar] [CrossRef]
- Yuan, K.H.; Bentler, P.M. Two simple approximations to the distributions of quadratic forms. Br. J. Math. Stat. Psychol. 2010, 63, 273–291. [Google Scholar] [CrossRef] [PubMed]
- Martin, B.M.; Jorswieck, E. Sampling uniformly from the set of positive definite matrices with trace constraint. IEEE Trans. Signal Process. 2012, 60, 2167–2179. [Google Scholar]
- Frahm, G.; Jaekel, U. Tyler’s M-estimator, random matrix theory, and generalized elliptical distributions with applications to finance. Available online: http://ssrn.com/abstract=1287683 (accessed on 26 July 2016).
- Fang, K.T.; Kotz, S.; Ng, K.W. Symmetric Multivariate and Related Distributions; Chapman and Hall: London, UK, 1990. [Google Scholar]
- Chen, B.; Zhu, Y.; Hu, J.; Principe, J.C. System Parameter Identification: Information Criteria And Algorithms; Newnes: Oxford, UK, 2013. [Google Scholar]
- Provost, S.B.; Cheong, Y. The probability content of cones in isotropic random fields. J. Multivar. Anal. 1998, 66, 237–254. [Google Scholar] [CrossRef]
- Johnson, N.L.; Kotz, S. Distributions in Statistics: Continuous Univariate Distributions; Houghton Mifflin: Boston, MA, USA, 1970; Volume 1. [Google Scholar]
- Polyanin, A.D.; Manzhirov, A.V. Handbook of Integral Equations; CRC Press: Boca Raton, FL, USA, 1998. [Google Scholar]
- Soloveychik, I.; Wiesel, A. Tyler’s estimator performance analysis. In Proceedings of the IEEE International Conference on Acoustics, Speech and Signal Processing (ICASSP), South Brisbane, Australia, 19–24 April 2015; pp. 5688–5692.
- Piessens, R.; de Doncker-Kapenga, E.; Überhuber, C.W. QUADPACK, A Subroutine Package for Automatic Integration; Springer: Berlin/Heidelberg, Germany, 1983. [Google Scholar]
- Shampine, L.F. Vectorized adaptive quadrature in Matlab. J. Comput. Appl. Math. 2008, 211, 131–140. [Google Scholar] [CrossRef]


© 2016 by the authors; licensee MDPI, Basel, Switzerland. This article is an open access article distributed under the terms and conditions of the Creative Commons Attribution (CC-BY) license (http://creativecommons.org/licenses/by/4.0/).
Share and Cite
Habib Zadeh, P.; Hosseini, R. Expected Logarithm of Central Quadratic Form and Its Use in KL-Divergence of Some Distributions. Entropy 2016, 18, 278. https://doi.org/10.3390/e18080278
Habib Zadeh P, Hosseini R. Expected Logarithm of Central Quadratic Form and Its Use in KL-Divergence of Some Distributions. Entropy. 2016; 18(8):278. https://doi.org/10.3390/e18080278
Chicago/Turabian StyleHabib Zadeh, Pourya, and Reshad Hosseini. 2016. "Expected Logarithm of Central Quadratic Form and Its Use in KL-Divergence of Some Distributions" Entropy 18, no. 8: 278. https://doi.org/10.3390/e18080278
APA StyleHabib Zadeh, P., & Hosseini, R. (2016). Expected Logarithm of Central Quadratic Form and Its Use in KL-Divergence of Some Distributions. Entropy, 18(8), 278. https://doi.org/10.3390/e18080278