Article

Predicting China’s SME Credit Risk in Supply Chain Finance Based on Machine Learning Methods

1
College of Business Administration, Hunan University, Changsha 410082, China
2
Center of Finance and Investment Management, Hunan University, Changsha 410082, China
*
Author to whom correspondence should be addressed.
Entropy 2016, 18(5), 195; https://doi.org/10.3390/e18050195
Submission received: 18 April 2016 / Revised: 13 May 2016 / Accepted: 16 May 2016 / Published: 19 May 2016
(This article belongs to the Section Complexity)

Abstract

:
We propose a new integrated ensemble machine learning (ML) method, i.e., RS-RAB (Random Subspace-Real AdaBoost), for predicting the credit risk of China’s small and medium-sized enterprise (SME) in supply chain finance (SCF). The sample of empirical analysis is comprised of two data sets on a quarterly basis during the period of 2012–2013: one includes 48 listed SMEs obtained from the SME Board of Shenzhen Stock Exchange; the other one consists of three listed core enterprises (CEs) and six listed CEs that are respectively collected from the Main Board of Shenzhen Stock Exchange and Shanghai Stock Exchange. The experimental results show that RS-RAB possesses an outstanding prediction performance and is very suitable for forecasting the credit risk of China’s SME in SCF by comparison with the other three ML methods.

1. Introduction

Recently, financing becomes the bottleneck which impedes the growth of China’s small and medium-sized enterprise (SME). As an emerging financing channel of replacing low-level credit availability, supply chain financing (SCF) arouses general attentions of SME and its relevant core enterprise (CE) and financial institution (FI). SCF manages the cash flow of transaction activities and processes in the supply chain for increasing turnover efficiency of working capital [1]. Although SCF can more effectively avoid credit risks for all members in the supply chain than the traditional financing channel, it is incapable of entirely eliminating credit risk which still is a major threat to the members of supply chain [2,3,4]. Moreover, SCF potentially causes extra credit risk especially for CE because SME and CE take joint responsibility for credit risk in SCF.
Many quantitative methods are proposed to predict corporate credit risk, which are important for financial institutions to make a correct credit loan decision. Without doubt an effective prediction method is also significant for SCF because it provides support for sustainable development of supply chain members (e.g., FI, SME and CE). Traditional methods of credit risk prediction include classical regression analysis methods (e.g., logistic regression method [5]) and machine learning (ML) methods (originated from artificial intelligence, e.g., decision tree (DT) method [6]). The current research focuses on the ensemble ML method which achieves high credit risk prediction accuracy and is an efficient strategy [7,8,9,10,11]. Following this direction, Wang and Ma [12] propose a new integrated ensemble ML method (i.e., RS-Boosting) by integrating two kinds of ordinary ensemble ML methods, i.e., Boosting and Random Subspace (RS). They prove that the strategy of integrating the common ensemble ML method is advantageous to obtain better prediction performance than individual ensemble ML [12]. Inspired by this strategy, in this paper we propose a new integrated ensemble ML method, RS-RAB, which is integrated by the two common ensemble ML methods, i.e., RS and Real AdaBoost (RAB). Moreover, we employ DT as the base classifier of RS-RAB and aim to study the ability of four ML methods for predicting China’s SME credit risk in SCF. For this purpose we first analyze the sources, fundamental features and algorithms of these methods, especially RS-RAB method. Second, we prepare the data and construct the prediction models of DT, RS, RAB and RS-RAB, respectively. Then, we apply several experimental performance indicators for measuring prediction ability of four ML methods. Finally, we select the best one from these methods by experimental analysis.
The remainder of the paper is organized as follows. In the next section, we analyze the methodology and prepare the data. In Section 3, we show the empirical procedure, results and some relevant discussions. Finally, we draw the conclusions in Section 4.

2. Methodology and Data

2.1. Methodology Research
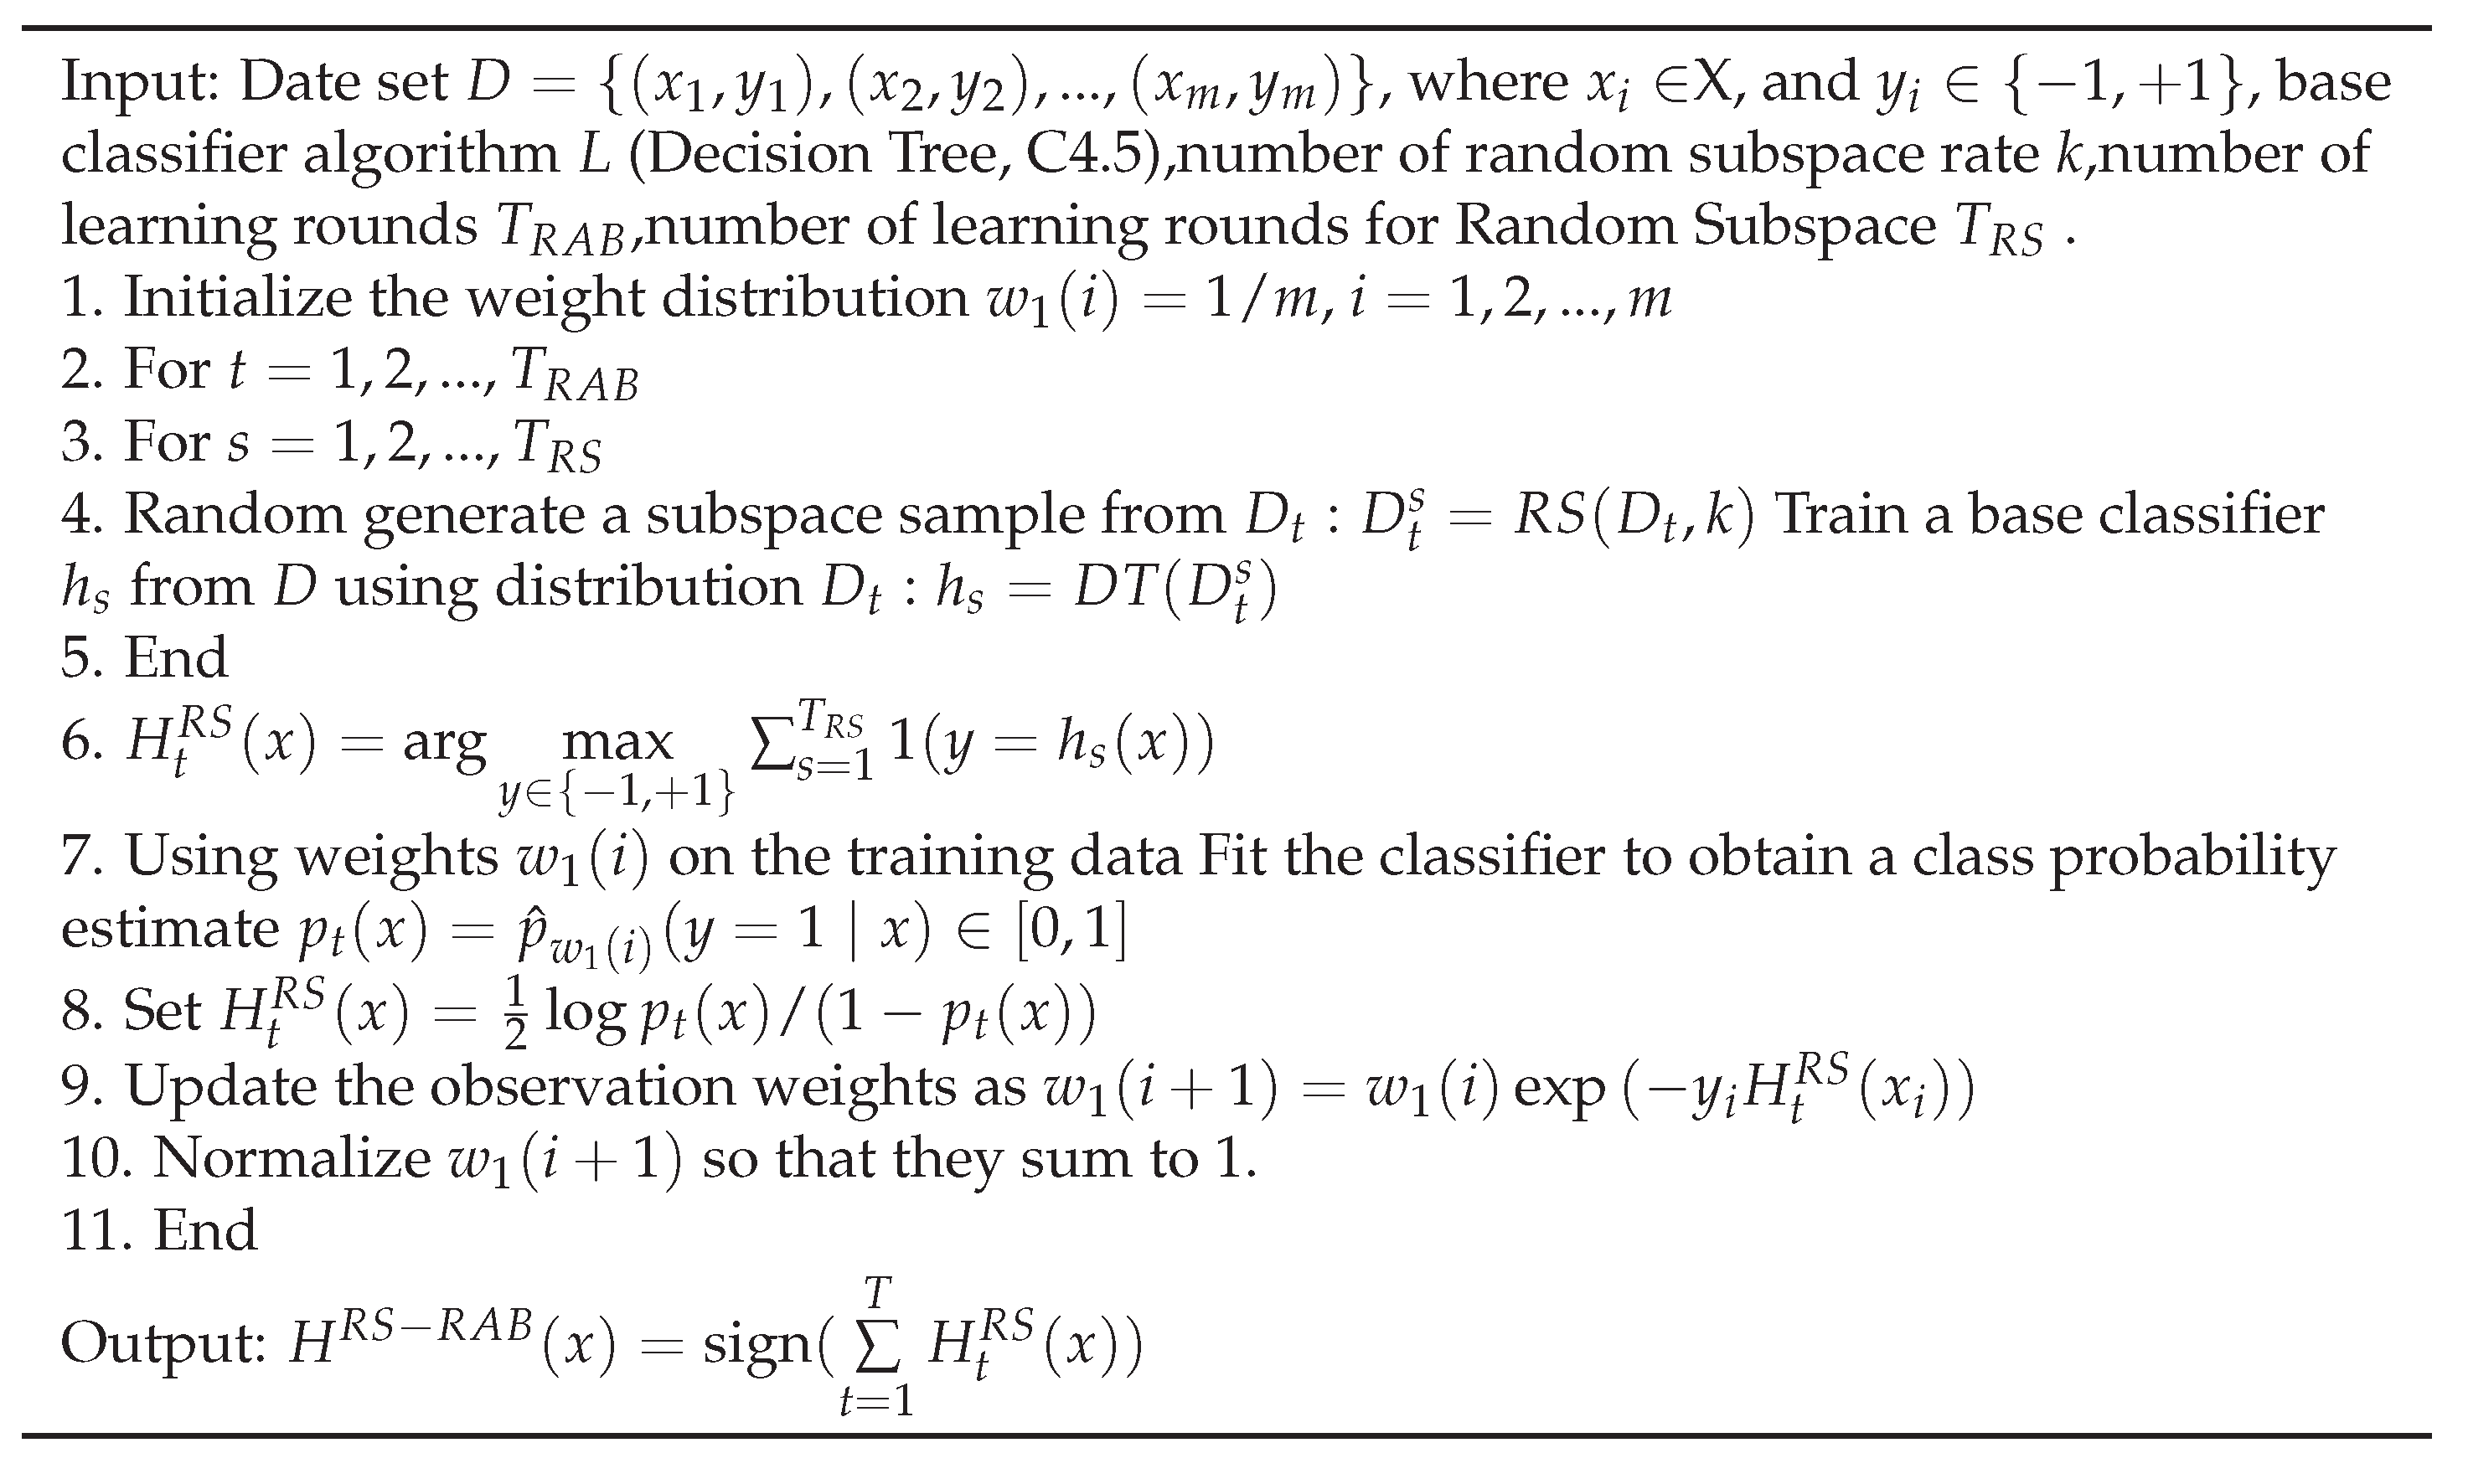
Ho [13] proposes RS method to achieve maximum accuracy and avoid over fitting when training data by DT. RS method basically has three superiorities compared with the DT method as follows: first, it adopts a pseudorandom procedure to choose the essential factors of a proper vector, in contrast, DT method is generated by applying only the selected diagnostic components; second, it is propitious to parallel implementation for fast learning, which is more satisfactory in practical application than DT method; third, RS is not in danger of being trapped in local optima [13]. We illustrate the pseudo code of RS method according to Wang and Ma [12] and Ho [13] as following:
(1)
Input: the data set is D = { ( x 1 , y 1 ) , ( x 2 , y 2 ) , . . . , ( x m , y m ) } , the base classifier algorithm is L , the number of random subspace rate is k , the number of learning rounds is T;
(2)
For t = 1 , 2 , . . . , T ;
(3)
Random generate a subspace sample from D t = R S ( D , k ) ;
(4)
Train a base classifier h t from the subspace sample;
(5)
end;
(6)
Output: H ( X ) = arg max y Y t = 1 T 1 ( y = h t ( x ) ) ; 1 ( α ) = 1 if α is ture , 1 ( α ) = 0 otherwise .
The full name of AdaBoost is “Adaptive Boosting”, an improved version of Boosting. Freund and Schapire [14] prove that the AdaBoost method has some features which make it more applied and simpler to actualize than the old version such as Boosting. Friedman et al. [15] present a generalized version of AdaBoost, i.e., RAB, which is used to boost the weak classifiers and construct a nesting-structured face detector. Properly speaking, we apply the RAB instead of classical AdaBoost in this paper for three reasons: (1) it can be motivated as iterative algorithms for optimizing the exponential criterion [15]; (2) the output of each weak classifier of the classical AdaBoost is restricted range [−1, +1], while the output of RAB’s each weak classifier is a real-value. In other words, RAB can more accurately classifies sample data than AdaBoost, which effectively improves the classification ability of classifier [16]; (3) it is effective at reducing the errors of training, and also is propitious to the test error rate, especially for an interrelated small number of rounds [17]. The pseudo code of RAB according to Friedman et al. [15] is shown as following:
(1)
The data set is D = { ( x 1 , y 1 ) , ( x 2 , y 2 ) , . . . , ( x N , y N ) } , x i is the feature vector with m length; y i { 1 , - 1 } is the category label of x i ;
(2)
Initial distribution of training set sample: D 1 ( i ) = 1 / N ;
(3)
The quantification of weak classifier is T, t = 1 , . . . , T :
a. The disjoint subspace is X 1 , . . . X n ,
b. Obtain a class probability estimate W l j = P ( x i X j , y i = l ) = D t ( i ) , l { 1 , - 1 } ,
c. Obtain the outputs of each weak classifier, x X j , h ( x ) = 1 2 ln ( W 1 j + ε W - 1 j + ε ) ,
d. Re-normalize the sample distribution: D t + 1 ( i ) = D t ( i ) exp [ - y i h t ( x i ) ] ;
(4)
Output the classifier sign [ t = 1 T h t ( x ) ] .
The diversity and accuracy of an integrated ensemble ML are normally much higher than those of an individual ensemble ML, which makes integrated ensemble ML methods are drawn much attention [12]. Based on RS and RAB, we propose a new integrated ensemble ML method, i.e., RS-RAB, to forecast credit risk of China’s SME in SCF. RS belongs to the attribute partitioning method while RAB belongs to the instance partitioning method. By combining the above two partitioning methods, the diversity of RS-RAB is promoted by two different ensemble strategies. Therefore, the application of RS-RAB is more advantageous to our work of getting accurate prediction than that of RS and RAB individually. The pseudo code of RS-RAB is shown in Figure 1.
Moreover, in experiments, we employ C4.5 as the base learning algorithm of RS-RA methods according to Wang and Ma [12], Maclin and Opotz [18], Fu et al. [19] and Zhu et al. [20]. C4.5 is a kind of DT algorithm which is proposed by Quinlan [21], the pseudo code of C4.5 is shown as following:
(1)
Input: the dataset is E, the attribute-valued is F;
(2)
D = ( E , F ) , T r e e G r w o t h ( D ) = T r e e G r w o t h ( E , F ) ;
(3)
if s t o p p i n g _ c o n d ( D ) is “true” then l e a f = c r e a t e N o d e ( ) , l e a f . l a b e l = C l a s s i f y ( E ) , return leaf;
(4)
else, r o o t = c r e a t e N o t e ( ) , r o o t . t e s t _ c o n d = f i n d _ b e s t _ s p l i t ( D ) ;
(5)
Order V b e s t as the best attribute according to above computed criteria, for each v V do;
(6)
E v = { e | r o o t . t e s t _ c o n d ( e ) = v } , and e E ;
(7)
T r e e G r o w t h ( E v , F ) = C 4 . 5 ( D v ) create v b e s t as the decision node of r o o t ;
(8)
Attach T r e e G r o w t h ( E v , F ) to the corresponding branch of r o o t v b e s t as v;
(9)
end for;
(10)
end if;
(11)
Return r o o t .

2.2. Data Preparation

As a new financing mode, only a few China’s SMEs cooperate with CEs and FIs in making use of the SCF, thus it is difficult to obtain complete data sample of SCF by means of literature, interview and survey. The data of our experiment are mainly gathered from the CSMAR (China Stock Market & Accounting Research) solution database [22]. In order to assess the representation of DT, RS, RAB and RS-RAB, we select the quarterly data of 48 listed SMEs and nine listed CEs, which are respectively from Small and Medium Enterprise Board of Shenzhen Stock Exchange, Shanghai Stock Exchange and Shenzhen Stock Exchange from 31 March 2012 to 31 December 2013 [20].
Significantly, these SMEs and CEs have real trading relationships with each other. Based on this fact, we assume that the SMEs collaborate with CEs and FIs in SCF. We delete the data points of unavailable entries when constructing SME credit risk prediction models, and 377 valid data are persisted [20]. The CEs have enough financial capabilities and solid credit worthiness. Comparatively speaking, the listed SMEs are divided into 12 risky firms and 36 non-risky firms in terms of whether the company is *ST (star special treatment) listed SME or not. In this paper, the *ST listed SME represent the star special treatment listed companies in the SME Board of Shenzhen Stock Exchange. The *ST listed SME is facing the delisting risk because it suffers operating losses for two consecutive years. In this study, following Xiong et al. [23], we present the benchmark for evaluating the credit risk of China’s SME in SCF by 18 indexes, which also act as the independent variables of four ML models (see Table 1) [20,24]. As shown in Table 1 the 18 independent variables are grouped into five categories: liquidity, leverage, profitability, activity and non-finance. The dependent variable is the credit risk status of listed SMEs: risky or non-risky. The dependent variable is assigned 0 when the quarterly data sample of SME releases a risky signal (i.e., a negative signal). In contrast, the dependent variable is assigned 1 when the quarterly data sample of SME releases a non-risky signal (i.e., a positive signal).

3. Empirical Study

3.1. Empirical Procedure

In this study, we use the data mining toolkit “Waikato Environment for Knowledge Analysis (WEKA)” version 3.6.13 for performing the experiment. We compare the RS-RAB with other three common ML methods (i.e., DT, RS and RAB) in aspect of predicting China’s credit risk of SME in SCF. For implementation of DT, we employ J48 module that is WEKA’s own version of C4.5. Meanwhile, the DT is employed as the base classifier of RS-RAB. For the implementation of ensemble ML, i.e., RS and RAB, we choose Random Subspace module and RealAdaBoost module that are from “WEKA Package Manager”. For the implementation of RS-RAB, we use the “Data Mining Processes” in “WEKA Knowledge-Flow Environment” which deals data as the following steps: (1) read a data source that is in attribute relation file format by “Arff Loader" flow; (2) choose a class of data as the categorical attribute (i.e., dependent variable) by “Class-Assigner” flow; (3) split an incoming data set into cross validation 10 folds by “Cross Validation Fold Maker Customizer” flow; (4) test and train the set by a “Classifier Meta” flow which is integrated by RS and RAB, and its base classifier is DT; (5) evaluate the performance of trained classifier (i.e., RS-RAB) by “Classifier Performance Evaluator” flow; and (6) display the evaluation result of classifier by “Text Viewer" flow. Moreover, according to Wang and Ma [12], five values of random subspace rates (i.e., 0.5, 0.6, 0.7, 0.8 and 0.9) for RS and RS-RAB are tested, respectively.
In order to average measures of prediction error and minimize the influence of the variability of the training set, we use the “Cross Validation Fold Maker Customizer” and choose the “10 folds” in our experiment. Initially, we randomly split the data into ten sets g 1 , g 2 , . . . , g 10 , so that all sets’ size and distribution are equal. Then, we test on g 1 and train on g 2 , g 3 , . . . , g 10 , followed by testing on g 2 and training on g 1 , g 3 , . . . , g 10 . That is to say, one of the ten sets is used as the testing set and the rest of nine sets are used as the training sets. Repeat this process until each set is once served as the testing set. Finally, we gain the mean value of these 10 test sets’ results as the ultimate prediction results of model.

3.2. Experimental Performance Measure

The experimental performance indicators are adopted in establishing standard measures of predicting credit risk of China’s SME in SCF. The indicators include “average accuracy”, “Type I error”, “Type II error” and “F-Measure”, which are respectively defined as
Averagy accuracy = TP + TN TP + FP + FN + TN ,
Type I error = FN TP + FN ,
Type II error = FP TN + FP ,
F - Measure = 2 1 r + 1 p ,
where FN, TP, FP, and TN represent the “false negative”, “true positive”, “false positive” and “true negative” respectively; “negative” denotes “risky” and “positive” denotes “non-risky”; p and r denote “precision rate” and “recall rate” respectively; “precision rate” is defined as p = TP/(TP + FP) and “recall rate” is defined as r = TP/(TP + FN).
It is easy to understand that a high value of “average accuracy” or lower value of “Type I and II errors” signifies that the ML method has an outstanding performance of prediction. The F-Measure is the arithmetical average of p and r, which is also named as F 1 rate [25]. The p means the ratio of the numbers of correct “real positive” case to the numbers of “predicted positive” case, which is also named “positive predictive” value, while the r means the ratio of the numbers of correct “predicted positive” case to the numbers of “real positive” case, which is also known as “sensitivity” [25]. The higher “precision rate” is, the lower “false positive rate” ML method obtain. Meanwhile, the higher the “recall rate” is, the higher the “true positive rate” of ML method is. As shown in Equation (4), there is a positive correlation between the value of F 1 and the value of p ( r ) . Instead, the higher value of F 1 is, the better the prediction performance of classifier is.

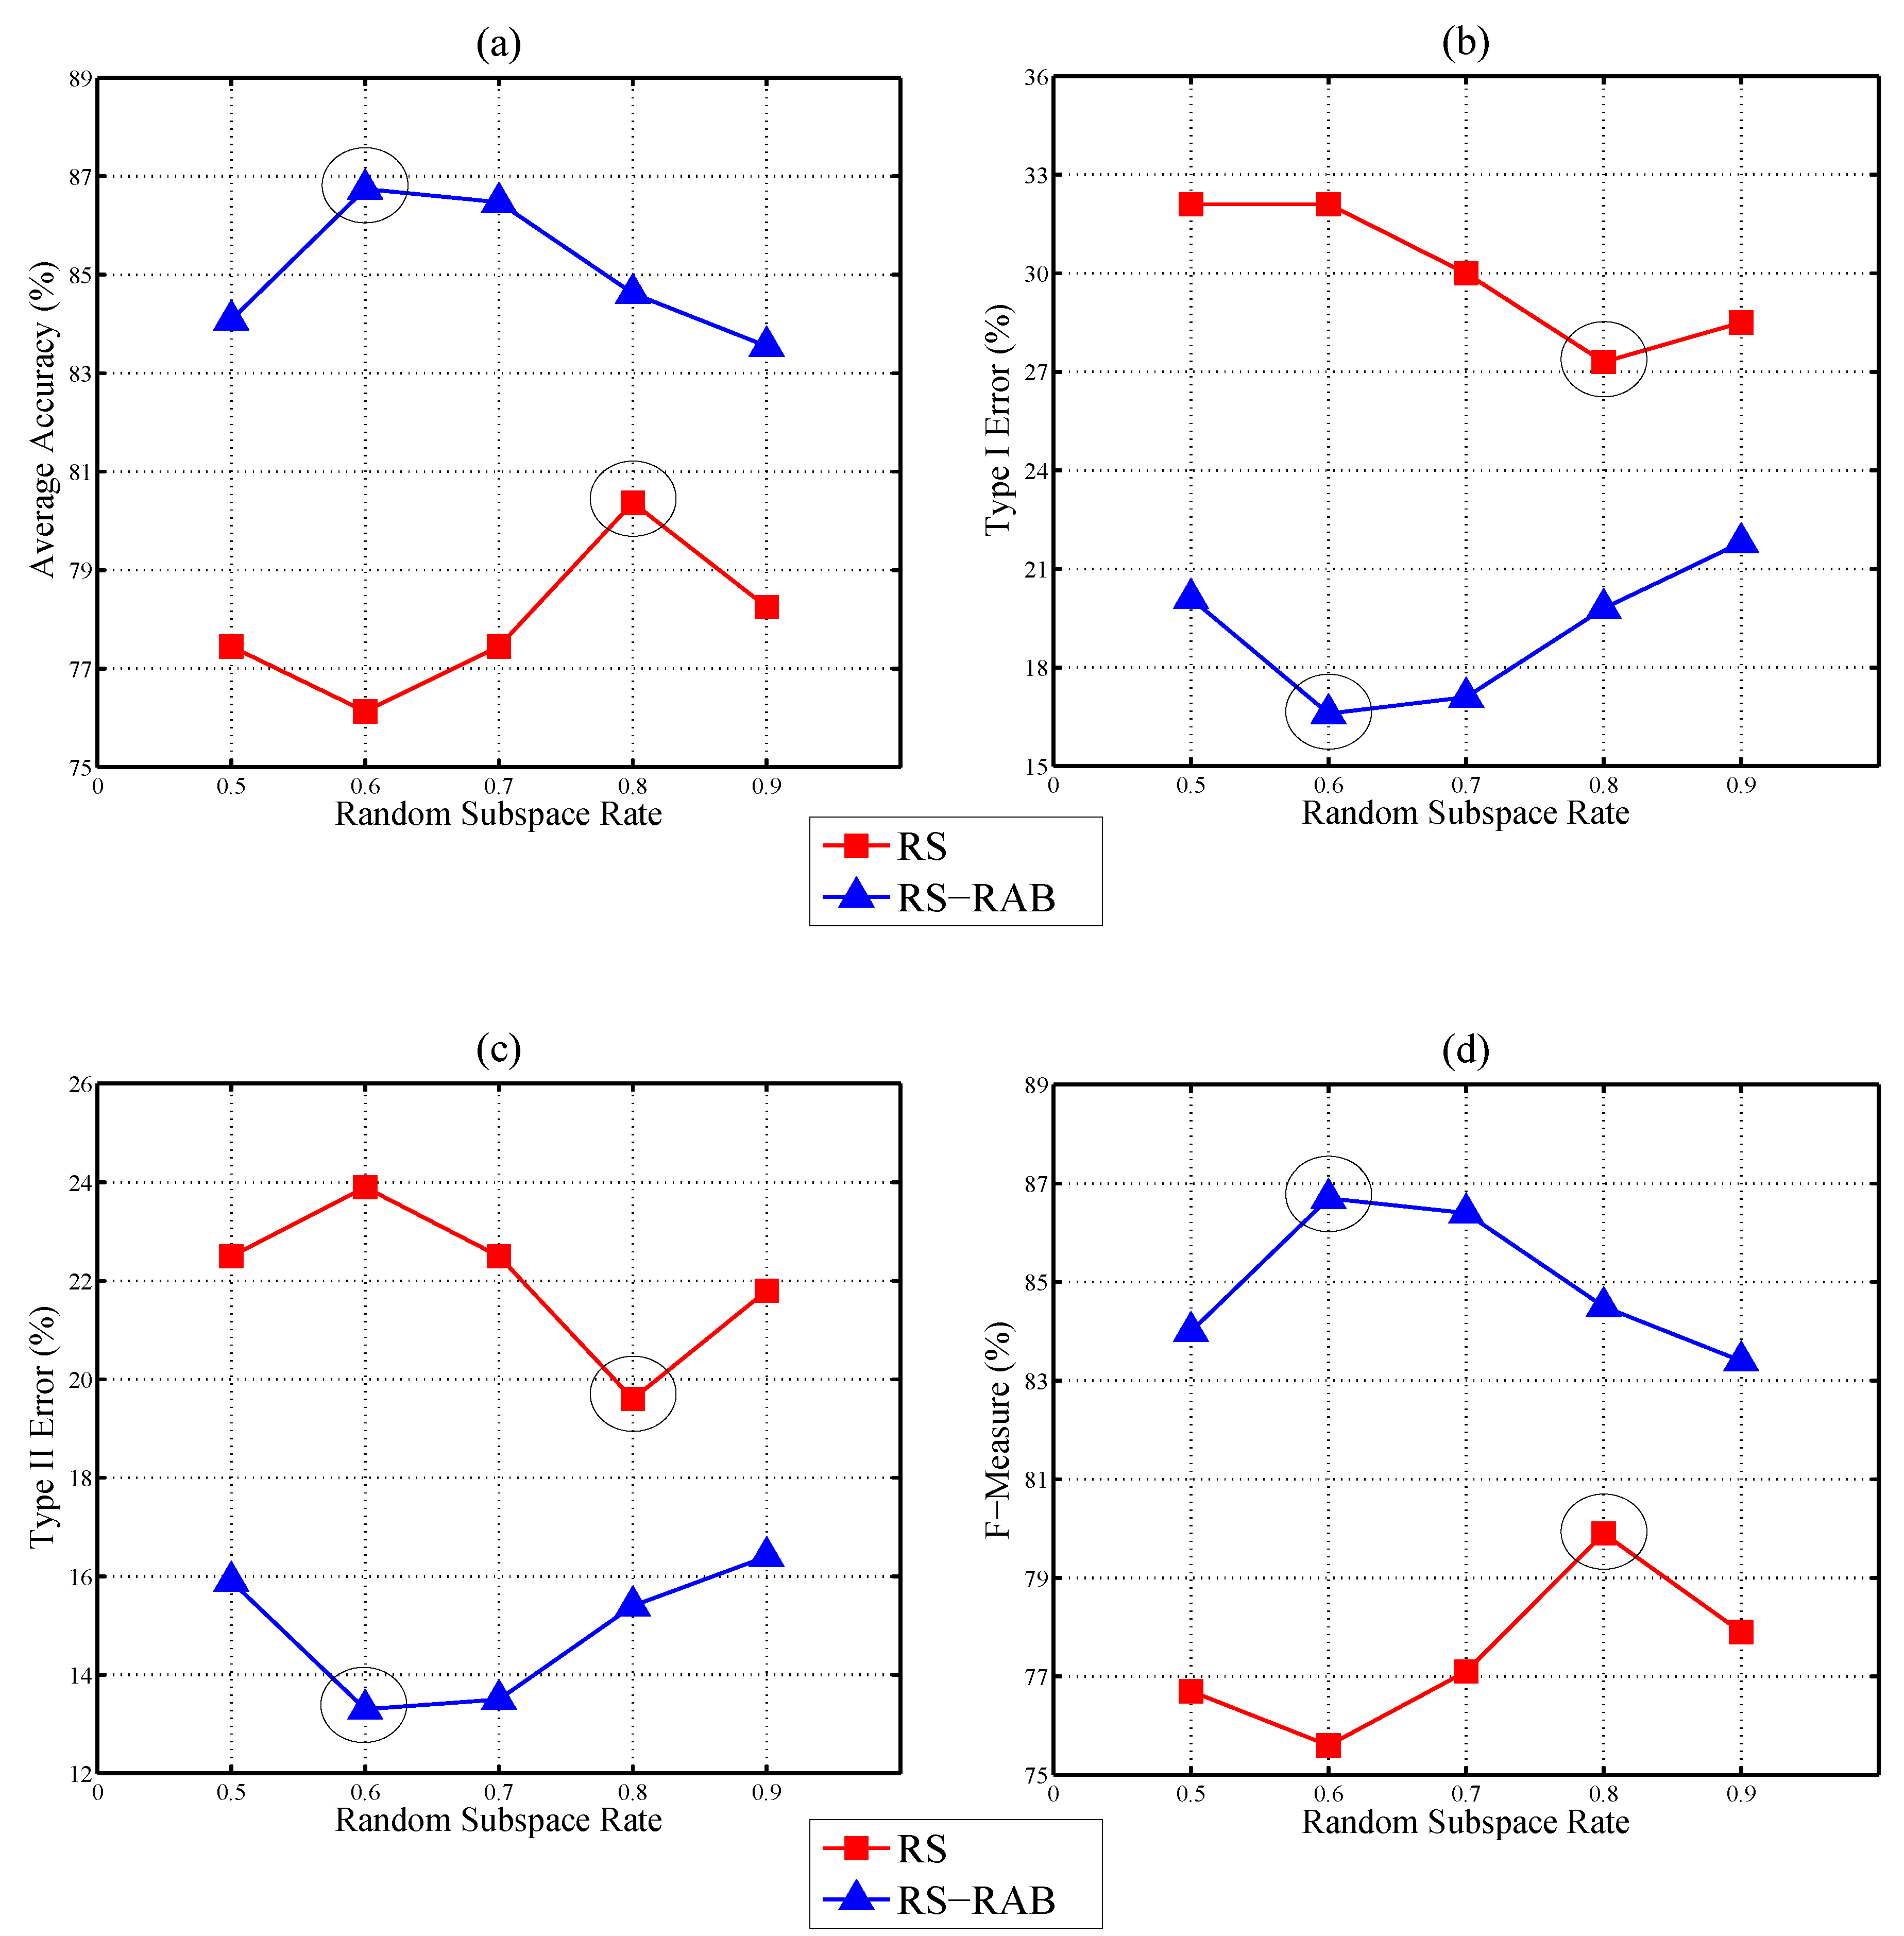
3.3. Experimental Results and Discussion

In this section, we try to find the best method from RS-RAB, DT, RS and RAB by analyzing and comparing prediction performance indicators. We firstly need to find out the value of random subspace rate which contributes to prominent prediction performance of RS and RS-RAB. As shown in Figure 2, RS has the best performance when the random subspace rate is set to 0.8. Meanwhile, RS-RAB has the best performance when the random subspace rate is set to 0.6.
Subsequently, Table 2 displays the “average accuracy”, “Type I error”, “Type II error” and “F-Measure” for DT, RS, RAB and RS-RAB methods. This table shows that: (1) RS-RAB has the highest average accuracy of 86.74%, followed by RS with an average accuracy of 80.37%, DT with 79.58%, and RAB with 73.47%; (2) RS-RAB has the lowest Type I error and Type II error of 16.60% and 13.30%, followed by RS with errors of 27.30% and 19.60%, DT with 23.60% and 20.40%, and RAB with 33.90% and 26.50%; (3) RS-RAB has the highest F-Measure of 86.70%, followed by RS with F-Measure of 79.90%, DT with 79.70%, and RAB with 73.20%. It is not difficult to find that the integrated ensemble ML, i.e., RS-RAB, acquires a better performance than other three ML methods by analyzing the experimental results. It is interesting that RAB gets the worst results among four methods. Besides, the prediction performance of DT is very close to that of RS, and its Type I error is much lower than that of RS. This output reveals that ensemble ML methods are not always better than individual ML method, even though they integrate multiple classifiers into an aggregated output. This is one of important reasons that we employ the strategy of integrating common ensemble ML methods.

4. Conclusions

We study China’s SME credit risk prediction in SCF by using the individual machine learning method (i.e., DT), ensemble ML methods (i.e., RS and RAB) and integrated ensemble ML method (i.e., RS-RAB). The empirical outcomes show that RS-RAB possesses the best prediction performance than other three methods and the prediction accuracy of ensemble ML method is not absolutely higher than that of individual ML. Our obtained results provide a new strategy, i.e., integrating two common ensemble ML methods, which improve the China’s SME credit risk forecasting ability of ML method in SCF. One potential application of this strategy is that we can research and develop other integrated ensemble ML methods in future research. In practice, as a new integrated ensemble ML method, our proposed RS-RAB can be used for predicting credit risks of China’s SME in SCF.

Acknowledgments

This work was supported by the National Natural Science Foundation of China under Grant No. 71373072 and No. 71501066; the China Scholarship Council under Grant No. 201506135022; the Specialized Research Fund for the Doctoral Program of Higher Education under Grant No. 20130161110031; and the Foundation for Innovative Research Groups of the National Natural Science Foundation of China under Grant No. 71521061.

Author Contributions

All authors discussed and agreed on the idea and scientific contribution. You Zhu and Chi Xie performed simulations and wrote simulation sections. You Zhu, Chi Xie, Gang-Jin Wang and Xin-Guo Yan did mathematical modeling in the manuscript. Chi Xie and Gang-Jin Wang contributed in manuscript writing and revisions. All authors have read and approved the final manuscript.

Conflicts of Interest

The authors declare no conflict of interest.

References

  1. More, D.; Basu, P. Challenges of supply chain finance: A detailed study and a hierarchical model based on the experiences of an Indian firm. Bus. Process Manag. J. 2013, 19, 624–647. [Google Scholar] [CrossRef]
  2. Seifert, R.W.; Seifert, D. Financing the chain. Int. Commer. Rev. 2011, 10, 32–44. [Google Scholar] [CrossRef]
  3. Sopranzetti, B.J. Selling accounts receivable and the underinvestment problem. Q. Rev. Econ. Financ. 1999, 39, 291–301. [Google Scholar] [CrossRef]
  4. Wuttke, D.A.; Blome, C.; Henke, M. Focusing the financial flow of supply chains: An empirical investigation of financial supply chain management. Int. J. Prod. Econ. 2013, 145, 773–789. [Google Scholar] [CrossRef]
  5. Thomas, L.C. A survey of credit and behavioral scoring: Forecasting financial risks of lending to customers. Int. J. Forecast. 2000, 16, 149–172. [Google Scholar] [CrossRef]
  6. Jiang, Y. Credit scoring model based on the decision tree and the simulated annealing algorithm. In Proceedings of the 2009 World Congress on Computer Science and Information Engineering, Los Angeles, CA, USA, 31 March–2 April 2009.
  7. Hung, C.; Chen, J. A selective ensemble based on expected probabilities for bankruptcy prediction. Expert Syst. Appl. 2009, 36, 5297–5303. [Google Scholar] [CrossRef]
  8. Nanni, L.; Lumini, A. An experimental comparison of ensemble of classifiers for bankruptcy prediction and credit scoring. Expert Syst. Appl. 2009, 36, 3028–3033. [Google Scholar] [CrossRef]
  9. Tsai, C.; Wu, J. Using neural network ensembles for bankruptcy prediction and credit scoring. Expert Syst. Appl. 2008, 34, 2639–2649. [Google Scholar] [CrossRef]
  10. Yu, L.; Wang, S.; Lai, K.K. Credit risk assessment with a multistage neural network ensemble learning approach. Expert Syst. Appl. 2008, 34, 1434–1444. [Google Scholar] [CrossRef]
  11. West, D.; Dellana, S.; Qian, J. Neural network ensemble strategies for financial decision applications. Comput. Oper. Res. 2005, 32, 2543–2559. [Google Scholar] [CrossRef]
  12. Wang, G.; Ma, J. Study of corporate credit risk prediction based on integrating boosting and random subspace. Expert Syst. Appl. 2011, 38, 13871–13878. [Google Scholar] [CrossRef]
  13. Ho, T.K. The random subspace method for constructing decision forests. IEEE Trans. Pattern Anal. Mach. Intell. 1998, 20, 832–844. [Google Scholar]
  14. Freund, Y.; Schapire, R.E. Experiments with a new boosting algorithm. In Proceedings of the 13th International Conference on Machine Learning, Bari, Italy, 3–6 July 1996.
  15. Friedman, J.; Hastie, T.; Tibshirani, R. Additive logistic regression: A statistical view of boosting (with discussion and a rejoinder by the authors). Ann. Stat. 2000, 28, 337–407. [Google Scholar] [CrossRef]
  16. Schapire, R.E.; Freund, Y.; Bartlett, P.; Lee, W.S. Boosting the margin: A new explanation for the effectiveness of voting methods. Ann. Stat. 1998, 26, 1651–1686. [Google Scholar] [CrossRef]
  17. Schapire, R.E. Improved boosting algorithms using confidence-rated predictions. Mach. Learn. 1999, 37, 297–336. [Google Scholar] [CrossRef]
  18. Maclin, R.; Opitz, D. Popular ensemble methods: An empirical study. J. Artif. Intell. Res. 1999, 11, 169–198. [Google Scholar]
  19. Fu, Z.W.; Golden, B.L.; Lele, S.; Raghavan, S.; Wasil, E. Diversification for better classification trees. Comput. Oper. Res. 2006, 33, 3185–3202. [Google Scholar] [CrossRef]
  20. Zhu, Y.; Xie, C.; Wang, G.J.; Yan, X.G. Comparison of individual, ensemble and integrated ensemble machine learning methods to predict China’s SME credit risk in supply chain finance. Neural Comput. Appl. 2016. [Google Scholar] [CrossRef]
  21. Quinlan, J.R. C4.5: Programs for Machine Learning; Morgan Kaufmann Publishers: San Francisco, CA, USA, 1993. [Google Scholar]
  22. China Stock Market and Accounting Research (CSMAR). Stock Market Data-Base in China (2012–2013). Available online: http://www.gtarsc.com (accessed on 18 May 2016).
  23. Xiong, X.; Ma, J.; Zhao, W. Credit risk analysis of supply chain finance. Nankai Bus. Rev. 2009, 12, 92–98. [Google Scholar]
  24. Zhu, Y.; Xie, C.; Sun, B.; Wang, G.J.; Yan, X.G. Predicting China’s SME credit risk in supply chain financing by logistic regression, artificial neural network and hybrid models. Sustainability 2016, 8, 433. [Google Scholar] [CrossRef]
  25. Powers, D.M.W. Evaluation: From Precision, Recall and F-measure to ROC, informedness, markedness & correlation. J. Mach. Learn. Technol. 2011, 2, 37–63. [Google Scholar]
Figure 1. The RS-RAB Algorithm.
Entropy 18 00195 g001
Figure 2. Comparing the SME credit risk prediction performances of RS and RS-RAB methods when the random subspace rate varies from 0.5 to 0.9. Note that the points within the ellipse in subfigures (a)–(d) show that RS and RS-RAB obtain prominent prediction performance when the random subspace rates are set to 0.8 and 0.6, respectively; and the prediction performance of RS-RAB method is higher than that of RS method.
Entropy 18 00195 g002
Table 1. Independent Variables of Machine Learning Models [20,24].
FactorsCodeVariablesCategories
Applicant factorsR1Current ratioLiquidity
R2Quick ratioLiquidity
R3Cash ratioLiquidity
R4Working capital turnoverLiquidity
R5Return on equityLeverage
R6Profit margin on salesProfitability
R7Rate of Return on Total AssetsLeverage
R8Total Assets Growth RateActivity
Counter party factorsR9Credit rating of CENon-finance
R10Quick ratioLiquidity
R11Turnover of total capitalLiquidity
R12Profit margin on salesProfitability
Items’ characteristics factorsR13Price rigidity, liquidation and vulnerable degree of trade goodsNon-finance
R14Account receivable collection periodLeverage
R15Accounts receivable turnover ratioLeverage
Operation condition factorsR16Industry trendsNon-finance
R17Transaction time and transaction frequencyNon-finance
R18Credit rating of SMENon-finance
Table 2. Experimental results of four methods.
DTRS aRABRS-RAB b
Average accuracy79.58%80.37%73.47%86.74%
Type I error23.60%27.30%33.90%16.60%
Type II error20.40%19.60%26.50%13.30%
F-Measure79.70%79.90%73.20%86.70%
a Random subspace rate is set to 0.8; b Random subspace rate is set to 0.6.

