Article

Measuring Electromechanical Coupling in Patients with Coronary Artery Disease and Healthy Subjects

1
School of Control Science and Engineering, Shandong University, Jingshi Road 17923, Jinan 250061, China
2
School of Computer Science and Technology, Shandong University, Shunhua Road 1500, Jinan 250101, China
*
Authors to whom correspondence should be addressed.
Entropy 2016, 18(4), 153; https://doi.org/10.3390/e18040153
Submission received: 21 January 2016 / Revised: 7 April 2016 / Accepted: 15 April 2016 / Published: 21 April 2016

Abstract

:
Coronary artery disease (CAD) is the most common cause of death globally. To detect CAD noninvasively at an early stage before clinical symptoms occur is still nowadays challenging. Analysis of the variation of heartbeat interval (RRI) opens a new avenue for evaluating the functional change of cardiovascular system which is accepted to occur at the subclinical stage of CAD. In addition, systolic time interval (STI) and diastolic time interval (DTI) also show potential. There may be coupling in these electromechanical time series due to their physiological connection. However, to the best of our knowledge no publication has systematically investigated how can the coupling be measured and how it changes in CAD patients. In this study, we enrolled 39 CAD patients and 36 healthy subjects and for each subject the electrocardiogram (ECG) and photoplethysmography (PPG) signals were recorded simultaneously for 5 min. The RRI series, STI series, and DTI series were constructed, respectively. We used linear cross correlation (CC), coherence function (CF), as well as nonlinear mutual information (MI), cross conditional entropy (XCE), cross sample entropy (XSampEn), and cross fuzzy entropy (XFuzzyEn) to analyse the bivariate RRI-DTI coupling, RRI-STI coupling, and STI-DTI coupling, respectively. Our results suggest that the linear CC and CF generally have no significant difference between the two groups for all three types of bivariate coupling. The MI only shows weak change in RRI-DTI coupling. By comparison, the three entropy-based coupling measurements show significantly decreased coupling in CAD patients except XSampEn for RRI-DTI coupling (less significant) and XCE for STI-DTI and RRI-STI coupling (not significant). Additionally, the XFuzzyEn performs best as it was still significant if we further applied the Bonferroni correction in our statistical analysis. Our study indicates that the intrinsic electromechanical coupling is most probably nonlinear and can better be measured by nonlinear entropy-based measurements especially the XFuzzyEn. Besides, CAD patients are accompanied by a loss of electromechanical coupling. Our results suggest that cardiac electromechanical coupling may potentially serve as a noninvasive diagnostic tool for CAD.

1. Introduction

The variation of heartbeat interval (HRV) has long been used for evaluating cardiovascular function, as it is accepted to be capable of shedding light upon the underlying control mechanism [1,2]. Researchers have studied the linear and nonlinear features of HRV for different positions (e.g., the supine, left lateral and right lateral positions), and the features were fed into classifiers for the purpose of classifying normal and coronary artery disease (CAD) states in previous studies [3,4,5,6]. Systole (heart contraction) and diastole (heart relaxation), apart from heartbeat which primarily reflects the electrical activity of the heart, are fundamental mechanical cardiac activities. In addition to heartbeat interval (RRI), the systole time interval (STI) and diastole time interval (DTI) are also potentially applicable for examining cardiovascular conditions, as evidenced by a couple of publications [7,8,9,10,11,12,13,14,15,16,17].
Physiologically, the cardiac cycle (indicated by heartbeat interval or RRI) is composed of the systole, the diastole, and the intervening pause [18]. Due to this physiological connection, coupling might be tracked between the electromechanical time series. Liu et al. [12] showed experimental evidence to the fact that cardiac systole is relatively stable whereas the diastole is more flexible to change with heart rate; variation in heart rate is preferentially expressed in diastolic interval. This was still true during exercise stage [12]. Similar results were demonstrated by Carrasco-Sosa and Guillén-Mandujano [13]. Using radial artery pressure (RAP) wave-derived foot-to-notch and notch-to-foot intervals as surrogate systolic and diastolic time intervals, Li et al. examined the coupling between RRI and DTI series through multiscale multivariate entropy analysis [14,15]. They concluded that RRI and DTI were tightly coupled in healthy young subjects whereas this RRI-DTI coupling was reduced over small time scales in healthy aged subjects [15], and over both small and large time scales in heart failure patients [14]. With regard to the use of surrogate intervals, Li et al. proved that RAP-derived foot-to-notch and notch-to-foot intervals could indicate similar relation to heart rate and age to previous knowledge concluded from heart sound or Doppler flow signals based studies [16], suggesting the validity of RAP-derived intervals used as surrogates. In addition, some studies used electrocardiogram (ECG)-derived QT and TQ intervals as surrogates and demonstrated that the systolic-diastolic interaction as reflected by QT/TQ ratio was capable of detecting cardiac autonomic neuropathy in diabetes [8], recognizing long QT interval syndrome [17], and evaluating the arrhythmogenic risk [9].
Generally, coupling phenomena are very common in physiology [19,20,21,22,23,24,25,26,27]. Previous studies have developed a vast number of methods in order to measure coupling [22,28,29]. Those established coupling methods can be roughly derived into two groups—linear and nonlinear measurements. The linear coupling measurements are mainly the correlation coefficient (CC) in time-domain and coherence function (CF) in frequency-domain [29]. The nonlinear ones include, e.g., mutual information (MI) [28], cross entropy approaches such as cross-conditional entropy (XCE) [20,30,31], cross-sample entropy (XSampEn) [23,31,32,33,34] and cross-fuzzy entropy (XFuzzyEn) [23,33,34,35], as well as synchronization approaches (generalized synchronization [36], phase synchronization [37,38], and event synchronization [39], etc., to be specific). In order to objectively examine the electromechanical coupling, comprehensive analyses and comparisons based on the aforementioned coupling methods should be conducted. Only the linear interaction applied in [8,9,40] and nonlinear entropy approach applied in [23,27,34] are not adequate and may lead to bias conclusion.
Therefore, this study aimed to investigate systematically the electromechanical coupling through various coupling methods. The linear CC, CF, as well as nonlinear MI, XCE, XSampEn, and XFuzzyEn will be used. Electromechanical coupling, as indicated by bivariate RRI-STI coupling, RRI-DTI coupling, and STI-DTI coupling analysis, will be examined and compared between healthy subjects and patients with CAD. Figure 1 shows a block diagram of this study.
The rest of this paper is structured as follows: Section 2 summarizes the algorithms of the coupling measurements. Experimental data and processing procedures are provided in Section 3. Analyzing results are shown in Section 4, followed by discussions in Section 5 and conclusions in Section 6.

2. Algorithms of Coupling Measurements

2.1. Linear Measurements

2.1.1. Correlation Coefficient (CC)

For two series { x ( i ) , i = 1 , 2 , , N } and { y ( i ) , i = 1 , 2 , , N } , CC is defined as [22,41]:
C C = 1 N i = 1 N ( x ( i ) x ¯ ) σ x ( y ( i ) y ¯ ) σ y ,
where N is the length of the signals; x ¯ and y ¯ indicate the mean values of x and y , respectively; σ x 2 and σ y 2 indicate the variances of x and y , respectively. CC quantifies the linear correlation between x and y . If x and y are less linearly correlated, CC will be close to zero. Conversely, if they are more linearly correlated, CC will be larger. CC = 1 indicates x and y are completely linear correlated ( y = f ( x ) where f indicates a linear transfer function).

2.1.2. Coherence Function (CF)

CF between two series { x ( i ) , i = 1 , 2 , , N } and { y ( i ) , i = 1 , 2 , , N } is a real-valued function which is defined as [29]:
C F X Y ( f ) = | P X Y ( f ) | 2 P X X ( f ) P Y Y ( f ) ,
where P X Y ( f ) is the cross-spectral density between the two series, and P X X ( f ) and P Y Y ( f ) the autospectral density of x ( i ) and y ( i ) , respectively. Average of C F X Y was used as the coupling measurement in this study.

2.2. Nonlinear Measurements

2.2.1. Mutual Information (MI)

MI is derived from the information theory. First bin the state spaces of two time-series { x ( i ) , i = 1 , 2 , , N } and { y ( j ) , j = 1 , 2 , , N } by M x and M y , respectively. Denote the weight of the i -th (or j -th ) bin of { x ( i ) , i = 1 , 2 , , N } (or { y ( j ) , j = 1 , 2 , , N } ) by p x ( i ) and p y ( j ) , respectively. The MI of the two series can be defined as [28]:
I ( X , Y ) = H ( X ) + H ( Y ) H ( X , Y ) ,
where H ( X ) and H ( Y ) denote the Shannon entropies of the respective marginal distributions p x ( i ) , p y ( j ) with i = 1 , , M x , j = 1 , , M y , e.g.,
H ( X ) = i = 1 M x p x ( i ) log p x ( i ) H ( Y ) = j = 1 M y p y ( j ) log p y ( j ) ,
and H ( X , Y ) denotes the Shannon entropy of the joint distribution p x y ( i , j ) , i.e.,
H ( X , Y ) = i , j M p x y ( i , j ) log p x y ( i , j ) .

2.2.2. Cross-Conditional Entropy (XCE)

Consider a pair of normalized series (by subtracting the mean and dividing by the standard deviation) x ( i ) and y ( i ) , i = 1 , 2 , , N . Given the embedding dimension m , time delay τ , and the quantization level ξ , XCE is defined as follows [30,31]:
(1)
Coarse-graining
The full range of time series is divided into a fixed number of ξ values labeled from zero to ξ 1 . The coarse-graining resolution thus equals [ max ( x , y ) min ( x , y ) ] / ξ . It renders x ( i ) and y ( i ) sequences of symbols x ( i ) and y ( i ) , i = 1 , 2 , , N .
(2)
State space reconstruction
Form X m ( i ) and Y X m + 1 ( j ) by:
X m ( i ) = [ x ( i ) , x ( i τ ) , , x ( i ( m 1 ) τ ) ] ,
Y X m + 1 ( j ) = [ y ( j ) , X m ( j ) ] ,
respectively, where ( m 1 ) τ + 1 i , j N .
(3)
Encoding
The vectors X m ( i ) and Y X m + 1 ( j ) can be codified in decimal format as:
{ X m ( i ) } 10 = x ( i ) ξ m 1 + x ( i τ ) ξ m 2 + + x ( i ( m 1 ) τ ) ξ 0 = w i ,
{ Y X m + 1 ( j ) } 10 = y ( j ) ξ m + { X m ( j ) } 10 = z j ,
thus rendering each sequence of vectors X m ( i ) and Y X m + 1 ( j ) series of integer numbers w i and z j with w i ranging from zero to ( ξ 1 ) i = 1 m 1 ξ i , and z j ranging from zero to ( ξ 1 ) j = 1 m ξ j .
(4)
Probability estimation
Estimate the probability of each possible value for w i and z j by the corresponding frequency.
(5)
XCE calculation
Define XCE by:
X C E ( m , τ ) = S E ( z j ) S E ( w i ) + p e r c ( m ) S E y ( 1 ) ,
where S E ( ) calculates the Shannon entropy of a specific distribution, p e r c ( m ) is the percentage of patterns w i found only once in the data set, S E y ( 1 ) is the Shannon entropy of the quantized series y i .

2.2.3. Cross-Sample Entropy (XSampEn)

Consider a pair of normalized series (by subtracting the mean and dividing by the standard deviation) x ( i ) and y ( i ) , i = 1 , 2 , , N . Given the embedding dimension m , time delay τ , and threshold parameter r , XSampEn is defined as follows [31,32]:
(1)
State space reconstruction
Form X m ( i ) and Y m ( j ) by:
X m ( i ) = [ x ( i ) , x ( i + τ ) , , x ( i + ( m 1 ) τ ) ] ,
Y m ( j ) = [ y ( j ) , y ( j + τ ) , , y ( j + ( m 1 ) τ ) ] ,
respectively, where 1 i , j N m τ .
(2)
Ranking similar vectors
Define the distance (d) between two vectors by:
d i , j ( m ) = X m ( i ) , Y m ( j ) ,
where indicates the maximum norm. Then define:
A i ( m ) ( r ) = 1 N m τ Θ ( r d i , j ( m ) ) ,
where 1 i , j N m τ , Θ ( ) the Heaviside step function (i.e., Θ ( x ) = 0 if x < 0 , and Θ ( x ) = 1 otherwise). Define A i ( m + 1 ) ( r ) similarly according to steps (1) and (2).
(3)
XSampEn calculation
Define XSampEn by:
X S a m p E n ( m , τ , r ) = ln i = 1 N m τ A i ( m + 1 ) ( r ) i = 1 N m τ A i ( m ) ( r ) .

2.2.4. Cross-Fuzzy Entropy (XFuzzyEn)

For a pair of normalized series (by subtracting the mean and dividing by the standard deviation) x ( i ) and y ( i ) , XFuzzyEn can be defined similarly as XSampEn except that the Heaviside step function in (14) is replaced with a fuzzy membership function [35]:
A ( d ) = e ln ( 2 ) ( d / r ) 2 .

2.3. Further Explanation of the Methods Used

Among the above-reviewed six methods, CC and CF are only sensitive to the linear dependence of the two time series, which is not always the case in real-world physiological systems. Under the regulation of the autonomic nervous system, the cardiac system responds either immediately or within certain time-delays to the internal and external stimuli. As a result, the cardiac electrical and mechanical activities can exhibit short- and long-term correlations across different temporal scales which is a typical nonlinear phenomenon. The electromechanical coupling may thus also be nonlinear. That is basically why we decided to use both linear and nonlinear methods in this study. The latter four methods—MI, XCE, XSampEn, and XFuzzyEn—are all able to detect nonlinear coupling. But in the meantime, they may suffer from parameter determination issues. Methodologically, all four of these methods require predefined parameters but there is currently no general and widely-accepted method regarding how to define these parameters properly. The parameter-dependence may be further aggravated for short-length data which can further affect the statistical performance such as the robustness and consistency. The XFuzzyEn, a refined XSampEn method in fact based on fuzzy logic, was proved less dependent to input parameters and performed better especially for short-length data.

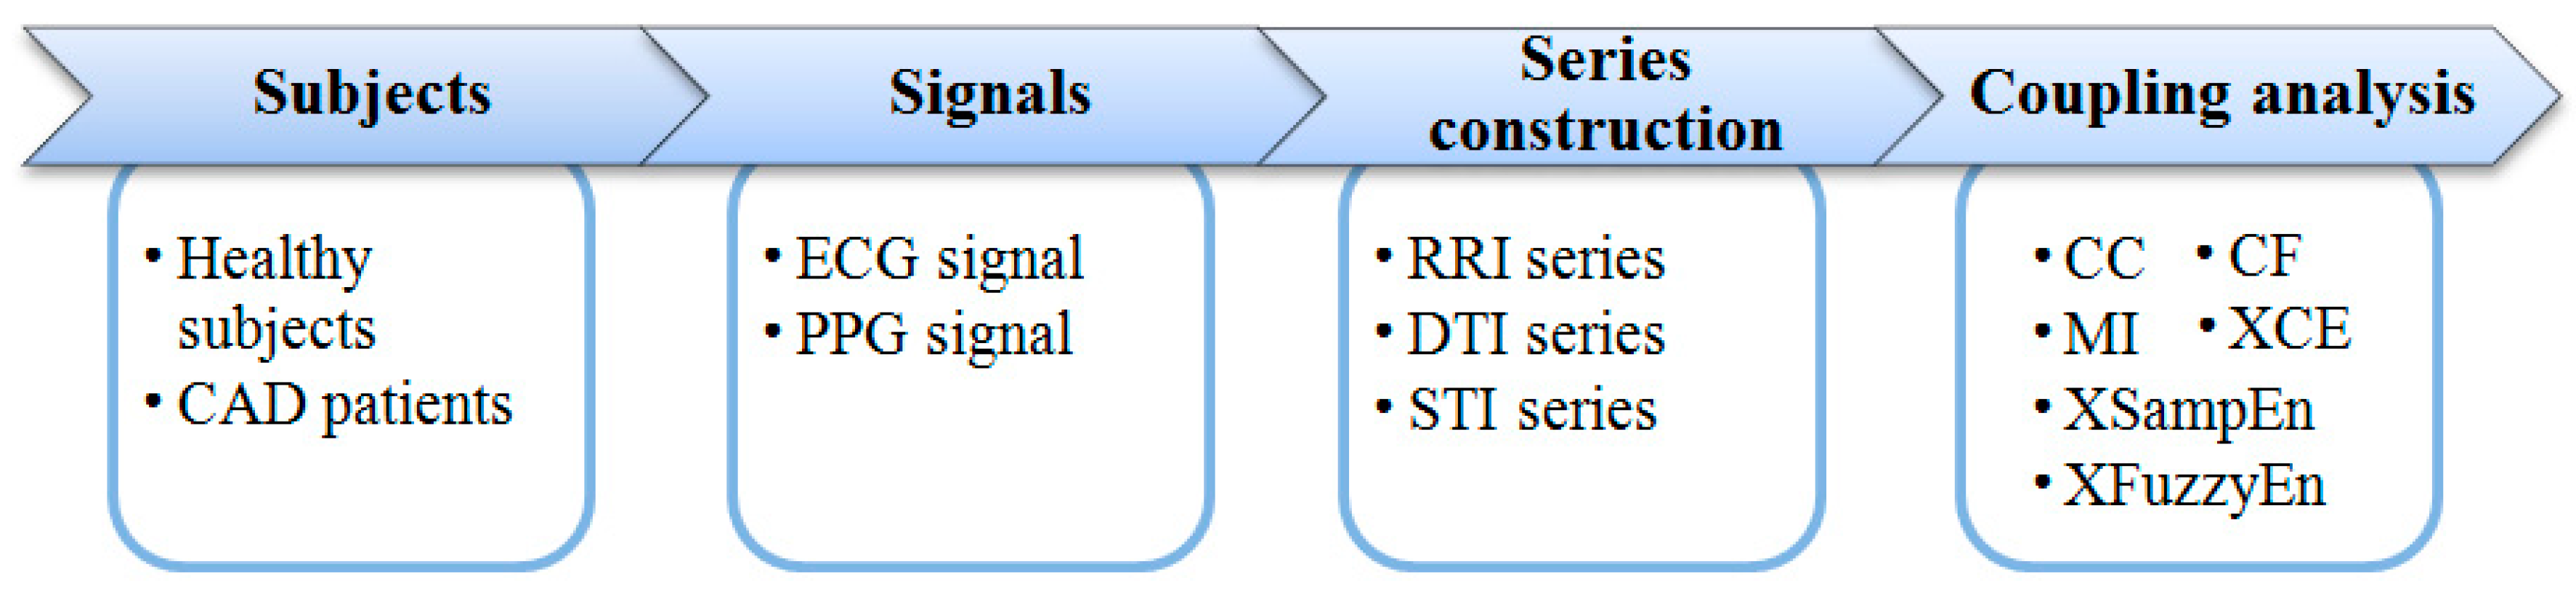
3. Experimental Data and Processing Procedures

3.1. Subjects

A total of 36 healthy subjects and 39 CAD patients were studied in this work. All healthy subjects underwent routine ECG and echocardiography examinations combined with medical history questionnaires to confirm their health status. CAD patients were recruited from those who were scheduled an interventional surgery. Only patients whose coronary angiography result indicated that at least one main coronary branch had an over 50% stenosis were enrolled. ECG and echocardiography examinations were also implemented before surgery. Subjects with frequent ectopic beats or left ventricular ejection fraction less than 50% were excluded prior to participation. All subjects gave their informed consent. The study obtained full approval from the Institutional Review Board of Shandong Provincial Qianfoshan Hospital. Table 1 shows their basic characteristics.

3.2. Protocol

ECG and fingertip photoplethysmography (PPG) signals were recorded using a cardiovascular function detection device (CV FD–II, Jinan Huiyironggong Tech. Co., Ltd., Jinan, China) in a quiet and temperature controlled (25 ± 3 °C) measurement room at Shandong Provincial Qianfoshan Hospital, Shandong University. ECG electrodes were attached to the right wrist and right and left ankles to obtain a standard limb lead-II configuration. The plethysmograph is clipped to the tip of the left forefinger. Before the formal measurement, participants were asked to lie supine on a measurement bed for 10 min rest to allow the cardiovascular system stabilized. Then ECG and PPG signals were recorded simultaneously for 5 min at a sampling frequency of 1000 Hz. During the whole measurement, participants were told to breathe regularly and gently.

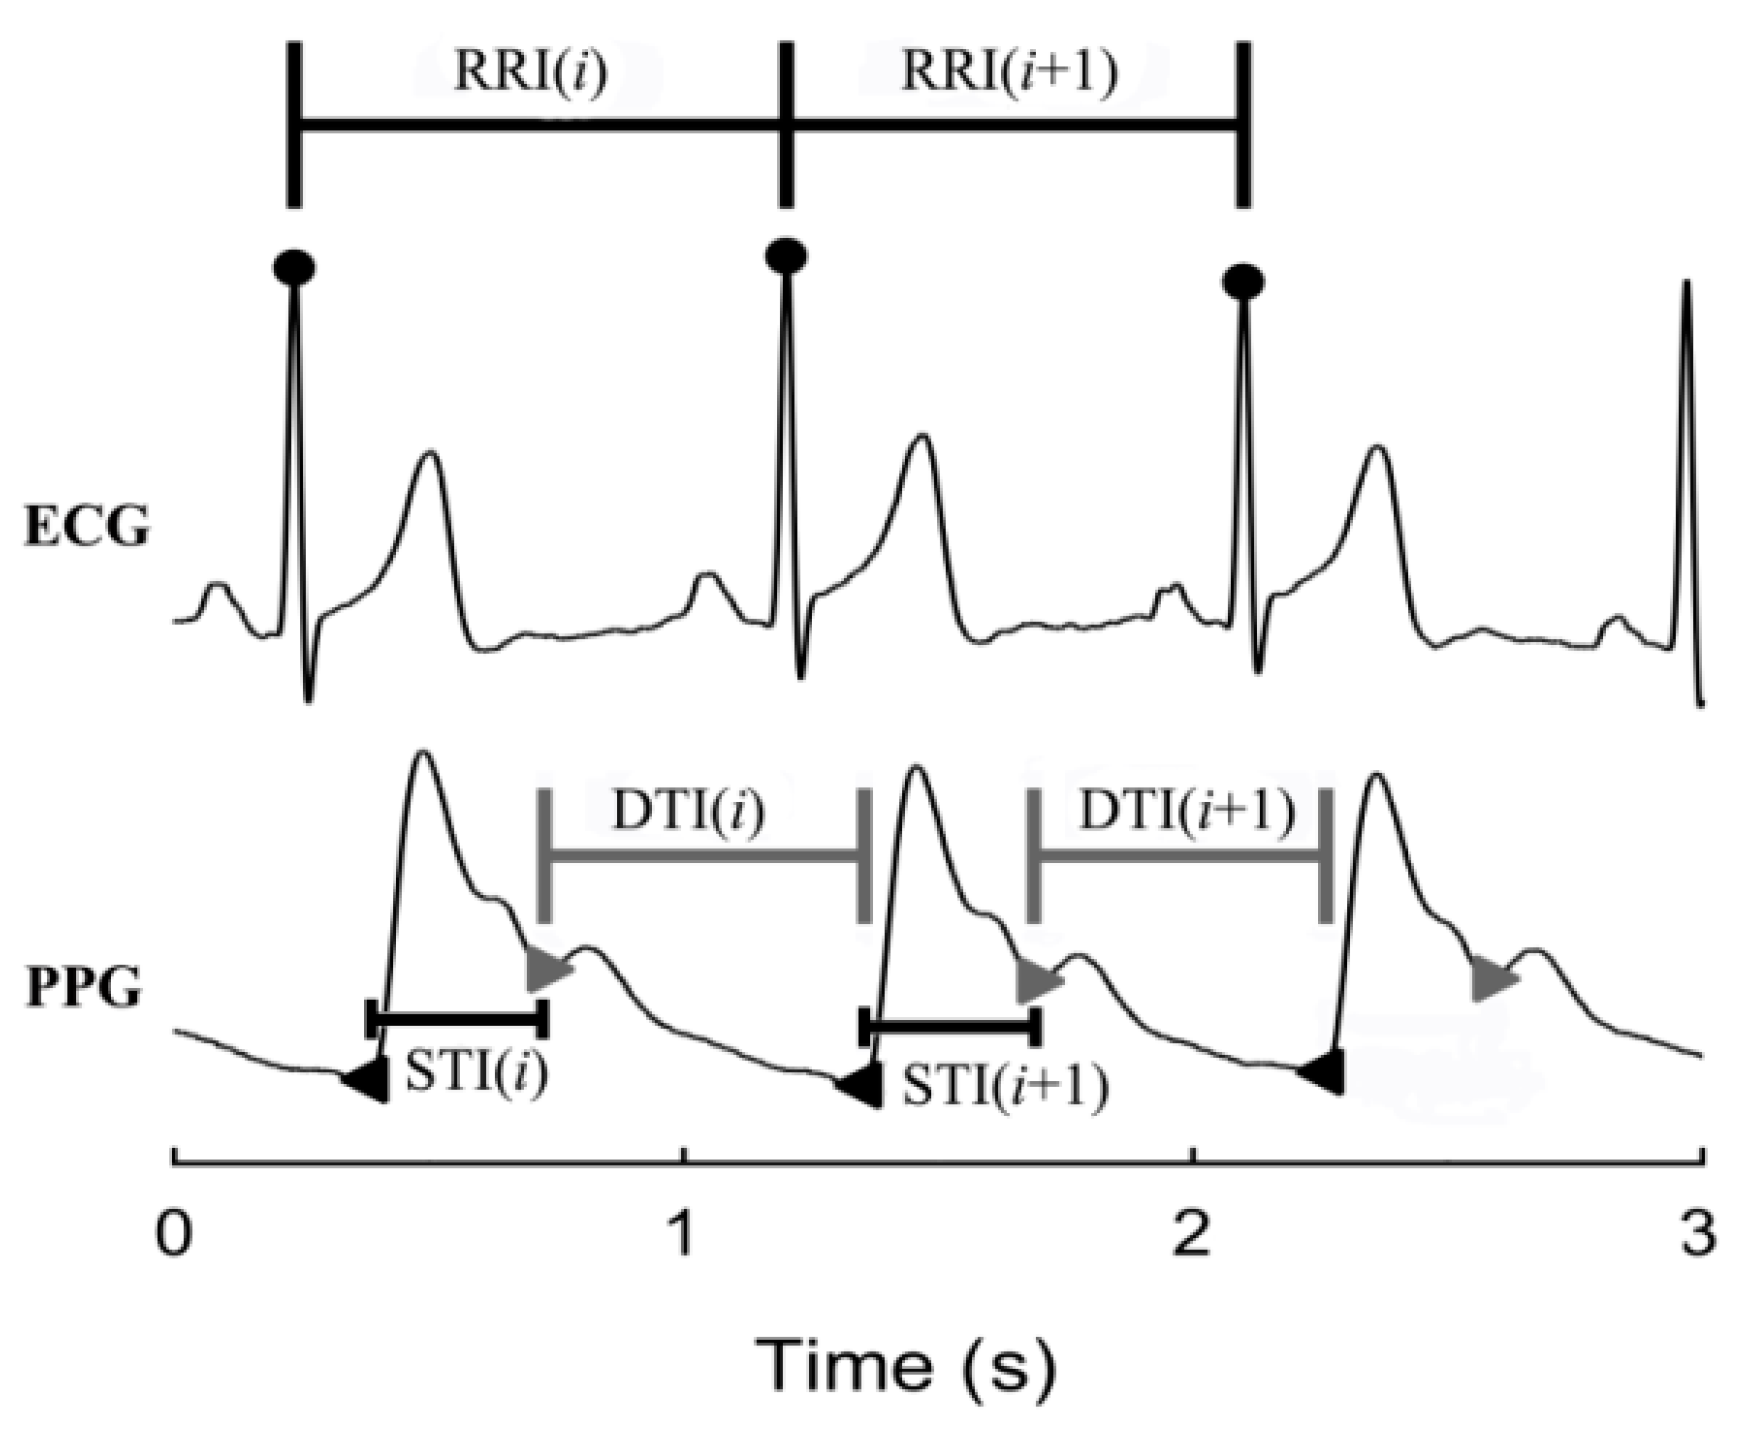
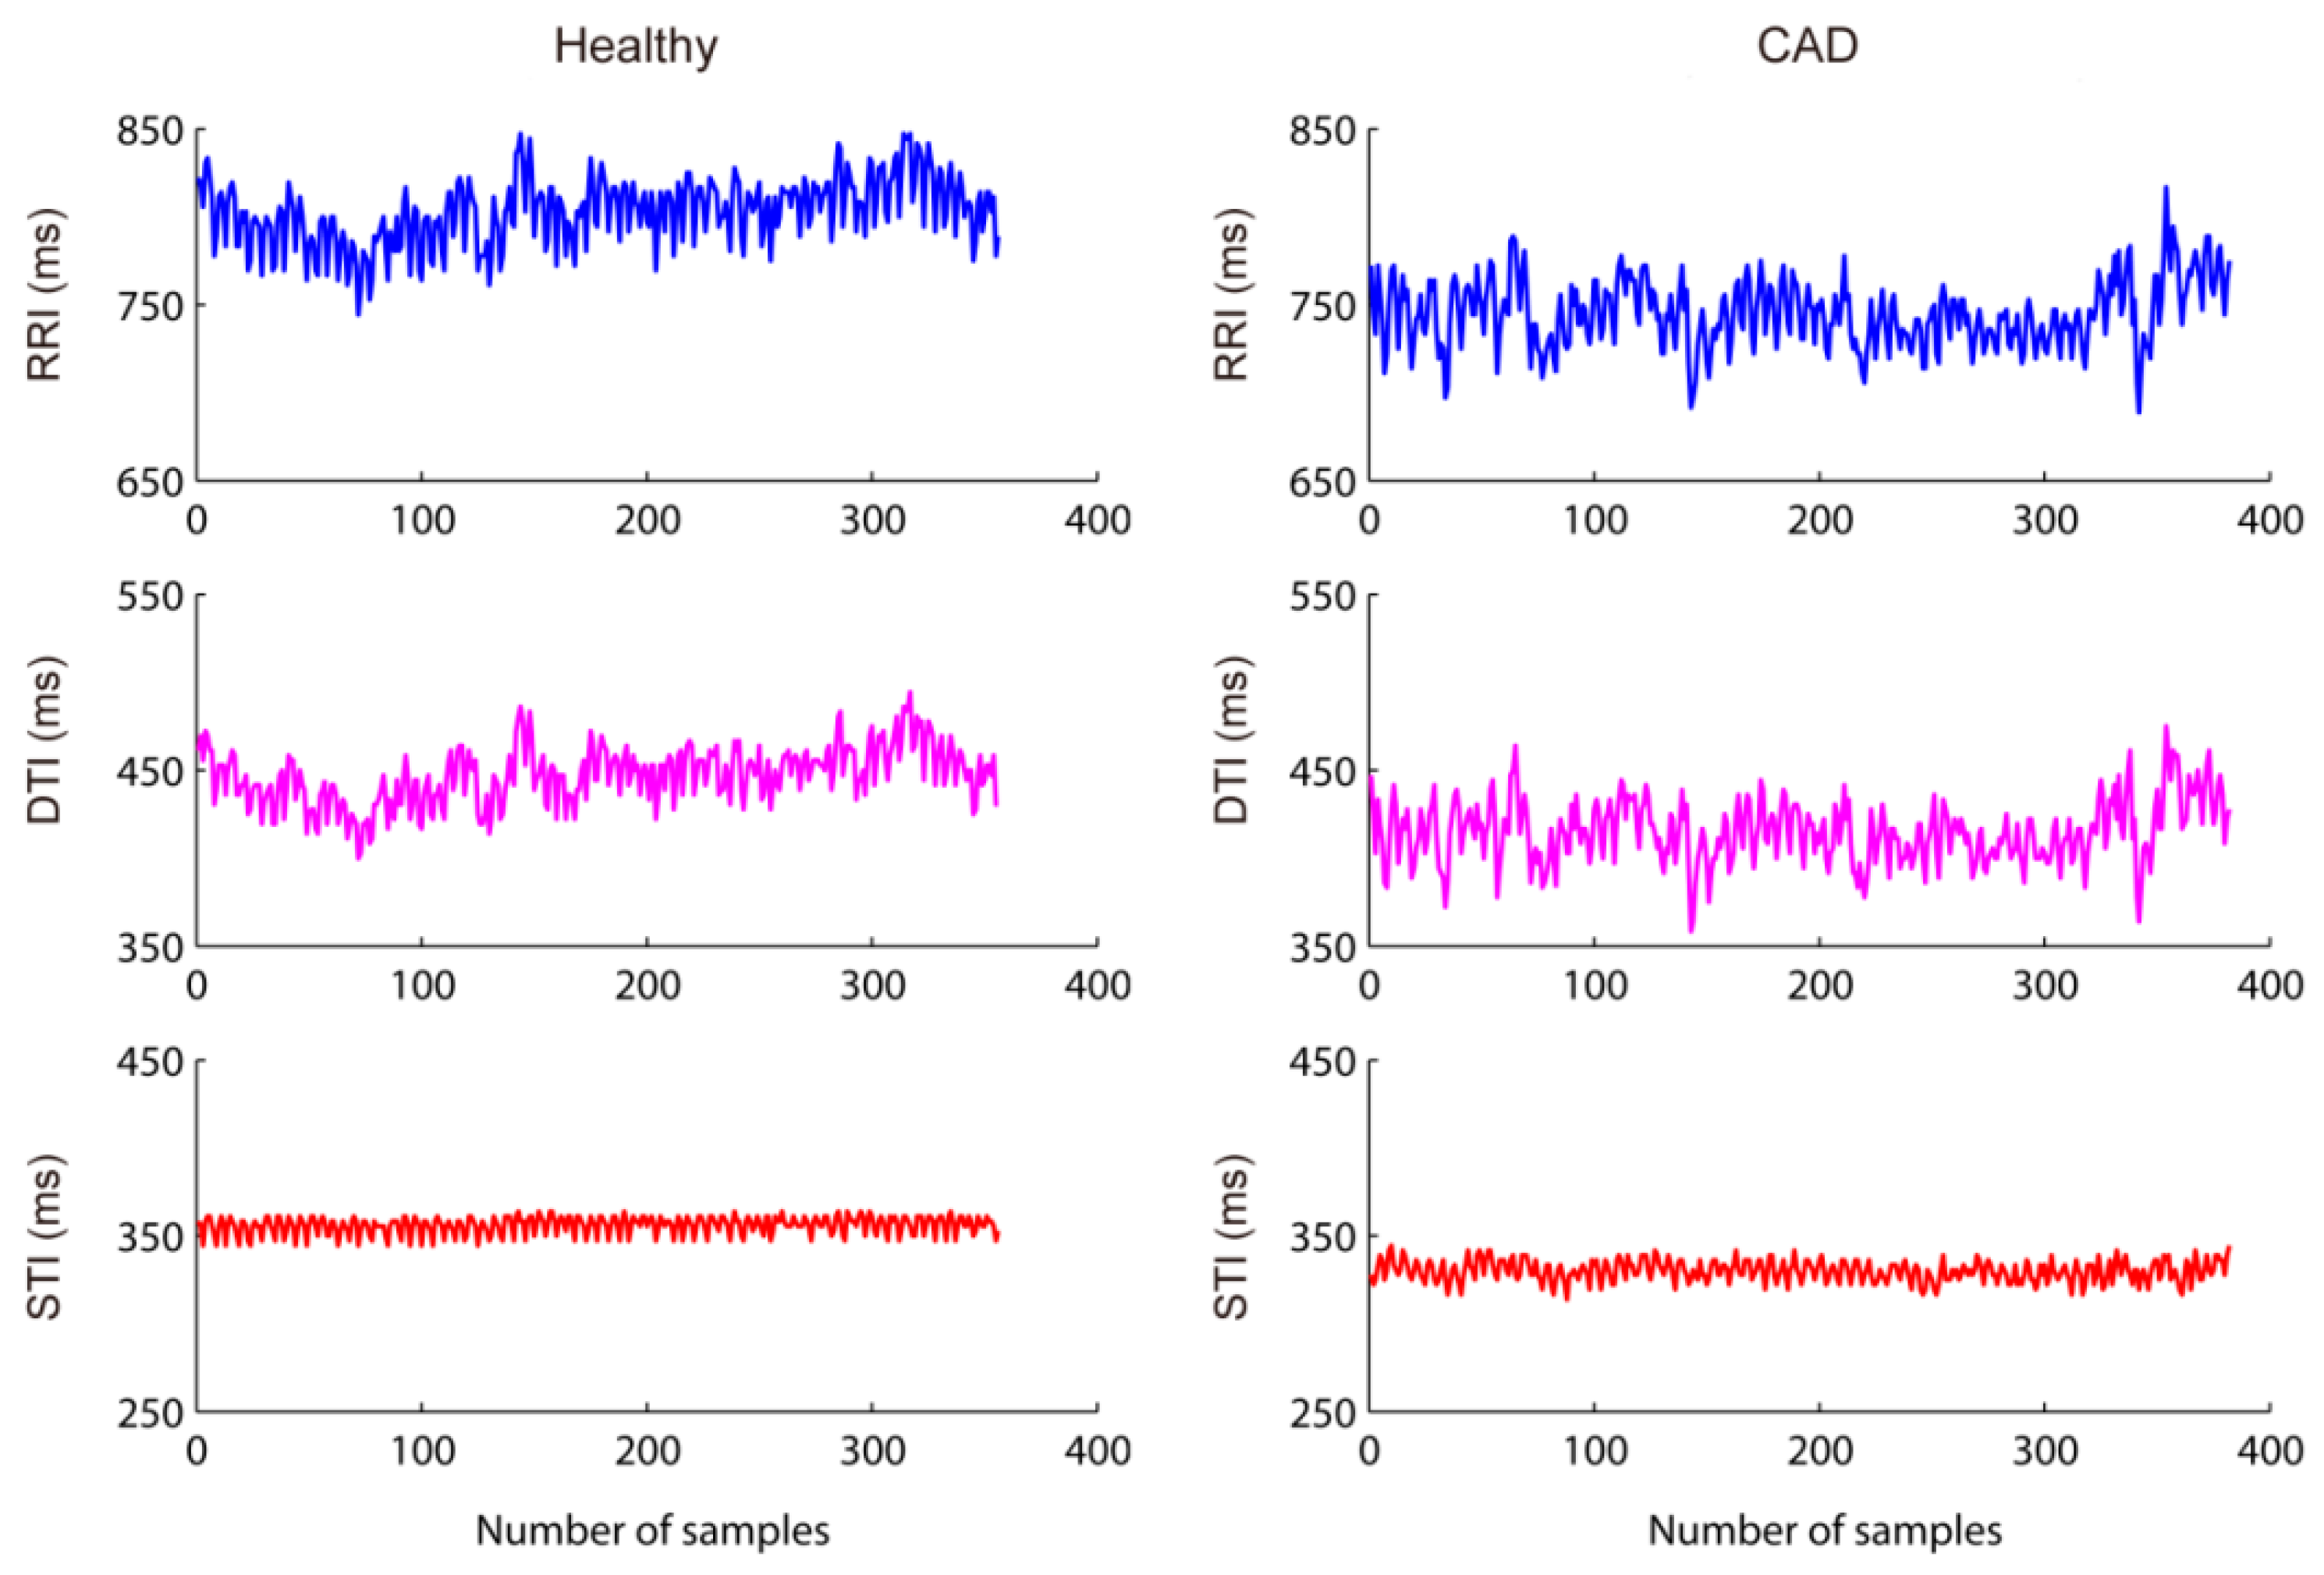
3.3. Construction of RRI, STI, and DTI Time-Series

RRI, STI, and DTI series were used to electrical and mechanical time series, as mentioned in the Introduction. In order to construct these time-series, certain feature points were extracted firstly from the ECG and PPG recordings based on customized MATLAB (Version R2013a, MathWorks, USA) programs. Specifically, R-wave peaks of ECG signals were extracted by a template-matching method [42]. The systolic feet and dicrotic notches of PPG signals were detected with the help of the first- and second-order differential counterparts of PPG [14,15,43]. The raw RRI series was then formed by consecutive R-R intervals. The raw STI series was constructed by interval between the systolic foot and dicrotic notch of PPG waveform in the same cardiac cycle, whereas DTI by interval between the dicrotic notch and the systolic foot of the following cardiac cycle. A schematic diagram describing their construction procedures can be found in Figure 2. Anomalous intervals due to ectopic beats or poor signal quality in RRI series were finally detected and removed [44]. Meanwhile, the corresponding intervals in STI and DTI were also removed in order to consolidate their lengths. Note here none of the participants with more than 10% anomalous intervals was screened.

3.4. RRI-STI, RRI-DTI, and STI-DTI Coupling Analysis

The above-reviewed six coupling measurements (i.e., CC, CF, MI, XCE, XSampEn, and XFuzzyEn) were applied to bivariate RRI-STI series, RRI-DTI series, and STI-DTI series. M x and M y were set equally at M = 256 for MI. For XCE, the quantization level ξ was set at 6. The threshold value r was set at 0.2 for both XSampEn and XFuzzyEn. The embedding dimension m and time delay τ were set at 2 and 1, respectively, for XCE, XSampEn, and XFuzzyEn.

3.5. Statistical Analysis

Results of all coupling measurements were compared between healthy subjects and CAD patients by the nonparametric Mann-Whitney U test since our sample size was relatively small. Statistical significance was accepted at p < 0.05. Furthermore, p < 0.008 (=0.05/6) was accepted as more significant in order to reduce the type I error as suggested by Bonferroni correction. Statistical analyses were performed using the SPSS software (Ver. 20, IBM, Armonk, NY, USA).

4. Results

Figure 3 shows two examples of RRI, STI, and DTI time-series from a healthy subject and a CAD patient, respectively. On a whole, the absolute values of all three series decrease in the CAD patient compared with the healthy subject, indicating an increased heart rate. Besides, DTI and RRI show large fluctuations and they seem to be highly synchronized in both subjects, whereas STI has relatively small variance and does not indicate clear relation to the other two series.

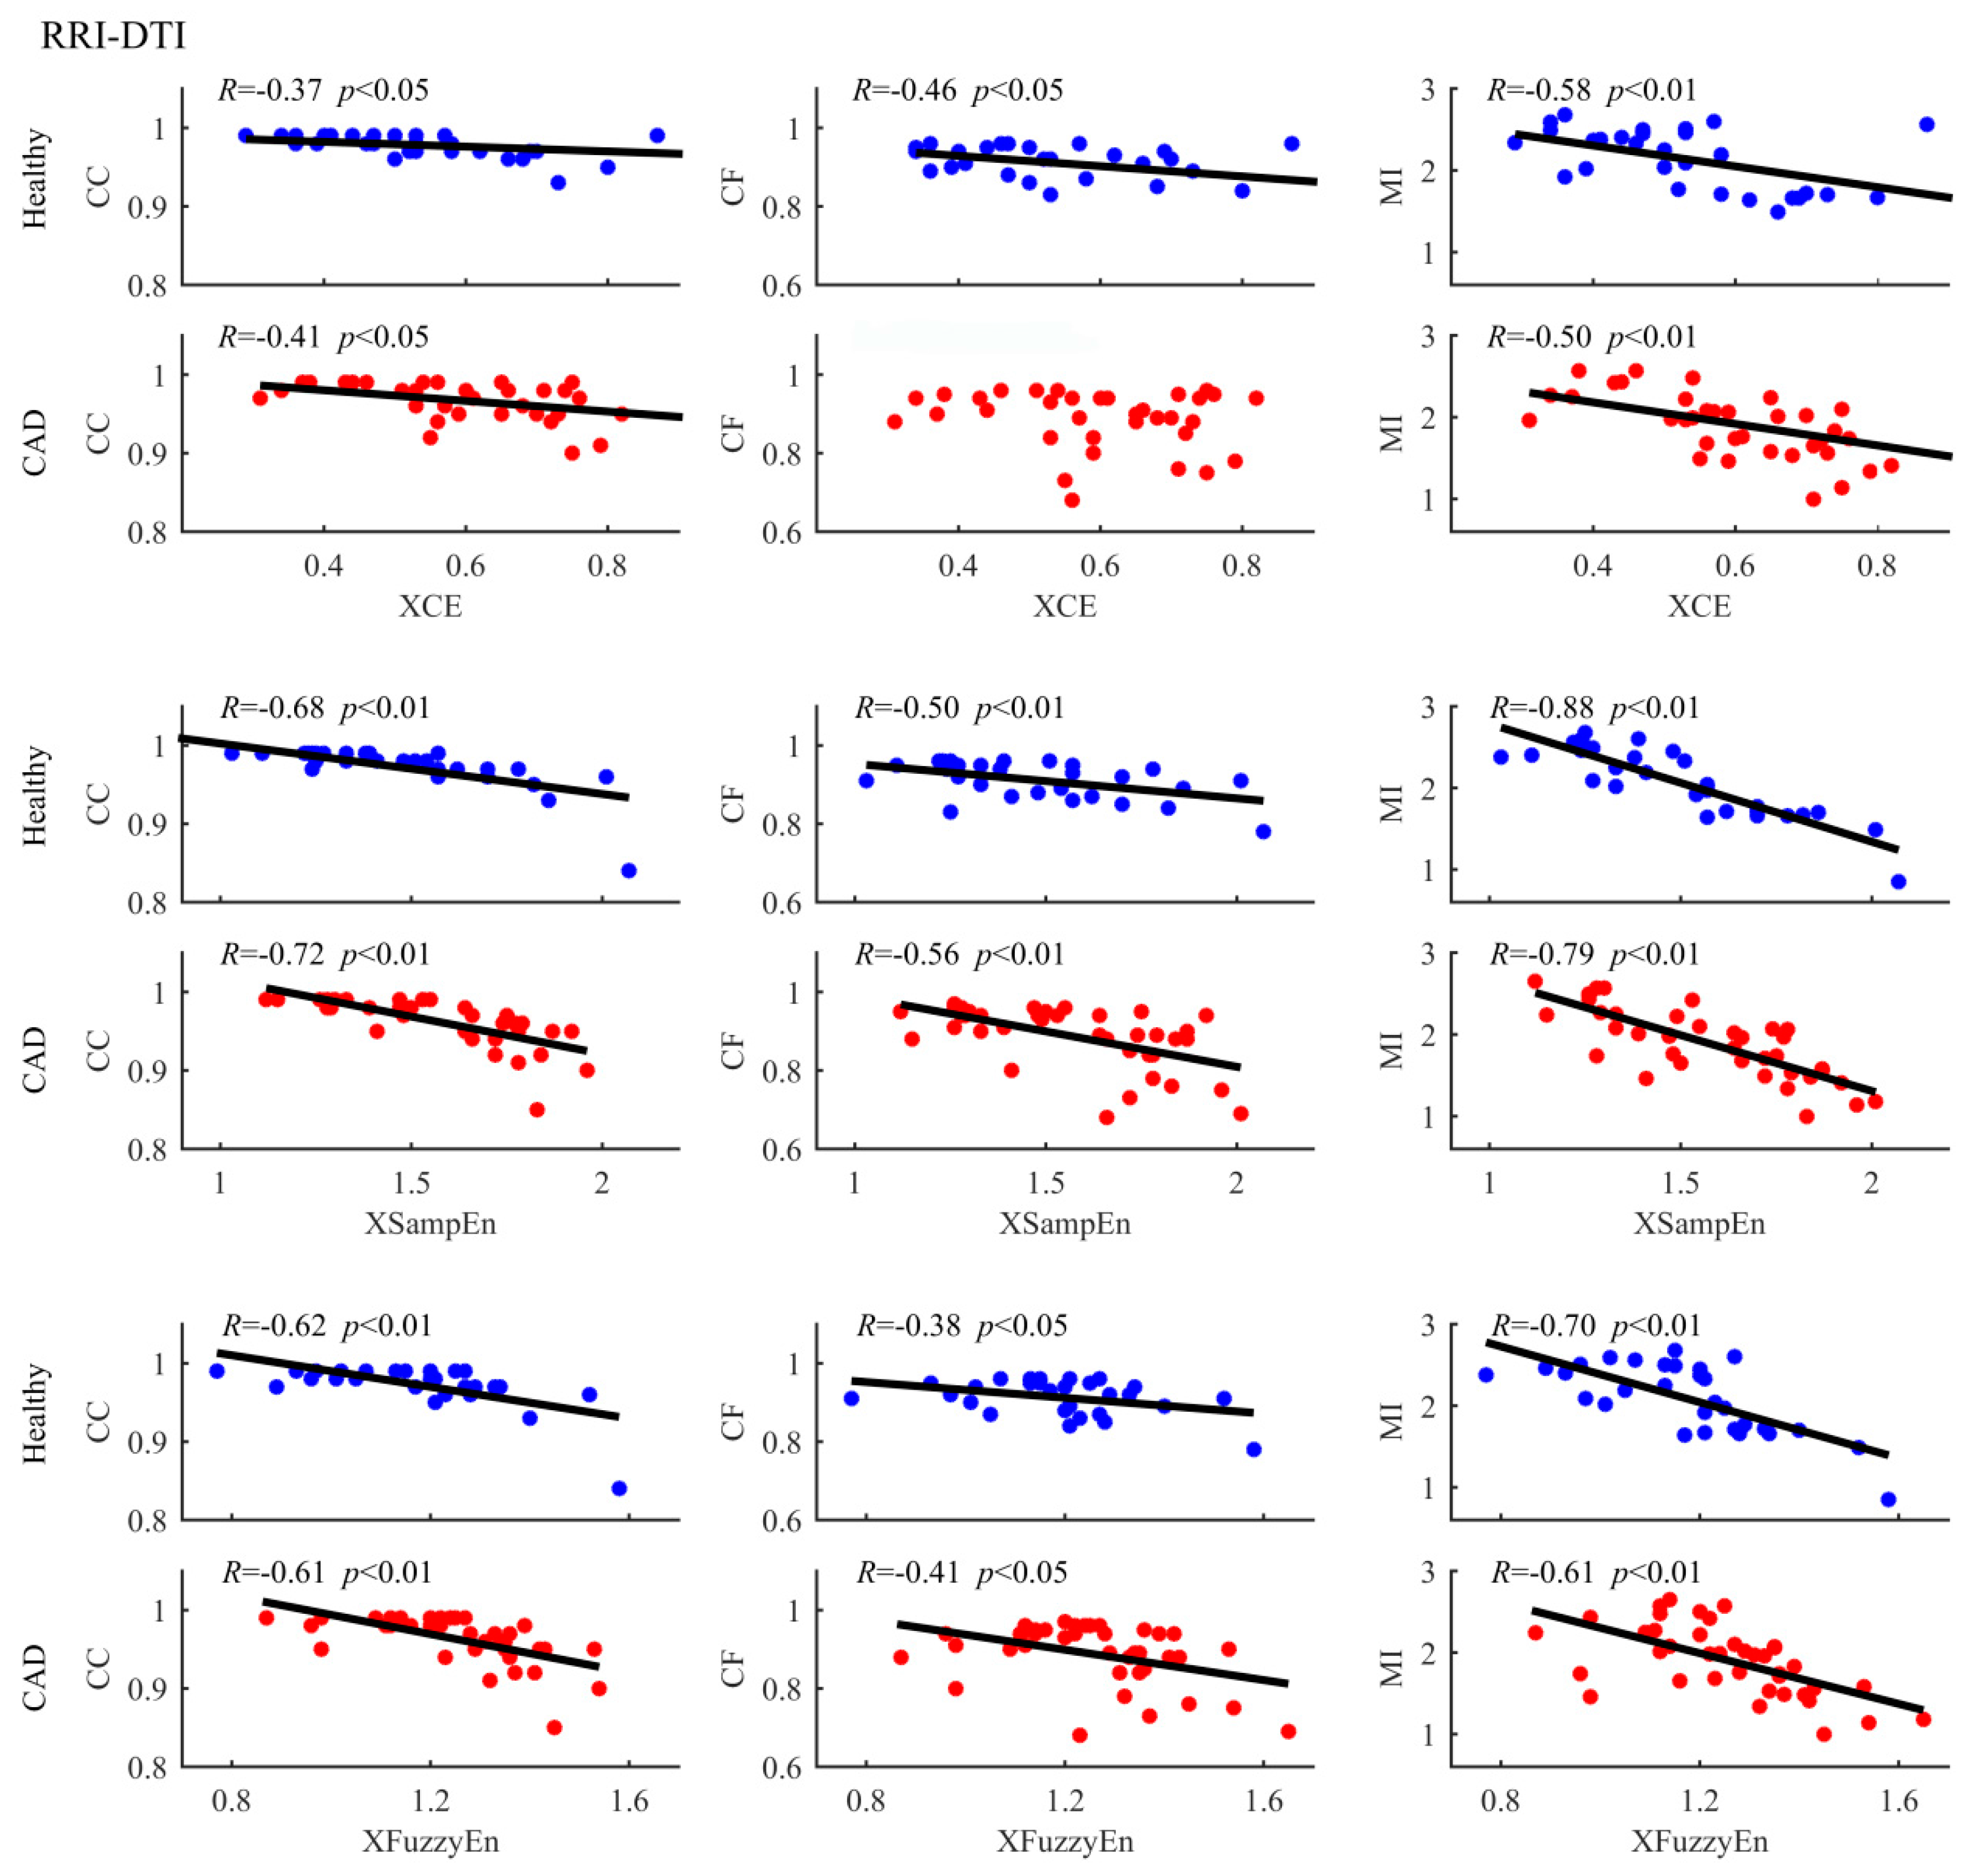
4.1. RRI-DTI Coupling Analysis Results

Results of the six coupling measurements on RRI-DTI analysis are given in Table 2. CC, CF, and MI decrease whereas XCE, XSampEn, and XFuzzyEn increase in CAD patients compared with healthy subjects, all of which indicate a reduced RRI-DTI coupling. However, among the six measurements, only XCE and XFuzzyEn show statistically significant increase (both p ≤ 0.03). Differences of CC, MI, and XSampEn results are all less significant (p = 0.06, 0.05, and 0.07, respectively). CF does not suggest significant difference between the two groups (p = 0.82).

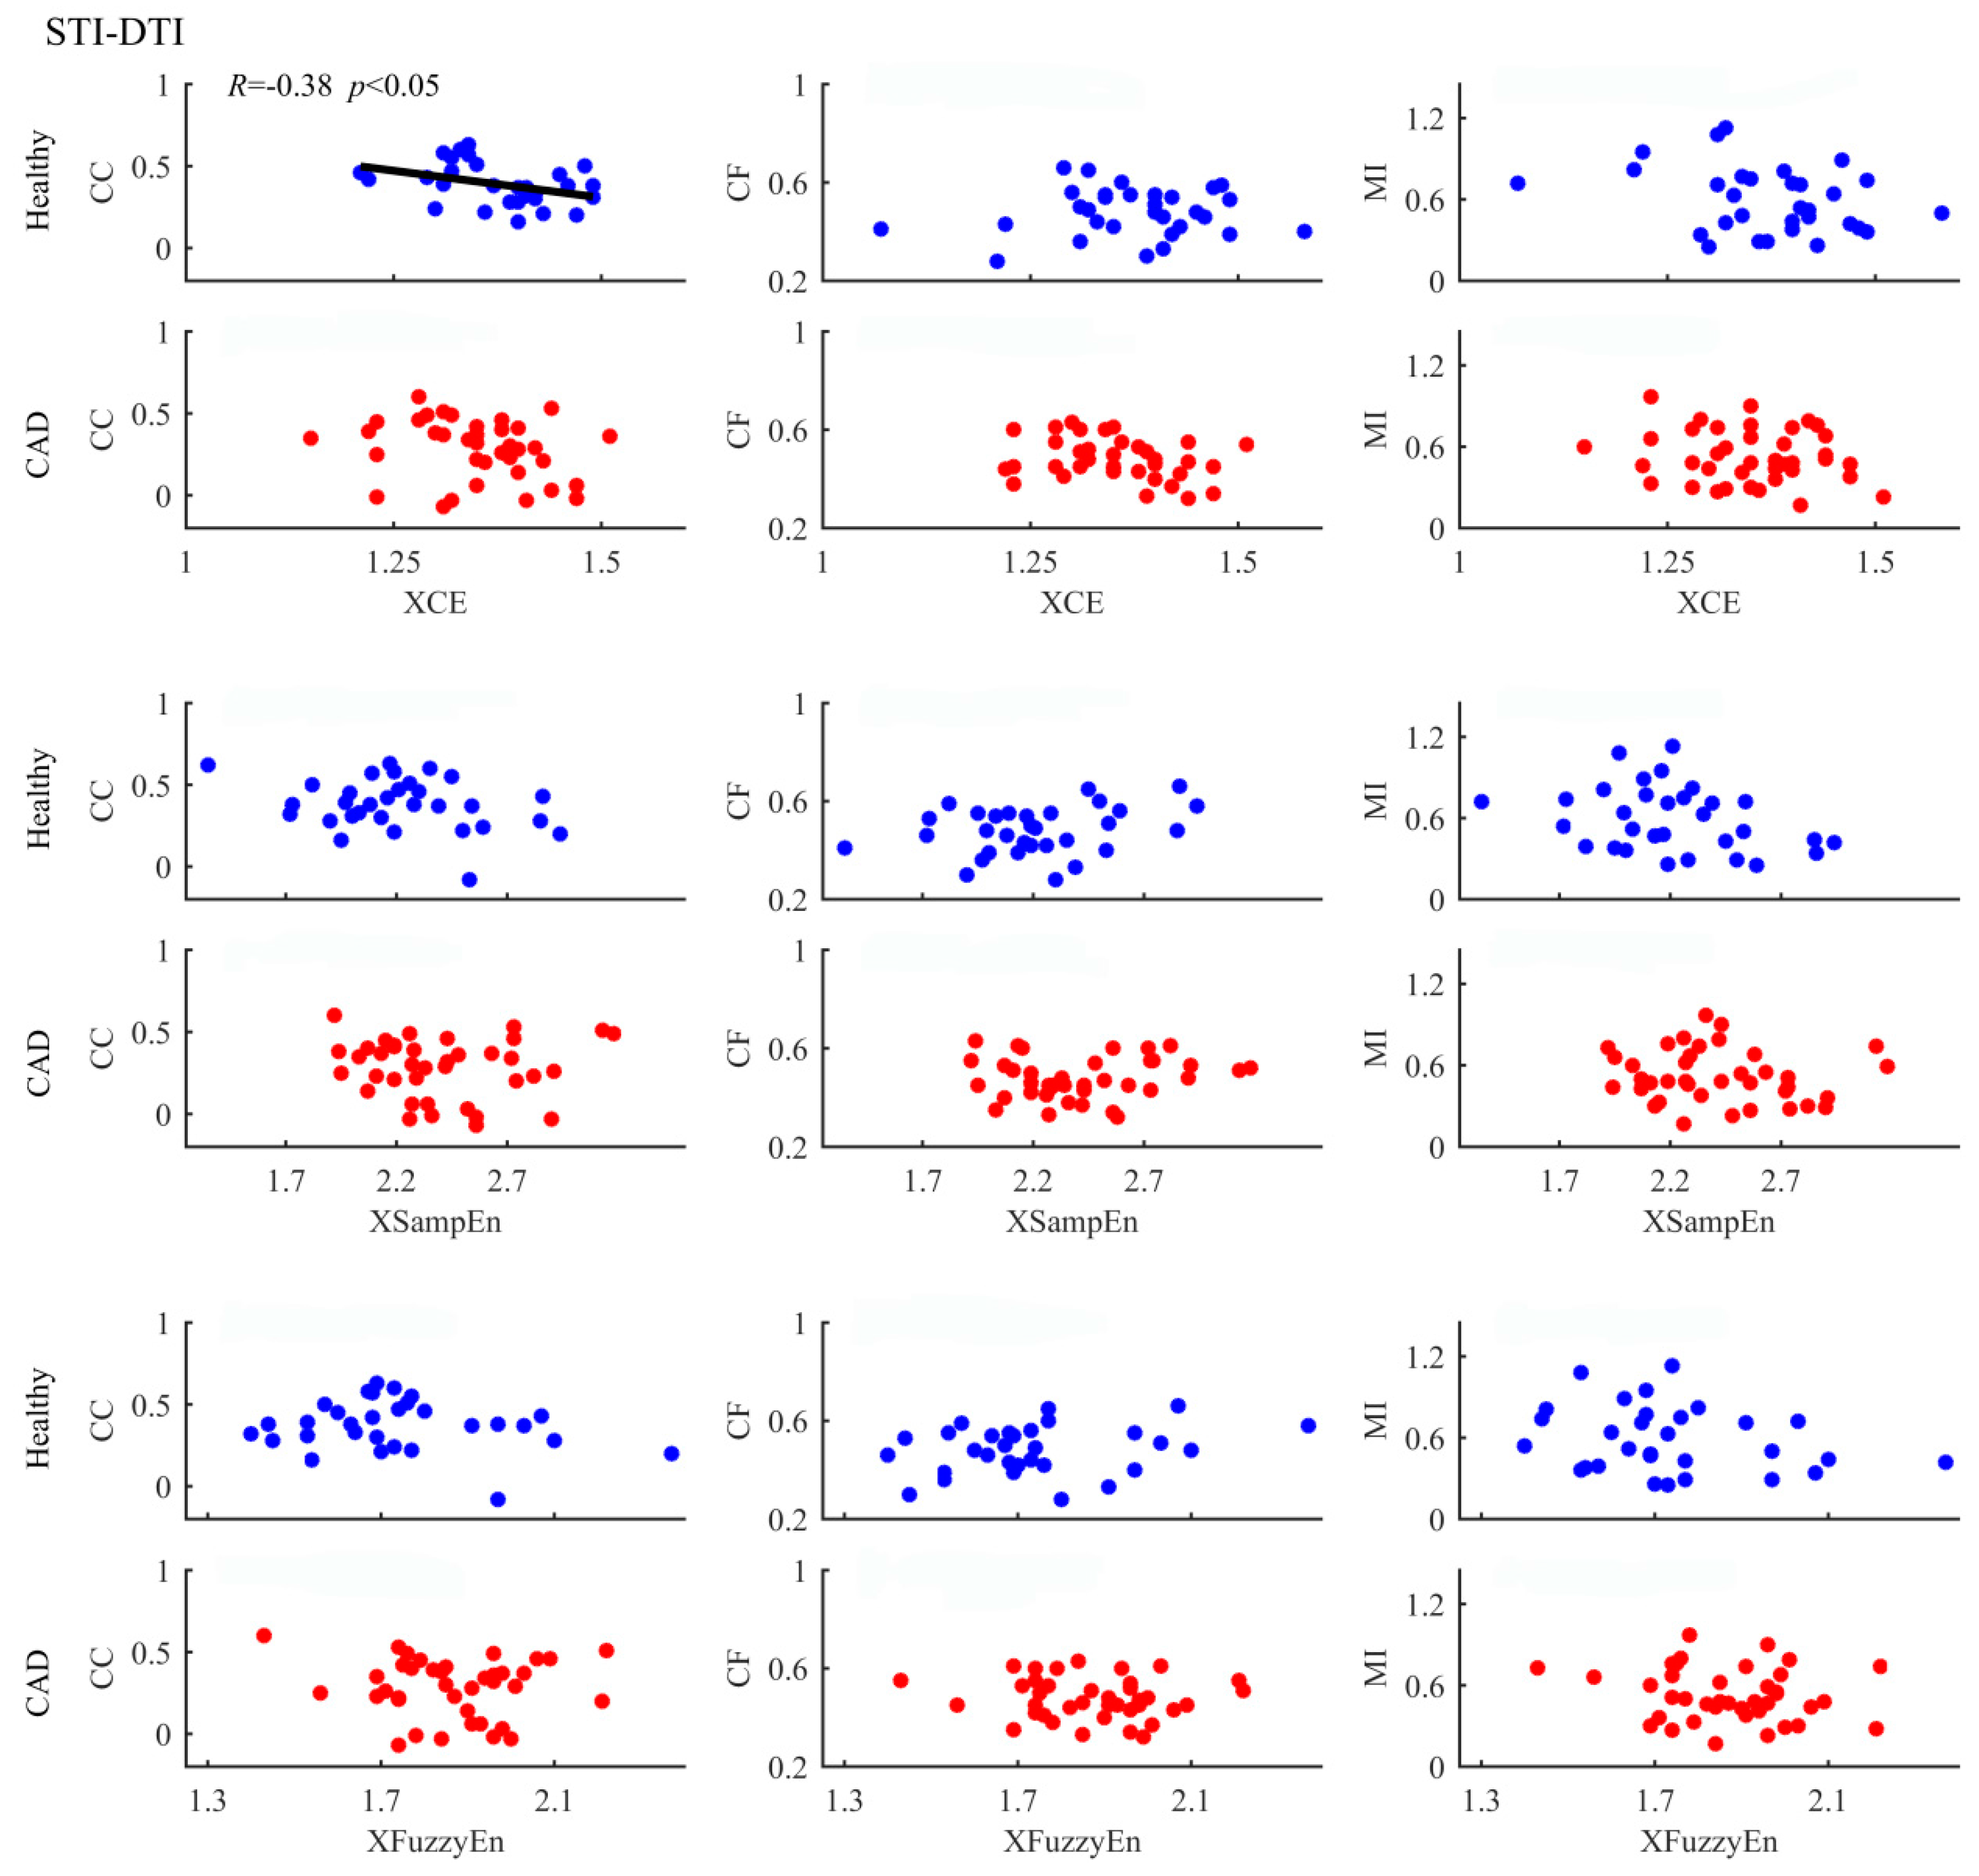
4.2. STI-DTI Coupling Analysis Results

Table 3 summarizes the STI-DTI coupling analysis results. Similar to RRI-DTI coupling, the STI-DTI coupling reduces in CAD patients as indicated by the decreased CC, CF, and MI as well as the increased XCE, XSampEn, and XFuzzyEn. However, only XFuzzyEn among the six measurements shows statistical significance (p < 0.008); XCE and XSampEn show less statistical significance (p = 0.08 and p = 0.05); no significant difference between the two groups is indicated by CC, CF, and MI (p = 0.25, p = 0.55, and p = 0.36, respectively).

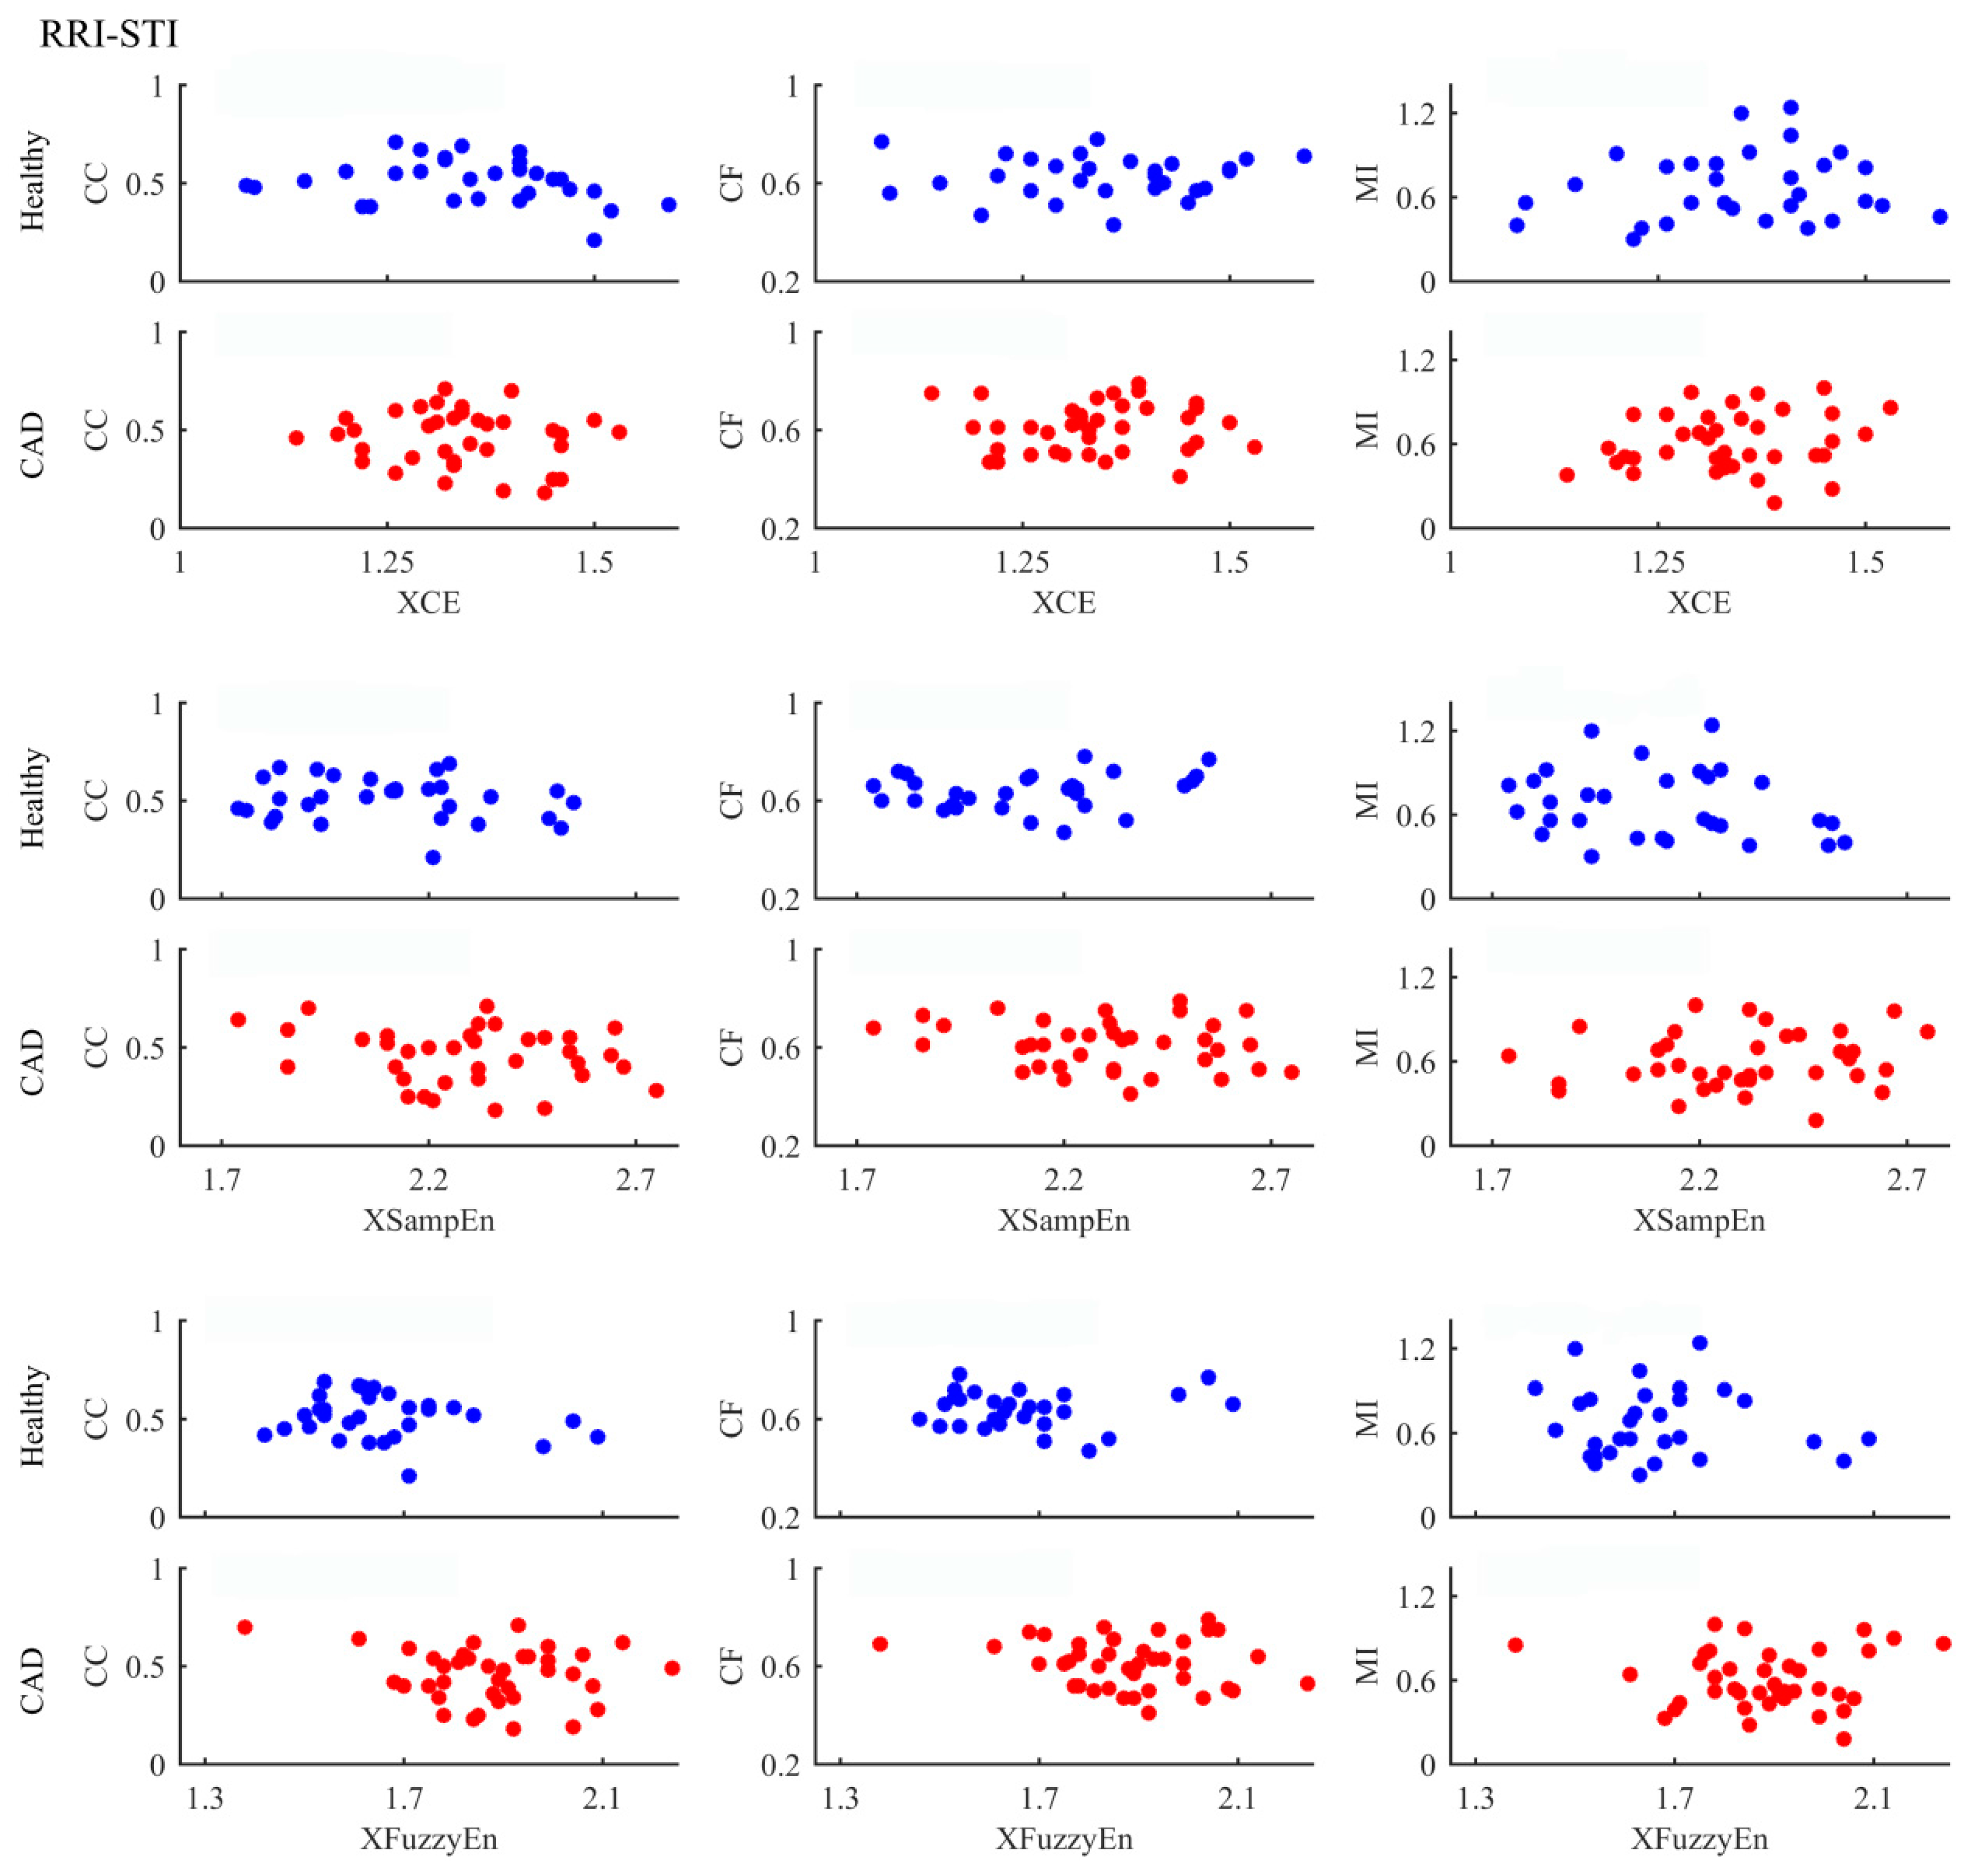
4.3. RRI-STI Coupling Analysis Results

The RRI-STI coupling analysis results are shown in Table 4. All measurements again indicate a reduced RRI-STI coupling in CAD patients compared with healthy subjects except XCE which suggests a tiny increase of coupling. Additionally, among the six coupling measurements, still only the change of XFuzzyEn has statistical significance (p < 0.008). CC and XSampEn are both less significant (p = 0.08 and p = 0.04, respectively). CF, MI, and XCE however do not suggest statistically significant difference (all p > 0.05).

5. Discussion

Coronary artery disease (CAD) has attracted the interest of many researchers for its high morbidity and mortality. Many studies have been performed based on analysis of body surface signals for the purpose of realizing CAD noninvasive detection. Diastolic heart sounds was analysed by a technique using wavelet analysis and artificial neural network to detect CAD [45]. While diastolic murmurs were studied by Zhao and Ma [46], they proposed a technique based on the empirical mode decomposition-teager energy operator for feature extraction and back propagation neural network as the classifier for CAD diagnosis. Babaoglu et al. [47] reported the effects of principle component analysis on the assessment of heart rate, blood pressure and exercise time during the exercise stress test with support vector machine in CAD determination. The same year, they employed binary particle swarm optimization and genetic algorithm techniques to select useful features from exercise stress testing data obtained from the same dataset [48]. Patidar et al. presented a new method for diagnosis of CAD using tunable-Q wavelet transform based features extracted from heart rate signals [49]. Many linear and nonlinear parameters are extracted from heart rate signals and used as diagnostic features to predict the subjects with CAD [3,4,5,6], the features were then fed into classifiers for automated diagnosis of CAD subjects [4,5,6]. In our previous publication, we have reported the univariate analysis results for RRI and DTI (analysis of RRI is also performed in this study, the results are shown in Table S1 in supplementary materials), using sample entropy, fuzzy entropy, and refined fuzzy entropy. The results showed only the refined fuzzy entropy of DTI had significant difference between CAD patients and healthy subjects [10]. In another previous study, we found that the RRI-DTI coupling in heart failure patients had dramatically changes [14], so we came up with the current idea of exploring the changes in electromechanical coupling.
This work systematically explored the electromechanical coupling using six widely-used coupling measurements—cross correlation (CC), coherence function (CF), mutual information (MI), cross-conditional entropy (XCE), cross-sample entropy (XSampEn), and cross-fuzzy entropy (XFuzzyEn). Overall, our results indicated a loss of electromechanical coupling in patients with coronary artery disease (CAD). Generally, the RR interval (RRI)-diastolic time interval (DTI), systolic time interval (STI)-DTI, and RRI-STI coupling all decreased in CAD patients compared with healthy subjects, but the statistical significance varied among different analysis—XCE, XSampEn, and XFuzzyEn all showed significant for the three coupling analysis except XSampEn for RRI-DTI and XCE for STI-DTI and RRI-STI coupling analysis whereas CC, CF, and MI generally did not show statistical significance for all three coupling analysis. If we further applied the Bonferroni correction, only XFuzzyEn for STI-DTI and RRI-STI coupling analysis showed statistical significance. On one hand, the decrease is reminiscent of previous studies on RRI-DTI coupling which have proved that both healthy aged subjects and heart failure patients are accompanied with decreased RRI-DTI coupling [14]. According to our results, patients with CAD display a loss of electromechanical coupling. This loss suggests that the dysfunction of cardiovascular system might lead to reduced electromechanical coordination, which could be explained by silent myocardial ischemia [50]. The stimuli for mechanical and chemical receptors in ventricular wall caused by myocardial ischemia and hypoxia will change the balance of cardiac autonomic regulation. Myocardial ischemia thus might combine to alternation in excitability, conduction, contractility and abnormal automaticity [50,51,52], which may then lead to the loss of cardiac ability—immediate mechanical response to the electrical pacing period [14] and irregular contractions. On the other hand, the results suggest that compared with linear CC, CF, and nonlinear MI, the three entropy-based measurements—XCE, XSampEn, and XFuzzyEn—perform better in measuring the electromechanical coupling. This is in accordance with many previous studies which have shown that entropy-based methods generally are better capable for measuring nonlinear features of cardiovascular system [10,26,32,53]. Furthermore, XFuzzyEn performed best which supports our previous study that the refined fuzzy membership function is capable to improve the stability and distinguishability of traditional entropy measures [10].
We used six different methods and the results showed that some methods were able and some unable to detect the differences between groups. Besides, the three cross entropy methods worked better in term of statistical significance. We expect that different methods will unveil different aspects of coupling, which means the three cross entropy methods can provide additional information. Therefore, correlation analysis between entropy-based measurements and others were further performed in order to better understand our results. Figure 4, Figure 5 and Figure 6 summarize the correlation analysis results for the three coupling types, respectively. The fitting lines and the corresponding R and p values are also shown when significant correlation is reported. Almost all entropy-based measurements were not correlated with others for STI-DTI and RRI-STI coupling except XCE which indicated a weak correlation with CC for STI-DTI coupling in healthy subjects (p = 0.04). The results of entropy-based and other methods with no correlation can support our hypothesis that the cross entropy did provide additional information which can be attributed to the intrinsic coupling in electromechanical time series may be nonlinear in nature as they are mostly not correlated with the other three methods for RRI-STI and STI-DTI coupling, even in some cases both the cross entropy and the other methods showed significant difference between groups. But for RRI-DTI coupling, they are highly correlated. We assumed that this tightly correlation might come from the clear linear relation between RRI and DTI which might have a considerable weight even in the nonlinear cross entropy results.
Additionally, Figure 3 shows averagely decreased RR interval in the CAD patients which suggests an increased resting heart rate. This phenomenon has been reported in cardiac autonomic neuropathy positive subjects [8,54]. This can be explained that silent myocardial ischemia might result in the depression of blood pressure, which further induce barorecepter reflex [55]. The higher heart rate could bring about incomplete relaxation of ventricle, and might further lead to left ventricular hypertrophy—an important prognostic marker in CAD patients [56,57]. Besides, the variation of DTI well follows RRI in both the healthy subject and the CAD patients, as shown in Figure 3, which might demonstrate certain evidence regarding why linear measurements failed in the detection of electromechanical coupling—the coupling change is nonlinear in nature whereas the linear correlation between time-series is unchanged.
Our results indicate that patients with established CAD showed decreased cardiac electromechanical coupling. To test whether this loss in cardiac electromechanical coupling accompanies CAD development, it should be worth tracking its longitudinal change in subjects that do not have CAD at baseline but develop clinical evident CAD at follow-up. It will also be interesting to test whether this coupling could be restored in CAD patients after certain clinical interventions (e.g., intracoronary stenting). These two studies could help to understand whether the cardiac electromechanical coupling can work as a noninvasive biomarker for CAD. In addition, we have previously investigated how the complexity levels of RRI and DTI respectively change between CAD patients and healthy subjects. Since we did not perform classification in both the previous univariate study and the current bivariate coupling study, we can hardly compare these two results only according to the statistical significance (p values). Besides, a combination of both univariate and bivariate methods may potentially be better for classifying CAD patients from healthy volunteers compared with each separate performance. In our future studies, we plan to explore proper classifiers to test both classification performance and to possibly combine the univariate and bivariate analysis results with an aim of classifying CAD patients from healthy subjects. Furthermore, researchers have found the advantage of symbolic coupling traces to analyze coupling of HRV and blood pressure variability in sleep disorder patients [58,59,60], this might provide us new ideas in further study.

6. Conclusions

This study systematically investigated the RRI-DTI, STI-DTI, and RRI-STI coupling in healthy subjects and CAD patients using six widely applied coupling measurements. Our results indicate that electromechanical coupling could be better measured by nonlinear entropy-based methods. Besides, CAD patients displayed a loss of electromechanical coupling. Our study provides an indication that cardiac electromechanical coupling may potentially work as a noninvasive diagnostic tool for CAD, though the results are very preliminary indeed. To further test this hypothesis, additional studies as discussed above are warranted. Besides, such a noninvasive tool could also be helpful for long-term monitoring of CAD patients and the evaluation of different intervention approaches and prognosis in clinical practice.

Supplementary Materials

The following are available online at www.mdpi.com/1099-4300/18/4/153/s1, Table S1: HRV analysis results in terms of time-domain, frequency-domain, and nonlinear measurements.

Acknowledgments

This work was supported by the National Natural Science Foundation of China (No. 61471223, No. 61501280) ), Shandong Provincial Natural Science Foundation of China (No. ZR2015FQ016) and Shandong Provincial Science and Technology Development Plan of China (No. 2014GSF11803, No. 2015GSF118179). We would like to thank all the participants and researchers who participated in this study.

Author Contributions

Lizhen Ji and Peng Li analysed the data; Lizhen Ji, Peng Li, and Chengyu Liu interpreted the results; Lizhen Ji, Peng Li, and Chengyu Liu wrote the manuscript; Lizhen Ji and Xinpei Wang performed the experiments; Jing Yang and Changchun Liu designed and guided the whole study. All authors read and approved the final manuscript.

Conflicts of Interest

The authors declare no conflict of interest.

Abbreviations

The following abbreviations are used in this manuscript:
CAD
coronary artery disease
RRI
heartbeat interval
DTI
diastolic time interval
STI
systolic time interval
ECG
electrocardiograph
PPG
photoplethysmography
CC
correlation coefficient
CF
coherence function
MI
mutual information
XCE
cross-conditional entropy
XSampEn
cross-sample entropy
XFuzzyEn
cross-fuzzy entropy
RAP
radial artery pressure
BMI
body mass index
DBP
diastolic blood pressure
SBP
systolic blood pressure
SD
standard deviation

References

  1. Akselrod, S.; Gordon, D.; Ubel, F.A.; Shannon, D.C.; Berger, A.C.; Cohen, R.J. Power spectrum analysis of heart rate fluctuation: A quantitative probe of beat-to-beat cardiovascular control. Science 1981, 213, 220–222. [Google Scholar] [CrossRef] [PubMed]
  2. Makikallio, T.H.; Hoiber, S.; Kober, L.; Torp-Pedersen, C.; Peng, C.K.; Goldberger, A.L.; Huikuri, H.V. Fractal analysis of heart rate dynamics as a predictor of mortality in patients with depressed left ventricular function after acute myocardial infarction. Am. J. Cardiol. 1999, 83, 836–839. [Google Scholar] [CrossRef]
  3. Acharya, U.R.; Faust, O.; Sree, V.; Swapna, G.; Martis, R.J.; Kadri, N.A.; Suri, J.S. Linear and nonlinear analysis of normal and CAD-affected heart rate signals. Comput. Meth. Prog. Biomed. 2014, 113, 55–68. [Google Scholar] [CrossRef] [PubMed]
  4. Giri, D.; Rajendra Acharya, U.; Martis, R.J.; Vinitha Sree, S.; Lim, T.-C.; Ahamed, T.; Suri, J.S. Automated diagnosis of coronary artery disease affected patients using LDA, PCA, ICA and discrete wavelet transform. Knowl. Based Syst. 2013, 37, 274–282. [Google Scholar] [CrossRef]
  5. Dua, S.; Du, X.; Sree, V.S.; Ahamed, T.V.I. Novel classification of coronary artery disease using heart rate variability analysis. J. Mech. Med. Biol. 2012, 12, 1240017. [Google Scholar] [CrossRef]
  6. Lee, H.G.; Noh, K.Y.; Ho, K. Mining biosignal data: Coronary artery disease diagnosis using linear and nonlinear features of HRV. Lect. Notes Comput. Sci. 2007, 4819, 218–228. [Google Scholar]
  7. Ferro, G.; Piscione, F.; Carella, G.; Betocchi, S.; Spinelli, L.; Chiariello, M. Systolic and diastolic time intervals during spontaneous angina. Clin. Cardiol. 1984, 7, 588–592. [Google Scholar] [CrossRef] [PubMed]
  8. Imam, M.H.; Karmakar, C.K.; Jelinek, H.F.; Palaniswami, M.; Khandoker, A.H. Analyzing systolic-diastolic interval interaction characteristics in diabetic cardiac autonomic neuropathy progression. IEEE JTEHM 2015, 3, 1900510. [Google Scholar] [CrossRef]
  9. Fossa, A.A.; Zhou, M.J.; Robinson, A.; Purkayastha, J.; Martin, P. Use of ECG restitution (beat-to-beat QT-TQ interval analysis) to assess arrhythmogenic risk of QTc prolongation with guanfacine. Ann. Noninvasive Electrocardiol. 2014, 19, 582–594. [Google Scholar] [CrossRef] [PubMed]
  10. Ji, L.Z.; Li, P.; Li, K.; Wang, X.P.; Liu, C.C. Analysis of short-term heart rate and diastolic period variability using a refined fuzzy entropy method. Biomed. Eng. Online 2015, 14. [Google Scholar] [CrossRef] [PubMed]
  11. Hirose, K.; Reed, J.E.; Rumberger, J.A. Serial changes in left and right ventricular systolic and diastolic dynamics during the first year after an index left ventricular Q wave myocardial infarction. J. Am. Coll. Cardiol. 1995, 25, 1097–1104. [Google Scholar] [CrossRef]
  12. Liu, C.Y.; Liu, C.C.; Li, L.P.; Zhang, Q.G.; Li, B. Systolic and diastolic time interval variability analysis and their relations with heart rate variability. In Proceedings of 3rd International Conference on Bioinformatics and Biomedical Engineering (ICBBE), Beijing, China, 11–13 June 2009; pp. 2609–2612.
  13. Carrasco-Sosa, S.; Guillen-Mandujano, A. Variability of left ventricular ejection and diastolic times obtained from impedance cardiography: A comparison with heart rate variability. In Proceedings of Computing in Cardiology, Zaragoza, Spain, 22–25 September 2013; pp. 405–408.
  14. Li, P.; Ji, L.; Yan, C.; Li, K.; Liu, C.; Liu, C. Coupling between short-term heart rate and diastolic period is reduced in heart failure patients as indicated by multivariate entropy analysis. In Proceedings of Computing in Cardiology, Cambridge, UK, 7–10 September 2014; pp. 97–100.
  15. Li, P.; Liu, C.; Sun, X.; Ren, Y.; Yan, C.; Yu, Z.; Liu, C. Age related changes in variability of short-term heart rate and diastolic period. In Proceedings of Computing in Cardiology, Zaragoza, Spain, 22–25 September 2013; pp. 995–998.
  16. Li, P.; Karmakar, C.; Liu, C.; Liu, C. Analysing effect of heart rate and age on radial artery pressure derived systolic and diastolic durations in healthy adults. In Proceedings of Computing in Cardiology, Nice, France, 7–9 September 2015; pp. 381–384.
  17. Fossa, A.A.; Wisialowski, T.; Crimin, K.; Wolfgang, E.; Couderc, J.P.; Hinterseer, M.; Kaab, S.; Zareba, W.; Badilini, F.; Sarapa, N. Analyses of dynamic beat-to-beat QT-TQ interval (ECG restitution) changes in humans under normal sinus rhythm and prior to an event of torsades de pointes during QT prolongation caused by sotalol. Ann. Noninvasive Electrocardiol. 2007, 12, 338–348. [Google Scholar] [CrossRef] [PubMed]
  18. Dorland. Dorland’s Illustrated Medical Dictionary, 32rd ed.; Saunders: Chicago, IL, USA, 2011. [Google Scholar]
  19. Franaszczuk, P.J.; Bergey, G.K. An autoregressive method for the measurement of synchronization of interictal and ictal EEG signals. Biol. Cybern. 1999, 81, 3–9. [Google Scholar] [CrossRef] [PubMed]
  20. Alonso, J.F.; Mananas, M.A.; Romero, S.; Rojas-Martinez, M.; Riba, J. Cross-conditional entropy and coherence analysis of pharmaco-EEG changes induced by alprazolam. Psychopharmacology 2012, 221, 397–406. [Google Scholar] [CrossRef] [PubMed] [Green Version]
  21. Breakspear, M. “Dynamic” connectivity in neural systems: Theoretical and empirical considerations. Neuroinformatics 2004, 2, 205–226. [Google Scholar] [CrossRef]
  22. Dauwels, J.; Vialatte, F.; Musha, T.; Cichocki, A. A comparative study of synchrony measures for the early diagnosis of alzheimer’s disease based on EEG. NeuroImage 2010, 49, 668–693. [Google Scholar] [CrossRef] [PubMed]
  23. Xie, H.B.; Guo, J.Y.; Zheng, Y.P. A comparative study of pattern synchronization detection between neural signals using different cross-entropy measures. Biol. Cybern. 2010, 102, 123–135. [Google Scholar] [CrossRef] [PubMed]
  24. Grossman, P.; Taylor, E.W. Toward understanding respiratory sinus arrhythmia: Relations to cardiac vagal tone, evolution and biobehavioral functions. Biol. Psychol. 2007, 74, 263–285. [Google Scholar] [CrossRef] [PubMed]
  25. Ramirez Avila, G.M.; Gapelyuk, A.; Marwan, N.; Walther, T.; Stepan, H.; Kurths, J.; Wessel, N. Classification of cardiovascular time series based on different coupling structures using recurrence networks analysis. Philos. Trans. A Math. Phys. Eng. Sci. 2013, 371, 20110623. [Google Scholar] [CrossRef] [PubMed]
  26. Wu, H.T.; Liu, C.C.; Lo, M.T.; Hsu, P.C.; Liu, A.B.; Chang, K.Y.; Tang, C.J. Multiscale cross-approximate entropy analysis as a measure of complexity among the aged and diabetic. Comput. Math. Methods Med. 2013, 2013, 324325. [Google Scholar] [CrossRef] [PubMed]
  27. Liu, C.; Zhang, C.; Zhang, L.; Zhao, L.; Liu, C.; Wang, H. Measuring synchronization in coupled simulation and coupled cardiovascular time series: A comparison of different cross entropy measures. Biomed. Signal Process. Control 2015, 21, 49–57. [Google Scholar] [CrossRef]
  28. Kreuz, T.; Mormann, F.; Andrzejak, R.G.; Kraskov, A.; Lehnertz, K.; Grassberger, P. Measuring synchronization in coupled model systems: A comparison of different approaches. Physica D 2007, 225, 29–42. [Google Scholar] [CrossRef]
  29. Ansari-Asl, K.; Senhadji, L.; Bellanger, J.J.; Wendling, F. Quantitative evaluation of linear and nonlinear methods characterizing interdependencies between brain signals. Phys. Rev. E 2006, 74, 031916. [Google Scholar] [CrossRef] [PubMed]
  30. Porta, A.; Baselli, G.; Lombardi, F.; Montano, N.; Malliani, A.; Cerutti, S. Conditional entropy approach for the evaluation of the coupling strength. Biol. Cybern. 1999, 81, 119–129. [Google Scholar] [CrossRef] [PubMed]
  31. Li, P.; Li, K.; Liu, C.; Zheng, D.; Li, Z.-M.; Liu, C. Detection of coupling in short physiological series by a joint distribution entropy method. IEEE Trans. Biomed. Eng. 2016. [Google Scholar] [CrossRef] [PubMed]
  32. Richman, J.S.; Moorman, J.R. Physiological time-series analysis using approximate entropy and sample entropy. Am. J. Physiol. Heart Circ. Physiol. 2000, 278, H2039–H2049. [Google Scholar] [PubMed]
  33. Li, P.; Liu, C.; Wang, X.; Li, B.; Che, W.; Liu, C. Cross-sample entropy and cross-fuzzy entropy for testing pattern synchrony: How results vary with different threshold value r. In Proceedings of the World Congress on Medical Physics and Biomedical Engineering, Beijing, China, 26–31 May 2012; pp. 485–488.
  34. Li, P.; Liu, C.; Wang, X.; Li, L.; Yang, L.; Chen, Y.; Liu, C. Testing pattern synchronization in coupled systems through different entropy-based measures. Med. Biol. Eng. Comput. 2013, 51, 581–591. [Google Scholar] [CrossRef] [PubMed]
  35. Xie, H.B.; Zheng, Y.P.; Guo, J.Y.; Chen, X. Cross-fuzzy entropy: A new method to test pattern synchrony of bivariate time series. Inf. Sci. 2010, 180, 1715–1724. [Google Scholar] [CrossRef]
  36. Feldmann, U.; Bhattacharya, J. Predictability improvement as an asymmetrical measure of interdependence in bivariate time series. Int. J. Bifurc. Chaos 2004, 14, 505–514. [Google Scholar] [CrossRef]
  37. Palus, M.; Stefanovska, A. Direction of coupling from phases of interacting oscillators: An information-theoretic approach. Phys. Rev. E 2003, 67, 055201. [Google Scholar] [CrossRef] [PubMed]
  38. Tallon-Baudry, C.; Bertrand, O.; Delpuech, C.; Pernier, J. Stimulus specificity of phase-locked and non-phase-locked 40 Hz visual responses in human. J. Neurosci. 1996, 16, 4240–4249. [Google Scholar] [PubMed]
  39. Quian Quiroga, R.; Kreuz, T.; Grassberger, P. Event synchronization: A simple and fast method to measure synchronicity and time delay patterns. Phys. Rev. E 2002, 66, 041904. [Google Scholar] [CrossRef] [PubMed]
  40. Halamek, J.; Jurak, P.; Leinveber, P.; Vondra, V.; Couderc, J.P. Comparing the relationship between QT/RR slope and basal QTc in LQT1 patients and healthy subjects. In Proceedings of Computing in Cardiology, Zaragoza, Spain, 22–25 September 2013; pp. 65–68.
  41. Nunez, P.L.; Srinivasan, R. Electric Fields of the Brain: The Neurophysics of EEG, 2nd ed.; Oxford University Press: New York, NY, USA, 2006. [Google Scholar]
  42. Li, P.; Liu, C.; Wang, X.; Zheng, D.; Li, Y.; Liu, C. A low-complexity data-adaptive approach for premature ventricular contraction recognition. Signal Image Video Process. 2014, 8, 111–120. [Google Scholar] [CrossRef]
  43. Yambe, T.; Shiraishi, Y.; Saijo, Y.; Liu, H.; Nitta, S.; Imachi, K.; Baba, A.; Yamaguchi, T.; Sugawara, S.; Katahira, Y.; et al. Clinical research on the accuracy in determining the pulse wave rising point. Scr. Med. 2009, 82, 164–174. [Google Scholar]
  44. Liu, C.Y.; Li, L.P.; Zhao, L.N.; Zheng, D.C.; Li, P.; Liu, C.C. A combination method of improved impulse rejection filter and template matching for identification of anomalous intervals in RR sequences. J. Med. Biol. Eng. 2012, 32, 245–249. [Google Scholar] [CrossRef]
  45. Karimi, M.; Amirfattahi, R.; Sadri, S.; Marvasti, S.A. Noninvasive detection and classification of coronary artery occlusions using wavelet analysis of heart sounds with neural networks. In Proceedings of the 3rd IEE International Seminar on Medical Applications of Signal Processing, London, UK, 3–4 November 2005; pp. 117–120.
  46. Zhao, Z.; Ma, C. An intelligent system for noninvasive diagnosis of coronary artery disease with EMD-TEO and BP neural network. In Proceedings of the International Workshop on Education Technology and Training (ETT) and on Geoscience and Remote Sensing (GRS), Shanghai, China, 21–22 December 2008; pp. 631–635.
  47. Babaoğlu, I.; Findik, O.; Bayrak, M. Effects of principle component analysis on assessment of coronary artery diseases using support vector machine. Expert Syst. Appl. 2010, 37, 2182–2185. [Google Scholar] [CrossRef]
  48. Babaoğlu, I.; Findik, O.; Ülker, E. A comparison of feature selection models utilizing binary particle swarm optimization and genetic algorithm in determining coronary artery disease using support vector machine. Expert Syst. Appl. 2010, 37, 3177–3183. [Google Scholar] [CrossRef]
  49. Patidar, S.; Pachori, R.B.; Acharya, U.R. Automated diagnosis of coronary artery disease using tunable-Q wavelet transform applied on heart rate signals. Know. Based Syst. 2015, 82, 1–10. [Google Scholar] [CrossRef]
  50. Wilson, M.F.; Sung, B.H.; Herbst, C.P.; Lee, R.H.; Brackett, D.J. Evaluation of left ventricular contractility indexes for the detection of symptomatic and silent myocardial ischemia. Am. J. Cardiol. 1988, 62, 1176–1179. [Google Scholar] [CrossRef]
  51. Liou, Y.M.; Hsieh, S.R.; Wu, T.J.; Chen, J.Y. Green tea extract given before regional myocardial ischemia-reperfusion in rats improves myocardial contractility by attenuating calcium overload. Pflug. Arch. Eur. J. Phy. 2010, 460, 1003–1014. [Google Scholar] [CrossRef] [PubMed]
  52. Cascio, W.E.; Johnson, T.A.; Gettes, L.S. Electrophysiologic changes in ischemic ventricular myocardium: I. Influence of ionic, metabolic, and energetic changes. J. Cardiovasc. Electrophysiol. 1995, 6, 1039–1062. [Google Scholar] [CrossRef] [PubMed]
  53. Zhang, T.; Yang, Z.; Coote, J.H. Cross-sample entropy statistic as a measure of complexity and regularity of renal sympathetic nerve activity in the rat. Exp. Physiol. 2007, 92, 659–669. [Google Scholar] [CrossRef] [PubMed]
  54. Kuehl, M.; Stevens, M.J. Cardiovascular autonomic neuropathies as complications of diabetes mellitus. Nat. Rev. Endocrinol. 2012, 8, 405–416. [Google Scholar] [CrossRef] [PubMed]
  55. Brunner, M.J.; Greene, A.S.; Kallman, C.H.; Shoukas, A.A. Interaction of canine carotid sinus and aortic arch baroreflexes in the control of total peripheral resistance. Circ. Res. 1984, 55, 740–750. [Google Scholar] [CrossRef] [PubMed]
  56. Pierdomenico, S.D. Left-ventricular hypertrophy and coronary artery disease. Am. J. Hypertens. 2007, 20, 1036–1037. [Google Scholar] [CrossRef] [PubMed]
  57. Ghali, J.K.; Liao, Y.; Simmons, B.; Castaner, A.; Cao, G.; Cooper, R.S. The prognostic role of left ventricular hypertrophy in patients with or without coronary artery disease. Ann. Intern. Med. 1992, 117, 831–836. [Google Scholar] [CrossRef] [PubMed]
  58. Wessel, N.; Suhrbier, A.; Riedl, M.; Marwan, N.; Malberg, H.; Bretthauer, G.; Penzel, T.; Kurths, J. Detection of time-delayed interactions in biosignals using symbolic coupling traces. EPL 2009, 87, 10004. [Google Scholar] [CrossRef]
  59. Suhrbier, A.; Riedl, M.; Malberg, H.; Penzel, T.; Bretthauer, G.; Kurths, J.; Wessel, N. Cardiovascular regulation during sleep quantified by symbolic coupling traces. Chaos 2010, 20, 045124. [Google Scholar] [CrossRef] [PubMed]
  60. Penzel, T.; Riedl, M.; Gapelyuk, A.; Suhrbier, A.; Bretthauer, G.; Malberg, H.; Schobel, C.; Fietze, I.; Heitmann, J.; Kurths, J.; et al. Effect of CPAP therapy on daytime cardiovascular regulations in patients with obstructive sleep apnea. Comput. Biol. Med. 2012, 42, 328–334. [Google Scholar] [CrossRef] [PubMed]
Figure 1. The block diagram of this study.
Entropy 18 00153 g001
Figure 2. Schematic diagram showing the construction of RRI, STI, and DTI from ECG and PPG signals.
Entropy 18 00153 g002
Figure 3. Examples of RRI, STI, and DTI time-series. Shown left from a healthy subject and right a CAD patient.
Entropy 18 00153 g003
Figure 4. Correlation of entropy-based and other measures in analysing RRI-DTI coupling between healthy subjects and CAD patients. The scatter plots represent values of all samples. The fitting lines and the corresponding R and p values are also shown when the correlations have statistical significance.
Entropy 18 00153 g004
Figure 5. Correlation of entropy-based and other measures in analysing STI-DTI coupling between healthy subjects and CAD patients. The scatter plots represent values of all samples. The fitting lines and the corresponding R and p values are also shown when the correlations have statistical significance.
Entropy 18 00153 g005
Figure 6. Correlation of entropy-based and other measures in analysing RRI-STI coupling between healthy subjects and CAD patients. The scatter plots represent values of all samples.
Entropy 18 00153 g006
Table 1. Basic characteristics of the participants.
VariablesHealthy SubjectsCAD Patientsp
Age (years)57 ± 1059 ± 80.51
Gender (M/F)16/2022/170.42
HR (beats/min)66 ± 669 ± 70.08
Height (cm)164 ± 7166 ± 90.20
Weight (kg)65.8 ± 6.268.0 ± 6.40.21
BMI (kg/m2)23.5 ± 2.224.4 ± 1.60.12
DBP (mmHg)77 ± 879 ± 90.29
SBP (mmHg)124 ± 10128 ± 100.15
Abbreviations: BMI: body mass index; DBP: diastolic blood pressure; SBP: systolic blood pressure. Data are expressed as mean ± standard deviation (SD) or number (Male/Female).
Table 2. Short-term RRI-DTI coupling analysis results.
MeasurementsHealthy SubjectsCAD Patientsp
CC0.98 (0.97 0.99)0.97 (0.95 0.99)0.06
CF0.92 (0.87 0.95)0.91 (0.85 0.95)0.82
MI2.19 (1.71 2.47)1.97 (1.56 2.24)0.05
XCE0.50 (0.39 0.60)0.59 (0.52 0.71)0.02
XSampEn1.41 (1.25 1.70)1.55 (1.33 1.78)0.07
XFuzzyEn1.20 (1.02 1.27)1.27 (1.14 1.36)0.03
Abbreviations: CC: correlation coefficient; CF: coherence function; MI: mutual information; XCE: cross conditional entropy; XSampEn: cross sample entropy; XFuzzyEn: cross fuzzy entropy. Data are expressed as median (25% 75%).
Table 3. Short-term STI-DTI coupling analysis results.
MeasurementsHealthy SubjectsCAD Patientsp
CC0.38 (0.29 0.50)0.36 (0.26 0.45)0.25
CF0.49 (0.42 0.55)0.46 (0.43 0.54)0.55
MI0.54 (0.39 0.75)0.48 (0.38 0.68)0.36
XCE1.35 (1.29 1.40)1.39 (1.32 1.43)0.08
XSampEn2.09 (1.95 2.15)2.19 (1.99 2.45)0.05
XFuzzyEn1.61 (1.50 1.68)1.69 (1.57 1.80)<0.008
Abbreviations: CC: correlation coefficient; CF: coherence function; MI: mutual information; XCE: cross conditional entropy; XSampEn: cross sample entropy; XFuzzyEn: cross fuzzy entropy. Data are expressed as median (25% 75%).
Table 4. Short-term RRI-STI coupling analysis results.
MeasurementsHealthy SubjectsCAD Patientsp
CC0.52 (0.42 0.61)0.48 (0.36 0.55)0.08
CF0.63 (0.57 0.69)0.61 (0.52 0.69)0.54
MI0.62 (0.46 0.84)0.54 (0.47 0.79)0.21
XCE1.34 (1.25 1.42)1.33 (1.28 1.39)0.77
XSampEn2.11 (1.89 2.25)2.25 (2.11 2.36)0.04
XFuzzyEn1.62 (1.54 1.71)1.84 (1.77 1.92)< 0.008
Abbreviations: CC: correlation coefficient; CF: coherence function; MI: mutual information; XCE: cross conditional entropy; XSampEn: cross sample entropy; XFuzzyEn: cross fuzzy entropy. Data are expressed as median (25% 75%).

