Article

Rolling Bearing Fault Diagnosis Based on Wavelet Packet Decomposition and Multi-Scale Permutation Entropy

1
School of Instrument Science and Engineering, Southeast University, No. 2, Sipailou, Nanjing 210096, China
2
Key Laboratory of Micro Inertial Instrument and Advanced Navigation Technology, Ministry of Education, No. 2, Sipailou, Nanjing 210096, China
*
Author to whom correspondence should be addressed.
Entropy 2015, 17(9), 6447-6461; https://doi.org/10.3390/e17096447
Submission received: 21 July 2015 / Revised: 9 September 2015 / Accepted: 16 September 2015 / Published: 21 September 2015
(This article belongs to the Section Complexity)

Abstract

:
This paper presents a rolling bearing fault diagnosis approach by integrating wavelet packet decomposition (WPD) with multi-scale permutation entropy (MPE). The approach uses MPE values of the sub-frequency band signals to identify faults appearing in rolling bearings. Specifically, vibration signals measured from a rolling bearing test system with different defect conditions are decomposed into a set of sub-frequency band signals by means of the WPD method. Then, each sub-frequency band signal is divided into a series of subsequences, and MPEs of all subsequences in corresponding sub-frequency band signal are calculated. After that, the average MPE value of all subsequences about each sub-frequency band is calculated, and is considered as the fault feature of the corresponding sub-frequency band. Subsequently, MPE values of all sub-frequency bands are considered as input feature vectors, and the hidden Markov model (HMM) is used to identify the fault pattern of the rolling bearing. Experimental study on a data set from the Case Western Reserve University bearing data center has shown that the presented approach can accurately identify faults in rolling bearings.

1. Introduction

It is important to detect and diagnose rolling element bearing failures in rotating machinery in real time to void abnormal event progression and to reduce productivity loss [1]. Among commonly used techniques, vibration-based analysis has been widely established to diagnose bearing faults due to the fact structural defects can cause changes of the bearing dynamic characteristics as manifested in vibrations [2]. However, some non-linear factors, such as clearance, friction, and stiffness, affect complexity of the vibration signals. As a result, accurate evaluation of rolling bearings becomes a very challenging task if only the traditional analysis in the time or frequency domain on the working condition is used [3]. In the past few years, various methods have been studied for detecting bearing faults in rotating machines, such as the stator current and vibration harmonic analysis method, the stray flux measurement method, the Park’s vector approach, the instantaneous power factor (IPF) monitoring method, and the advanced artificial-intelligence-based method [4,5].
Development of the wavelet transform over the past years has also provided an effective tool to extract features from transient, time-varying signals for machine fault diagnosis. The research in [6,7] has presented a comprehensive overview about the application of the wavelet in machine fault diagnosis. The wavelet packet decomposition (WPD) is an extension of the wavelet transform. It has attracted increasing attention due to its ability in providing more flexible time–frequency decomposition, especially in the high-frequency region. The WPD is widely used in various machine fault diagnosis applications because of its excellent performance [2]. For example, research in [8] used different sets of wavelet packet vectors to represent bearing vibration signals under different defect conditions. It was found that the WPD can improve the continuous wavelet transform (CWT) in terms of computational cost. It can also solve the frequency-band disagreement by discrete wavelet transform (DWT) only breaking up the approximation version [9]. For rolling bearing vibration signal analysis, the manifold learning and wavelet packet transform were combined to extract the weak signature from waveform feature space [10]. In another study, the WPD was incorporated with ensemble empirical mode decomposition to enable roller bearing defect detection at its incipient stage [11].
Generally, some features, such as energy content and Kurtosis value, are extracted from each sub-frequency band of the vibration signal. However, a preliminary study [12] has shown that the energy content is shown to have good robustness but relatively low sensitivity for incipient defects detection, whereas Kurtosis has high sensitivity to incipient defects but low stability. It is expected to combine these two parameters to enhance the defect severity assessment capability. In practice, if more parameters are used in feature extraction, they do not necessarily improve diagnostic performance but rather increase the computational cost [2,13]. New parameters that can facilitate effective feature extraction are needed.
Permutation Entropy (PE), a parameter of average entropy, can describe the complexity of a time series. It is robust under non-linear distortion of the signal and is also computationally efficient. PE has been used for online chatter detection in turning processes [14], tool flute breakage detection in end milling [15], and status characterization of rotary machines [16]. Multi-scale permutation entropy (MPE), which is based on PE, can measure the complexity of time series in different scales. A diagnosis method based on multi-scale permutation entropy and support vector machine (SVM) has been used to monitor and diagnose the rolling bearings working conditions [17]. It has also been combined with a Laplacian score to refine features for bearing fault classification with the SVM [18].
In this paper, by taking advantages of the WPD and the MPE, an enhanced method for rolling bearing fault diagnosis is presented. The WPD is used as the pretreatment to decompose a vibration signal into a set of sub-frequency band signals, and the MPE value of each sub-frequency band signal is calculated. All MPE values of each vibration signal are used as a feature vector to a classifier, where the hidden Markov model (HMM) is used to identify the fault pattern of the rolling bearing. The rest of this paper is organized as follows. In Section 2, the review of the fault diagnosis method based on WPD and MPE is presented, and the proposed method for rolling bearing fault diagnosis is discussed. The evaluation and experiments are presented in Section 3. Finally, concluding remarks are drawn in Section 4.

2. Theoretical Framework

2.1. Wavelet Packet Decomposition

The principle of the WPD can be described as follows [9,19]. Mathematically, a wavelet packet consists of a set of linearly combined wavelet functions, which are generated using the following recursive relationship:
ϕ 2 k ( t ) = 2 n h ( n ) ϕ k ( 2 t n )
ϕ 2 k + 1 ( t ) = 2 n g ( n ) ϕ k ( 2 t n )
where ϕ0(t) = ϕ(t) is the scaling function, and ϕ1(t) = ϕ(t) is the wavelet function. The symbols h(n) and g(n) represent coefficients of a pair of Quadrature Mirror Filters associated with the scaling function and wavelet function. Furthermore, h(n) and g(n) are related to each other by g(n) = (−1)nh(1 − n) . For each step of the decomposition, the input discrete signal is decomposed into a rough approximation in low frequency and a detailed part in high frequency. The time-domain signal x(t) can be decomposed recursively as:
x j + 1 , 2 k ( t ) = m h ( m 2 n ) x j , k ( t )
x j + 1 , 2 k + 1 ( t ) = m g ( m 2 n ) x j , k ( t )
where xj,k(t) denotes the wavelet coefficients at the j-th level, k-th sub-frequency band.
Therefore, the signal x(t) can be expressed as:
x ( t ) = k = 0 2 j 1 x j , k ( t )
where the symbols j and k denote the decomposition level and sub-frequency band, respectively.
An example of a 3-level decomposition of the signal x(t) using the wavelet packet decomposition is shown in Figure 1.
Figure 1. Three level wavelet packet decomposition diagram.
Entropy 17 06447 g001
Given a signal’s decomposition as represented in Equation (5), the energy content E j k in each sub-frequency band is defined as:
E j k = i = 1 N x j k ( i ) 2
where N is the number of the wavelet packet coefficients in each sub-frequency band, and x j k ( i ) is the wavelet coefficient.
In most cases, the energy content values can be treated as features to construct a feature vector for defect classification. However, a preliminary study has verified that the energy content has low sensitivity for incipient defects detection [12]. In the following, the MPE technique can be integrated with the WPD to achieve more accurate fault classification results.

2.2. Multi-Scale Permutation Entropy

The mathematical theorem of the PE and MPE was described in detail in [16,17,18]. According to the Takens–Maine theorem, the phase space of a time series { x ( i ) , i = 1 , 2 , , N } can be reconstructed as:
{ X ( 1 ) = { x ( 1 ) , x ( 1 + τ ) , , x ( 1 + ( m 1 ) τ ) X ( i ) = { x ( i ) , x ( i + τ ) , , x ( i + ( m 1 ) τ ) X ( N ( m 1 ) τ ) = { x ( N ( m 1 ) τ ) , x ( N ( m 2 ) τ ) , , x ( N )
where m is the embedded dimension and τ is the time delay. The m number of real values contained in each X(i) can be arranged in an increasing order as:
{ x ( i + ( j 1 1 ) τ ) x ( i + ( j 2 1 ) τ ) x ( i + ( j m 1 ) τ ) }
If there exist two or more elements in X(i) that have the same value, e.g., x ( i + ( j 1 1 ) τ ) = x ( i + ( j 2 1 ) τ ) , their original positions can be sorted such that for j 1 j 2 , x ( i + ( j 1 1 ) τ ) x ( i + ( j 2 1 ) τ ) can be written. Accordingly, any vector X(i) can be mapped onto a group of symbols as:
S ( l ) = ( j 1 , j 2 , , j m )
where l = 1 , 2 , , k and km! (m! is the largest number of distinct symbols). S(l) is one of the m! symbol permutations, which is mapped onto the m number symbols ( j 1 , j 2 , , j m ) in m-dimensional embedding space. If P 1 , P 2 , , P k are used to denote the probability distribution of each symbol sequences, respectively, and l = 1 k P l = 1 , then the PE of order m for the time series { x ( i ) , i = 1 , 2 , , N } can be defined as the Shannon entropy for the k symbol sequences as:
H P ( m ) = l k P l ln P l
The maximum value of HP(m) can be obtained as ln(m!) when all the symbol sequences have the same probability distribution as Pl = 1/m!. Therefore, the PE of order m can be normalized as:
0 H P = H P / ln ( m ! ) 1
The size of HP value indicates the degree of randomness of time series. The greater HP is, the more random the time series indicates. Contrarily, it indicates that the time series are more regular.
The MPE is employed for estimation of complexity parameters. The MPE calculates PE over multiple scales to avoid contradictory results by single scale entropy. In the case of Shannon entropy, the sequential relation between values of the time series is neglected. This is more useful for a linear system while MPE employs the comparison of neighboring values for analysis of complex time domain data. This property of the MPE makes it more useful for analysis of non-stationary signals.
Based on the multi-scale technique, the main step for calculating MPE is to construct the consecutive coarse-grained time series. This can be done by taking the average of the data inside non-overlapping windows of length l which is called the scale factor, and the sequence is processed as coarse-grained time series. The coarse-grained time series can be expressed by:
y l ( i ) = 1 l j = ( i 1 ) l + 1 i l x ( j ) , i = 1 , 2 , , N / l
where yl(i) denotes coarse-grained time series on different scales, and when the scale factor is equal to one, the sequence is original time series { x ( i ) , i = 1 , 2 , , N } .

2.3. Fault Diagnosis Based on WPD and MPE

The WPD has been widely applied in the field of signal feature extraction; this is because the WPD has a strong ability of analysis in the time-frequency domain. Combined with the property of the MPE which is useful for the analysis of non-stationary signals, a hybrid rolling bearing fault diagnosis approach can be designed as shown in Figure 2.
The main steps are as follows:
Step 1: 
The rolling bearing vibration signal is sampled and then processed by WPD with a three-level decomposition as shown in Figure 1.
Step 2: 
Each time series data, corresponding to each sub-frequency band signal, is divided into several subsequences of length w, and the data length w = 256. The subsequence is obtained by using the maximum overlap, that is to say, each subsequence backward one data point to get the next sequence. Then, MPE values of all subsequences from one sub-frequency band signal are calculated using Equation (10).
Step 3: 
The average of MPE values for each sub-frequency band is calculated, and the average value is considered as the fault feature vector of each sub-frequency band signal. Then, fault feature vectors of each rolling bearing vibration signal can be calculated.
Step 4: 
After scalar quantization by index calculation formula of Lloyds algorithm in Equation (13) [20], the feature vectors of different conditions are used to train the HMM with each working condition:
i n d x ( x ) = { 1 x p a r t i t i o n ( i ) i + 1 p a r t i t i o n ( i ) < x p a r t i t i o n ( i + 1 ) N p a r t i t i o n ( N 1 ) < x
where N is the length of the codebook vector, partition(i) is the partition vector with the length of N − 1, x is the feature vector for scalar quantization.
Step 5: 
A test vibration signal can then be acquired for diagnosis, and the feature vector is first extracted. Then, the feature vector is put into the well trained HMMs, and the corresponding HMM which has the maximum probability is regarded as the classification result [21,22].
Figure 2. The flow chart of proposed Fault Diagnosis method.
Entropy 17 06447 g002

3. Simulations and Experiments Evaluation

3.1. Evaluation Using the Simulated Signal

Three signals x1(t), x2(t), and x3(t) are simulated as shown in Figure 3. The signal x1(t), x2(t), and 
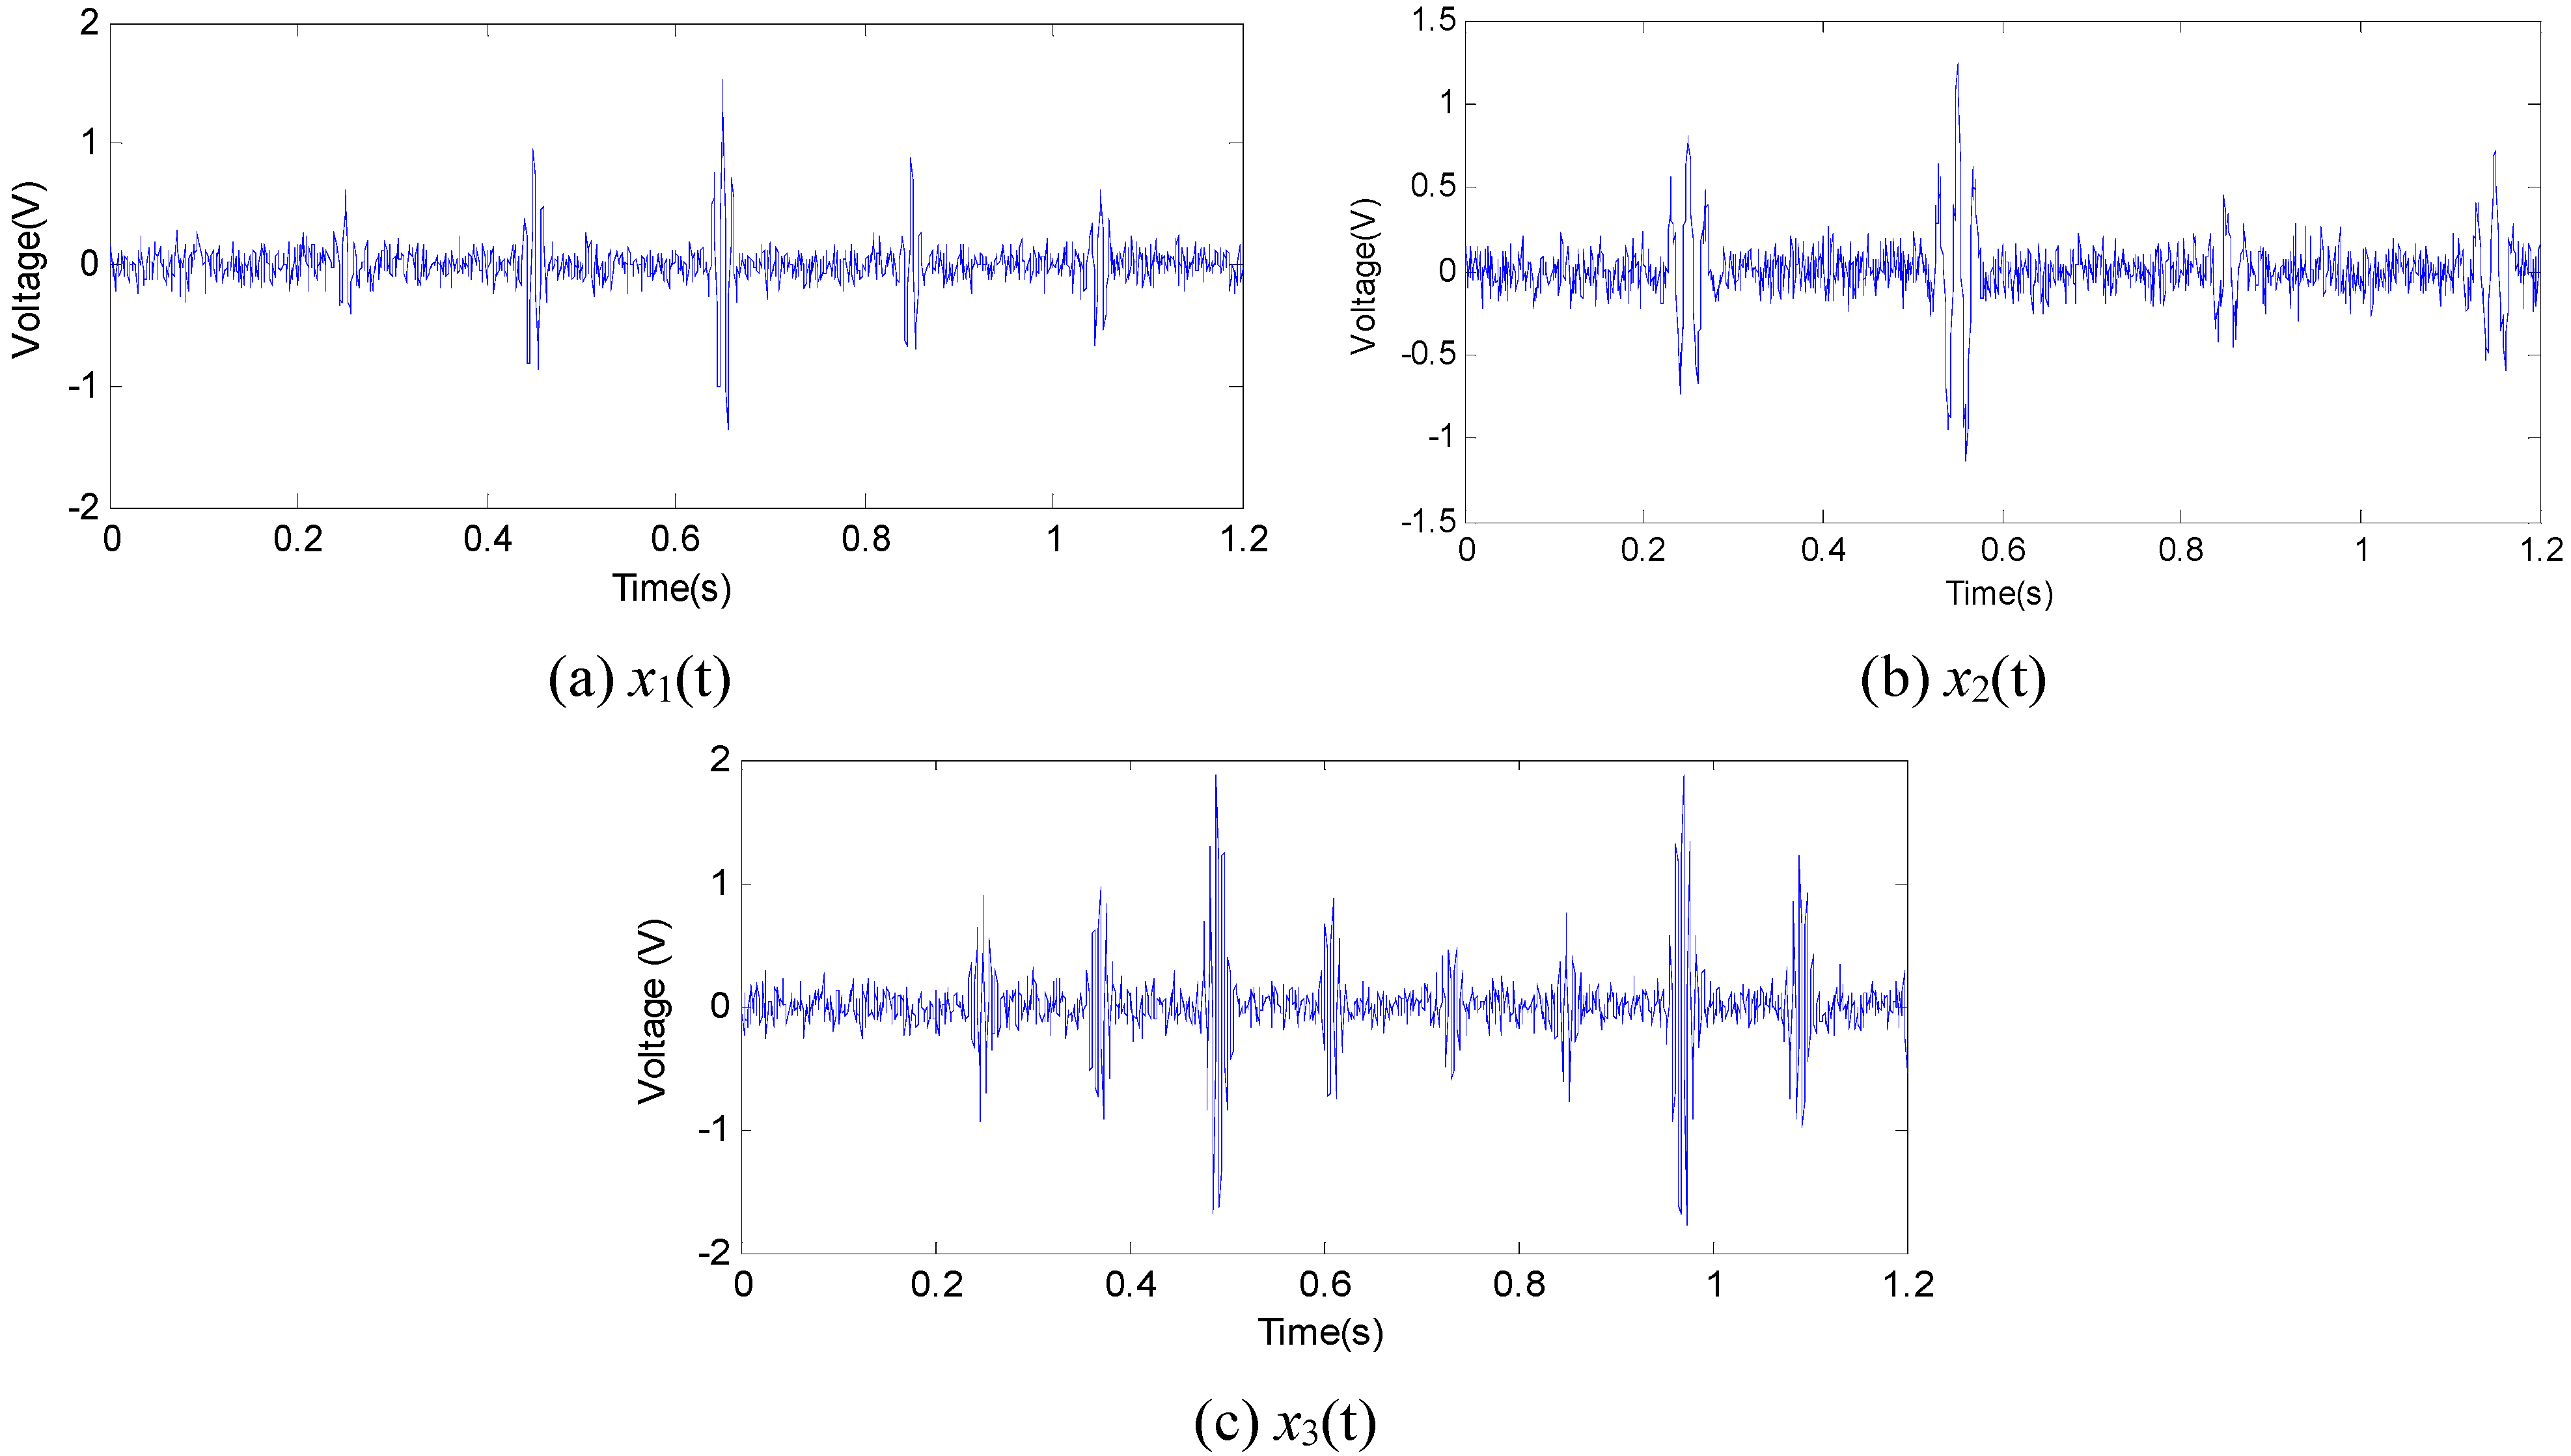
x3(t) are all consist of a set of Gaussian-type impulses with different amplitudes and white noises. The relative band width of Gaussian-type impulses in the signal x1(t) is 0.5, and the center frequency is 100 Hz. The relative band width of Gaussian-type impulses in the signal x2(t) is 0.4, and the center frequency is 50 Hz. The relative band width of Gaussian-type impulses in the signal x3(t) is 0.3, and the center frequency is 150 Hz. Since the characteristics of the new signals are very similar to those of the real fault signals, the simulation experiment result can verify the validity of the proposed method to a certain extent.
Figure 3. Signal waveforms of (a) x1(t), (b) x2(t), and (c) x3(t).
Entropy 17 06447 g003
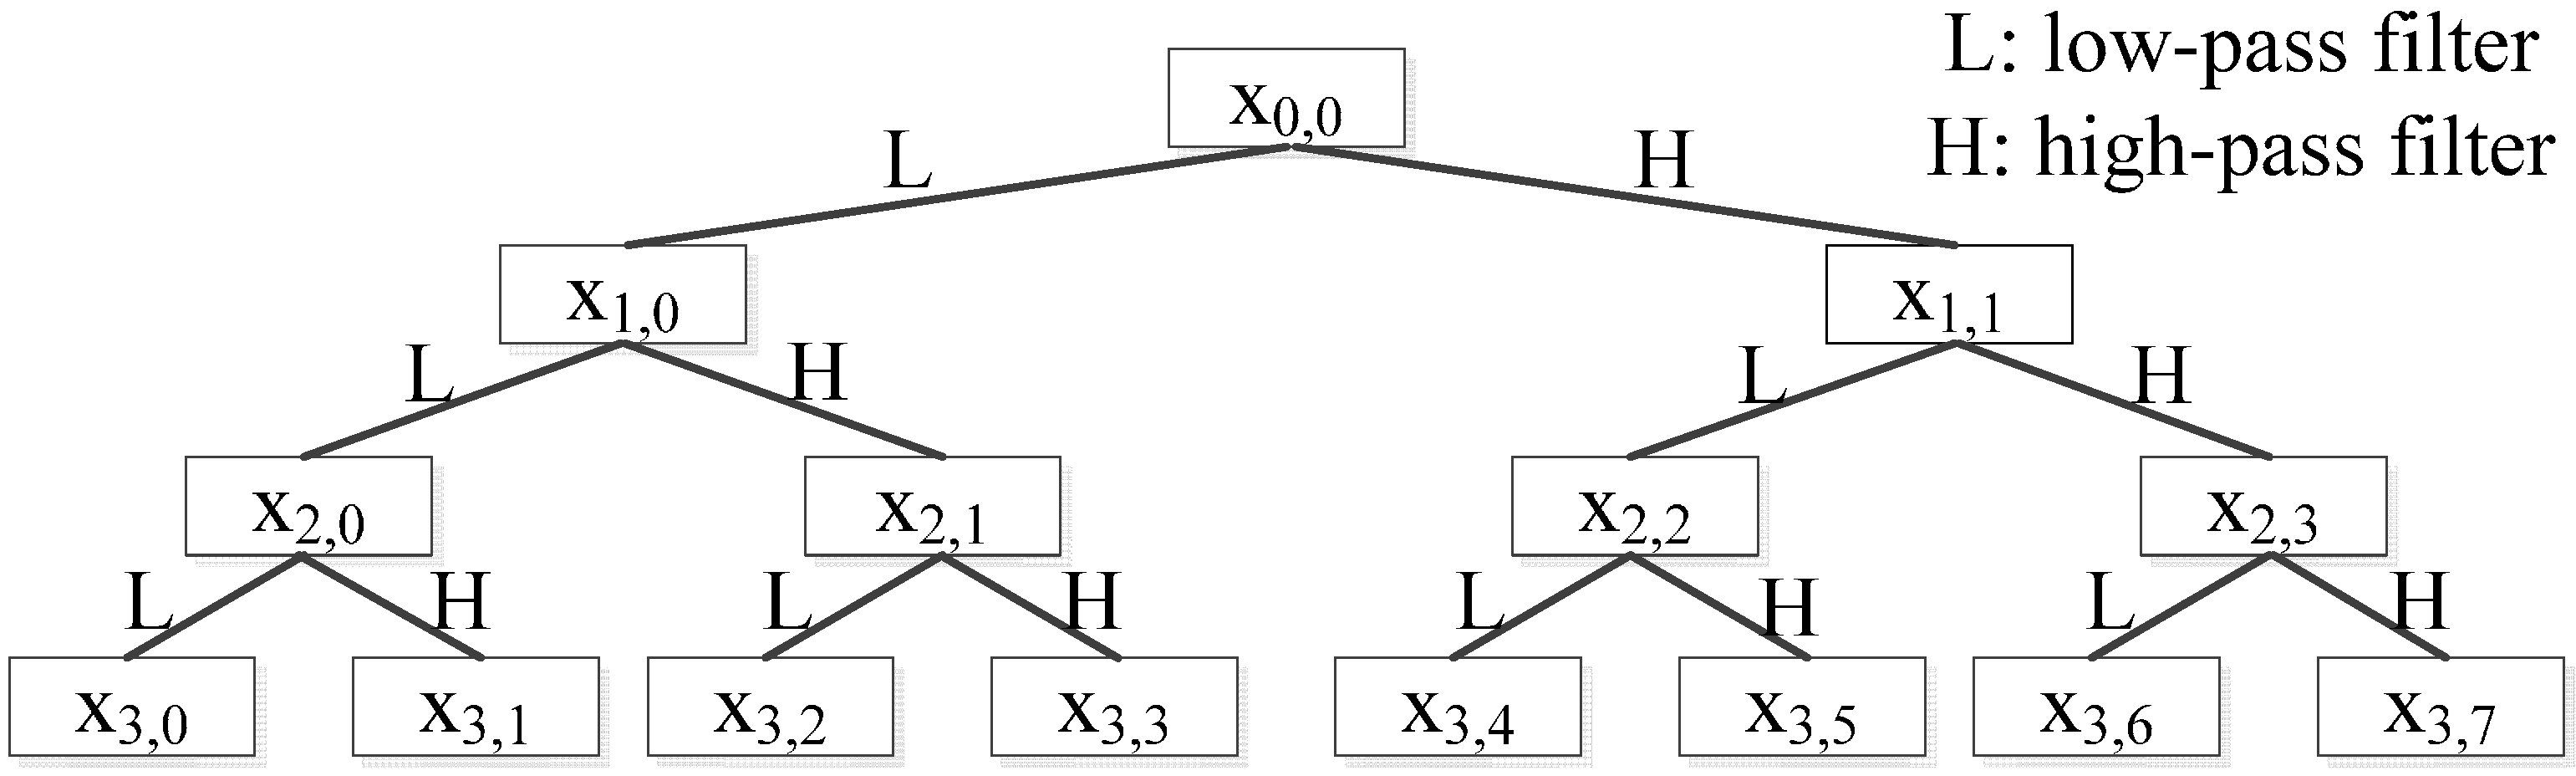
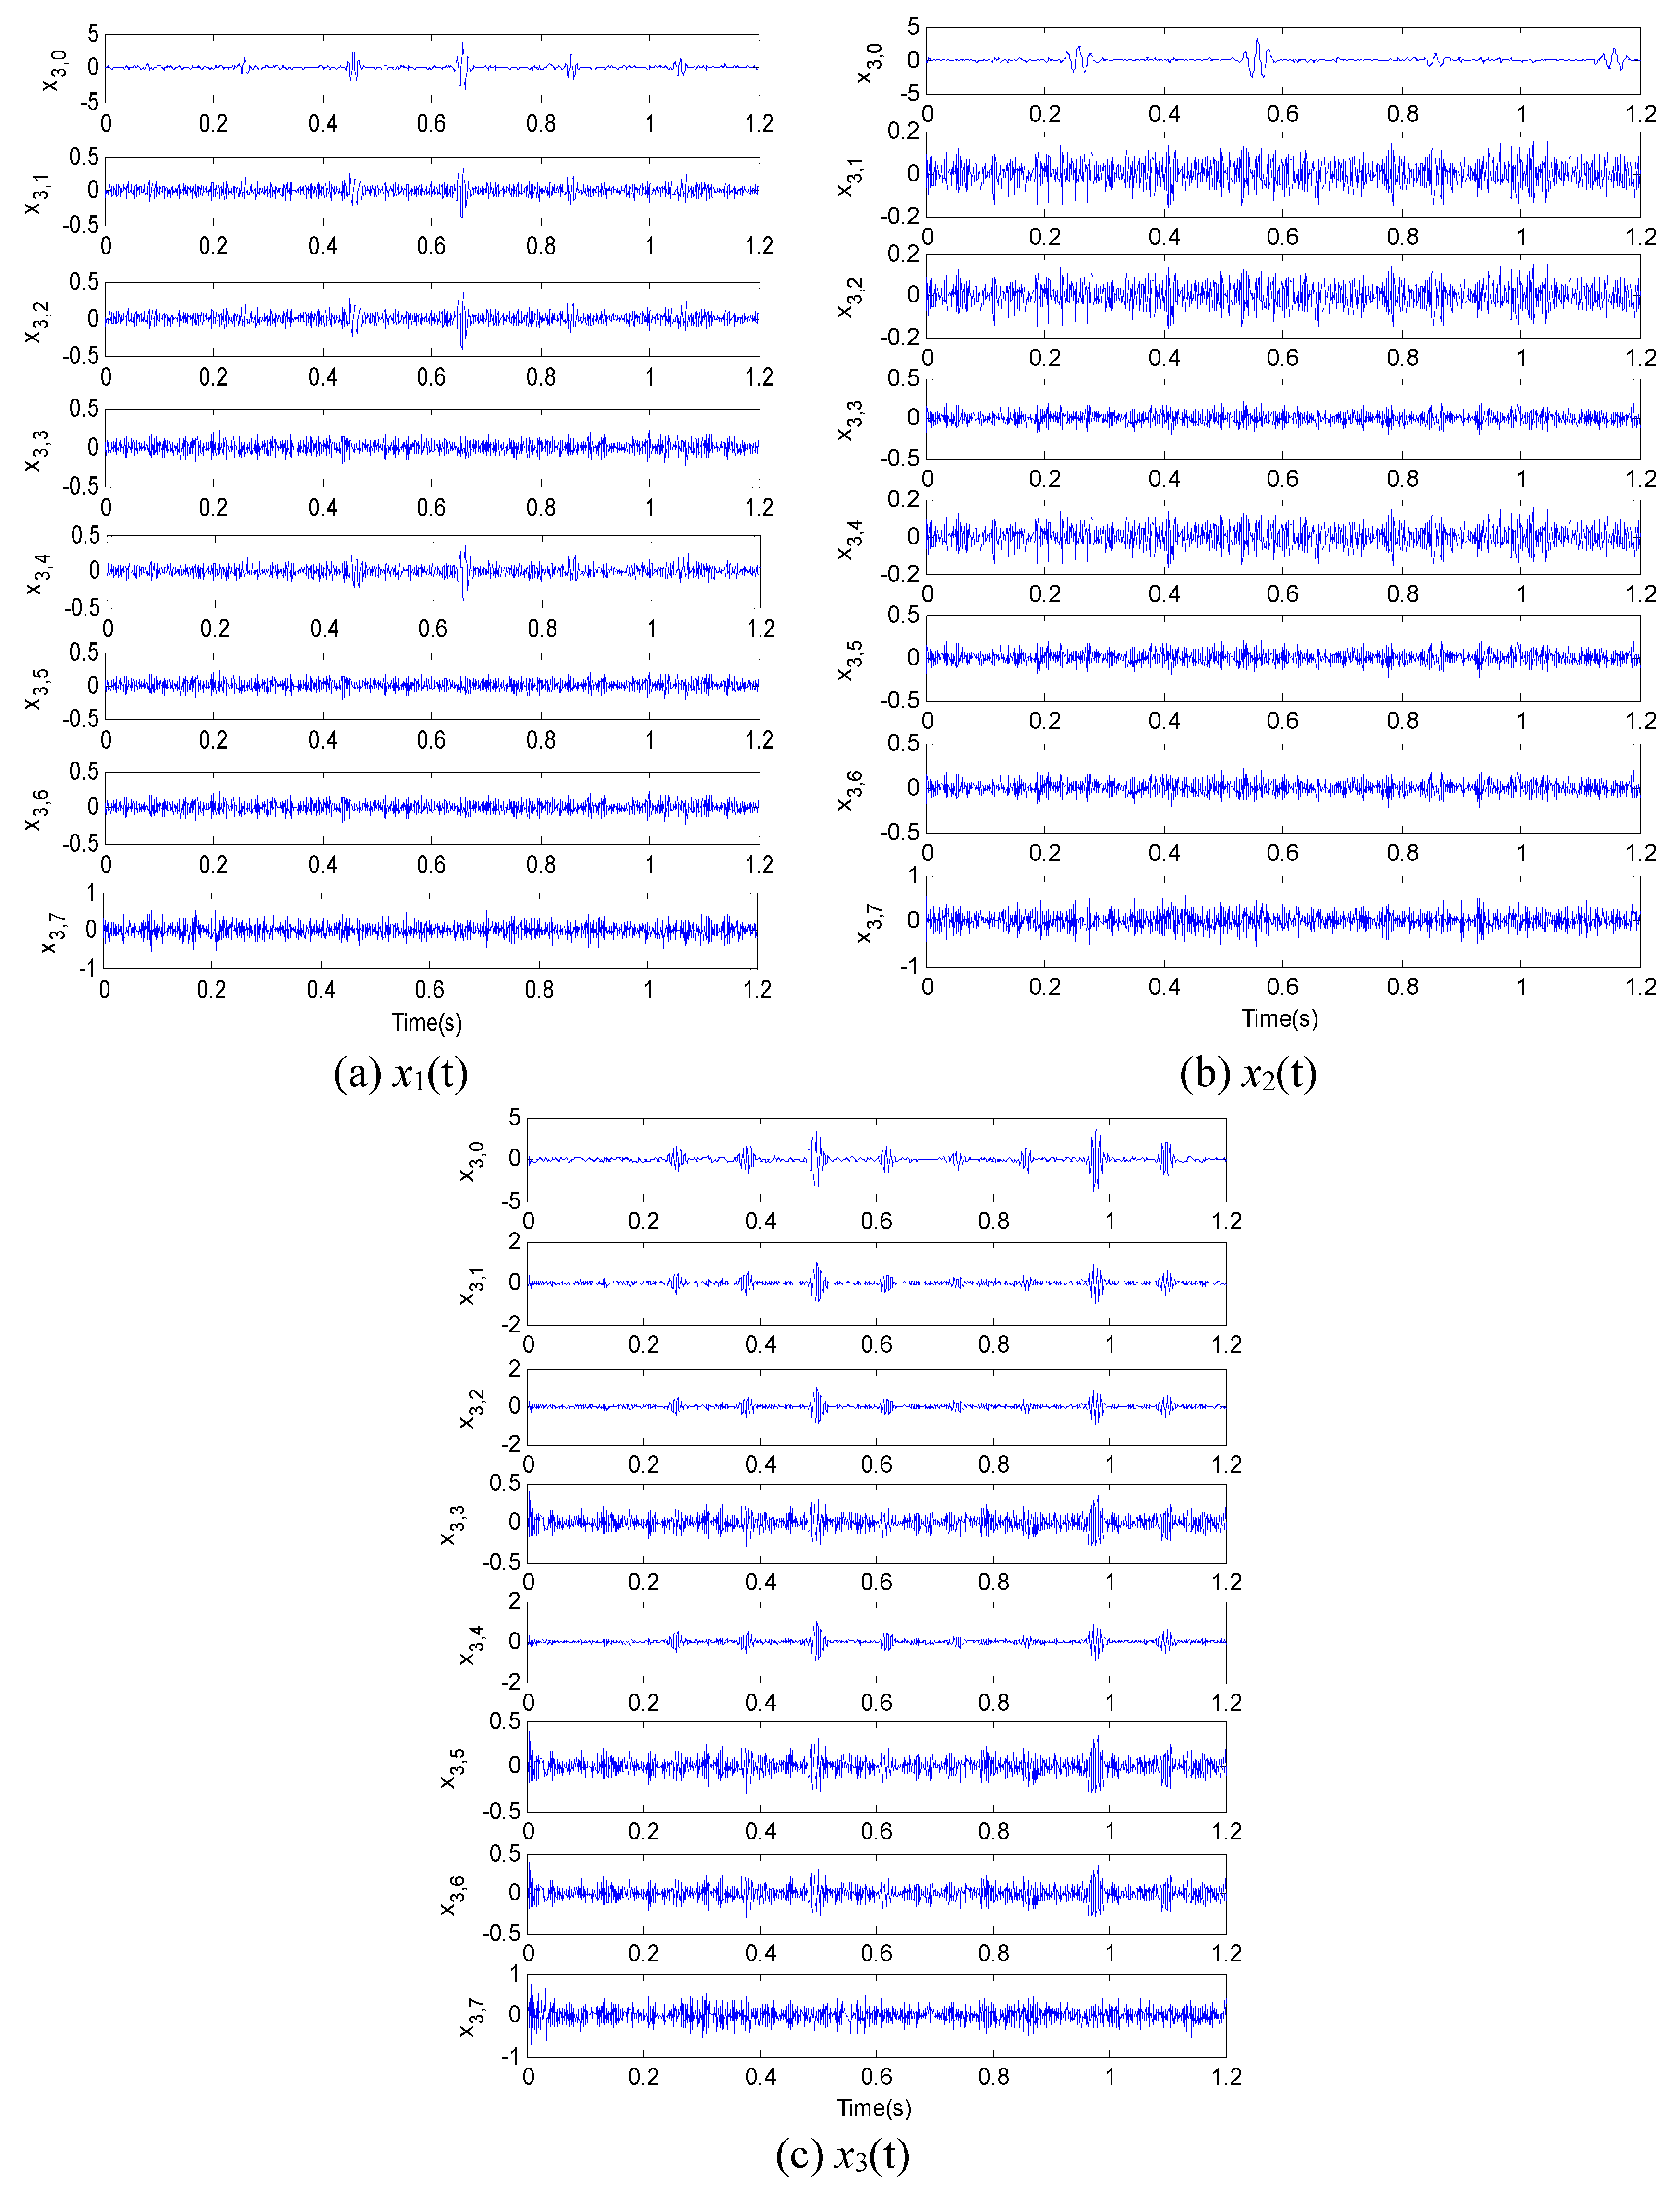
Considering the effectiveness of the decomposition level as well as the computational complexity, a three-level WPD is adopted for data processing, which decomposes each simulated signal into eight sub-frequency band signals. The reverse biorthogonal wavelet 5.5 is chosen as the base wavelet of the decomposition. Figure 4 shows each sub-frequency band signal of x1(t), x2(t), and x3(t). PE values of all sub-frequency bands are illustrated in Table 1, and corresponding MPE values are illustrated in Table 2.
Table 1. Permutation entropy (PE) of each sub-frequency band.
SignalPE value
Band 1Band 2Band 3Band 4Band 5Band 6Band 7Band 8
x1(t)0.93180.93960.93960.89000.93960.89000.89000.9479
x2(t)0.91990.95160.95160.88830.95160.88830.88830.9494
x3(t)0.91820.91050.91500.92370.91500.92370.92370.9475
Table 2. Multi-scale permutation entropy (MPE) of each sub-frequency band.
SignalMPE value
Band 1Band 2Band 3Band 4Band 5Band 6Band 7Band 8
x1(t)0.90830.92830.92830.93010.92830.93010.93010.9348
x2(t)0.88900.91960.91960.91960.92830.92830.92830.9196
x3(t)0.86760.87010.87010.90770.90190.89920.91920.9192
Figure 4. The decomposition results by wavelet packet decomposition (WPD). (a) x1(t), (b) x2(t), and (c) x3(t).
Entropy 17 06447 g004
Table 1 shows the PE of each sub-frequency band signal after using a moving average computation. It can be seen that there is relatively little difference between the PE of each sub-frequency band signal, and no obvious change trend is identified. Table 2 shows the MPE of each sub-frequency band signal after using moving average computation. Comparing the MPE values of x1(t) with those of x2(t), and x3(t), it can be seen that the three groups of MPE values are clearly distributed in different ranges. After scalar quantization, the feature vectors are used to train the HMM for signal classification.
A total of 120 feature vectors were collected from three groups of signals using the proposed approach. One-third of the feature vectors in each condition were used for training the classifier and others were used for testing. The results of the signal classification are listed in Table 3.
Table 3. Signal classification results.
Signal typeTest sampleClassification resultsClassification rate (%)Overall classificationrate (%)
x1(t)x2(t)x3(t)
x1(t)30300110095.6
x2(t)30029196.7
x3(t)30022893.3
Results in Table 3 indicate that the presented method based on the WPD and the MPE can effectively identify different signals, and the overall classification rate is 95.6%. For the purposes of comparison, the signal classification rates using the MPE alone is calculated and 90% classification rate is obtained. It verifies that efficiency of the signal classification method proposed in this paper is improved in a certain extent than the MPE alone method.

3.2. Evaluation Using Experimental Data

In order to illustrate the practicability and effectiveness of the proposed method, a bearing fault data set from the Case Western Reserve University bearing data center is analyzed [
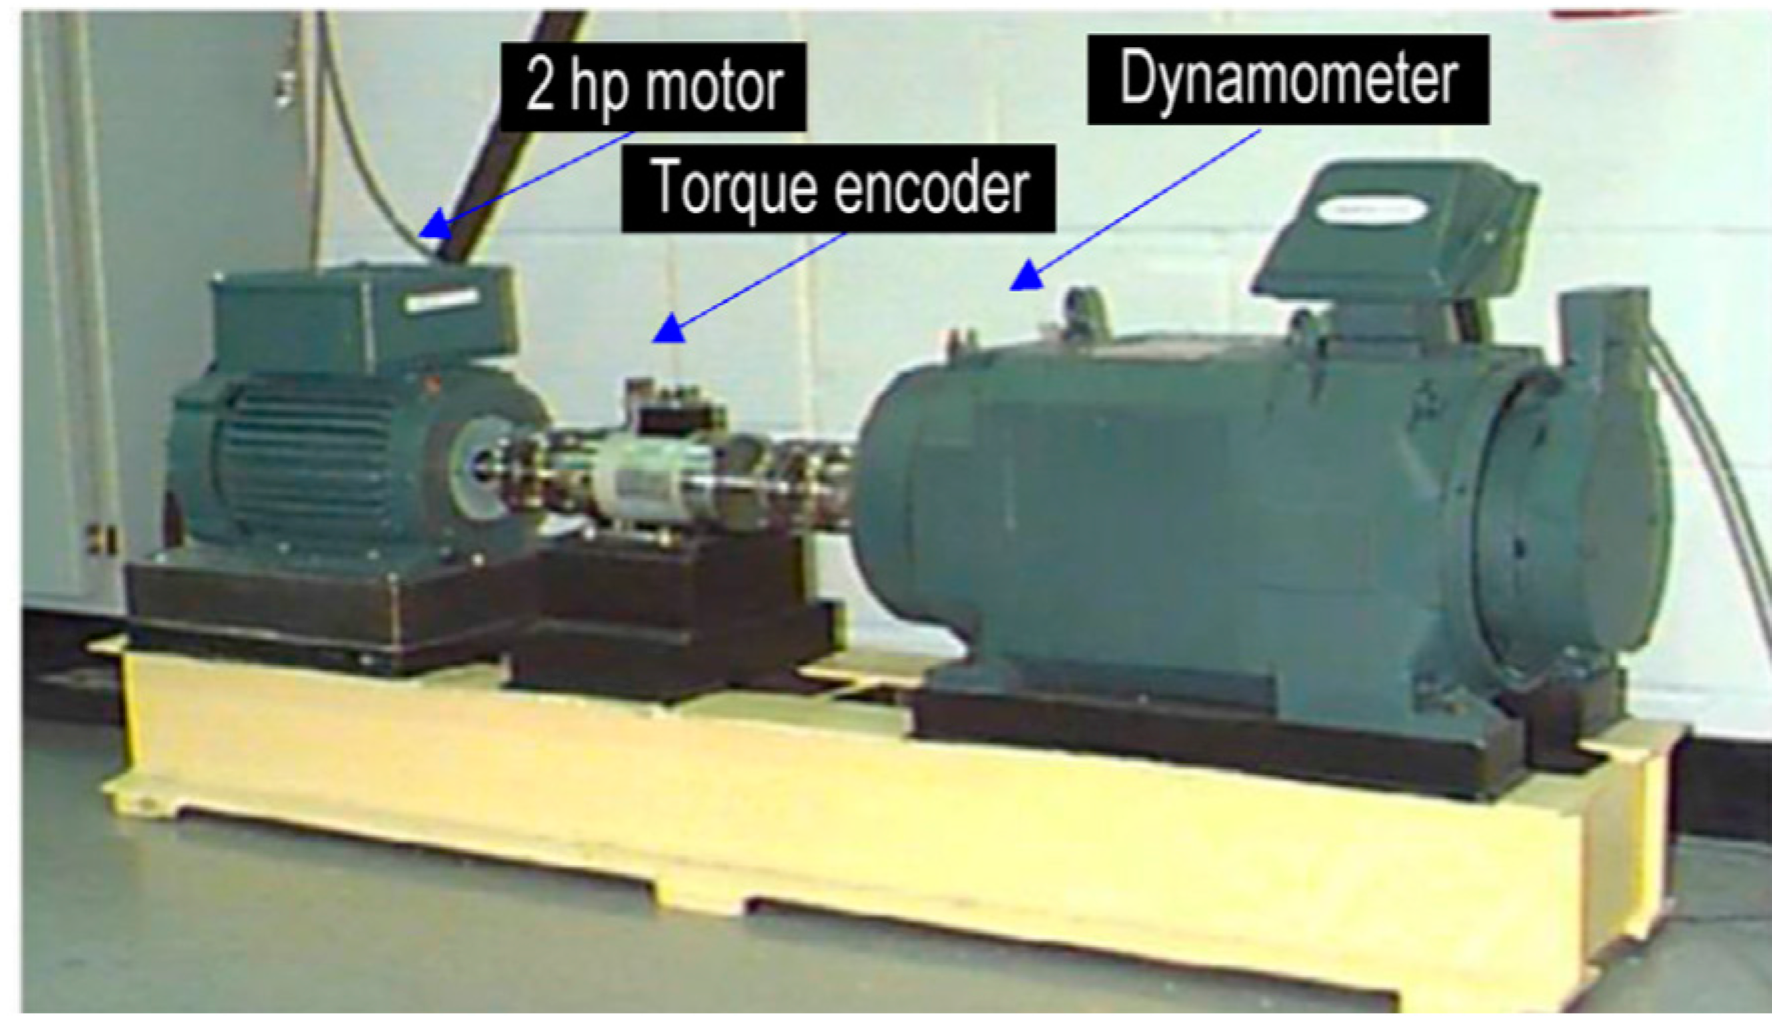
23]. The data set are acquired from the test stand shown in Figure 5, where it consists of a 2 hp motor, a torque transducer, a dynamometer, and control electronics. The test bearings support the motor shaft which is the deep grove ball bearings with the type of 6205-2RS JEMSKF. Single point faults were introduced to the inner raceway, outer raceway and ball of test bearings using electro-discharge machining with fault diameters of 0.18 mm. Vibration data was collected at 12,000 samples per second using accelerometers, which were attached to the housing with magnetic bases. Accelerometers were placed at the 12 o’clock position at both the drive end and fan end of the motor housing. The motor load level was controlled by the fan in the right side of Figure 5.
Figure 5. Bearing test stand.
Entropy 17 06447 g005
Figure 6 and 
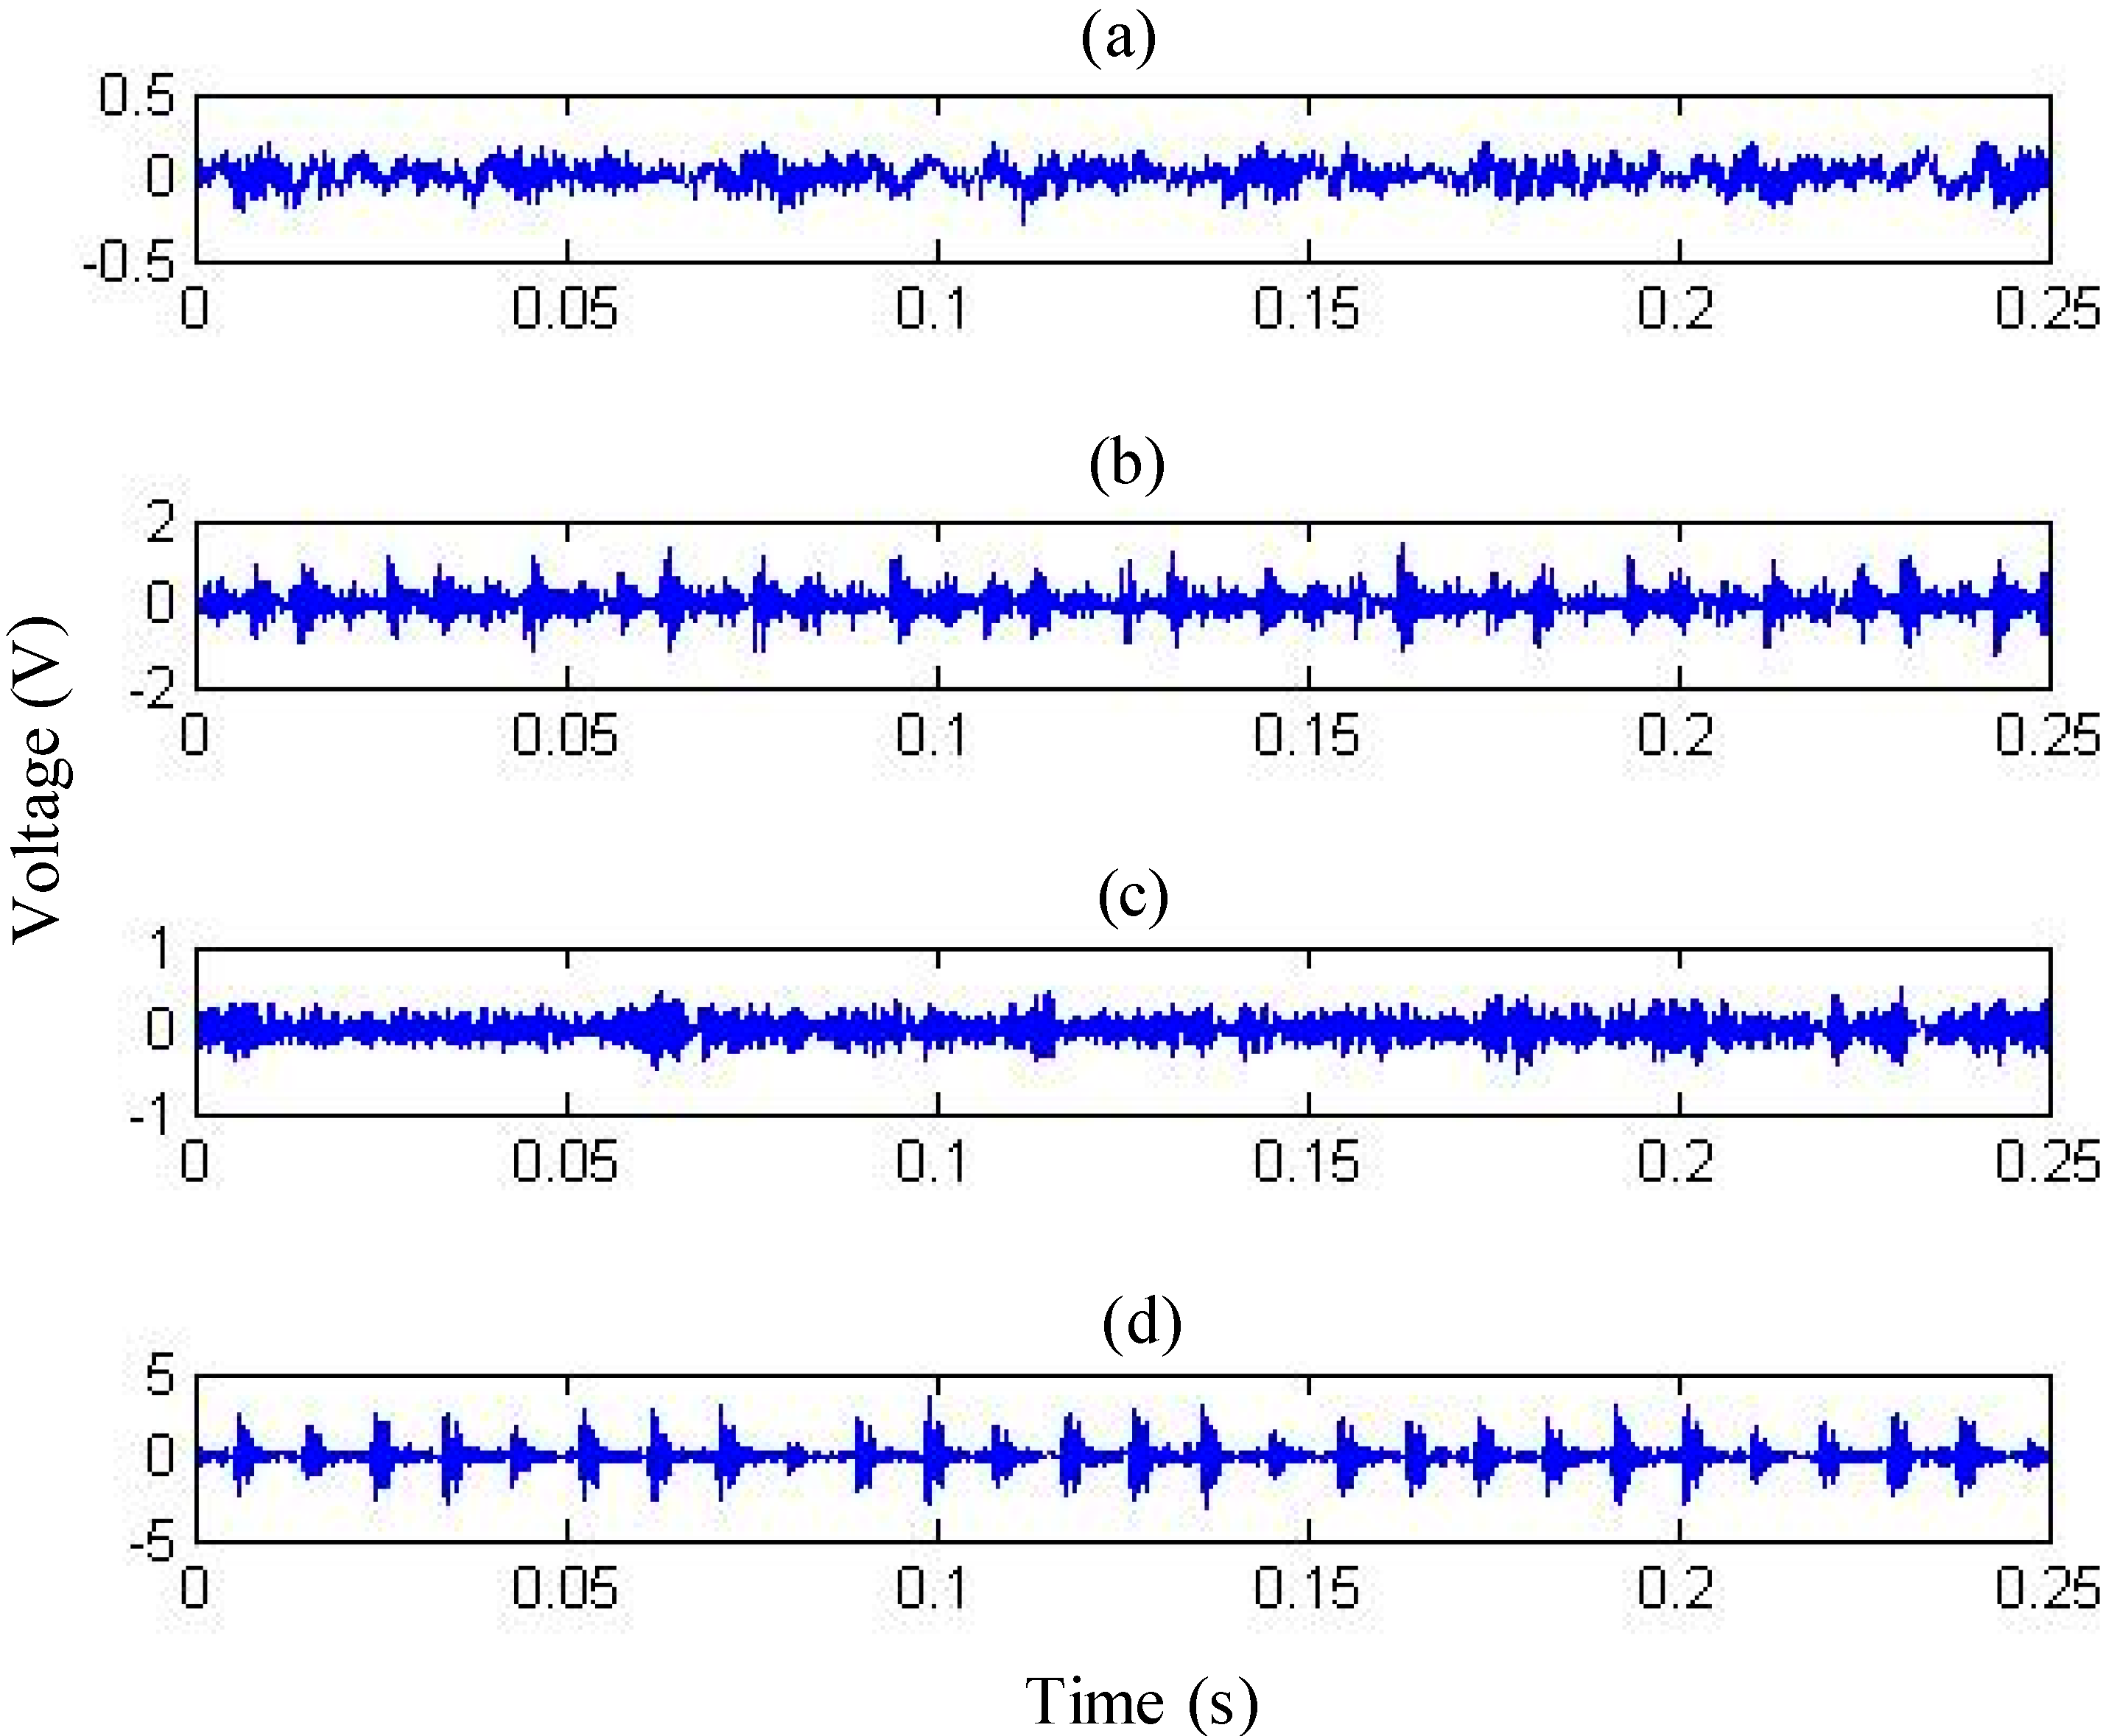
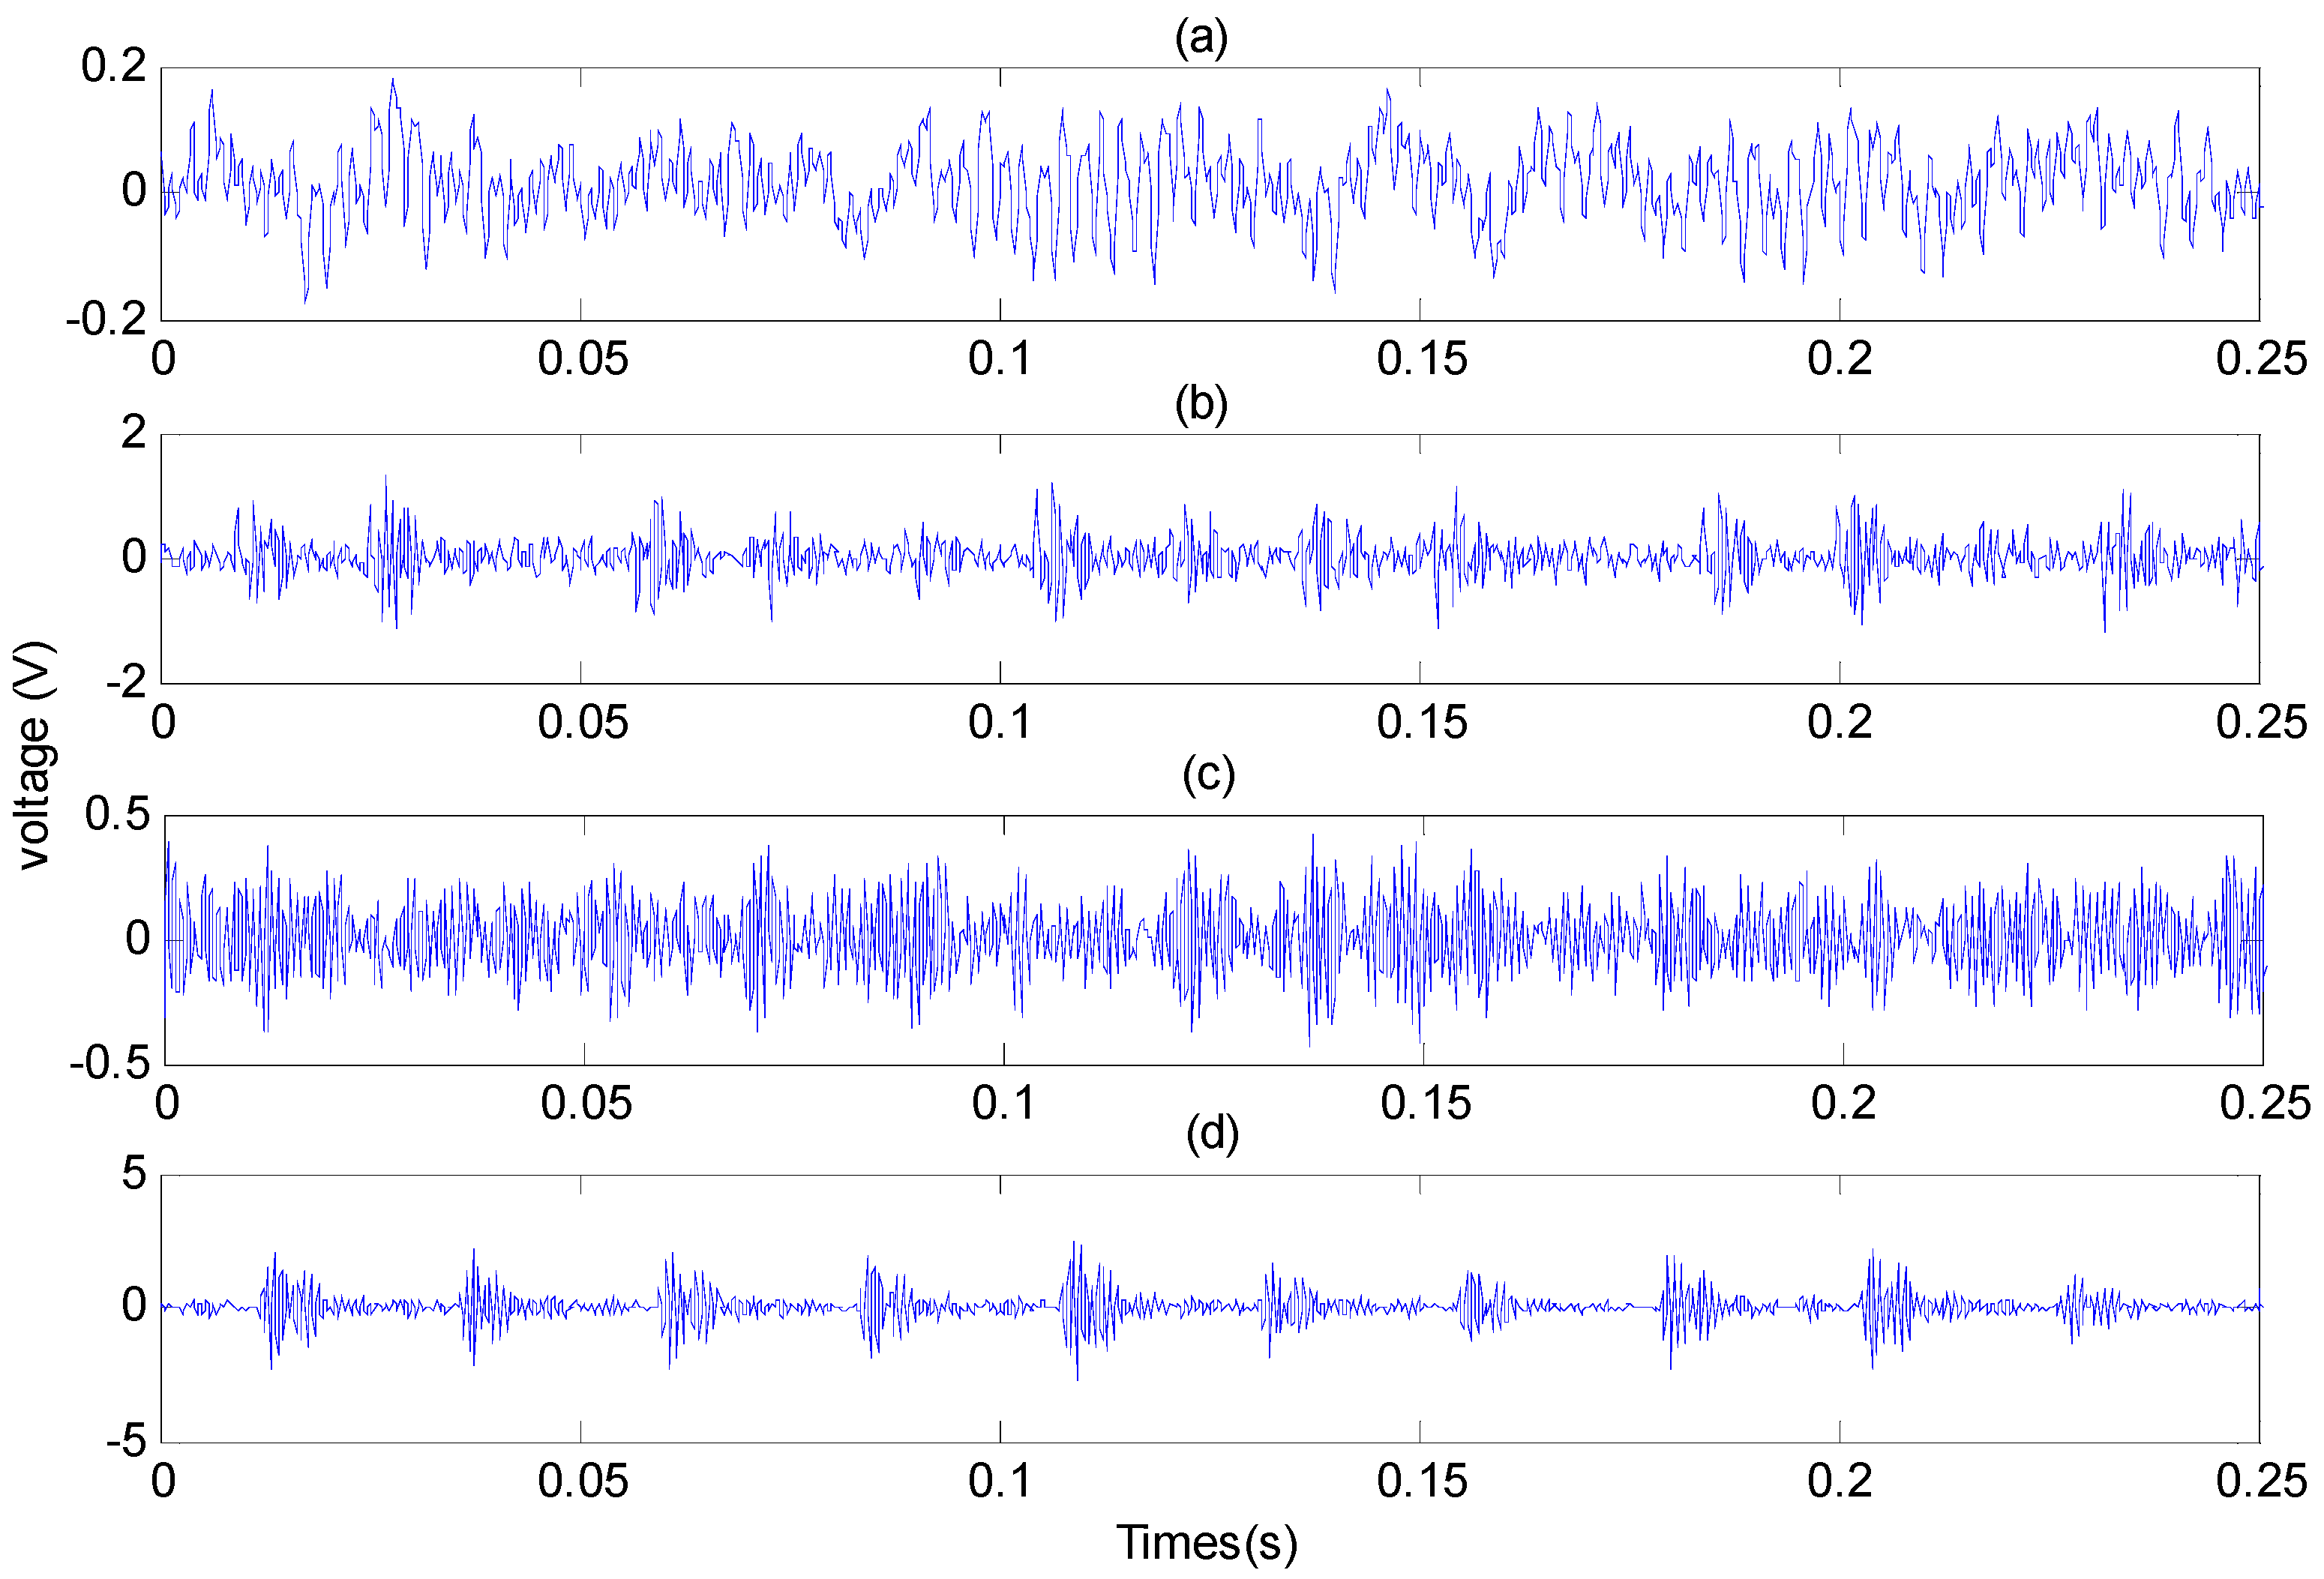
Figure 7 illustrate representative waveforms of the sample vibration signals measured from the test bearings under four initial conditions: (a) signal from a healthy bearing, (b) signal from a bearing with inner ring defect, (c) signal from a bearing with rolling element defect, and (d) signal from a bearing with outer ring defect. Signals in Figure 6 are measured under 0 hp motor load with the motor speed of 1797 rpm, and signals in Figure 7 are measured under 2 hp motor load with the motor speed of 1750 rpm.
Figure 6. Vibration signal waveforms of different conditions (0 hp motor load). (a) healthy bearing, (b) a bearing with inner ring defect, (c) a bearing with rolling element defect and (d) a bearing with outer ring defect.
Entropy 17 06447 g006
Figure 7. Vibration signal waveforms of different conditions (2 hp motor load). (a) healthy bearing, (b) a bearing with inner ring defect, (c) a bearing with rolling element defect and (d) a bearing with outer ring defect.
Entropy 17 06447 g007
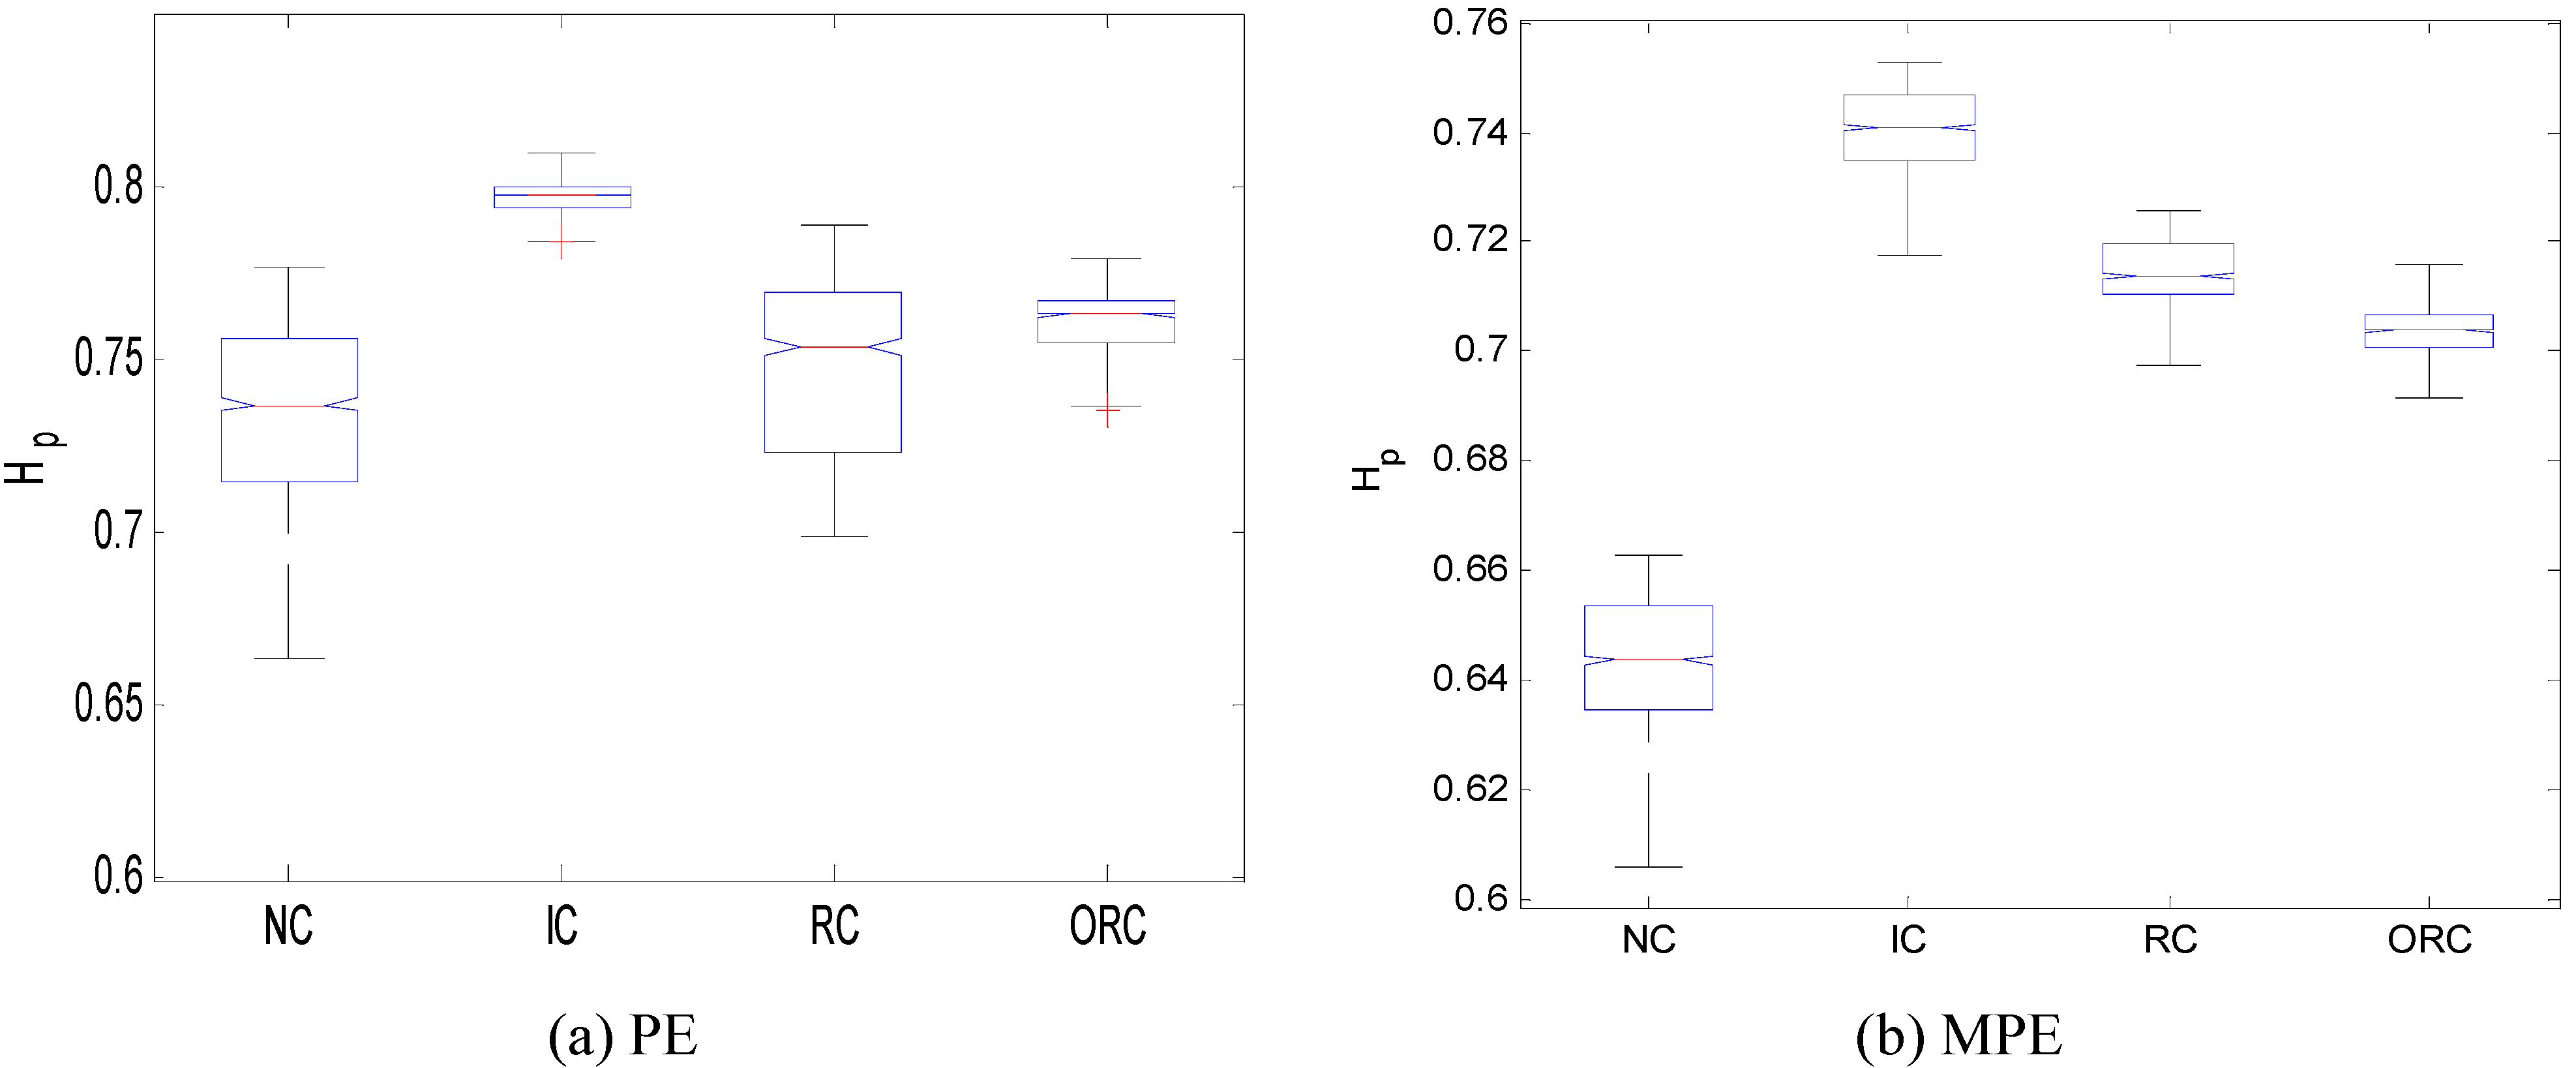
For performance comparison between the MPE and the PE, sample vibration signals of bearings shown in Figure 6 are used for analysis, and the corresponding single factor analysis result is shown in Figure 8. In the processing, the scale of the MPE is selected as 4, by referring to research in [17] and the experiments. From Figure 8, it can be seen that the differentiation performance of the MPE is higher than that of the PE.
Figure 8. Boxplot of (a) permutation entropy (PE) and (b) multi-scale permutation entropy (MPE) values on normal condition (NC), inner ring defect condition (IC), rolling element defect condition (RC) and outer ring defect condition (OC).
Entropy 17 06447 g008
Each signal shown in Figure 6 is decomposed into eight sub-frequency band signals firstly. Then, the PE and MPE value of each sub-frequency band signal are calculated. The results of the PE and the MPE are shown in Table 4 and Table 5, respectively.
Table 4. Permutation entropy (PE) value of each sub-frequency band.
SignalPE value
Band 1Band 2Band 3Band 4Band 5Band 6Band 7Band 8
(a)0.72600.72230.71130.75020.71130.75020.75020.7693
(b)0.79890.80420.80420.79230.80620.80230.80230.7887
(c)0.89760.82760.82760.77420.82760.77420.77420.7138
(d)0.88490.85260.85260.81890.85260.81890.81890.8130
Table 5. Multi-scale permutation entropy (MPE) value of each sub-frequency band.
SignalMPE value
Band 1Band 2Band 3Band 4Band 5Band 6Band 7Band 8
(a)0.66090.67090.60470.59420.60370.60110.60110.6256
(b)0.74910.73410.73410.75300.76550.75300.75300.7631
(c)0.86360.85410.85410.83020.85410.83020.83020.8069
(d)0.75650.70420.72420.72990.70420.70990.70990.7102
The parameters in Table 4 and Table 5 were quantified by Lloyds algorithm in Equation (13) as feature vectors for training the HMMs of different conditions.
A total of 160 feature vectors were collected from the four conditions, one-fourth of the feature vectors were used for training the classifier and others for signal classification, and the classification results are listed in Table 6. Out of 120 test feature vectors, only seven cases were not correctly classified, and the overall classification rate is 94.2%.
Table 6. Classification results of the method based on wavelet packet decomposition (WPD) and multi-scale permutation entropy (MPE).
Fault typeTest sampleClassification resultsClassification rate (%)Overall classification rate (%)
no defectinner ring defectrolling element defectouter ring defect
no defect302901096.794.2
inner ring defect301280193.3
rolling element defect300128193.3
outer ring defect301102893.3
For comparison, Table 7 list classification results of the WPD-PE method, and Table 8 lists classification results of the MPE alone method. From the comparison results, the proposed method is efficient for rolling bearing fault diagnosis, and the overall classification rate of the proposed method is higher, to a certain extent, than the MPE method and the WPD-PE method.
Table 7. Classification results of the wavelet packet decomposition multi-scale permutation entropy (WPD-PE) method.
Fault typeTest sampleClassification resultsClassification rate (%)Overall classification rate (%)
no defectinner ring defectrolling element defectouter ring defect
no defect30271119088.3
inner ring defect301262186.7
rolling element defect301226186.7
outer ring defect301202790
Table 8. Classification results of the MPE method.
Fault typeTest sampleClassification resultsClassification rate (%)Overall classification rate (%]
no defectinner ring defectrolling element defectouter ring defect
no defect302801193.389.2
inner ring defect301271190
rolling element defect301225283.3
outer ring defect301202790
In order to further verify the applicability of the proposed method, signals measured under 2 hp motor load which are shown in Figure 7 are processed. The classification result is listed in Table 9. The overall classification rate of the proposed fault detection method under 2 hp motor load condition is 93.3%. However, the classification rate of the MPE method, alone, under this condition is only 84.2%. That is to say, the proposed fault detection method has good applicability.
Table 9. Classification results of signals shown in Figure 7 with proposed method.
Fault typeTest sampleClassification resultsClassification rate (%)Overall classification rate (%)
no defectinner ring defectrolling element defectouter ring defect
no defect302900196.793.3
inner ring defect300281093.3
rolling element defect301127190
outer ring defect301102893.3

4. Conclusions

Aiming at diagnosing rolling bearing faults, a hybrid approach that integrates the WPD with the MPE is proposed in this paper. The WPD is used as the pretreatment to decompose a vibration signal into a set of sub-frequency band signals, and the MPE value of each sub-frequency band signal is calculated. All MPE values of each vibration signal are formed as a feature vector and used as an input to a classifier, where the HMM is chosen to characterize the bearing faults. As compared to the WPD-PE approach, a higher classification rate has shown to be achieved by using the proposed approach (e.g., 95.6% for simulated signals, and 94.2% for experimental data). Since the approach presented in this study is generic in nature, it can be readily adapted to a broad range of applications for machine fault diagnosis.

Acknowledgments

This work has been supported in part by National Natural Science Foundation of China (No.61101163, No. 51175080) and the Nature Science Foundation of Jiangsu Province of China (No. BK2012739).

Author Contributions

Li-Ye Zhao implemented the algorithm and wrote the manuscript, Wei Wang analyzed the data, and Ru-Qiang Yan designed the research and revised the manuscript. All authors have read and approved the final manuscript.

Conflicts of Interest

The authors declare that there is no conflict of interests regarding the publication of this paper.

References

  1. Li, B.; Zhang, P.-L.; Wang, Z.-J.; Mi, S.-S.; Liu, D.-S. A weighted multi-scale morphological gradient filter for rolling element bearing fault detection. ISA Trans. 2011, 50, 599–608. [Google Scholar] [CrossRef] [PubMed]
  2. Yan, R.Q.; Gao, R.X. Wavelet domain principal feature analysis for spindle health diagnosis. Struct. Health Monit. 2011, 10, 631–642. [Google Scholar] [CrossRef]
  3. Cheng, J.S.; Yu, D.J.; Yang, Y. A fault diagnosis approach for roller bearings based on EMD method and AR model. Mech. Syst. Signal Process. 2006, 20, 350–362. [Google Scholar]
  4. Frosini, L.; Harlişca, C.; Szabó, L. Induction machine bearing faults detection by means of statistical processing of the stray flux measurement. IEEE Trans. Ind. Electron. 2015, 62, 1846–1854. [Google Scholar] [CrossRef]
  5. Frosini, L.; Bassi, E. Stator current and motor efficiency as indicators for different types of bearing faults in induction motors. IEEE Trans. Ind. Electron. 2010, 57, 244–251. [Google Scholar] [CrossRef]
  6. Peng, Z.K.; Chu, F.L. Application of the wavelet transform in machine condition monitoring and fault diagnostics: A review with bibliography. Mech. Syst. Signal Process. 2004, 18, 199–221. [Google Scholar] [CrossRef]
  7. Yan, R.Q.; Gao, R.X.; Chen, X.F. Wavelets for fault diagnosis of rotary machines: A review with applications. Signal Process. 2014, 96. [Google Scholar] [CrossRef]
  8. Liu, B.; Ling, S.-F.; Meng, Q.F. Machinery diagnosis based on wavelet packets. J. Vib. Control 1997, 3, 5–17. [Google Scholar]
  9. Wu, J.-D.; Liu, C.-H. An expert system for fault diagnosis in internal combustion engines using wavelet packet transform and neural network. Expert Syst. Appl. 2009, 36, 4278–4286. [Google Scholar] [CrossRef]
  10. Wang, Y.; Xu, G.H.; Liang, L.; Jiang, K.S. Detection of weak transient signals based on wavelet packet transform and manifold learning for rolling element bearing fault diagnosis. Mech. Syst. Signal Process. 2015, 54–55, 259–276. [Google Scholar] [CrossRef]
  11. Tabrizi, A.; Garibaldi, L.; Fasana, A.; Marchesiello, S. Early damage detection of roller bearings using wavelet packet decomposition, ensemble empirical mode decomposition and support vector machine. Meccanica 2015, 50, 865–874. [Google Scholar] [CrossRef]
  12. Gao, R.; Yan, R. Wavelet packet transform-based hybrid signal processing for machine health monitoring and diagnosis. In Proceedings of the 6th International Workshop on Structural Health Monitoring, Stanford, CA, USA, 11–13 September 2007; pp. 598–605.
  13. Malhi, A.; Gao, R.X. PCA-based feature selection scheme for machine defect classification. IEEE Trans. Instrum. Meas. 2004, 53, 1517–1525. [Google Scholar] [CrossRef]
  14. Nair, U.; Krishna, B.M.; Namboothiri, V.N.N.; Nampoori, V.P.N. Permutation entropy based real-time chatter detection using audio signal in turning process. Int. J. Adv. Manuf. Tech. 2010, 46, 61–68. [Google Scholar] [CrossRef]
  15. Li, X.L.; Ouyang, G.X.; Liang, Z.H. Complexity measure of motor current signals for tool flute breakage detection in end milling. Int. J. Mach. Tool Manuf. 2008, 48, 371–379. [Google Scholar] [CrossRef]
  16. Yan, R.Q.; Liu, Y.B.; Gao, R.X. Permutation entropy: A nonlinear statistical measure for status characterization of rotary machines. Mech. Syst. Signal Process. 2012, 29, 474–484. [Google Scholar] [CrossRef]
  17. Wu, S.-D.; Wu, P.-H.; Wu, C.-W.; Ding, J.-J.; Wang, C.-C. Bearing fault diagnosis based on multiscale permutation entropy and support vector machine. Entropy 2012, 14, 1343–1356. [Google Scholar] [CrossRef]
  18. Zheng, J.D.; Cheng, J.S.; Yang, Y. Multiscale permutation entropy based rolling bearing fault diagnosis. Shock Vib. 2014, 2014. [Google Scholar] [CrossRef]
  19. Zarei, J.; Poshtan, J. Bearing fault detection using wavelet packet transform of induction motor stator current. Tribol. Int. 2007, 40, 763–769. [Google Scholar] [CrossRef]
  20. Winger, L.L. Linearly constrained generalized Lloyd algorithm for reduced codebook vector quantization. IEEE Trans. Signal Process. 2001, 49, 1501–1509. [Google Scholar] [CrossRef]
  21. Liu, X.-M.; Qiu, J.; Liu, G.-J. A diagnosis model based on AR-Continuous HMM and its application. Mech. Sci. Technol. 2005, 24. [Google Scholar] [CrossRef]
  22. Baruah, P.; Chinnam, R.B. HMMs for diagnostics and prognostics in machining processes. Int. J. Prod. Res. 2005, 43, 1275–1293. [Google Scholar] [CrossRef]
  23. Bearing Data Center, Case Western Reserve University. Available online: http://csegroups.case.edu/bearingdatacenter/pages/download-data-file (accessed on 18 September 2015).

