1. Introduction
Analysis of entropy measures, typically like approximate entropy (ApEn) and sample entropy (SampEn), can provide a valuable tool for quantifying the regularity of physiological time series and provide important insights for understanding the underlying mechanisms of the cardiovascular system [
1,
2]. There are usually three unknown parameters that need to be initialized before performing entropy measures: (1) embedding dimension
m, (2) tolerance threshold
r, and (3) time series length
N [
2]. The parameter
m determines the length of the vectors to be compared,
r is the tolerance for accepting similar patterns between two vectors and
N is the total data point number of the analyzed time series. Although these parameters are critical in determining the outcomes of entropy measures, no guidelines exist for optimizing their values for distinguishing congestive heart failure (CHF) from normal sinus rhythm (NSR) subjects in clinical applications. Typically, for clinical data, recommended
m and
r values are
m = 1 and
m = 2 and
r between 0.1 and 0.25 times the standard deviation (SD) of the data [
3]. The setting ranges of
N usually vary largely, from dozens up to thousands of points [
4]. The aforementioned recommendation is mainly based on the application of ApEn to relatively slow dynamic signals such as heart rate [
1,
3] and hormone secretion data [
5], as well as used for ECG signal quality assessment [
6,
7]. Because SampEn is regarded as a modified version of ApEn designed to solve its shortcomings, such as bias and relative inconsistency [
2], these recommended values are also applicable to SampEn [
2,
8,
9,
10].
For the effect of parameter
N on the entropy results, a previous study reported that it did not have as great of an impact on the calculation of SampEn [
2]. Considering that it is difficult to acquire large time series from humans, the choice of
N used is critical for these short data sets. This is especially true for studies with pathological populations that are limited in their clinical measurement. However, caution has been advised when using time series of less than 200 points for either ApEn or SampEn [
10,
11]. Similar study also reported that entropy measures are extremely sensitive to the parameter
N for very short data sets [
12]. When small
N values are used to compute SampEn, the estimates can be inaccurate, because they can present a large variance.
The choice of the parameters
m and
r gained larger attention compared with the parameter
N due to the inherent sensitivity of both ApEn and SampEn [
13]. The selection of
m might depend on the time series length. The selection of
r appears to be more difficult. For smaller
r values, poor conditional probability estimates are achieved, while for larger
r values, too much detailed system information is lost and SampEn tends to 0 for all the processes [
2,
5,
13,
14]. Amount of variance in the time series may also affect the entropy results. A greater SD will increase the
r value for consideration of a vector matching and vice versa with a smaller SD. To avoid a significant noise contribution on SampEn computation, one must choose
r larger than most of the noise [
11,
14]. So the original suggestion between 0.1 and 0.25 times the SD of the time series for
r does not always demonstrate the best results for all data sets and therefore, elaborate methods to choose
r have been developed. The parameter
r may be chosen based on the minimization of the maximum SampEn relative error and conditional probability [
8] or to provide the maximum value of ApEn [
15] or SmapEn [
16,
17]. However, our recent study suggested that the maximum value method may not be appropriate for analyzing the nonlinear cardiovascular signals and is only appropriate for known random time series [
16,
18]. To get optimal
m and
r values, a combination effect analysis method of
m and
r was reported [
3,
9], such as SampEn was computed using a 10 × 20 matrix of combinations of
m = 1, 2, …, 10 and
r = 0.05, 0.1, 0.15, …, 1 times the SD of the analyzed time series.
On the other hand, whether ApEn or SampEn, the decision rule for vector similarity is based on the Heaviside function and it is very rigid because two vectors are considered as similar vectors only when they are within the tolerance threshold
r, whereas the vectors just outside this tolerance are ignored [
7,
19,
20,
21]. This rigid boundary may induce to the abrupt changes of entropy values when the tolerance threshold
r changes slightly, and even failure to define the entropy if no vector-matching could be found for very small
r [
2,
7,
19,
20,
21,
22]. To enhance the statistical stability, we previously proposed a fuzzy measure entropy (FuzzyMEn) method, which used a fuzzy membership function to substitute the Heaviside function to make a gradually varied entropy value when
r monotonously changes. Meanwhile, FuzzyMEn combined both the local similarity and global similarity in a time series and has a good discrimination for time series with different inherent complexity. However, the aforementioned three parameters,
i.e.,
m,
r and
N, also need to be initialized when performing FuzzyMEn analysis. The problem of parameter selection also exists in FuzzyMEn.
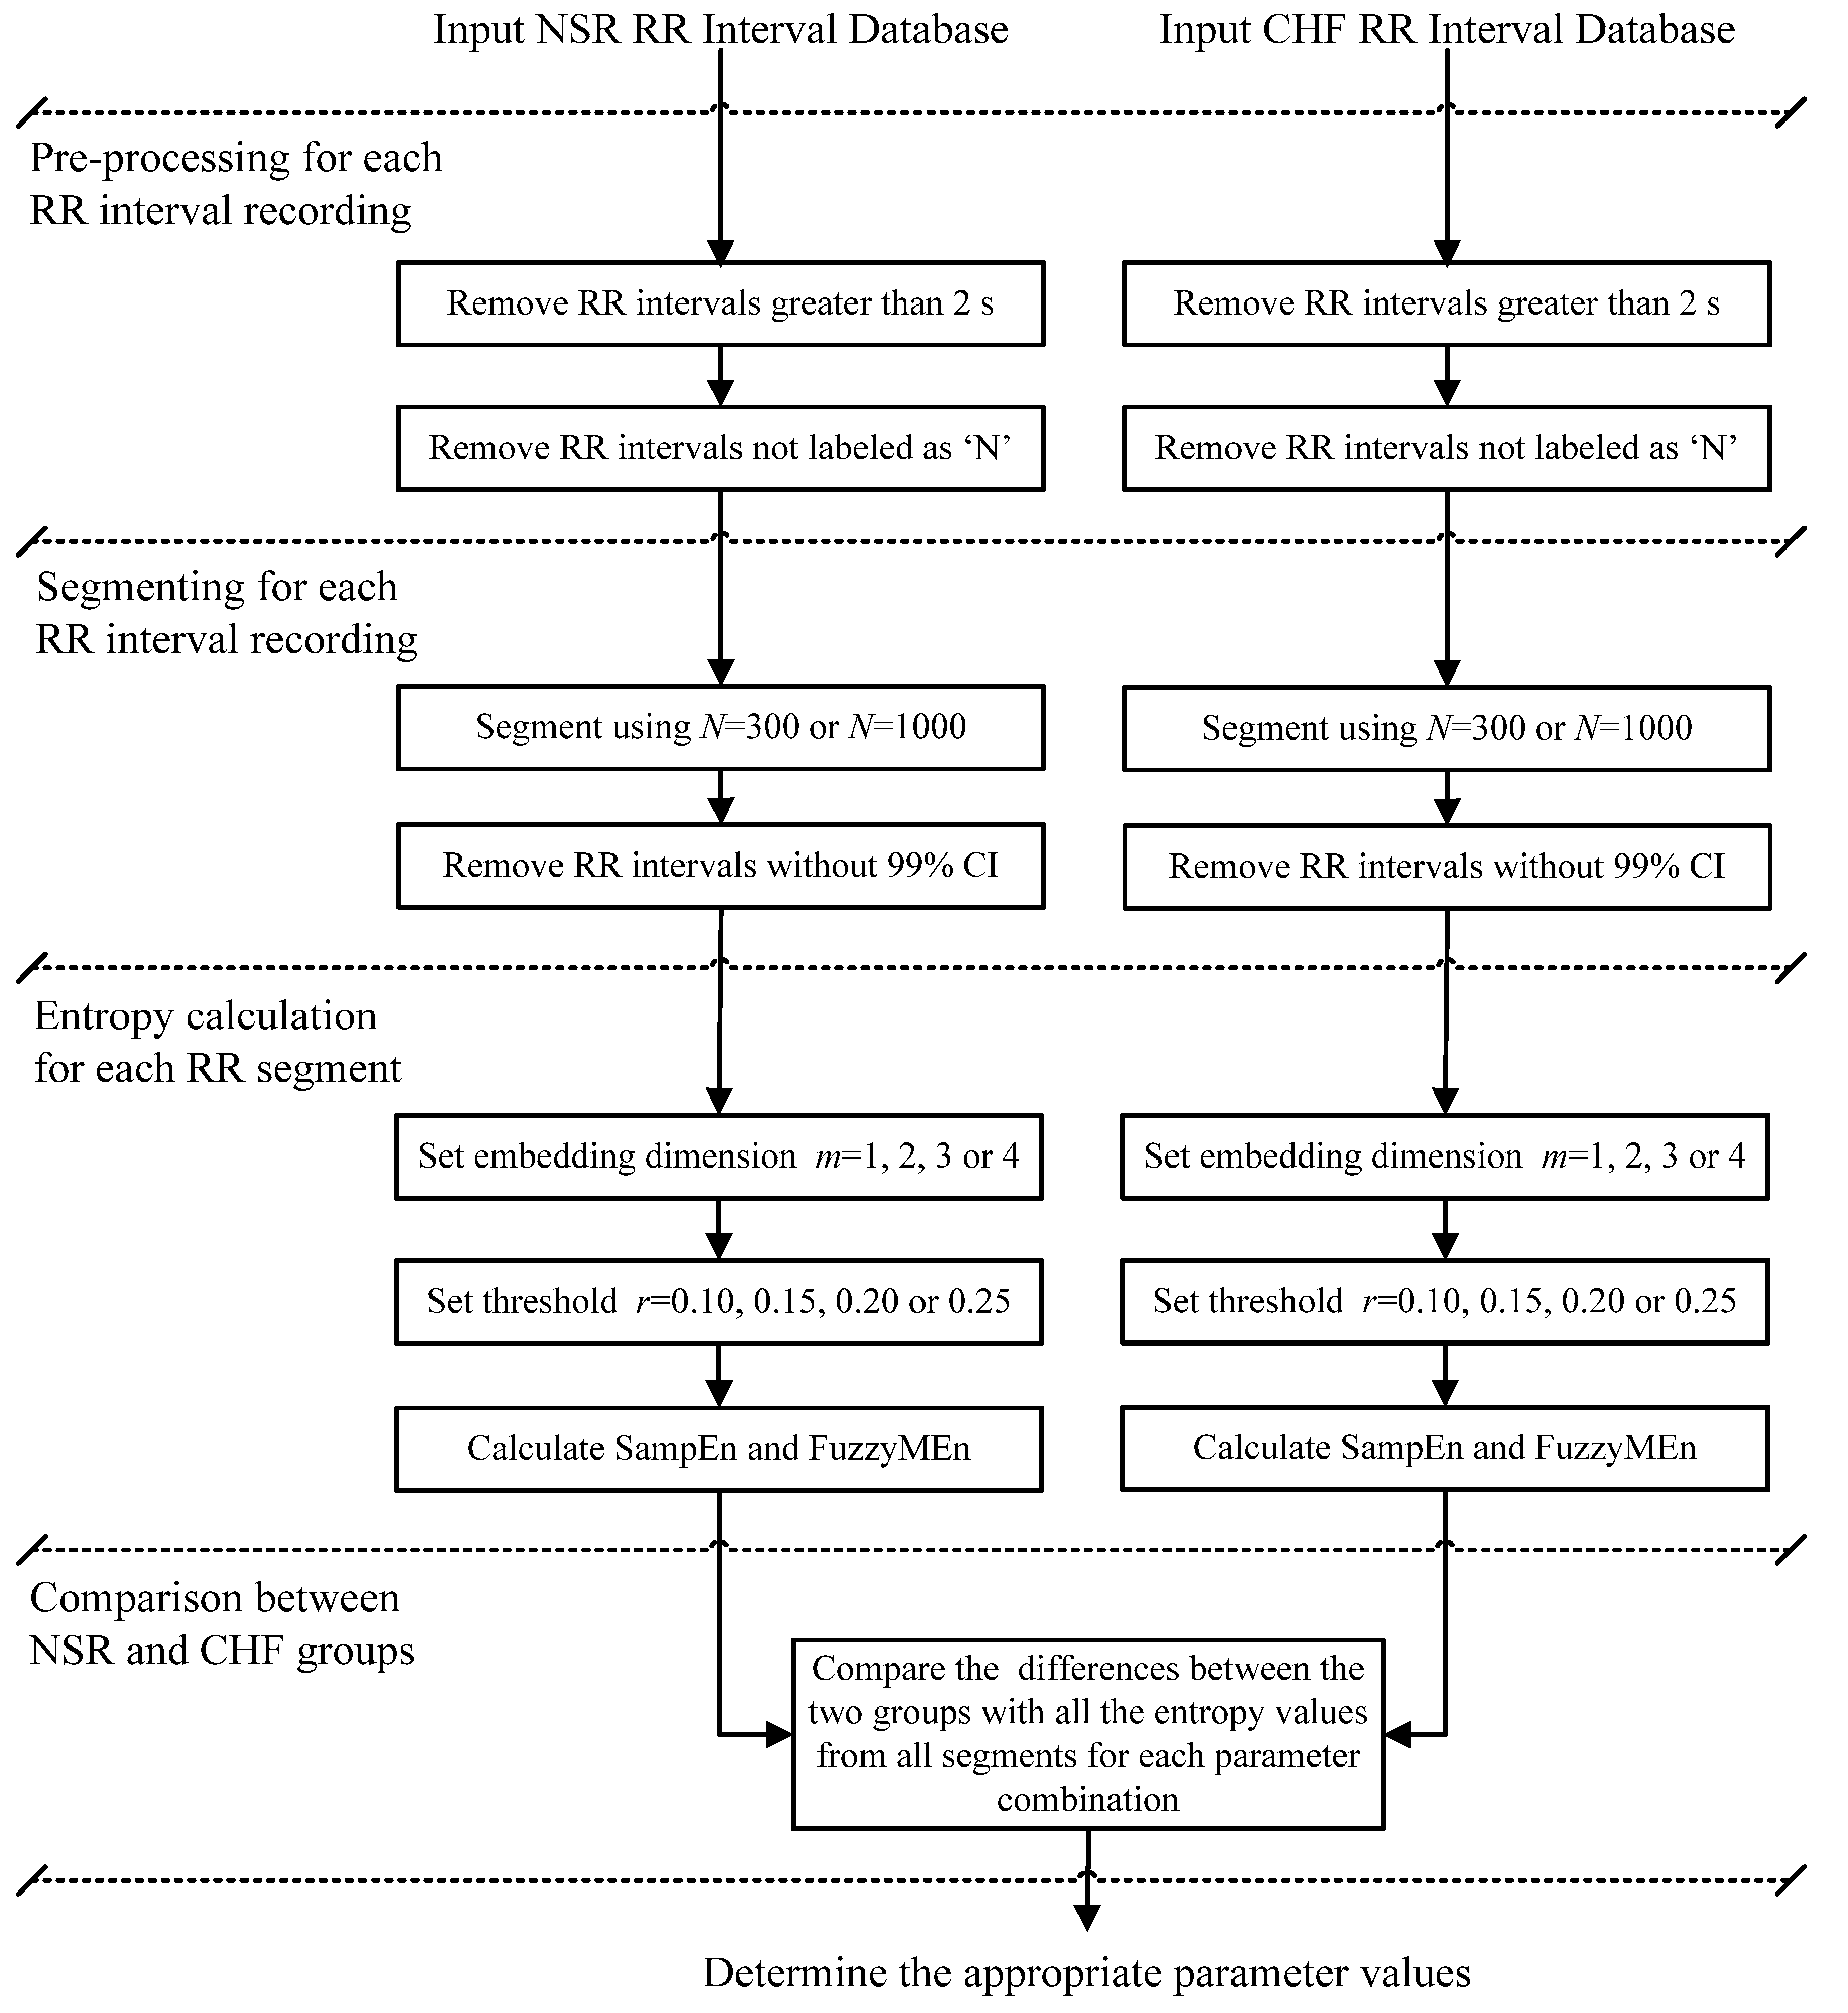
Therefore the main goal of the present study was to carry out an in-depth analysis to determine the appropriate parameters for both SampEn and FuzzyMEn to achieve optimized classification between NSR and CHF subjects for the long-term Interbeat (RR) Interval Databases from
http://www.physionet.org [
23]. We aimed to examine: (1) the effect of changing the parameters
m,
r, and
N on the outputs of both SampEn and FuzzyMEn values for analyzing both NSR and CHF RR time series signals; and (2) which algorithm provides the best discrimination between NSR and CHF groups. The latter is important due to the fact that entropy values are only relative values and it is not meaningful to report entropy values for a pathological group without reporting the control group values. Thus, if true differences between the two groups exist, the algorithm should be able to discriminate them. To do this, several combinations of
m and
r, together with two different time series length
N, have been analyzed. By using both NSR and CHF subjects, this allowed for the investigation of different parameter combinations with SampEn and FuzzyMEn to discriminate between two groups. We hypothesized that the values of SampEn and FuzzyMEn would change as a function of
m,
r, and
N; however, FuzzyMEn would maintain relative consistency when parameter changed. We also hypothesized that the CHF subjects would demonstrate a loss of complexity due to the pathological process, either an increased or decreased entropy values, as compared to the NSR subjects.
4. Discussion
The motivation of this study was based on the fact that no generalized guidelines exist for the appropriate parameters selection of m, r and N when SampEn and FuzzyMEn were applied to distinguish CHF patients from NSR subjects in clinical application, especially for our new proposed FuzzyMEn method.
Table 2.
Results of SampEn and FuzzyMEn from the different combinations of embedding dimension m and tolerance threshold r when setting segment length N = 300. The parameter m changed from 1 to 4 with a step of 1 and r changed from 0.10 to 0.25 with a step of 0.05. p-value measured the statistical significance between the NSR and CHF groups at each combination of (m, r).
| Tolerance threshold | Group | Embedding dimension for SampEn | Embedding dimension for FuzzyMEn |
|---|
| m = 1 | m = 2 | m = 3 | m = 4 | m = 1 | m = 2 | m = 3 | m = 4 |
|---|
| | NSR | 1.95 ± 0.18 | 1.84 ± 0.17 | 1.63 ± 0.15 | NaN | −0.06 ± 0.20 | 1.40 ± 0.19 | 1.18 ± 0.15 | 1.08 ± 0.13 |
| r = 0.10 | CHF | 1.64 ± 0.30 | 1.51 ± 0.31 | 1.31 ± 0.23 | 1.09 ± 0.19 | 0.20 ± 0.37 | 1.63 ± 0.36 | 1.27 ± 0.23 | 1.18 ± 0.27 |
| | p-value | 4 × 10⁻⁸ ** | 7 × 10⁻⁸ ** | 0.003 ** | -- | 4 × 10⁻⁵ ** | 2 × 10⁻⁴ ** | 0.042 * | 0.027 * |
| | NSR | 1.73 ± 0.14 | 1.64 ± 0.13 | 1.54 ± 0.14 | NaN | −0.15 ± 0.19 | 1.18 ± 0.18 | 1.00 ± 0.13 | 0.92 ± 0.12 |
| r = 0.15 | CHF | 1.55 ± 0.23 | 1.44 ± 0.31 | 1.29 ± 0.21 | 1.08 ± 0.19 | 0.10 ± 0.34 | 1.40 ± 0.34 | 1.08 ± 0.20 | 0.99 ± 0.24 |
| | p-value | 2 × 10⁻⁵ ** | 5 × 10⁻⁶ ** | 0.003 ** | -- | 3 × 10⁻⁵ ** | 2 × 10⁻⁴ ** | 0.047 * | 0.054 |
| | NSR | 1.49 ± 0.15 | 1.40 ± 0.14 | 1.32 ± 0.16 | NaN | −0.20 ± 0.17 | 1.05 ± 0.16 | 0.89 ± 0.12 | 0.82 ± 0.11 |
| r = 0.20 | CHF | 1.45 ± 0.18 | 1.34 ± 0.18 | 1.25 ± 0.18 | 1.12 ± 0.20 | 0.03 ± 0.32 | 1.25 ± 0.32 | 0.96 ± 0.21 | 0.88 ± 0.21 |
| | p-value | 0.26 | 0.10 | 0.11 | -- | 3 × 10⁻⁵ ** | 3 × 10⁻⁴ ** | 0.061 | 0.079 |
| | NSR | 1.28 ± 0.15 | 1.19 ± 0.14 | 1.14 ± 0.15 | 1.01 ± 0.09 | −0.24 ± 0.16 | 0.95 ± 0.15 | 0.80 ± 0.12 | 0.74 ± 0.10 |
| r = 0.25 | CHF | 1.33 ± 0.17 | 1.23 ± 0.17 | 1.17 ± 0.17 | 1.10 ± 0.17 | −0.02 ± 0.30 | 1.13 ± 0.30 | 0.87 ± 0.19 | 0.79 ± 0.19 |
| | p-value | 0.14 | 0.35 | 0.50 | 0.39 | 4 × 10⁻⁵ ** | 4 × 10⁻⁴ ** | 0.063 | 0.10 |
Table 3.
Results of SampEn and FuzzyMEn from the different combinations of embedding dimension m and tolerance threshold r when setting segment length N = 1,000. The parameter m changed from 1 to 4 with a step of 1 and r changed from 0.10 to 0.25 with a step of 0.05. p-value measured the statistical significance between the NSR and CHF groups at each combination of (m, r).
| Tolerance threshold | Group | Embedding dimension for SampEn | Embedding dimension for FuzzyMEn |
|---|
| m = 1 | m = 2 | m = 3 | m = 4 | m = 1 | m = 2 | m = 3 | m = 4 |
|---|
| | NSR | 1.91 ± 0.16 | 1.80 ± 0.15 | 1.72 ± 0.14 | 1.58 ± 0.12 | −0.26 ± 0.19 | 1.17 ± 0.19 | 0.99 ± 0.15 | 0.90 ± 0.13 |
| r = 0.10 | CHF | 1.66 ± 0.27 | 1.53 ± 0.29 | 1.43 ± 0.27 | 1.27 ± 0.21 | −0.01 ± 0.35 | 1.38 ± 0.35 | 1.07 ± 0.24 | 0.97 ± 0.25 |
| | p-value | 7 × 10⁻⁷ ** | 3 × 10⁻⁷ ** | 8 × 10⁻⁹ ** | 5 × 10⁻⁶ ** | 7 × 10⁻⁵ ** | 6 × 10⁻⁴ ** | 0.079 | 0.10 |
| | NSR | 1.61 ± 0.16 | 1.50 ± 0.15 | 1.43 ± 0.15 | 1.35 ± 0.14 | −0.33 ± 0.17 | 0.98 ± 0.17 | 0.83 ± 0.13 | 0.76 ± 0.11 |
| r = 0.15 | CHF | 1.53 ± 0.19 | 1.40 ± 0.20 | 1.33 ± 0.20 | 1.24 ± 0.19 | −0.10 ± 0.32 | 1.16 ± 0.32 | 0.90 ± 0.22 | 0.81 ± 0.21 |
| | p-value | 0.055 | 0.013 * | 0.008 ** | 0.013 * | 6 × 10⁻⁵ ** | 0.001 ** | 0.093 | 0.15 |
| | NSR | 1.33 ± 0.16 | 1.23 ± 0.15 | 1.16 ± 0.15 | 1.11 ± 0.15 | −0.36 ± 0.16 | 0.86 ± 0.16 | 0.73 ± 0.12 | 0.67 ± 0.10 |
| r = 0.20 | CHF | 1.39 ± 0.17 | 1.27 ± 0.17 | 1.19 ± 0.17 | 1.13 ± 0.17 | −0.15 ± 0.30 | 1.02 ± 0.29 | 0.79 ± 0.20 | 0.71 ± 0.19 |
| | p-value | 0.091 | 0.31 | 0.46 | 0.57 | 7 × 10⁻⁵ ** | 0.001 ** | 0.098 | 0.19 |
| | NSR | 1.11 ± 0.15 | 1.02 ± 0.13 | 0.96 ± 0.13 | 0.92 ± 0.13 | −0.38 ± 0.14 | 0.77 ± 0.14 | 0.66 ± 0.11 | 0.60 ± 0.09 |
| r = 0.25 | CHF | 1.25 ± 0.19 | 1.13 ± 0.18 | 1.06 ± 0.18 | 1.01 ± 0.18 | −0.19 ± 0.28 | 0.92 ± 0.27 | 0.71 ± 0.18 | 0.63 ± 0.17 |
| | p-value | 3 × 10⁻⁴ ** | 0.003 ** | 0.007 ** | 0.015 * | 7 × 10⁻⁵ ** | 0.002 ** | 0.10 | 0.23 |
Table 4.
Results of SampEn and FuzzyMEn for the simulated Gauss and fractional Brownian motion (fBm) signals from the different combinations of (m, r) when setting N = 300. The mean and standard deviation (SD) values were from 20 repeats for each type of signal.
Table 4.
Results of SampEn and FuzzyMEn for the simulated Gauss and fractional Brownian motion (fBm) signals from the different combinations of (m, r) when setting N = 300. The mean and standard deviation (SD) values were from 20 repeats for each type of signal.
| Tolerance threshold | Signal | Embedding dimension for SampEn | Embedding dimension for FuzzyMEn |
|---|
| m = 1 | m = 2 | m = 3 | m = 4 | m = 1 | m = 2 | m = 3 | m = 4 |
|---|
| r = 0.10 | Gauss noise | 2.88 ± 0.08 | 3.01 ± 0.38 | NaN | NaN | 1.31 ± 0.03 | 2.92 ± 0.07 | 2.64 ± 0.08 | 2.49 ± 0.14 |
| fBm (H = 0.3) | 1.82 ± 0.29 | 1.84 ± 0.35 | NaN | NaN | −0.50 ± 0.28 | 1.03 ± 0.36 | 0.92 ± 0.32 | 0.86 ± 0.31 |
| fBm (H = 0.5) | 1.31 ± 0.31 | 1.31 ± 0.32 | 1.34 ± 0.40 | NaN | −0.90 ± 0.15 | 0.54 ± 0.22 | 0.51 ± 0.21 | 0.49 ± 0.19 |
| fBm (H = 0.7) | 0.45 ± 0.24 | 0.45 ± 0.24 | 0.44 ± 0.23 | 0.42 ± 0.22 | −1.20 ± 0.14 | 0.14 ± 0.09 | 0.14 ± 0.09 | 0.14 ± 0.09 |
| r = 0.15 | Gauss noise | 2.48 ± 0.07 | 2.47 ± 0.22 | NaN | NaN | 1.11 ± 0.04 | 2.57 ± 0.07 | 2.30 ± 0.07 | 2.17 ± 0.07 |
| fBm (H = 0.3) | 1.46 ± 0.32 | 1.43 ± 0.32 | 1.38 ± 0.30 | 1.36 ± 0.31 | −0.51 ± 0.31 | 0.87 ± 0.37 | 0.78 ± 0.33 | 0.74 ± 0.32 |
| fBm (H = 0.5) | 0.78 ± 0.20 | 0.78 ± 0.21 | 0.75 ± 0.20 | 0.73 ± 0.20 | −0.96 ± 0.08 | 0.30 ± 0.11 | 0.29 ± 0.10 | 0.28 ± 0.10 |
| fBm (H = 0.7) | 0.36 ± 0.15 | 0.36 ± 0.15 | 0.36 ± 0.14 | 0.34 ± 0.14 | −1.03 ± 0.16 | 0.13 ± 0.06 | 0.13 ± 0.06 | 0.14 ± 0.07 |
| r = 0.20 | Gauss noise | 2.20 ± 0.04 | 2.22 ± 0.13 | 2.25 ± 0.49 | NaN | 0.98 ± 0.04 | 2.37 ± 0.07 | 2.09 ± 0.08 | 1.96 ± 0.08 |
| fBm (H = 0.3) | 1.24 ± 0.23 | 1.21 ± 0.23 | 1.19 ± 0.23 | 1.22 ± 0.42 | −0.53 ± 0.22 | 0.77 ± 0.26 | 0.68 ± 0.23 | 0.63 ± 0.22 |
| fBm (H = 0.5) | 0.65 ± 0.31 | 0.65 ± 0.32 | 0.65 ± 0.33 | 0.65 ± 0.34 | −0.88 ± 0.19 | 0.33 ± 0.21 | 0.31 ± 0.20 | 0.30 ± 0.19 |
| fBm (H = 0.7) | 0.21 ± 0.11 | 0.21 ± 0.11 | 0.21 ± 0.11 | 0.20 ± 0.11 | −1.05 ± 0.11 | 0.09 ± 0.05 | 0.09 ± 0.05 | 0.09 ± 0.05 |
| r = 0.25 | Gauss noise | 1.97 ± 0.04 | 1.96 ± 0.10 | 2.01 ± 0.21 | NaN | 0.88 ± 0.04 | 2.21 ± 0.05 | 1.95 ± 0.05 | 1.82 ± 0.06 |
| fBm (H = 0.3) | 1.02 ± 0.27 | 1.01 ± 0.27 | 1.01 ± 0.30 | 1.03 ± 0.33 | −0.53 ± 0.22 | 0.67 ± 0.27 | 0.60 ± 0.25 | 0.56 ± 0.23 |
| fBm (H = 0.5) | 0.50 ± 0.22 | 0.48 ± 022 | 0.48 ± 0.23 | 0.48 ± 0.24 | −0.88 ± 0.12 | 0.26 ± 0.15 | 0.25 ± 0.14 | 0.24 ± 0.14 |
| fBm (H = 0.7) | 0.16 ± 0.08 | 0.15 ± 0.09 | 0.15 ± 0.09 | 0.15 ± 0.09 | −1.00 ± 0.13 | 0.08 ± 0.04 | 0.08 ± 0.05 | 0.08 ± 0.05 |
The present study was aimed to determine the appropriate parameters m, r, and N for SampEn and FuzzyMEn for analyzing both NSR and CHF RR time series signals; and to determine which algorithm provides the best discrimination between NSR and CHF groups. It was hypothesized that (1) the value of SampEn and FuzzyMEn would change as a function of parameters m, r, and N, (2) FuzzyMEn would demonstrate better relative consistency as compared to SampEn, and (3) both algorithms would able to discriminate between the two groups. The results fully supported hypotheses 1 and 2 and only partially supported hypothesis 3. Overall the results demonstrate that both SampEn and FuzzyMEn are sensitive to the parameter selection for analyzing short RR interval time series and extreme caution should be paid when choosing appropriate parameters for distinguishing CHF patients from NSR subjects.
Figure 2.
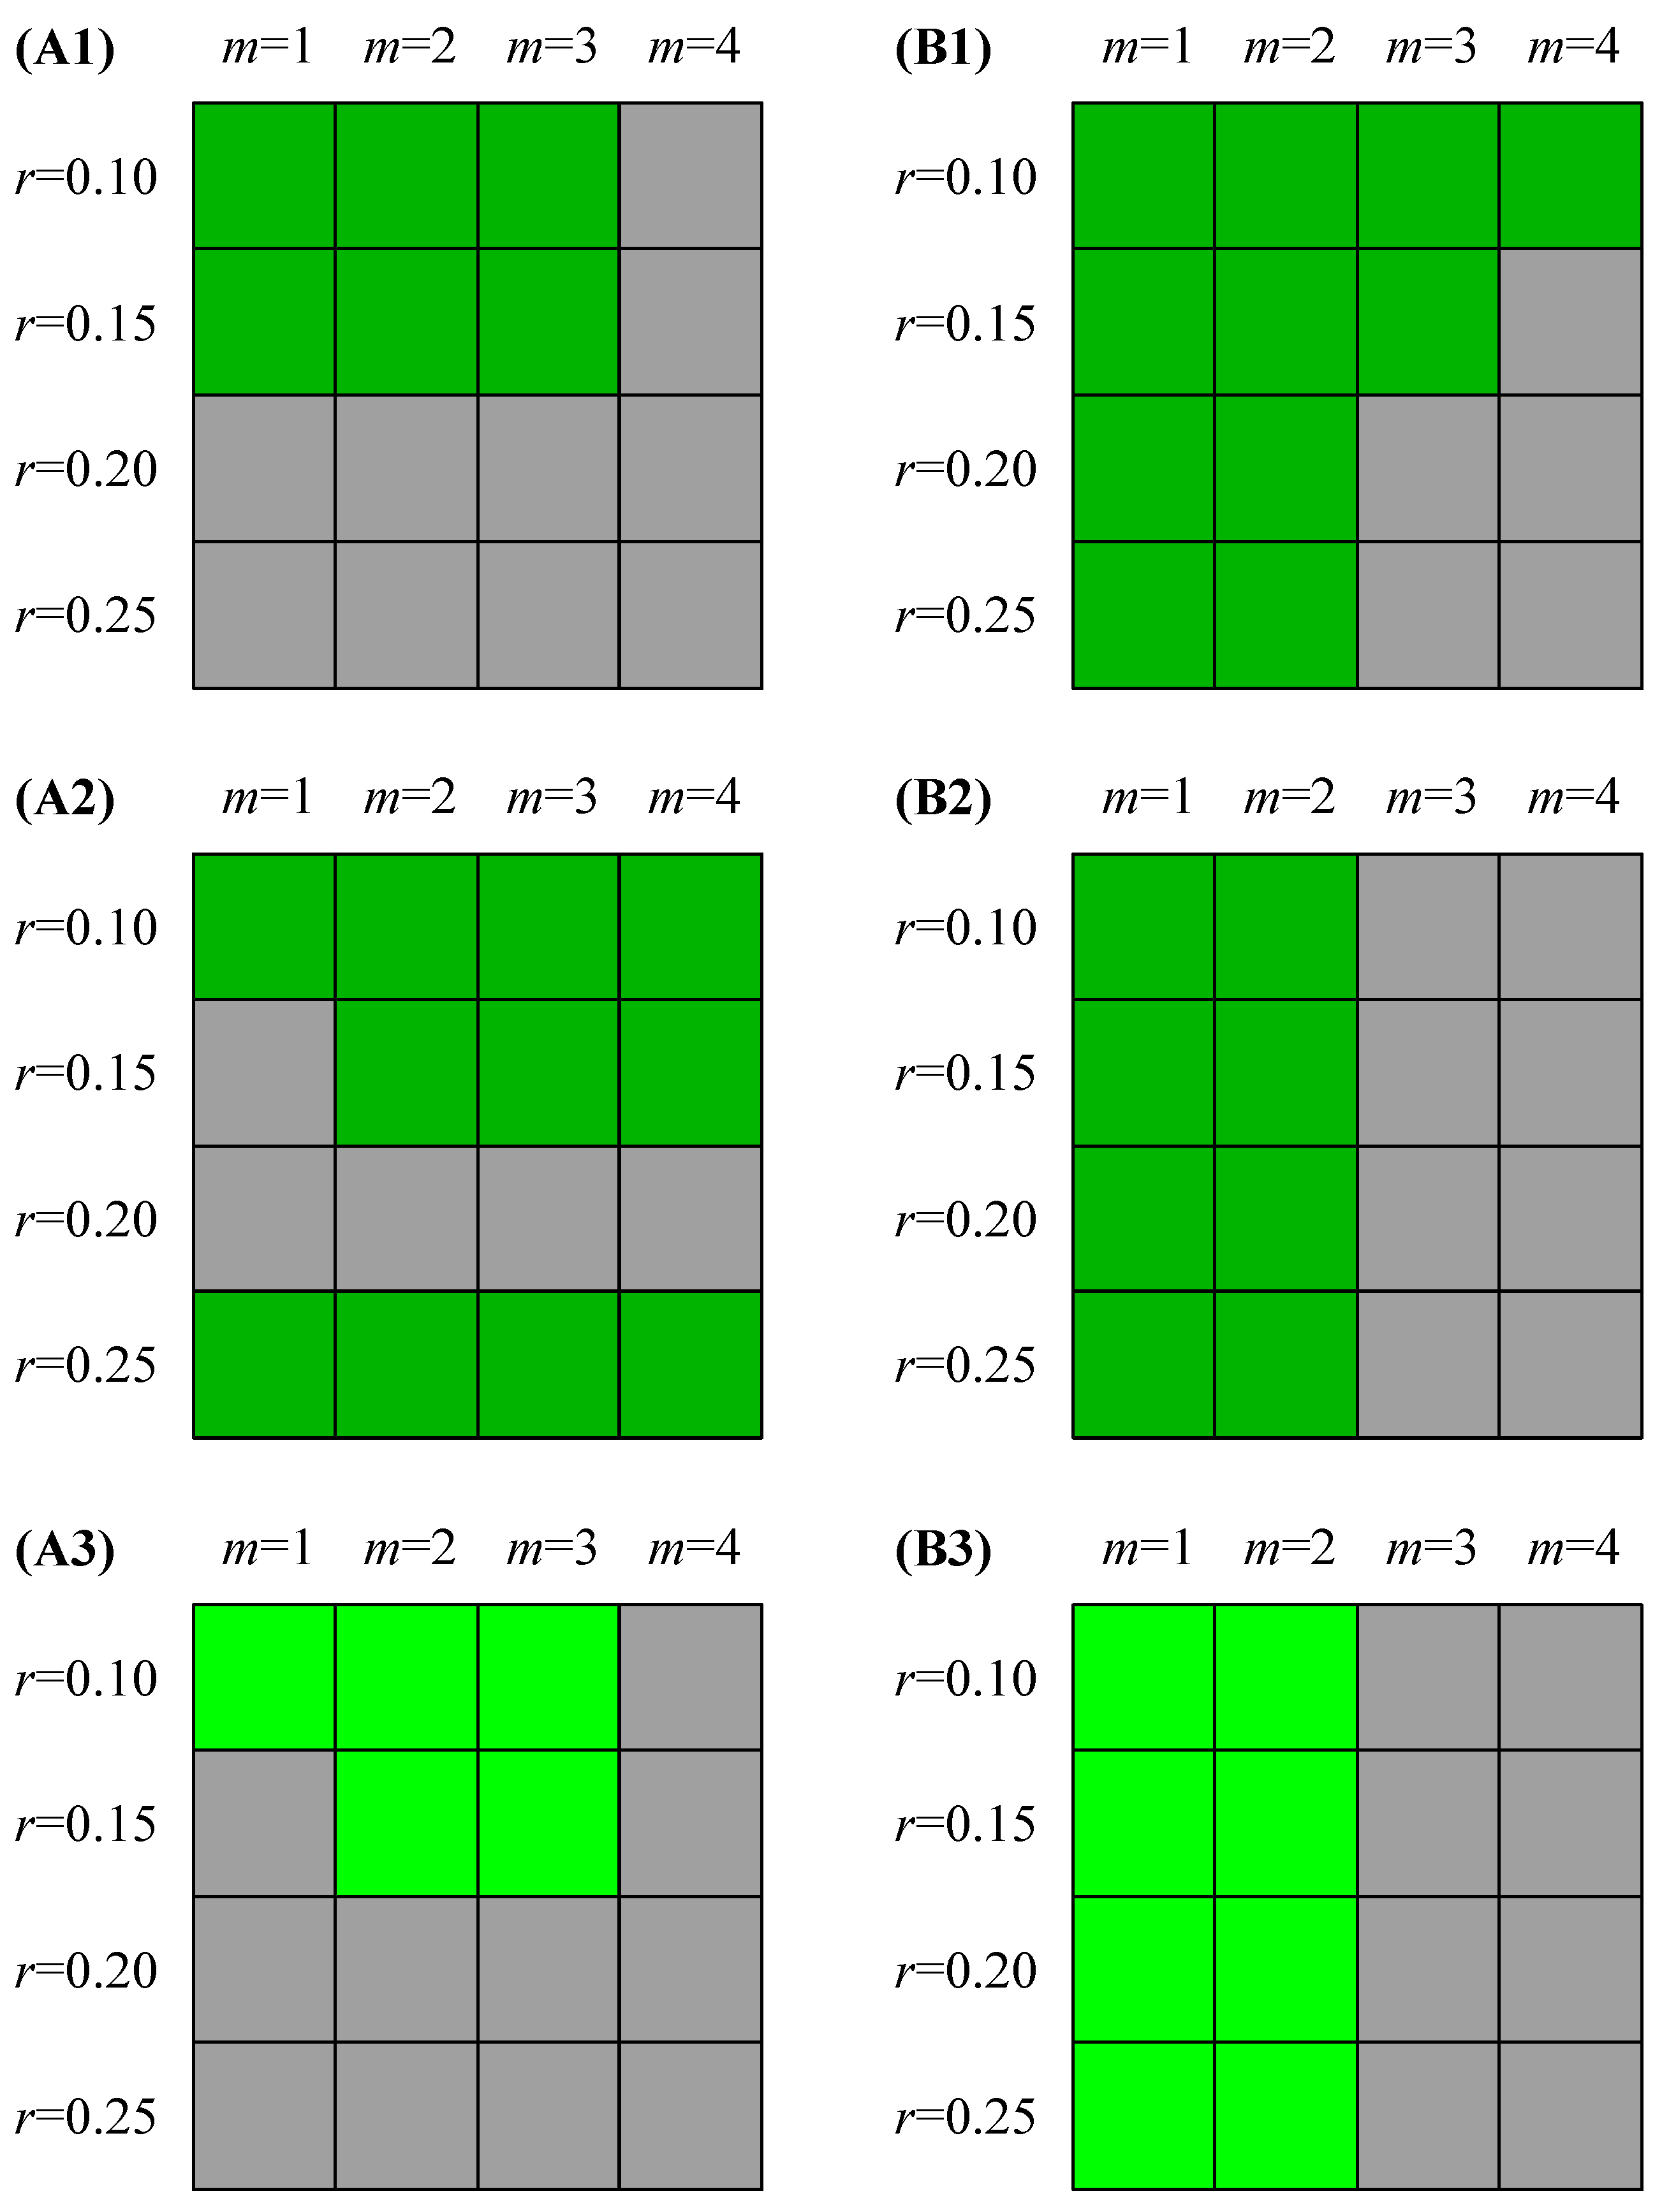
Feasible combinations (green grids) of (m, r) that would able to discriminate between NSR and CHF groups (p < 0.05) at different setting of time series length for SampEn (A1–A3) and FuzzyMEn (B1–B3) respectively: (A1 and B1) N = 300 and (A2 and B2) N = 1000. (A3) and (B3) show that the feasible combinations (highlighted green grids) would able to discriminate between the two groups at the setting of both N = 300 and N = 1000.
Figure 2.
Feasible combinations (green grids) of (m, r) that would able to discriminate between NSR and CHF groups (p < 0.05) at different setting of time series length for SampEn (A1–A3) and FuzzyMEn (B1–B3) respectively: (A1 and B1) N = 300 and (A2 and B2) N = 1000. (A3) and (B3) show that the feasible combinations (highlighted green grids) would able to discriminate between the two groups at the setting of both N = 300 and N = 1000.
With regard to the appropriate parameter values for
m and
r, developed experiments showed that significantly statistical differences between NSR and CHF groups can be reached through not only one, but also several combinations of (
m,
r) for both SampEn and FuzzyMEn.
Figure 2 shows the feasible combinations (green grids) of (
m,
r) that would able to discriminate between NSR and CHF groups (
p < 0.05) at different setting of time series length for SampEn (A1–A3) and FuzzyMEn (B1–B3) respectively.
Figure 2(A3,B3) show that the feasible combinations (highlighted green grids) would able to discriminate between the two groups at the setting of both
N = 300 and
N = 1000. All figures show a remarkable region in which a statistical significance for the two groups was reached. An interesting observation is that the feasible combinations of (
m,
r) in SampEn region was relatively narrow and was not agree with the typically recommended in the literature [
3] with
r between 0.10 and 0.25. These feasible combination regions in SampEn show a worse regularity than those in FuzzyMEn. The distinguishing ability for the two groups in SampEn disappeared when
r switched from 0.15 to 0.20, suggesting that SampEn with the typical
r setting of 0.2 may not be the best. Choosing a higher
r of 0.25 then the distinguishing ability becomes unstable with respect to the different time series length, consistent with the previous reports [
27]. In addition, choosing a smaller
r could lead to an increased number of self-matching for SampEn. This suggests that choosing parameter values for SampEn should be meticulous and even hard, especially for
r.
However, FuzzyMEn shows a better regularity for the selection of parameters
m and
r. FuzzyMEn can significantly distinguish the two groups for
m = 1 and 2 whatever
r is. Therefore the selection of appropriate parameters
m and
r is much easier in our proposed FuzzyMEn method than that in SampEn. It could be suggested that the selection of
m between 1 and 2 and
r between 0.10 and 0.25 in FuzzyMEn would probably yield fine classification results between NSR and CHF groups. This result supports our hypothesis that FuzzyMEn would demonstrate better relative consistency as compared to SampEn and agrees the previous conclusion that the selection of
r for SampEn appears to be more difficult than the selection of
m [
10,
11,
18].Typically it is suggested that for clinical data,
m is to be set at 2 for SampEn [
2,
12]. Besides, an
m of 3 has been found to be acceptable for SampEn in [
8]. Our present study partly support this point since SampEn had a similar performance between
m = 2 and
m = 3. However,
m = 3 is not suitable for the FuzzyMEn method since the distinguishing ability totally loses in FuzzyMEn when
m = 3. In addition, we should note that choosing the frequently utilized
m = 2 will allow comparison of study results to previously published findings. Yet, a choice of the appropriate parameter combinations for individual time series may yield an
m value that is different from 2.
Previous study reported that the time series length
N did not have a great impact on SampEn if
N > 200 [
2,
10] but had a great impact if
N is less than 200 [
12]. Stabilization in entropy would be expected with greater
N. In the current study, we set
N equaled 300 and 1000 respectively and observed the performances of SampEn and FuzzyMEn did not change a lot from
N = 300 to
N = 1000. It is also verify that the sensitivity of entropy measures to parameter
N would plateau at a certain level. Nevertheless, it must be kept in mind that the drift in the time series may increase with an increasing
N needed and that this drift would have an effect on entropy calculations [
27].
For a special value of
m = 1 or
m = 2, why can FuzzyMEn be able to significantly discriminate two groups at any setting of parameter
r but SampEn cannot? From
Table 2 and
Table 3, we could explain that the reason mainly exist in the SampEn algorithm itself. With the parameter
r increasing, SampEn values were firstly larger in the NSR group but then changed to be larger in the CHF group. The weak consistency of SampEn values presented here makes it is hard to select the appropriate and valuable parameter combination for clinical application. However, from
Table 2 and
Table 3, we observed that FuzzyMEn showed better consistency: the results in the NSR group were consistently lower than those in the CHF group and there were significant differences between the two groups for
m = 1 or
m = 2 whenever which parameter
r was chose.
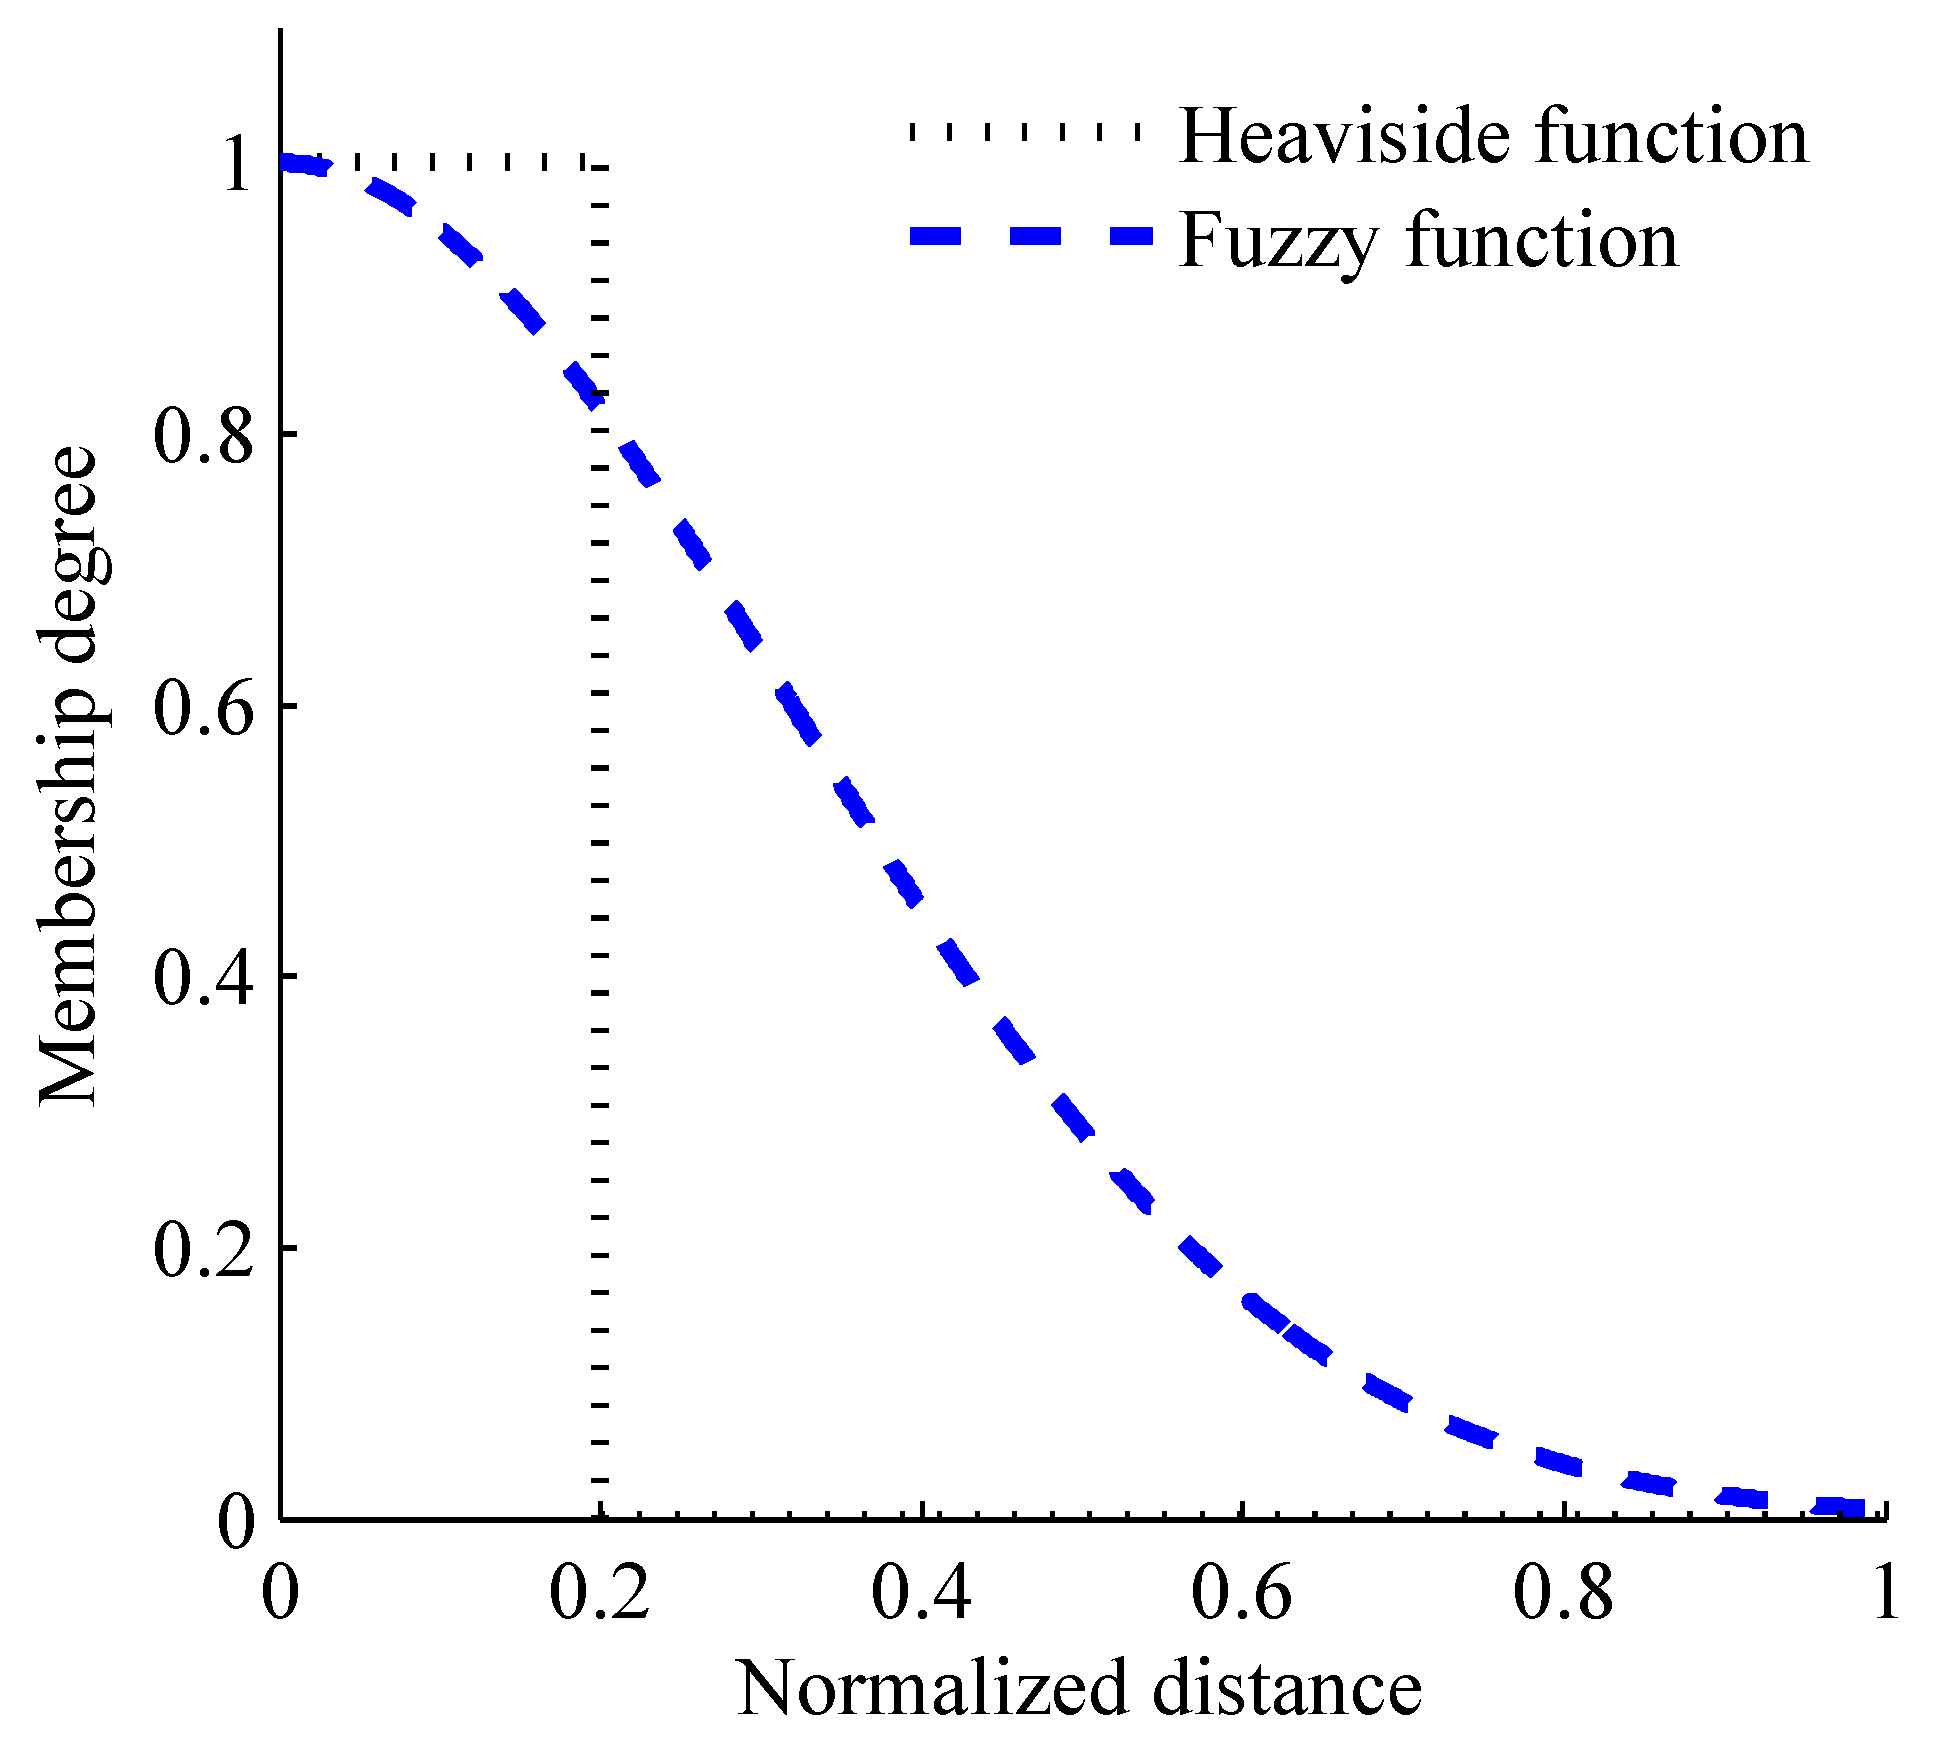
With regard to the weak consistency of SampEn, it is mainly due to the decision rule for vector similarity, which using the traditional Heaviside function. In FuzzyMEn, fuzzy function is used to redefine the decision rule for vector similarity. The differences between Heaviside and fuzzy functions are shown in Formula (1) and
Figure 3. The rigid membership degree determination in Heaviside function could induce the weak consistency of SampEn, which means that the entropy value may have a sudden change when parameter
r changes slightly. This phenomenon has been reported in the recent studies [
7,
19,
22]. For fuzzy function, this determination criterion exhibits the gentle boundary effect, while the traditional 0-1 judgment criterion of Heaviside function is rigid in the boundary of parameter
r. Besides, FuzzyMEn also uses the information from both local and global vector sequences by removing both local baseline and global mean values by Formula (A4) (see
Appendix), thus inducing the fact that FuzzyMEn have better consistency than SampEn:
Where
di,j means the distance of two vectors
Xi and
Yj, with
r as the tolerate threshold and
n is the vector similarity weight.
It is known that a key step for either ApEn or SampEn is the selection of the threshold
r. However, a constant
r was recently found problematic in a similarity judgment, particularly for fast dynamic series [
15,
22]. Some selection methods for dynamic threshold were proposed to replace the constant
r. A typical example for ApEn was from the study of Lu
et al, regarding the threshold
r from 0.01 to 1.0 times of standard deviation of time series maximizing ApEn as the optimal
r [
15]. A typical example for SampEn was from the study of Castiglioni
et al, estimating SampEn over wide ranges of
r (0.01 ≤
r ≤ 5) for determining the optimal
r [
17]. However, the maximum methods for determining
r for both ApEn and SampEn are also based on the Heaviside function, which judges two vectors as either “similar” or “dissimilar”, without any intermediate states; this could result in the poor statistical stability for entropy estimates. Our previous study have shown that using the maximum method for determining
r did not achieved better results that using the constant
r [
18]. So, in the current study, the constant
r values were still employed.
Figure 3.
The changing curve of the membership degree with the increase of normalized distance between two vectors. Black dotted line shows the determination criterion of the Heaviside function and blue dash line shows the determination criterion of the fuzzy function.
Figure 3.
The changing curve of the membership degree with the increase of normalized distance between two vectors. Black dotted line shows the determination criterion of the Heaviside function and blue dash line shows the determination criterion of the fuzzy function.
There are several limitations in this study. First, we set the threshold parameter
r as 0.10, 0.15, 0.20 and 0.25 with a step of 0.05. We did not observe the effects from the in-between
r values. This coarse granularity of
r should be a limitation of the current study. Second, it is also worth noting that the parameter settings for the FuzzyMEn method are (from the
Appendix section): the local similarity weight
nL = 3, the global vector similarity weight
nG = 2, and the local tolerance threshold
rL was set equal to the global threshold
rG, that is,
rL =
rG =
r based on our previous study [
19]. The limitation resulting from the fixed parameter setting should be classified. If other parameter settings will output better results, this needs further verification. Third, from
Table 2 and
Table 3, we noted that FuzzyMEn values are negative for
m = 1, while the traditional SampEn usually outputs positive values. This is because SampEn estimates the increasing rate of new patterns by essentially comparing the maximum absolute distance between the two vectors when the embedding dimension changes from
m to
m + 1. From the definition of the maximum absolute distance
(also see formula (A2) in
Appendix),
will monotonically increase to
when
m becomes to
m + 1, resulting in the monotonical increase of SampEn for any parameter
m—certainly for
m = 1. However, FuzzyMEn both includes the fuzzy local measure entropy (FuzzyLMEn) and fuzzy global measure entropy (FuzzyGMEn). When computing the FuzzyLMEn, vectors were firstly removed the local baseline (see formula (A4) in
Appendix) and then were calculated the distance. So when setting
m = 1,
is defined as
and
is defined as
, where
is mean value of vector
and
is mean value of vector
. Thus,
is not larger, but is usually smaller than
, resulting in the decrease of FuzzyLMEn when
m = 1 becomes to
m + 1, and resulting in the negative values of FuzzyMEn when setting
m = 1. Finally, we observed the performances of the different parameter combinations for only the NSR and CHF subjects. The optimal (
m,
r) values recommended by this study could not be directly used to analyze other heart-rhythm alterations different from the CHF. In any case, different choices of (
m,
r) may make the entropy estimates sensitive to other choices of (
m,
r) for distinguishing the two groups, but these different choices do not directly reflect the unpredictability of their time series. Further research should confirm the parameters’ performances on other physiological or pathological databases and confirm the relationships between the entropy values and the regularity/unpredictability of the time series.
To summarize, the present study has demonstrated that the selection of m, r and N plays a critical role in determining the outcomes of SampEn and FuzzyMEn when applied to short-term physiological time series. It has proved that the parameter range typically recommended and used in the literature may not be appropriate for the special clinical applications. In this study, it could be suggested that the selection of m of 2 and 3 and r of 0.10 and 0.15 for SampEn and the selection of m of 1 and 2 whenever r is for FuzzyMEn would probably yield fine classification results for the NSR and CHF subjects. These parameters for FuzzyMEn were merely valid in context with the chosen values of nL = 3, nG = 2, and rL = rG = r. Furthermore, the findings of this work will be incorporated in the follow-up studies.


