1. Introduction
Over the last few decades, the flow past bluff bodies has been the subject of quite a number of researches. Most of these studies were focused on circular cylinders [
1] and provided a substantial scientific documentation; however, momentum and thermal mechanisms around square cylinders (SC) have not been studied in detail to the same extent. Among the available literature on SCs, as some of them were focused on unconfined free-stream fluid flows [
2–
6], in others the SC is introduced into a channel flow to enhance mixing and heat transfer [
6–
15]. In addition to the academic concern, this type of flow is of relevance for many practical applications, such as buildings, bridges, towers, electronic cooling and heat exchangers. Besides the flow and heat transfer characteristics, being the main concerns of internal flow applications, investigations into viscous effects, velocity and temperature profiles as well constitute a wide research area due to their direct role in the entropy generation of thermo-fluid systems. Thus, studies on second-law characteristics have recently been the topic of great interest in various fields such as combustion processes [
16] and fuel cells [
17].
Lately, remarkable scientific efforts have been devoted to research on the momentum and heat transfer mechanisms of SCs immersed in fluids, due to the practical and fundamental significance of the subject matter. Nirmalkar
et al. [
2] considered the regime to be steady up to Re
cr = 40 in the unconfined flow case. They examined the velocity and shear rate profiles along the center planes in detail, to identify the impact of Reynolds number on the yielded (fluid-like) and the unyielded (solid-like) regions. In another computational study with unconfined flow, Rao
et al. [
3] established the critical Reynolds number for the onset of vortex instability in the downstream region as Re
cr = 45. Dhiman
et al. [
4] researched in the narrow Reynolds number range of Re = 1–30 for the unconfined flow. They essentially discussed the complex flow field, especially in the rear of the SC, through detailed streamline and isotherm contour presentations. Momentum characteristics of a porous SC was also included in the unconfined flow investigations by Chen
et al. [
5], who evaluated similar downstream vortex generation in the steady limits of Re = 2–40. Sharma and Eswaran [
6] studied the very weak blockage case of β = 0.05; similar to [
2] they as well determined the stability limit as Re
cr = 40 and reported longer recirculation zones and lower drag forces with Reynolds number for the steady flow regime. Chatterjee and Mondal [
7] as well reported similar variations in momentum and heat transfer characteristics with Reynolds number in the same blockage ratio of β = 0.05. Momentum and heat transfer characteristics of a SC in confined flow (β = 1/15) was numerically investigated by Paliwal
et al. [
8]; who evaluated the variation of recirculation length (LR), drag coefficient (CD) and Nusselt number (Nu) in the Reynolds number and power law index ranges of Re = 5–40 and n = 0.5–1.4. Sen
et al. [
9], by employing a stabilized finite-element formulation to discretize the equations of incompressible fluid flow in two-dimensions, presented for the flow past a stationary SC at zero incidence for Reynolds numbers up to Re = 150. They derived equations for the variation of LR, CD and angle of separation (θ
s) with Reynolds number for the fixed blockage ratio case of β = 0.01. At the blockage ratio of β = 1/8, Breuer
et al. [
10] carried out fluid mechanics investigations with the maximum Reynolds number of Re = 300. They determined that the downstream fluctuations were suppressed by the channel walls up to the critical value of Re
cr = 60, causing the flow to settle in the steady regime. They supported their findings on LR and CD with velocity profiles of the upstream and downstream regions. Bouaziz
et al. [
11] as well considered the confined flow with β = 1/8. For the high Prandtl number of Pr = 50, they worked in the Reynolds number range of Re = 20–200, comprising both steady and unsteady flows. Dhiman
et al. [
12] aimed to explore the buoyancy effects at the blockage ratio of β = 1/8 for the Reynolds number range of Re = 1–30. Despite the magnitude of the numerical values, they evaluated similar variation trends in the momentum and thermal characteristics with Reynolds number in the presence of buoyancy. Steady and unsteady laminar flows past a heated SC were numerically investigated by Rahnama and Hadi [
13] for the blockage ratio of β = 1/8 and with the Reynolds numbers up to 200. They showed a nearly linear increase in recirculation length and decrease in drag coefficient with increasing Reynolds number for the steady flow regime; and an increase in the total Nusselt number and drag coefficient with a Reynolds number for unsteady flow regime. Dhiman
et al. [
14] performed steady fluid mechanics computations in the blockage ratio range of β = 1/8–1/4 and set the upper stability limit for these confined flow scenarios in terms of Reynolds number as Re = 45. They affirmed that the length of the recirculation zone linearly increases with the Reynolds number and decreases with blockage ratio. Sharma and Eswaran [
15] examined the flow and heat transfer characteristics in confined flow for the wide Reynolds number and blockage ratio ranges of Re = 50–150 and β = 0.1–0.5. They announced that the flow with Re = 50 becomes steady for β ≥ 0.2; they additionally exhibited the front, top and back face Nusselt numbers for each Reynolds number case explicitly and clarified their correspondence with the momentum mechanisms.
Due to its potential in describing the overall system performance, second-law analysis and entropy generation based investigations, on internal fluid flow related problems, have recently been considered as not only a scientific but also a technologic requirement. Hooman and Haji [
18] carried out a numerical study to interpret the entropy generation characteristics for a thermally developing forced convection problem in a rectangular duct with isoflux walls. They presented their findings as a function of the longitudinal coordinate, the aspect ratio and Brinkman number; and established that as the heat transfer mechanisms grow with Brinkman number, the contrary is valid for the entropy generation values. As Zimparov [
19] reviewed passive heat transfer augmentation techniques for single-phase flows, Chen and Du [
20] investigated the effects of thermal Rayleigh number, ratio of buoyancy forces and aspect ratio on entropy generation of turbulent double-diffusive natural convection in a rectangle cavity. Rakshit and Balaji [
21] reported the results of a numerical investigation of conjugate convection from a finned channel, where the vertical rectangular fins were mounted outside the horizontal channel. Laminar forced convection and entropy generation in a helical coil with constant wall heat flux was numerically investigated by Ko [
22]. He suggested that the optimal Reynolds number is to be chosen according to the flow operating condition so that the thermal system can have the least irreversibility and best exergy utilization. In a supplementary work, Guo
et al. [
23] investigated the impact of duct curvature on the second law characteristics and determined the entropy generation to decrease with curvature ratio at the same Reynolds number. For the flow of a variable-viscosity fluid through a channel with a non-uniform wall temperature, Makinde [
24] as well worked numerically and discussed his findings through the same parameters. Nourollahi
et al. [
25] numerically solved Navier-Stokes and energy equations to analyze the mixed convection and entropy generation in Poiseuille-Benard channel flow. They recorded that the entropy generation due to heat transfer is localized at areas where heat exchanged between the walls and the flow is maximum, while the entropy generation due to fluid friction is maximum at areas where the velocity gradients are maximum such as vortex centers. The second law characteristics of fluid flow and heat transfer inside a circular duct under fully developed forced convection for non-Newtonian fluids are studied by Mahmud and Fraser [
26], who presented their outputs through the spatial distributions of local and average entropy generation number, irreversibility ratio and Bejan number. Kurtbas
et al. [
27] discussed the heat and exergy transfer characteristics of forced convection flow through a horizontal rectangular channel with foams through the parametric values of mean exergy transfer, Nusselt number and friction factor as functions of Reynolds number. In a second-law study on the 2D laminar channel flow of incompressible viscous fluids, Kamish and Oztop [
28] used the dimensionless entropy generation number to interpret the relative importance of friction to conduction by varying irreversibility distribution ratio. They additionally observed that the minimum entropy generation occurs at the location of the minimum temperature gradient in transverse direction. As Jarungthammachote [
29] reported the variation of entropy generation with heat flux and duct dimensions in a hexagonal duct, Andreozzi
et al. [
30] analyzed entropy generation rates based on the velocity and temperature data of the natural convection phenomena in a vertical channel. Kotas
et al. [
31] indicated that for calculating loss of exergy, or process irreversibility, an exergy balance or the Gouy-Stodola theorem can be used. Bianco
et al. [
32,
33] made a parametric study of entropy generation of nanofluid turbulent convection inside a circular tube under constant wall heat flux and wall temperature conditions. Mkwizu and Makinde [
34] investigated the entropy generation in a variable viscosity channel flow of nanofluids with convective cooling. Eegunjobi and Makinde [
35] investigated entropy generation in transient variable viscosity Couette flow between two concentric pipes.
Although the available literature offers a set of thermo-fluid researches of confined square cylinders, they are limited to either fluid flow or fluid flow and heat transfer; besides the researchers mostly focused on confined cases with low blockage ratio. On the other hand, in spite of the several existing investigations on second-law analysis for internal flows, entropy generation mechanisms of confined bluff bodies are not yet considered. Even though the heat transfer rates are significantly characterized by the fluid flow and boundary layer development, and the second-law mechanisms by those of the hydrodynamic and thermal behaviors, the open literature cannot offer any publication studying the linkage of the momentum-thermal values with the second-law performances of confined square cylinders. The present numerical work aims to develop a complete overview on the energy and exergy analysis of steady laminar confined flows across square cylinders for the Reynolds number range of Re = 10–50 at the blockage ratio of β = 0.8. Findings on momentum and thermal actions are discussed through streamlines, velocity and temperature profiles, temperature contours and temperature gradients. Results of the exergy analysis are presented by way of entropy profiles, thermal, frictional and overall entropy generation rates and Bejan numbers. Autonomous discussions are documented for the upstream, throat and downstream sections of the flow domain; but cross-debates are as well prepared to clarify the transport of the properties and the triggering influences of the neighboring domains in the flow direction. By obtaining velocity and temperature values in the flow field, entropy generation of the system was calculated. Entropy profiles indicate where the energy losses are significant and need improvements. Present study gives clear results for both frictional and temperature based entropy generation values and also for the total entropy generation values.
3. Results and Discussion
In order to conduct the study, some physical, hydrodynamic and thermal data are gathered from the recent publications [
1,
2–
5,
8–
10,
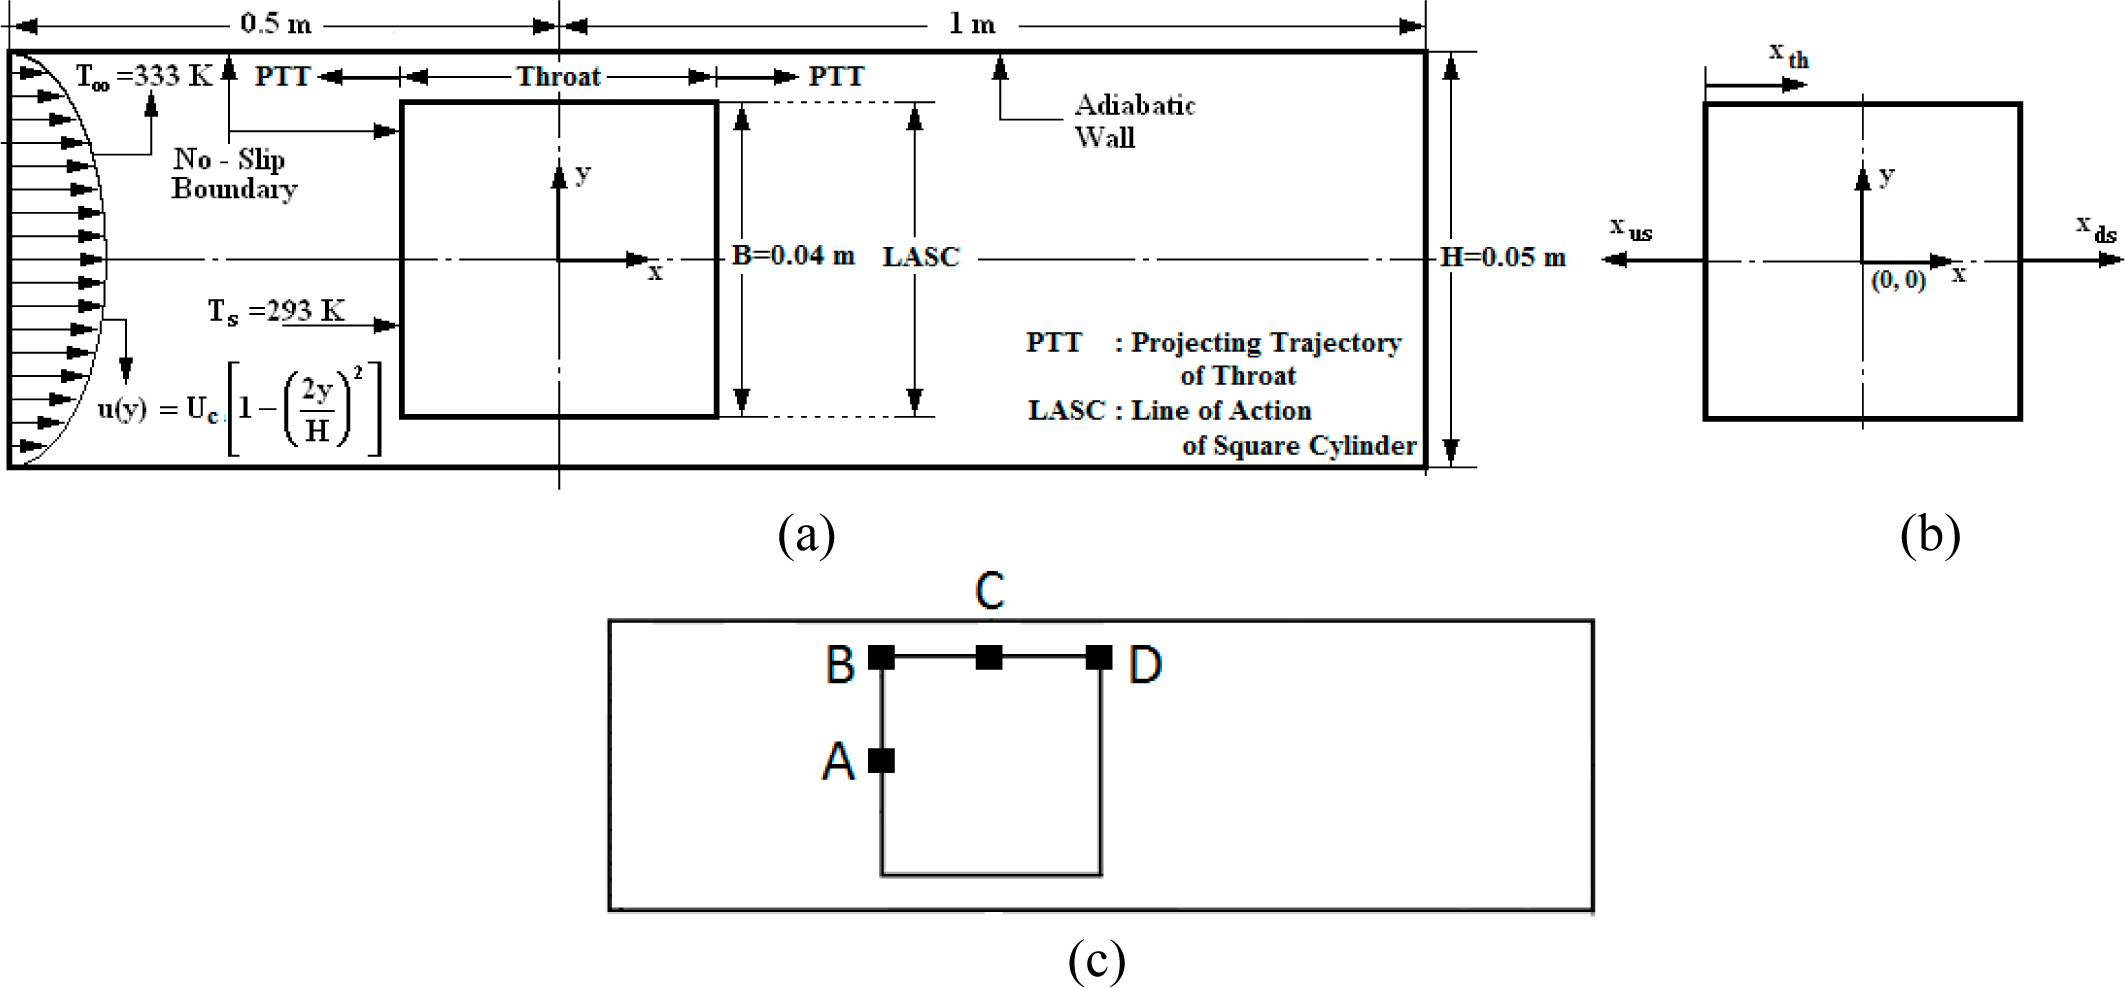
12]. The computational studies on the energy and exergy characteristics of the square cylinder (SC) are carried out at the Reynolds number range of ReB = 10–50, with the inlet air centerline-velocity range and the square cylinder edge value of Uc = 4.319 × 10
−3–21.595 × 10
−3 m/s and B = 0.04 m, respectively. Additionally, inlet air temperature, SC surface temperature and blockage ratio are chosen as T∞ = 333 K, Ts = 293 K and β = 0.800 respectively. Energy characteristics are discussed under two sub-headings:
Momentum Characteristics and
Thermal Characteristics. Streamlines, temperature contours, velocity and temperature profiles, temperature gradients and mean temperature variations are discussed to describe the upstream, throat and downstream energy mechanisms. Exergy characteristics are presented with entropy generation values, by cross-correlating with mass flow rate, velocity and temperature variations, Reynolds number and with Bejan number, by demonstrating both the streamwise and spanwise variation styles.
Regardless of the scientific objectives of research studies, involving fluid flow and heat transfer mechanisms [
1,
4,
7,
10,
11,
42], the primary issue in the flowchart of the analysis is the evaluation of the hydrodynamic and thermal fields. Since the momentum and thermal characteristics constitute the fundamental information for the energy or exergy features of the laminar steady flow across the SC under strong blockage, the flow patterns and the thermal interactions around the SC become the essential outputs of the performed computations.
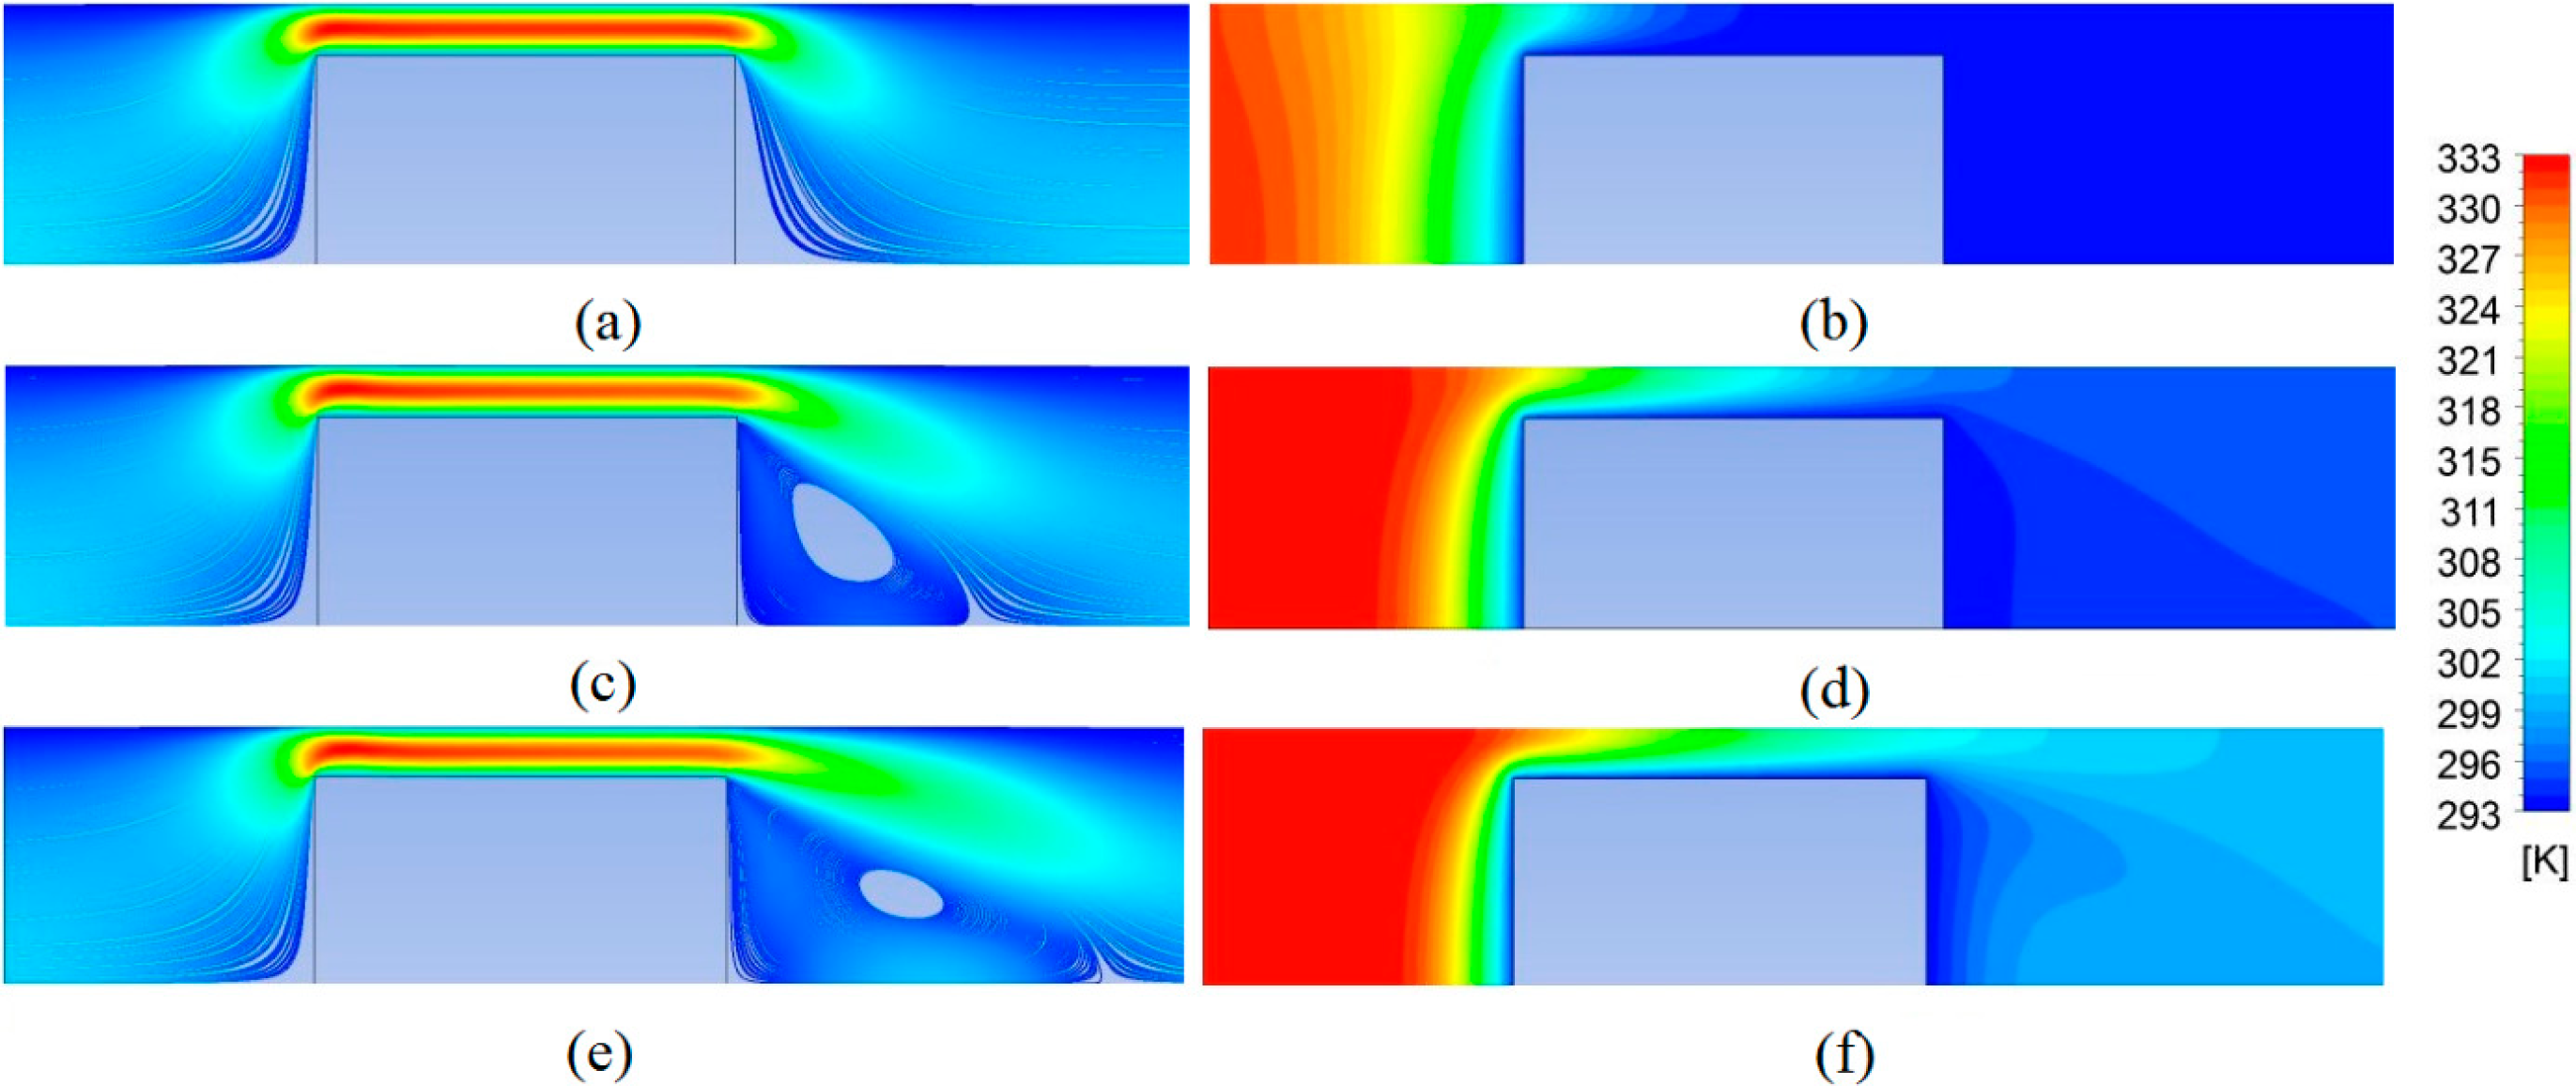
Figure 2 displays the streamline formation (
Figure 2a,c,e) and temperature contours (
Figure 2b,d,f) in the flow field, bounded by the SC surfaces and the channel walls, for the Reynolds numbers of Re = 10 (
Figure 2a,b), Re = 30 (
Figure 2c,d) and Re = 50 (
Figure 2e,f). The following discussions on the momentum, thermal and entropy generation characteristics of the upstream, throat and downstream domains of the SC will be carried out in conjunction with the information presented in
Figure 2.
3.1. Analysis in the Upstream Domain
3.1.1. Momentum Characteristics
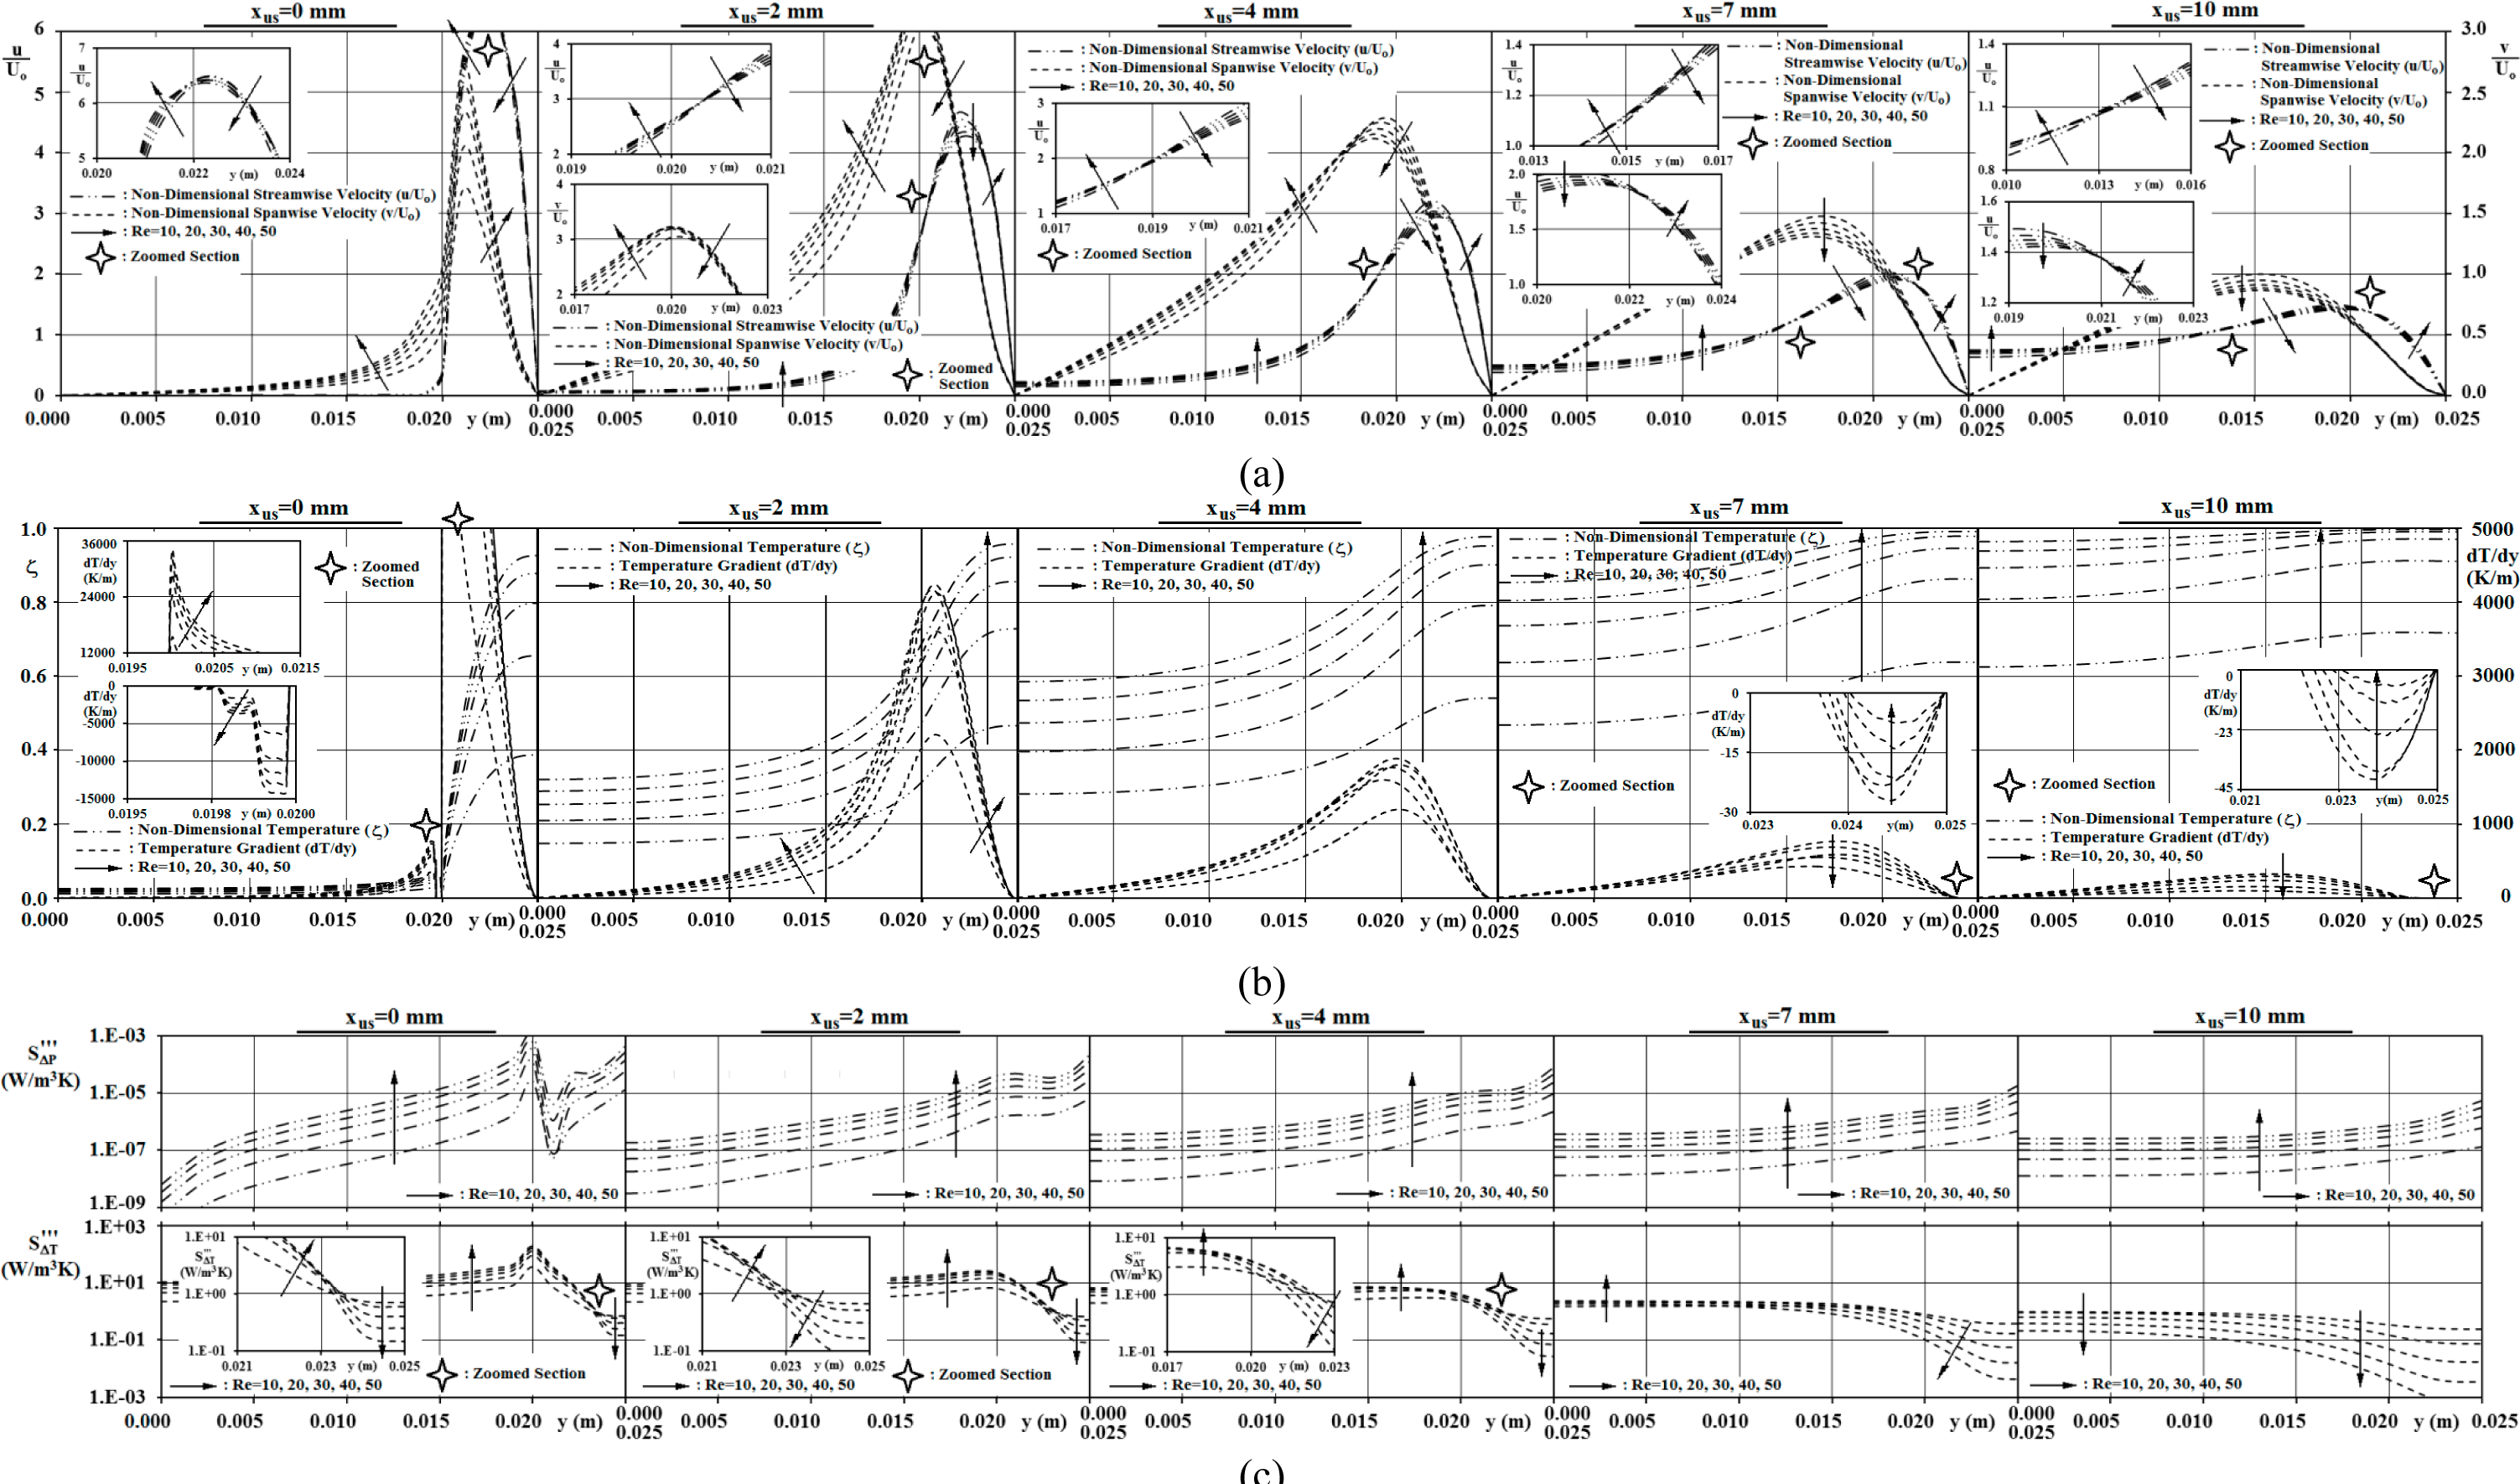
Figure 3a shows the streamwise (u/U
o) and spanwise (v/U
o) non-dimensional velocity profiles in the upstream region of x
us = 0–10 mm for the Reynolds number range of Re = 10–50. It can be inspected from the figure that the hydrodynamic field senses the blockage action of the SC at x
us = 10 mm; such that the non-dimensional streamwise velocity values at the centerline deviate from u/U
o = 1.5 to u/U
o = 0.635→0.750 (Re = 10→50) and those of the spanwise values at y = 0.015 m deviate from zero to v/U
o = 0.0028→0.0124 m/s. The order of the streamwise velocity profiles for different Reynolds numbers at x
us = 10 mm display two reverse locations at yrl ≅ 0.013 & 0.021 mm, where the zoomed plots provide a further detailed view. The physical background of this output can be clarified by the continuity phenomena (
Equation (1)), such that the yrl locations are close to the points where the u/U
o and v/U
o variations attain the highest values, respectively.
It can further be inspected from
Figure 3a that, as the flow approaches the SC, stronger accelerations come into sight both in the streamwise and spanwise directions. This evaluation can be supported through the computed momentum parameters. Such that the accelerated flow results in the maximum non-dimensional velocity values of (u/U
o)Max = 2.025→1.906 and (v/U
o)Max = 1.475→1.309 at x
us = 7 mm; the corresponding data are (u/U
o)Max = 3.203→2.941, 4.658→4.229, 6.329→6.330 and (v/U
o)Max = 2.273→2.115, 3.036→3.199, 1.674→2.700 at x
us = 4, 2, 0 mm, respectively. The computed momentum parameters and the velocity profiles of
Figure 3a simultaneously not only identify that as the flow approaches the SC (x
us →0 mm) the (u/U
o)Max and (v/U
o)Max data increase but also notify the grow of (u/U
o)Mean and (v/U
o)Mean data with higher Re for x
us ≤ 4 mm. The analysis additionally showed that, in the streamwise direction (x
us = 10→0 mm) the spanwise locations of the maximum values shift towards the inlet plane (y = 0.020–0.025 m) of the throat. This evaluation can be directly attributed to the regulation of the upstream streamlines of
Figures 2a,
2c and
2e. The plots of x
us = 0 mm indicate that, regardless of the level of Reynolds number, the streamwise velocity values expand by an order of ≈6.35; however, those of the spanwise turn out to be dependent on Reynolds number with the (v/U
o)Max values of 1.67→2.70 (Re = 10→50). Besides, the mean values of u/U
o and v/U
o come out to be u/U
o = 0.840→0.879 and v/U
o = 0.236→0.386 at x
us = 0 mm, implying the stronger role of Reynolds number and blockage in the spanwise momentum activity. The close scientific link among the momentum characteristics and frictional entropy generation data
implies the significance of the discussions on the impacts of Reynolds number and local gradients.
3.1.2. Thermal Characteristics
The non-dimensional temperature distribution (ζ—
Equation 16d) and the spanwise temperature gradients (dT/dy) in the upstream domain (x
us = 0–10 mm) of the SC are shown in
Figure 3b. It can be seen from the figure that the cooling action of the SC is sensible around x
us = 10 mm, where the fluid domain appears to be most particularly influenced in the centerline (y = 0 mm) neighborhood with the lowest values of ζ = 0.625→0.964 (Re = 10→50). Although the presence of the SC is thermally noticeable in the highest Reynolds number case of Re = 50 even at x
us = 10 mm, computations put forward slight temperature drop in the flow domain through the ζMean and ζMax values of 0.980 and 0.997 respectively. On the other hand the corresponding data are computed as ζMean = 0.670 and ζMax = 0.719 in the flow scenario with Re = 10. The comparably lower ζ values due to weaker momentum activity can be attributed to the accompanied less mass flow rates. The figure also puts forward that, flows with lower mass flow rate, thus low Reynolds number, are more sensible to heat transfer and temperature drop in the earlier section (x
us > 7 mm) of the upstream region. For the particular issue at x
us = 7 mm, numerical analysis identifies that, as the mean and maximum non-dimensional temperature values of the Re = 50 case become ζMean = 0.915 and ζMax = 0.991, the corresponding values of the Re = 10 scenario appears as ζMean = 0.538 and ζMax = 0.638. This finding can as well be associated with thicker thermal boundary layers and weaker heat transfer activity in low Reynolds numbers.
In the closer flow domains of the SC (x
us ≤ 4 mm), the thermal texture of the higher Reynolds number scenarios are found to be more motivated. Computations showed that as the non-dimensional centerline temperature value drops from ζ = 0.585 (x
us = 4 mm) to ζ = 0.025 (x
us = 0 mm) at Re = 50, those of the Re = 10 case are ζ = 0.281 and ζ = 0.012. The intense streamwise temperature drop mechanism in higher Reynolds numbers, neighboring the front-surface, is not only reliable evidence of thinner thermal boundary layer and higher heat transfer rates, but can also be considered as scientific projection for encouraged thermal entropy generation. On the other hand, the temperature values of the projecting trajectory to the throat (y = 0.020–0.025 m) are regularly above those of the line of action of the SC (LASC–
Figure 1a). This outcome is mostly due to the adiabatic stand of the channel walls. As the temperature drop of the flow scenario with the highest inlet velocity case (Re = 50) at the duct wall (y = 0.025 m) is insensible with the values of ζ = 0.997→0.926 (x
us = 10→0 mm), those of the lowest inlet velocity flow (Re = 10) put forward the inverse trends in thermal actions and mass flow rates with the values of ζ = 0.719→0.387. The comparably higher heat capacity of the flows in higher Reynolds numbers as well indicates the correlatively remained additional energy for exergy destruction in the throat.
Figure 3b further displays the spanwise temperature gradients (dT/dy) in the upstream region. The findings on dT/dy are scientifically important due to their direct contribution to thermal entropy generation through
Equation (6). The expanding character of the dT/dy values in the streamwise direction (x
us = 10→0 mm) for all Reynolds numbers indicate the growing thermal activity. Augmentation of heat transfer rates with Reynolds number, in the mild blockage case of β = 1/8, was also documented by Rahnama and Hadi [
13]. Computations enlighten this determination through the mean and maximum values of the spanwise temperature gradients of (dT/dy)Mean = 146.9→52.6 K/m and (dT/dy)Max = 296.4→97.6 K/m (Re = 10→50) at x
us = 10 mm and (dT/dy)Mean = 600.7→1441 K/m and (dT/dy)Max = 15415.8→34102.2 K/m at x
us = 0 mm. The higher temperature gradients in the closer sections to the SC indicate the presence of enhanced thermal entropy generation rates in the corresponding regions. Besides, the paramount dT/dy values appear around y = 0.020 m, especially for x
us ≤ 4 mm, which can be explained by the thermal mixing of the comparably cooler flow in the line of action of the SC (y = 0–0.020 m) than those of the throat’s projecting trajectory. The thermal interactions generate secondary temperature gradients in the spanwise direction, where the most recognizable sections, especially at x
us = 0 mm, are displayed in zoomed style in
Figure 3b. The figure provides additional information on the thermal characteristics of the projecting trajectory of the throat (PTT—
Figure 1a) through the dT/dy results. Due to the distance with the SC, the flow in the vicinity of the duct wall exhibits late and weak thermal response. As a consequence of this phenomenon,
Figure 3b, in terms of ζ, and
Figure 2b,d,f, in terms of temperature contours, display sub-hot domains in the neighborhoods of the duct wall. As a result, the upstream domain, especially for x
us ≤ 7 mm, experiences temperature deviations, becoming more significant on the front-surface (x
us = 0 mm).
3.1.3. Entropy Generation Characteristics
Variation of local frictional
and thermal
entropy generation rates, for the considered Reynolds number range in the upstream domain of the SC, are shown in
Figure 3c. Since the
data mainly depend on the streamwise and spanwise velocity gradients, the momentum mechanisms of the flow domain (
Figure 3a) constitute the scientific background. At the upstream location of x
us = 10 mm, the
distributions show almost linear trends and resemble comparable augmentation rates in the spanwise direction (y); besides the
ratio attains the values of 4.087→7.259 for Re = 10→50 indicating the impact of Reynolds number or flow velocity on the frictional entropy generation rates. On the other hand, as the flow approaches the SC the duct wall entropy generation values show higher augmentation rates when compared to those of the centerline, where the identical ratio grows up to 13.153→13.084 at x
us = 0 mm. It can further be inspected from the figure that, as the flow approaches to the SC (x
us = 10→0 mm), the
values of the duct wall (y = 25 mm) grow continuously. The tabulated mean and maximum values of
in
Table 2 display the matching information, where this finding has close link with the duct wall velocity gradients and can as well be connected with the frictional activity. In fact, considerably rapid augmentations in
are observed for xus ≤ 2 mm, where the flow firmly orients to enter the throat, causing the streamlines to squeeze and become denser locally (
Figure 2a,c,e). The most remarkable
values are attained at the inlet section (xus = 0 mm) of the throat, specifically on the corner of the SC (y = 20 mm). This finding can be explained by not only the presence of the unguided mixing but also the maximum accelerations recorded throughout the domain (
Figure 3a and
Table 2).
The kinky structure in
distributions becomes identifiable at x
us = 4 mm. Indeed, this pattern can be explained by the nearing of the maximum locations of the streamwise (u) and spanwise (v) velocity profiles (
Figure 3a). As the spanwise positions of the maximum values of the u and v components shift in the streamwise domain of x
us = 4→0 mm (
Figure 3a), the second kink representing the local comes into sight at x
us = 0 mm. It can be verified that as the kink, pointing out the maximum
, is close to the peak position of the u/U
o profile, that of the minimum
is positioned in between the peak locations of u/U
o and v/U
o. Similar to the impact of Reynolds number on momentum characteristics, frictional entropy generation values are computed to grow with Reynolds number as well.
Table 2 further indicates the expanding attitude of
with Reynolds number. Computations showed that as the ratio of the mean frictional entropy generation values of the flows with Re = 50 and Re = 10 is
at xus = 10 mm, it grows up to 40.22 at xus = 0 mm clarifying the rapid augmentations for xus ≤ 2 mm. On the other hand, the ratio of the
values come out to be in the narrow band of 40.15–41.52 for the complete upstream domain (xus = 10–0 mm) specifying similar variations with Re in the momentum mechanisms on the duct wall. Additionally, towards the SC (xus = 10→0 mm) the centerline (y = 0 mm)
values continuously decrease, where the drops become remarkable for xus < 2 mm. This outcome can be associated with the deceleration of the streamwise velocity values at the centerline, which results with the completely stagnant flow on the front-surface of the SC (xus = 0 mm & y = 0 mm).
The thermal part
of entropy generation displays two different characteristics in the upstream and downstream sections of xus = 7 mm. As described in
Figure 3b, when compared with low Reynolds number cases, the flows with higher Reynolds numbers respond to the presence of the SC in the further sections of the streamwise direction. This behavior delays the thermal interactions of the fluid flow with the solid SC up to the neighborhoods of the front-surface. The so structured thermal layouts (
Figure 2b,d,f) exhibit comparably higher temperature gradients in lower Reynolds number flows for xus ≥ 7 mm (
Figure 3b); thus, the
data of the high Re flows come up to be lower.
Table 2 outlines this output with the mean thermal entropy generation values of
. However, in closer sections to the SC (xus ≤ 4 mm) the flows with high Re interact with the SC developing thinner thermal boundary layers and greater temperature gradients, which promotes the thermal entropy generation values as well. In particular, on the front-surface of the SC (xus = 0 mm), computations revealed the
values of 22.364 W/m
3K and 4.515 W/m
3K for flows with Re = 50 and Re = 10, respectively (
Table 2). It must additionally be recognized from the figure that, even at high Reynolds numbers the flow on the duct walls (y = 25 mm) is persistent to sustain its thermal capacity, resulting in lower
values. The zoomed plots of xus ≤ 4 mm identify the mechanism by indicating sub thermal-regions at y > 0.023 m. The temperature contours in
Figure 2d,f show the uninfluenced stand of the thermal composition on the duct wall, even up to the inlet plane of the throat. On the other hand, similar to the findings on
, the most remarkable ascents in
are also located around the inlet corner of the SC (xus = 0 mm and y = 20 mm).
Table 2 further displays information on the variation of Bejan number (
Equation (8)) with upstream section and Reynolds number. The unchangingly constant value of Be = 1 remarks that, almost the entire exergy destruction mechanism in low Reynolds number (Re ≤ 50) channel flows is in terms of thermal entropy
3.2. Analysis in the Throat Domain
3.2.1. Momentum Characteristics
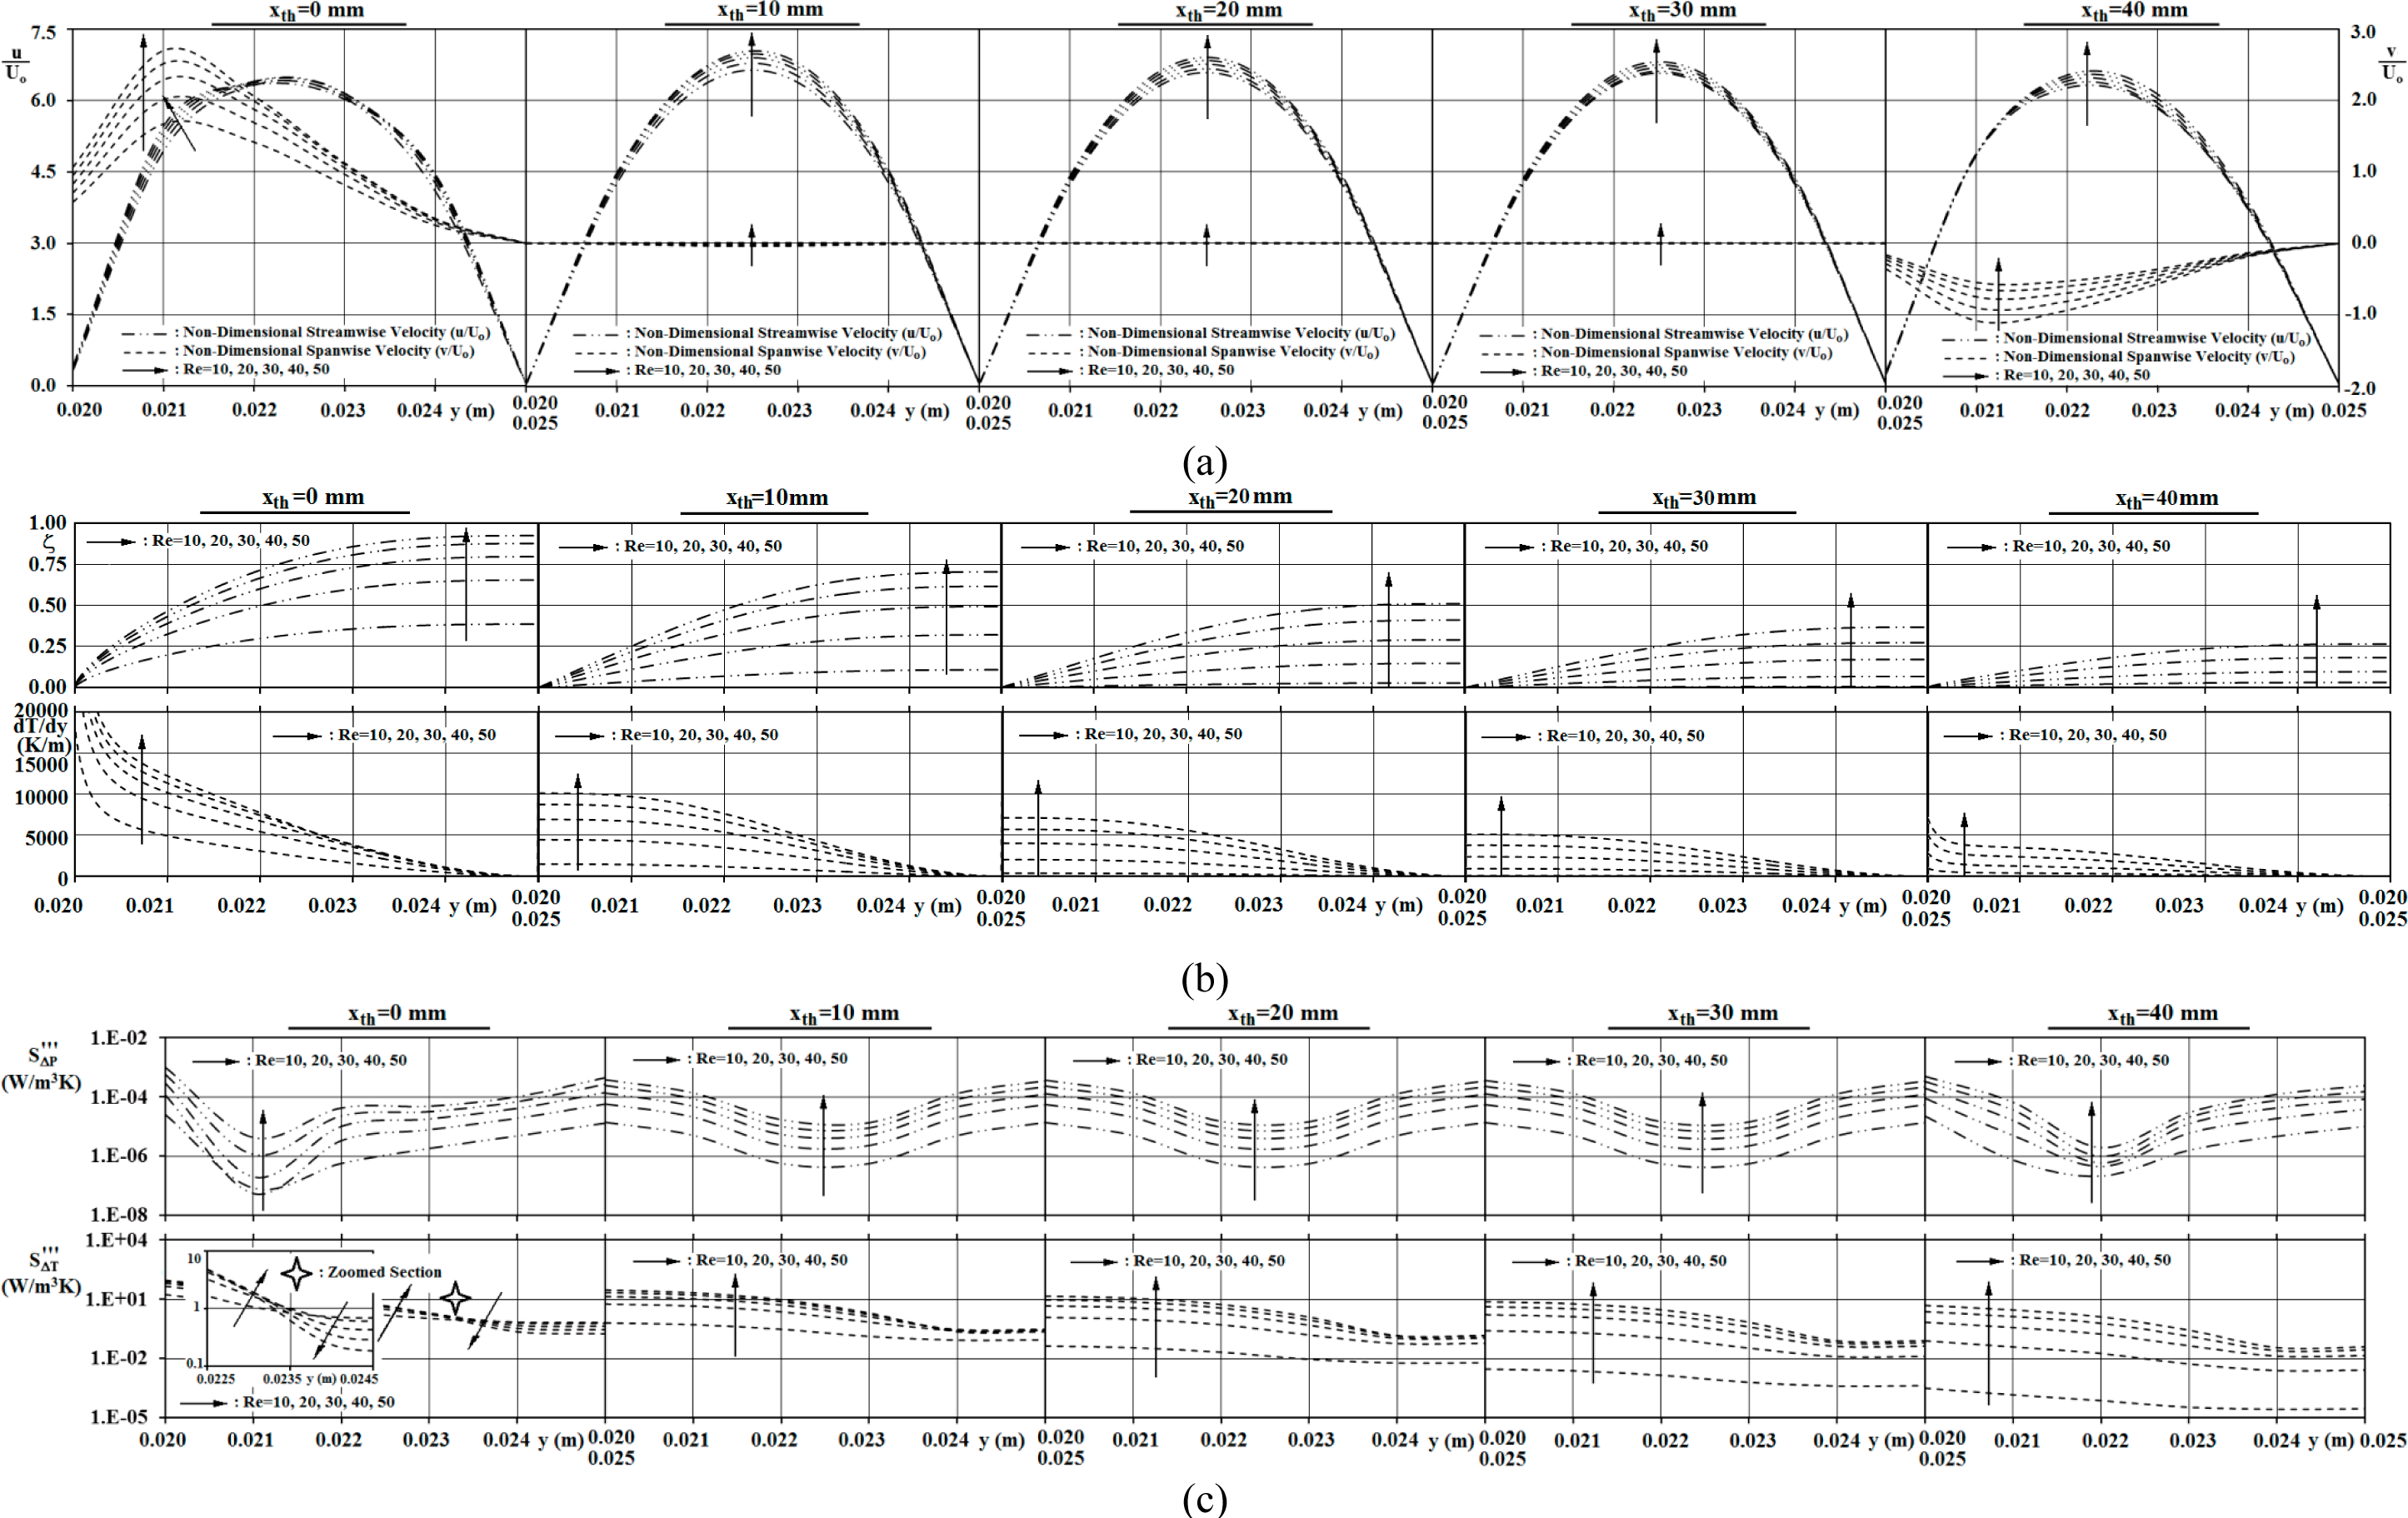
Figure 4a displays the streamwise and spanwise velocity profiles for the Reynolds number range of Re = 10–50, throughout the complete throat length of x
th = 0–40 mm. The extremely bended streamlines (
Figure 2a,c,e) at the inlet section (x
th = 0 mm) of the throat can as well be visualized in
Figure 4a; the performed computations point out that the augmented spanwise velocity values grow up to v/U
o = 1.670→2.700 (Re = 10→50). The maximum values are mostly located around y = 0.021 m, being close to the solid top surface of the SC. The irregular form of v/U
o profiles at x
th = 0 mm strictly outlines the distress in the flow, which is accompanied by strong velocity gradients and undeveloped behavior both in the downstream (x
th < 0 mm) and upstream (x
th > 0 mm) domains. Thus, the profiles at x
th = 0 mm can be considered to be responsible for exergy destruction in the corresponding zone. Being in conjunction with the spanwise velocity values, those of the streamwise as well demonstrate an asymmetric distribution. The major portion of the flow rate seems to be squeezed in the neighborhood of the SC, where the mean values of streamwise velocity are computed as u/U
o = 3.637→3.795 (Re = 10→50). However, in the streamwise direction the flow becomes fully developed rapidly (x
th = 10 mm) due to the strict guidance of the throat; such that the spanwise motion vanishes (v = 0).
The streamwise velocity values accelerate up to u/U
o = 6.381→6.789 (Re = 10→50), where the maximum values are located exactly at the symmetry axis (y = 0.0225 m) of the throat, verifying the fully developed character. On the other hand, the slight gap of 0.408 among those of Re = 10 and Re = 50 rely on the enhanced cooling rate of the flow in the Re = 10 case, when compared to those of the higher Reynolds number cases (
Figure 2b,d,f). The inverse relation of temperature and density (
Equation (15d)) has further role on the velocity values through the mass flow rate issue (
Equation (16c)) of the momentum mechanism. Indeed, as the flow proceeds downstream (x
th > 10 mm) additional cooling results in marked decreases in the u data, where the maximum values become u/U
o = 6.317→6.546 at x
th = 30 mm in line with expectations based on fundamental fluid mechanics principles. At the exit zone of the throat (x
th ≈ 40 mm) the flow domain is intensely disturbed resulting in the emerging of spanwise velocities and deviations in the streamwise velocity profiles. Computations revealed that, the mean streamwise velocity data at x
th = 40 mm come out to be lower than those of the inlet plane (x
th = 0 mm) results, with the particular values of u/U
o = 3.509→3.617. This outcome can be associated with the above denoted statement on the interaction of temperature, density and velocity. As the jets are persistently oriented towards the symmetry axis of the duct (
Figure 2a,c,e), the most comprehensive values appear close to the top-surface (y = 0.020 m) of the SC. However, computational evaluations put forward that the maximum values of the spanwise velocity at the throat exit (x
th = 40 mm) come out to be v/U
o = −1.090→−0.551 (Re = 10→50), which are, in absolute value approach, lower than those of the inlet plane (x
th = 0 mm), which can be regarded as a sign of stronger frictional activity downstream of x
th = 40 mm on the duct wall than the amount of friction upstream of x
th = 0 mm.
3.2.2. Thermal Characteristics
Figure 4b displays the non-dimensional temperature (ζ) and spanwise temperature gradient (dT/dy) variations in the throat for different Reynolds number cases. It can be seen from
Figure 4b that, due to the advanced cooled state of the lower Re cases, their flow temperature values are poorer throughout the throat. The computed thermal parameters detail the additional cooling action in the throat with particular data, where the duct wall (y = 0.025 m) temperature drops from ζ = 0.387→0.926 (Re = 10→50) at x
th = 0 mm to ζ = 0.002→0.266 at x
th = 40 mm. Detailed inspection points out that, at the lowest Reynolds number case of Re = 10 the mean fluid temperature drops almost down to the surface temperature of the SC (T = 293 K—ζMean = 0.018) even at x
th = 20 mm; the corresponding state (ζMean = 0.021) for the Re = 20 scenario is observed at x
th = 40 mm. These findings are completely in harmony with the temperature contours of
Figure 2b,d,f; moreover, the decay of temperature values will as well result in the steep decline of exergy destruction in terms of
. On the other hand, the the inlet section (x
th = 0 mm) of the throat, attained at higher Re cases, stand for comparably advanced thermal activity. Dhiman
et al. [
43] also reported the streamwise decay of heat transfer rates on the top-surface of the SC under the weak blockage of β = 1/20. These mechanisms are accompanied by the stronger temperature gradients of (dT/dy)Mean = 7239.9 → 3022.9 K/m (Re = 50→10); the superior thermal task in flows with high Re can be associated with higher
through
Equation (6) in the corresponding regions.
3.2.3. Entropy Generation Characteristics
Frictional
and thermal
entropy generation values throughout the throat (xth = 0→40 mm) above the top-surface of the SC for various Reynolds numbers are plotted in
Figure 4c. It can be inspected from the figure that the dependence of
and
characteristics on Reynolds number comply completely with those of the momentum and thermal characteristics, where both components of entropy generation grow with Reynolds number. Further identifying the concurrent behaviors of momentum characteristics and frictional entropy generation data, the lowest
are located exactly at the midplane of the throat (y = 0.025 m), where the local maxima of the u/Uo profiles are evaluated in the throat domain of xth = 10–30 mm. Moreover, either of the
and
distributions of the inlet section (xth = 0 mm) imply significant disturbances which can entirely be attributed to the second-order behaviors in the momentum (
Figure 4a) and thermal (
Figure 4b) mechanisms at the identical zone. The particular issue in the
distributions is the reverse order around y ≅ 0.023 m, which can be explained by the almost unaffected temperature values (ζ ≈ 1) at high Re cases (
Figure 4b) in the neighborhood of the duct wall (y > 0.023 m). Thus, it can further be detailed that, in the inlet domain of the throat (xth = 0–10 mm) the flow in the vicinity of the duct wall (y = 0.025 m) experiences stronger streamwise variations (dT/dx) than that of the spanwise (dT/dy). This thermal pattern results in the developing
layout in the neighborhood of the duct wall (y > 0.023 m) in the corresponding streamwise zone (xth = 0–10 mm).
It can also be inspected from the temperature contours of
Figure 2f that, flow enters the throat with almost T ≅ 333 K in the indicated particular sub-domain. Besides, the throat physically constrains the flow and disciplines both of the momentum and thermal activities; such that a 10 mm flow distance was sufficient to generate fully developed velocity (
Figure 4a) and temperature (
Figure 4b) profiles. As a consequence,
profiles attain symmetric forms depend distributions (u/U
o) due to the expiry of the spanwise values (v/U
o—
Figure 4a). Indeed, this mechanism in
lasts up to the exit section of the throat.
In addition to the augmentation of frictional entropy generation values with Reynolds number,
Table 3 further shows that as the ratio of the mean frictional entropy generation values of the flows with Re = 50 and Re = 10 is
at xth = 0 mm, it drops down to 24.08 at xth = 40 mm indicating that the impact of Re on
decreases in the flow direction inside the throat. Besides, regardless of the level of Reynolds number, the frictional entropy generation data are evaluated to decrease in the streamwise direction. The
ratio comes out to be 0.876→0.582 for Re = 10→50, which can be attributed to the comparably lower deviations in the v/Uo profiles of
Figure 4a at the throat exit (xth = 40 mm) in the high Reynolds number case of Re = 50.
In the lowest Reynolds number (Re = 10) scenario, fast declines in
are observed for xth ≥ 10 mm, which can be explained by the rapid cooling (ζ→0) characteristics (
Figure 4b).
Table 3 identifies this
values of 4.804→0.0001 W/m
3K for xth = 0→40 mm. Moreover, the core temperature values (ζ ≈ 1) of even the highest Reynolds number case of Re = 50 turn out to be thermally incapable to penetrate inside the throat and access the section of xth = 10 mm. Therefore, the order of the
distributions becomes uniform for xth ≥ 10 mm (
Figure 4c). Since the temperature profiles at the exit plane express no individual variation, the
characteristics retain their routine layout at xth = 40 mm as well. Thus, the thermal entropy generation data decrease in a demanding manner in the streamwise direction for the complete Reynolds number range (
Table 3). However, the exit plane jets (
Figures 2a,c,e, and
4a) triggers the onset of the spanwise fluid flow (v) and disturbs the fully developed form of the streamwise velocity profiles. As a consequence, the style and symmetry of the
profiles also become corrupted at the exit plane. The impact of this distress results in sensible deviations on the Bejan number, especially at the lowest Reynolds number case of Re = 10, with the mean value of BeMean= 0.911 at xth = 40 mm (
Table 3).
3.3. Analysis in the Downstream Domain
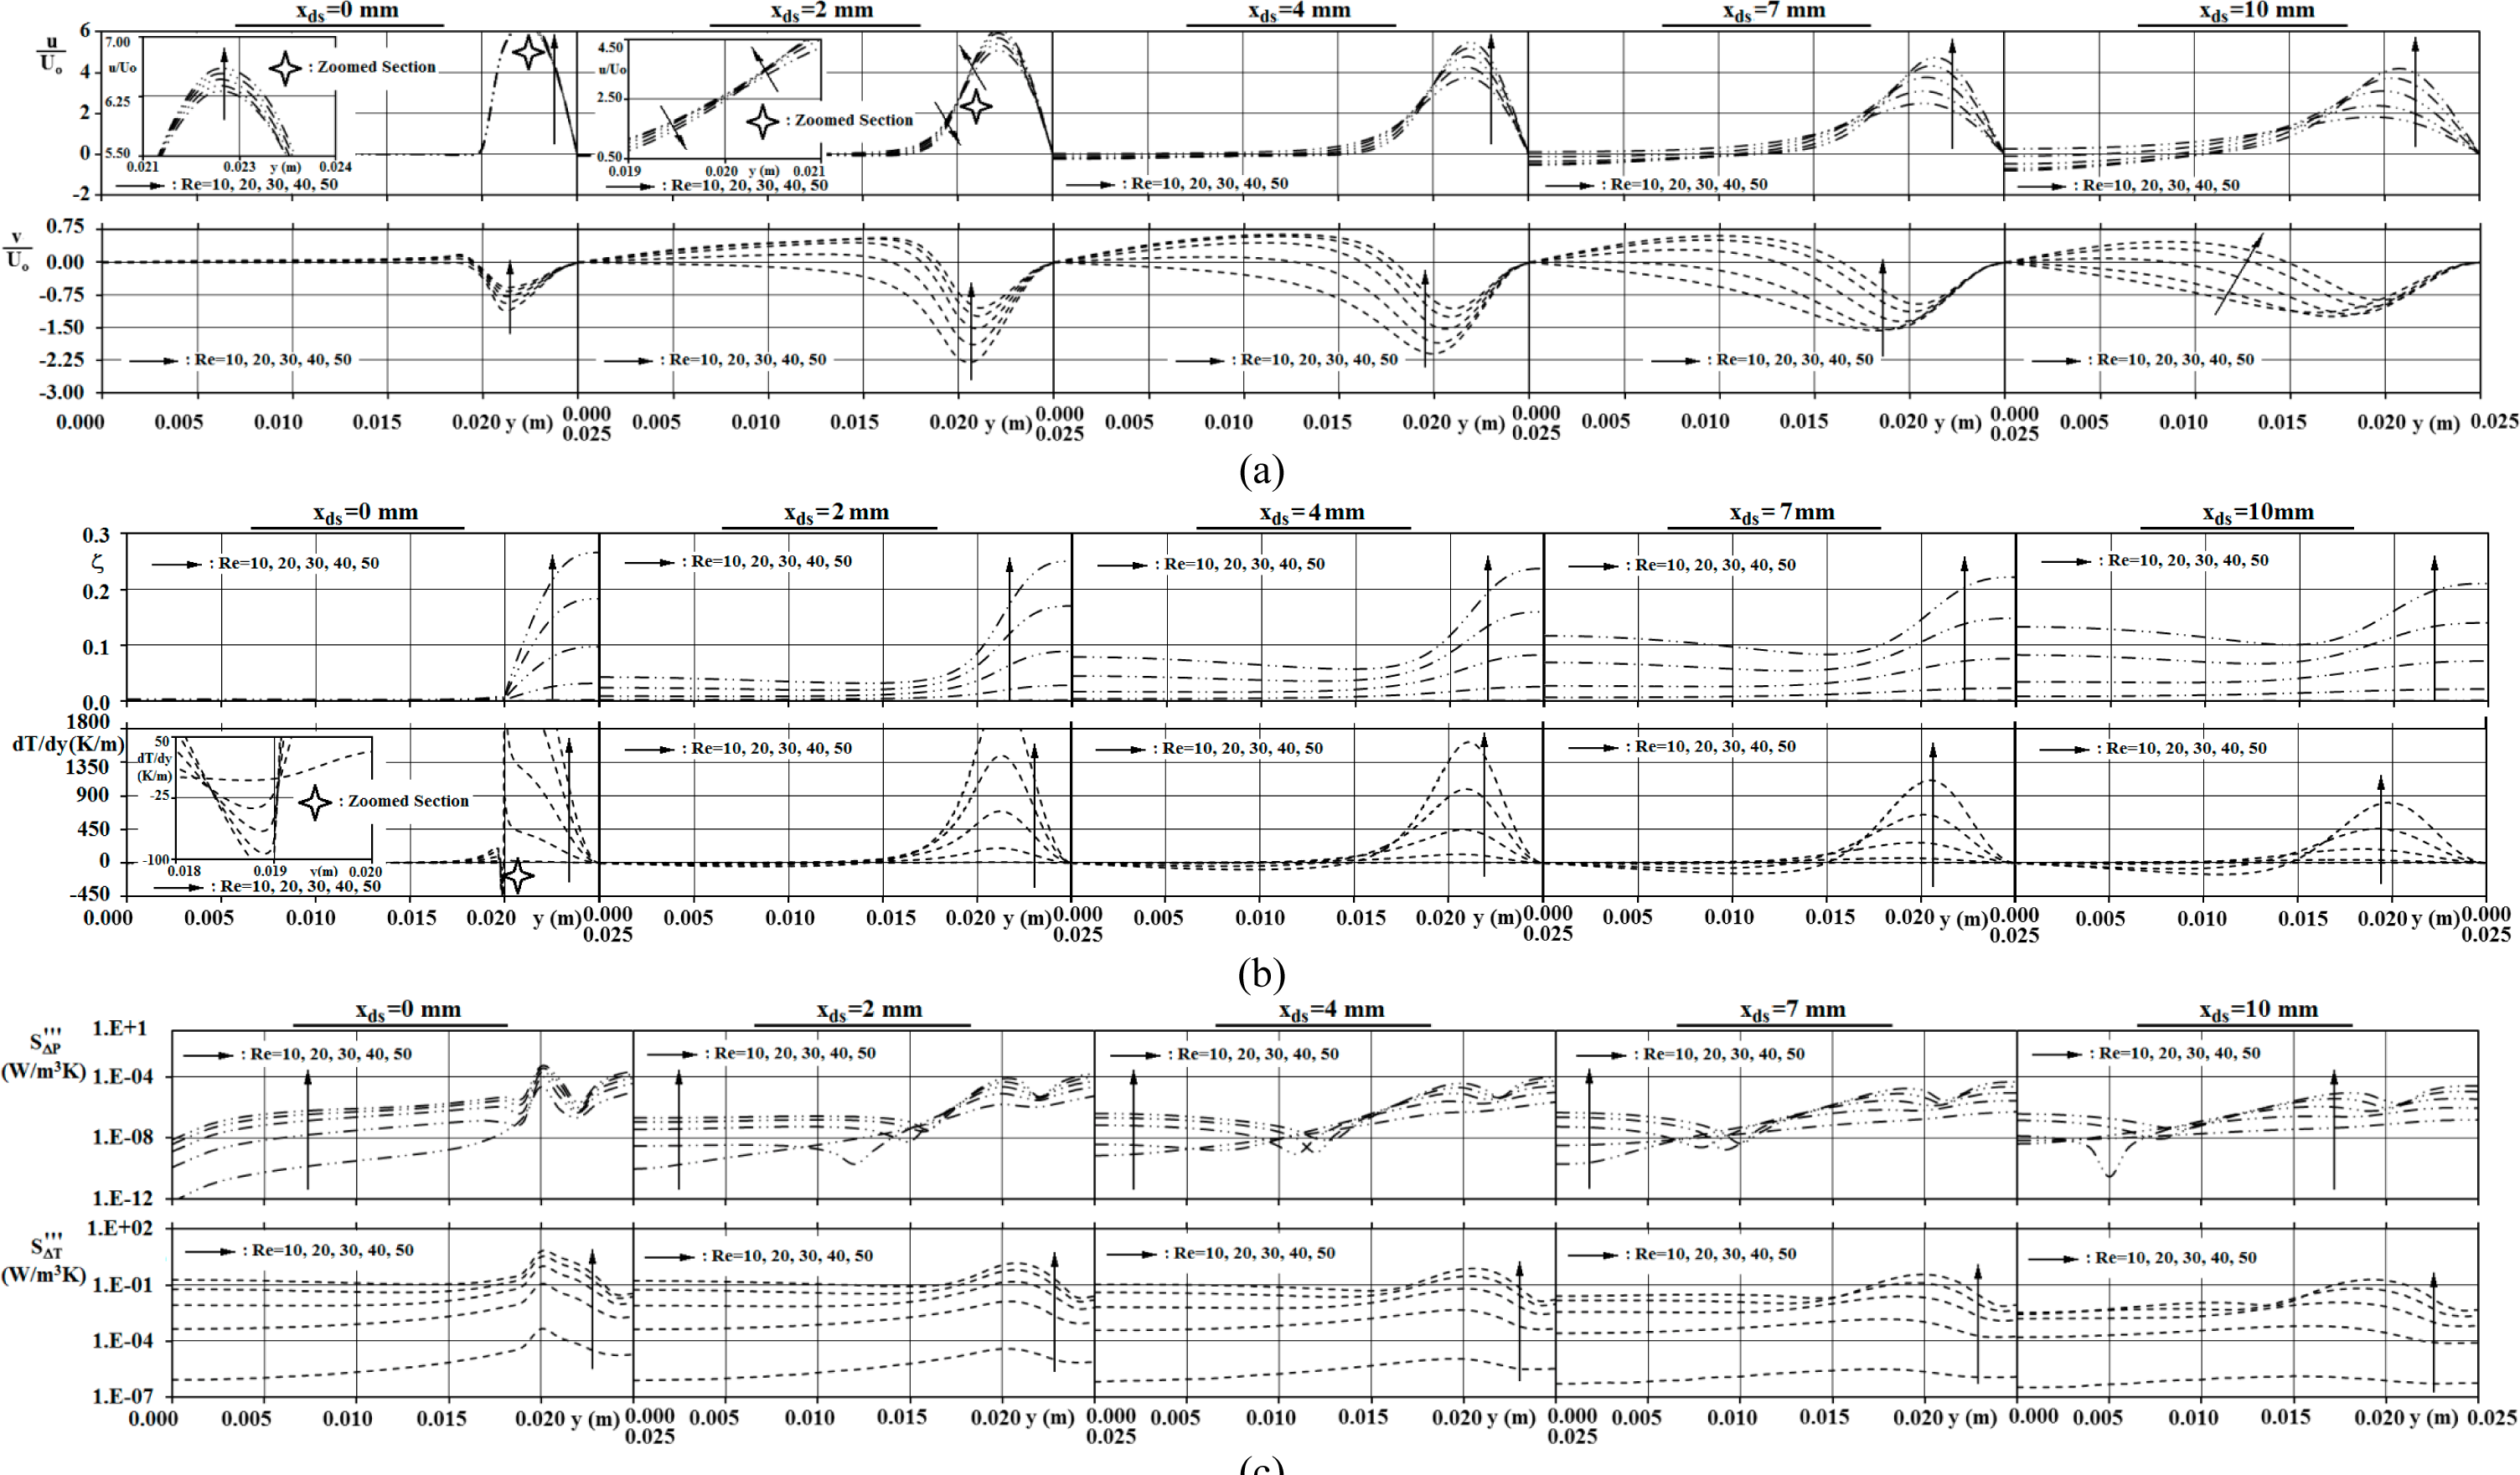
3.3.1. Momentum Characteristics
The streamwise and spanwise velocity distributions in the downstream region of the SC are shown in
Figure 5a. The exit plane (xth = 40 mm) momentum characteristics of the throat displayed in
Figure 4a coincide with the xds = 0 mm profiles of the y = 0.020–0.025 m zone in
Figure 5a. Due to the no-slip condition on the back-surface of the SC, both of the streamwise and spanwise velocities attain the value of zero on the solid wall (y = 0–0.020 m) at xds = 0 mm. As the flow moves forward in the downstream domain, the motivation of the flow to separate by generating a vortex structure can even be seen at xds = 2 mm through the negative values of the streamwise velocity (u/Uo < 0). In addition, the strength of vortex development in the Reynolds case of Re = 50 is evident with the comparably advanced upward values of spanwise velocity, particularly in the y = 0–0.020 m region. Besides, as detailed in the zoomed plot of xds = 2 mm, the order of the streamwise velocity values for different Reynolds number scenarios become altered around y ≈ 0.020 m. This evaluation can be attributed to the thermal mixing in the neighboring zone as shown in
Figure 2b,d,f. This output can also be considered as a source of thermal entropy generation in the corresponding location. In the further downstream sections (xds ≥ 4 mm) comparably enhanced reverse flows (negative streamwise velocities) are recorded in the lower part (y = 0–10 mm) of the vortex. However, the peak velocities appear to attain lower values; such that the computed momentum parameters particularly identify the (u/Uo)Max as 6.270→6.540 (Re = 10→50) at xds = 0 mm and 1.822→4.191 at xds = 10 mm. These records as well correspond to lower velocity gradients and stand for reduced frictional entropy genesation prarferred red by Breuer
et al. [
10], the structure and formation of the downstream vortex system can further be discussed through the spanwise velocity layout in the region of xds = 0–10 mm. The v/Uo variation in the y-direction at the lowest Reynolds number of Re = 10 shows no sign of counter-flow having regular negative values (
Figure 5a). On the other hand, the positive v/Uo values of Re ≥ 20 cases indicate the presence of the vortex, which interacts with the back-surface of the SC. The strength and occupied domain of the vortex have a close relation with the magnitude of the upward spanwise velocity values (v/Uo > 0) in the separated flow domain, next to back-surface (y =0–20 mm,
Figure 5a).
The above stated recognition puts forward the stronger vortex activity at higher Reynolds numbers, where this finding shows parallelism with the vortex scenes of
Figure 2c,e. Breuer
et al. [
10] and Rahnama and Hadi [
13] as well reported expanded recirculation zones with higher Reynolds numbers in the downstream region of a confined SC.
Figure 5a and the momentum parameters identify that the spanwise velocities become weaker in the downstream direction; even the v/Uo data of the Re = 20 case transform to attain negative values at xds =7 mm ((v/Uo)Mean = −0.482, (v/Uo)Max = −1.540), indicating the completion of the recirculation zone. Similar to the streamwise velocity distributions, the spanwise values as well show the most significant gradients in the exit path (y = 0.020–0.025 m) of the throat; but they become milder in the downstream direction (xds = 0→10 mm). These evaluations can be considered as reliable foresights for the frictional entropy generation values in the downstream region of the SC.
3.3.2. Thermal Characteristics
The non-dimensional temperatures (ζ) and the temperature gradient (dT/dy) values in the downstream region of the SC are plotted in
Figure 5b. It must be indicated that the ζ profiles of xds = 0 mm correspond to those of the
Figure 4b for xth = 40 mm. It can be inspected from the figure that, the temperature values of the SC’s line of action (y = 0–0.020 m) augment in the flow direction (xds = 0→10 mm); however the reverse mechanism is set for the projecting trajectory of the throat. The computed thermal parameters identify these evaluations in terms of mean and maximum temperature values, which refer mainly to the SC’s line of action and the upper physical boundary (y = 0.025 m) of the projecting trajectory. As the line of action data is ζMean = 0.000→0.014 (xds = 0→10 mm) and ζMean = 0.043→0.137 for the Re = 20 and Re = 50 cases, respectively, those of the projecting trajectory are recorded as ζMax = 0.032→0.022 (Re = 20) and ζMax = 0.266→0.211 (Re = 50). Simultaneous evaluation of the two mechanisms clarifies the presence of thermal mixing, which mostly takes place in the upper boundaries of the vortex system (
Figure 2c,e). As explained and identified through
Figure 4b, in the throat the temperature levels of the flow drops down almost to the surface temperature of the SC in the cases for Re ≤ 20; thus, the ζ values of these cases do not show interpretable variations in the downstream region. However, those of the Re = 30–40 flows show notable variations, where the plot implies that the 10 mm downstream displacement is nearly sufficient to stabilize the thermal equilibrium in the complete spanwise direction (xds = 10 mm). The temperature contours of
Figure 2d (Re = 30) illustrate matching results with these findings; however, the thermal instability of the Re = 50 flow can even be inspected at xds ≥ 10 mm (
Figure 2f).
The spanwise temperature gradient (dT/dy) plots further detail the local temperature variations. The significantly increasing temperature data in the projecting trajectory of the throat are in harmony with the high temperature gradients. As the projecting trajectory temperature values drop in the streamwise direction (xds =0→10 mm), accompanying weaker gradients are as well evaluated in the computations. This evaluation can be identified through the maximum values of spanwise temperature gradient, where the figures are (dT/dy)Max= 53.7→3.7 K/m (xds= 0→10 mm) and (dT/dy)Max = 6318.3→813.4 K/m for flows with Re = 10 and Re = 50, respectively. These numbers as well point out the stronger thermal mechanisms in high Reynolds number cases. On the other hand, the augmenting thermal potential in the SC’s line of action, more specifically in the mixing zone, results in irregular temperature distributions, especially in high Reynolds number cases (Re ≥ 30,
Figures 2d,f and
5b). The spanwise thermal disturbances are most inspectable in the vortex driven region of y = 0–15 mm, where the ζ values show decrease trends in the spanwise direction (y = 0→15 mm). As a consequence, the corresponding temperature gradients put forward the drop of temperature values with the dT/dy trends having negative signs (dT/dy < 0). It should be noted that the downstream mixing region of the SC involves scientifically complex thermal structures; thus, the dT/dy variations for different Re cases do not follow Reynolds number based orders. The disordered attitude and the rapid variations of superior dT/dy values appear to trigger the thermal entropy generation rates mostly on a local scale.
3.3.3. Entropy Generation Characteristics
The downstream (xds = 0→10 mm) entropy generation values, in terms of frictional
and thermal
components, are displayed for various Reynolds numbers (Re = 10–50) in
Figure 5c. The disturbances and the high gradient nature of the velocity (
Figure 5a) and temperature (
Figure 5b) fields significantly characterize the second-law mechanisms of the downstream domain. It can be inspected from the figure that, the most remarkable jumps both in
and
coincide with the extreme gradient locations of velocity (
Figure 5a) and temperature (
Figure 5b). Indeed, this outcome exactly coincides with the primary outputs of Nourollahi
et al. [
25]. On the other hand, being in harmony with the present findings, Kamish and Oztop [
28] explained the decrease trends in thermal entropy generation values in channel flow in terms of the fall of temperature gradients at the identical locations. Results on entropy generation indicate that exergy destruction mostly grows with Reynolds number and decrease in the streamwise direction (xds = 0→10 mm) (
Table 4). However, the comprehensive mixing in the region occupied by the vortex system (xds ≥ 0 mm and y = 0–15 mm), causes asymmetric entropy distributions. Thus, the spanwise variations of
and
expose disorders from the point of the impact of Reynolds number. Besides, since the layout of the streamwise velocity characteristics (u/Uo) does not show significant deviations in the flow direction inside the vortex zone, the formation of
distributions in the spanwise direction (y), especially for y = 0–0.015 m, can mostly be associated with the development of v/Uo profiles (
Figure 5a) in the corresponding region. However, for the thermal part of the entropy generation, the almost stable appearance of the temperature values in the streamwise direction (
Figure 5b) highlights the dominant impact of spanwise temperature gradients (dT/dy) on the thermal entropy generation
. As a consequence, the locations of maximum
(
Figure 5c) exactly coincide with those of the peak spots of dT/dy (
Figure 5b). On the other hand, computational investigations identified that frictional entropy generation values attain higher values on the back-surface (xds = 0 mm) of SC and on the duct wall (y = 25 mm), which can be enlightened by the comparably stronger velocity gradients in the considered regions. Besides, for the thermal component the prominent flow domain comes out to be the projecting trajectory of the throat. Such that the
variations produce maximums on the streamwise line of action of y = 0.02 m; the peaks can even be observed at the downstream section of xds = 10 mm. On the other hand, due to the extensive cooling (ζ = 0) of the flow in the Re = 10 case (
Figures 2b and
5b) the thermal activity decays comprehensively. The consequent outcome can be observed in
Table 4 with the comparably low mean Bejan number of BeMean = 0.941 at xds = 10 mm. Similarly, Nourollahi
et al. [
25] evaluated excess thermal entropy generation values in Poiseuille-Benard channel flow, which result in Bejan numbers up to Be ≅ 0.9.
4. Conclusions
For the strong blockage case of β = 0.8, steady regime continuity, Navier-Stokes and energy equations are simultaneously solved to computationally investigate the effects of Reynolds number on the energy and exergy characteristics of the upstream, throat and downstream domains of a square cylinder in confined flow. Results are presented and discussed in detail.
Analyses of energy characteristics identified the following primary issues:
In the upstream domain, as the flow approaches the SC (xus→0 mm), the mean and maximum values of u/Uo and v/Uo data increase with higher Re for xus ≤ 4 mm. Besides, the flows with low Reynolds number are determined to be more sensible to heat transfer and temperature drop in the earlier sections of the upstream region (xus > 7 mm). In the closer flow domains of the SC (xus ≤ 4 mm), the thermal texture of the higher Reynolds number cases are evaluated to be more motivated. Computations show that as the non-dimensional centerline temperature value drops from ζ = 0.585 (xus = 4 mm) to ζ = 0.025 (xus = 0 mm) at Re = 50, those of the Re = 10 case are ζ = 0.281 and ζ = 0.012. In the throat, due to its strict guidance, the flow becomes fully developed rapidly (xth = 10 mm), such that the spanwise motion vanishes (v = 0). The streamwise velocity values are computed to accelerate up to u/Uo = 6.381→6.789 (Re = 10→50), where the maximum values are located exactly at the symmetry axis, verifying the fully developed character. At the exit section of the throat (xth ≃ 40 mm), the flow domain is intensely disturbed resulting in the emerging of spanwise velocities and deviations in the streamwise velocity profiles; moreover, the exit jets are persistently oriented towards the symmetry axis of the duct. Downstream of the SC, in the flow with Re = 20 the spanwise velocities turned out to become weaker in the downstream direction with negative spanwise velocity values at xds = 7 mm, indicating the completion of the recirculation zone. However, the strength of the vortex development in the Re = 50 flow is evident with the comparably advanced upward values of spanwise velocity, particularly in the y = 0–0.020 m region. In the line of action of the SC, the temperature values are computed to augment in the flow direction (xds = 0→10 mm); but the reverse mechanism is set for the projecting trajectory of the throat.
Analyses of exergy characteristics resulted in the following main findings:
The most remarkable frictional entropy generation values in the upstream region are attained at the inlet section (xus = 0 mm) of the throat, specifically on the corner of the SC (y = 20 mm), which is associated with the unguided mixing but also with the maximum accelerations recorded throughout the domain. Similar to the findings on
, the most remarkable ascents in
are also located around the inlet corner of the SC (xus = 0 mm and y = 20 mm). Towards the SC (xus = 10→0 mm) the centerline, (y = 0 mm)
values continuously decrease, where the drops become significant for xus < 2 mm; which can be associated with the deceleration of the streamwise velocity values at the centerline, which results in the completely stagnant flow on the front-surface of the SC (xus = 0 mm & y = 0 mm). Within the throat, the frictional entropy generation values augment with Reynolds number. Additionally, the impact of Re on
is observed to decrease in the flow direction inside the throat, with the
ratios of 36.29 and 24.08 at xth = 0 mm and xth = 40 mm, respectively. Besides, the thermal entropy generation data figured out to decrease in a demanding manner in the streamwise direction for the complete Reynolds number range in the throat. Entropy generation in the downstream flow domain indicates that exergy destruction grows with Reynolds number and decrease in the streamwise direction (xds = 0→10 mm). However, asymmetric entropy distributions, in the region occupied by the vortex system (xds ≥ 0 mm and y = 0–15 mm), are identified which are consequences of the comprehensive mixing in the corresponding zone. The almost stable appearance of the downstream temperature values in the streamwise direction highlights the dominant impact of spanwise temperature gradients (dT/dy) on the thermal entropy generation
. As a consequence, the locations of maximum
(
Figure 5c) exactly coincide with those of the peak spots of dT/dy.


