Analysis and Optimization of a Compressed Air Energy Storage—Combined Cycle System

 ,
,
Abstract
:1. Introduction
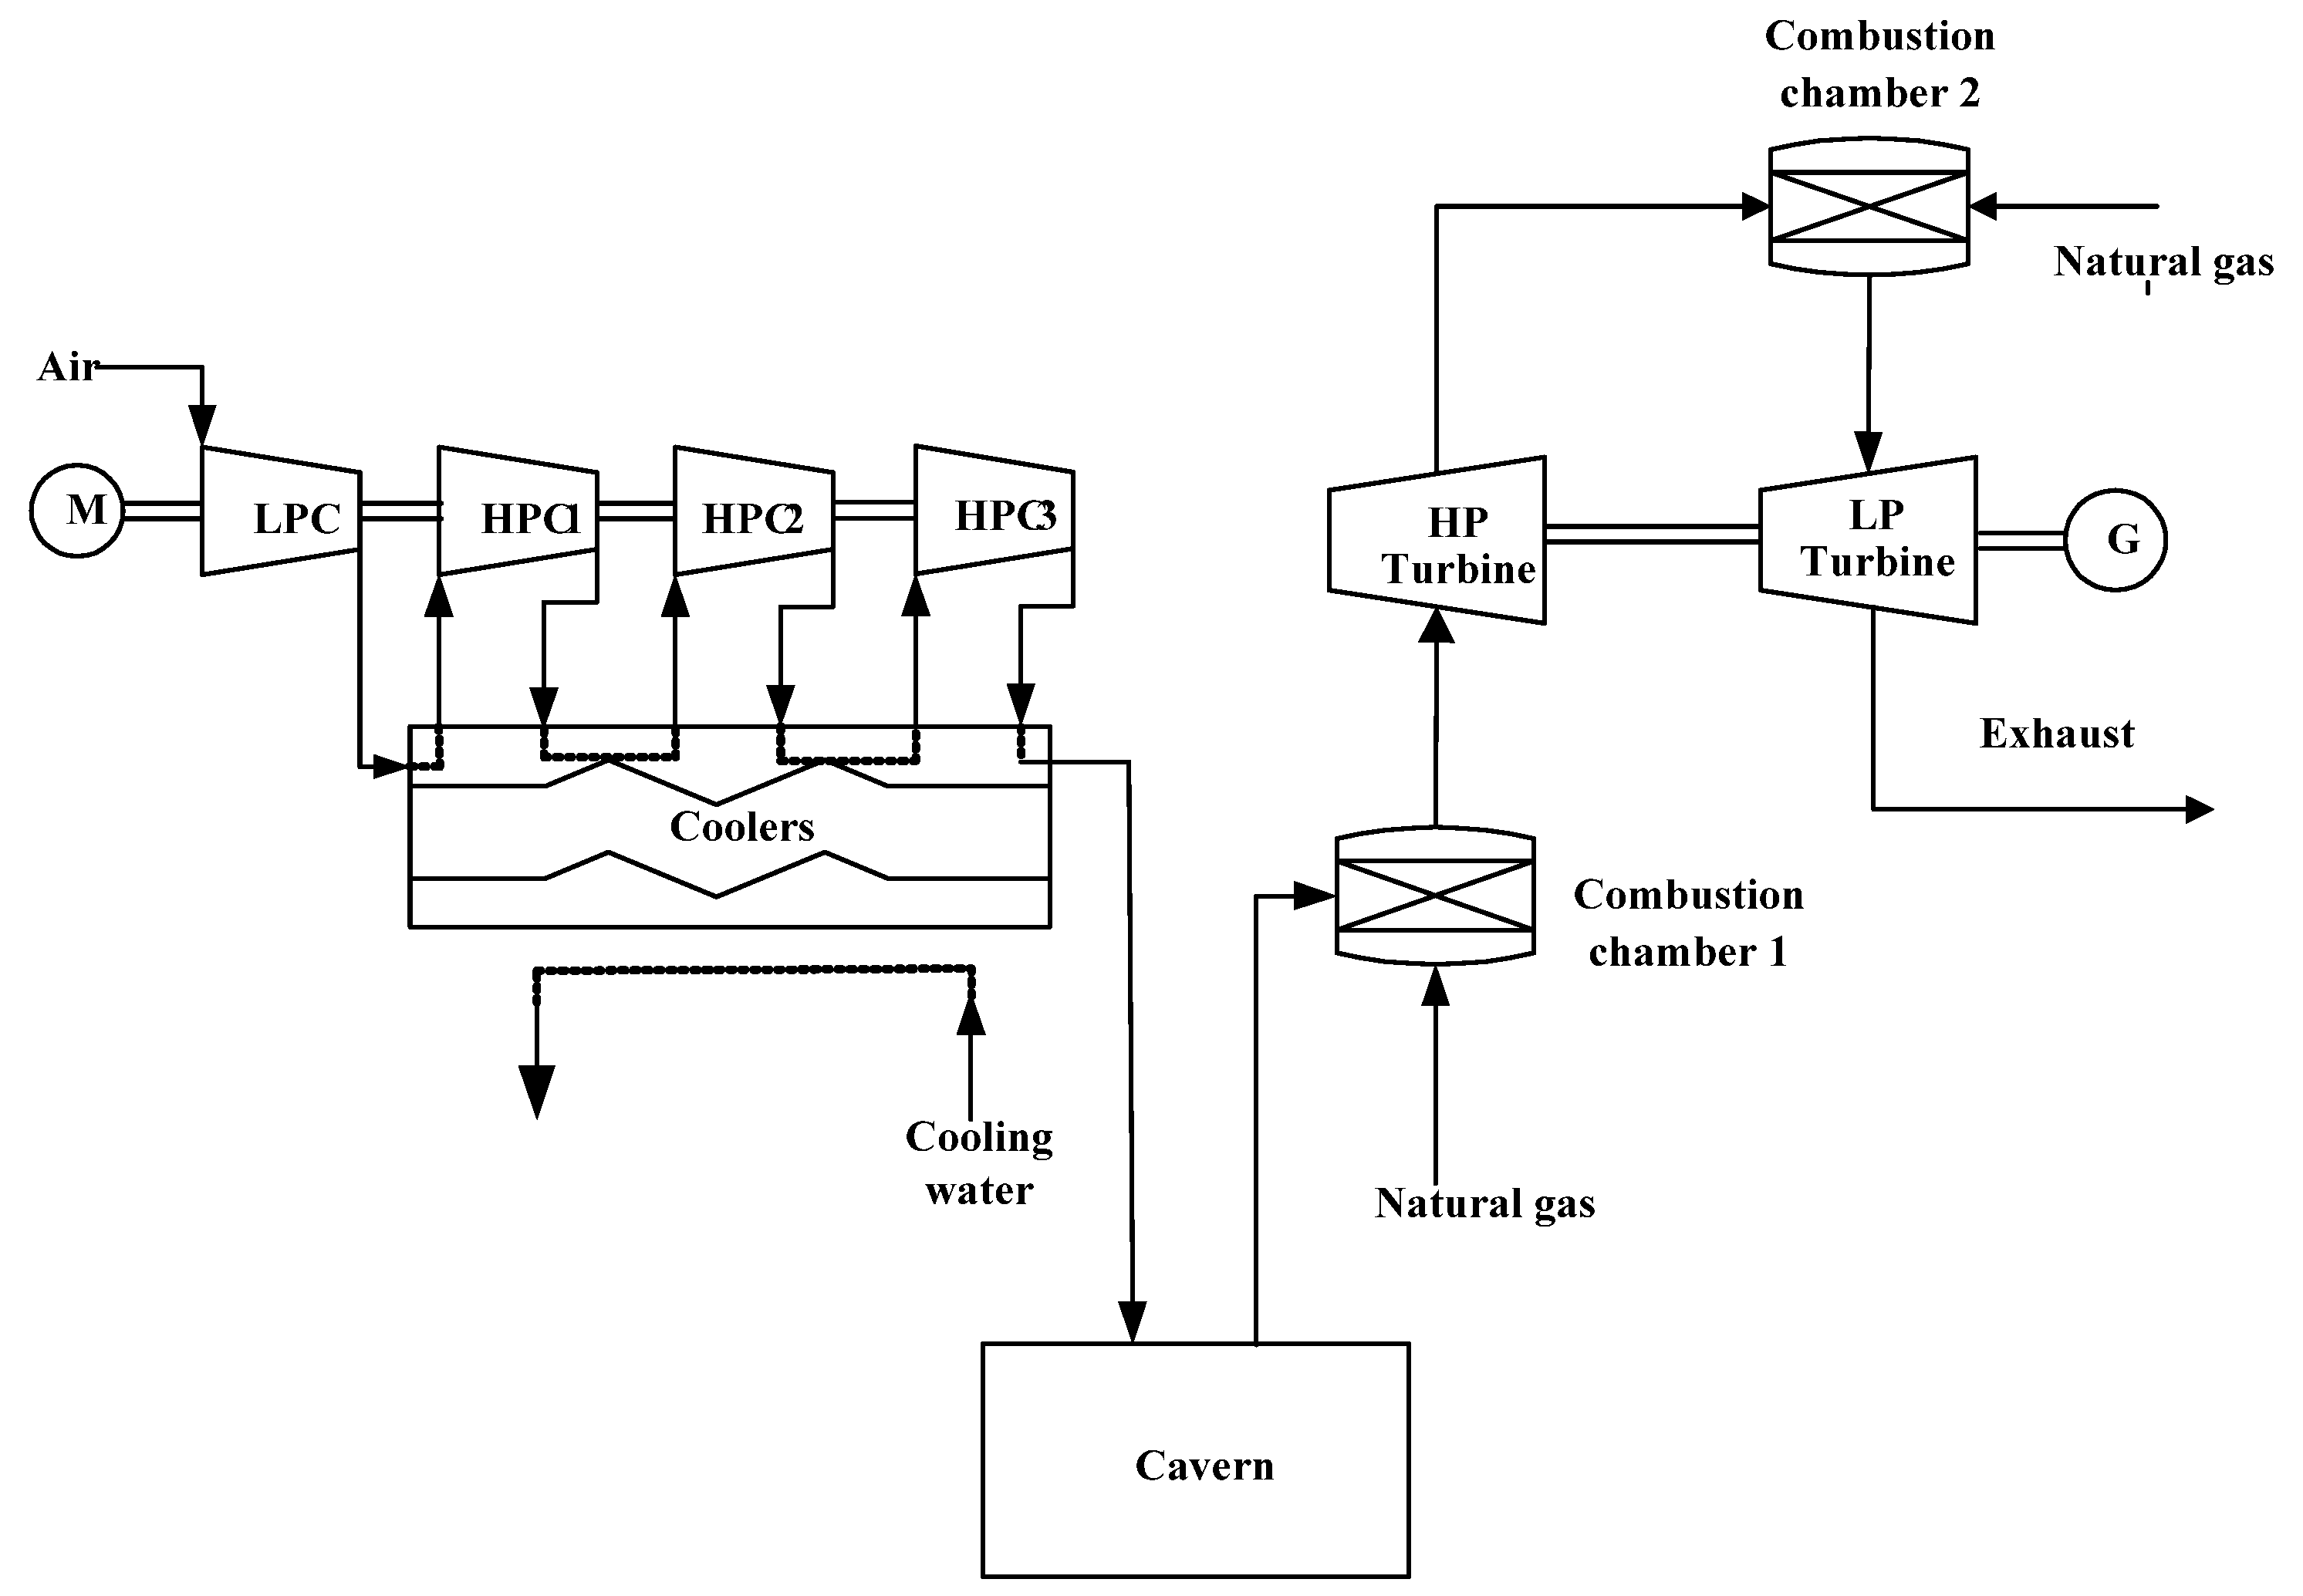
2. Introduction and Simulation of a Conventional CAES Plant


| Parameter | Value | Parameter | Value |
|---|---|---|---|
| Energy Storage Subsystem | Electricity-generating Subsystem | ||
| Continuous compressor operation time | 8 h | Continuous turbine operation time | 2 h |
| Inlet air flux of compressor | 108 kg/s | Inlet air flux of combustion chamber | 417 kg/s |
| Stages of compressor | 4 | Inlet air temperature of combustion chamber #1 | 50 °C |
| Number of intercoolers | 3 | Inlet air pressure of combustion chamber #1 | 42 bar |
| Number of aftercoolers | 1 | Outlet temperature of combustion chamber #1 | 600 °C |
| Outlet air temperature of coolers | 50 °C | Outlet temperature of combustion chamber #2 | 1050 °C |
| Isentropic efficiency of axial compressor | 0.82 | Outlet pressure of combustion chamber #2 | 11 bar |
| Isentropic efficiency of centrifugal compressor | 0.8 | Outlet pressure of LP gas turbine | 1.13 bar |
| Compressor mechanical efficiency | 0.99 | Isentropic efficiency of turbine | 0.85 |
| Pressure ratio of axial compressor | 6 | Turbine mechanical efficiency | 0.99 |
| Pressure ratio of centrifugal compressor | 2.15 | LHV of natural gas | 50,030.04 kJ/kg |
3. Optimization Methods of the Conventional CAES
3.1. Existing Optimization Method of the Conventional CAES

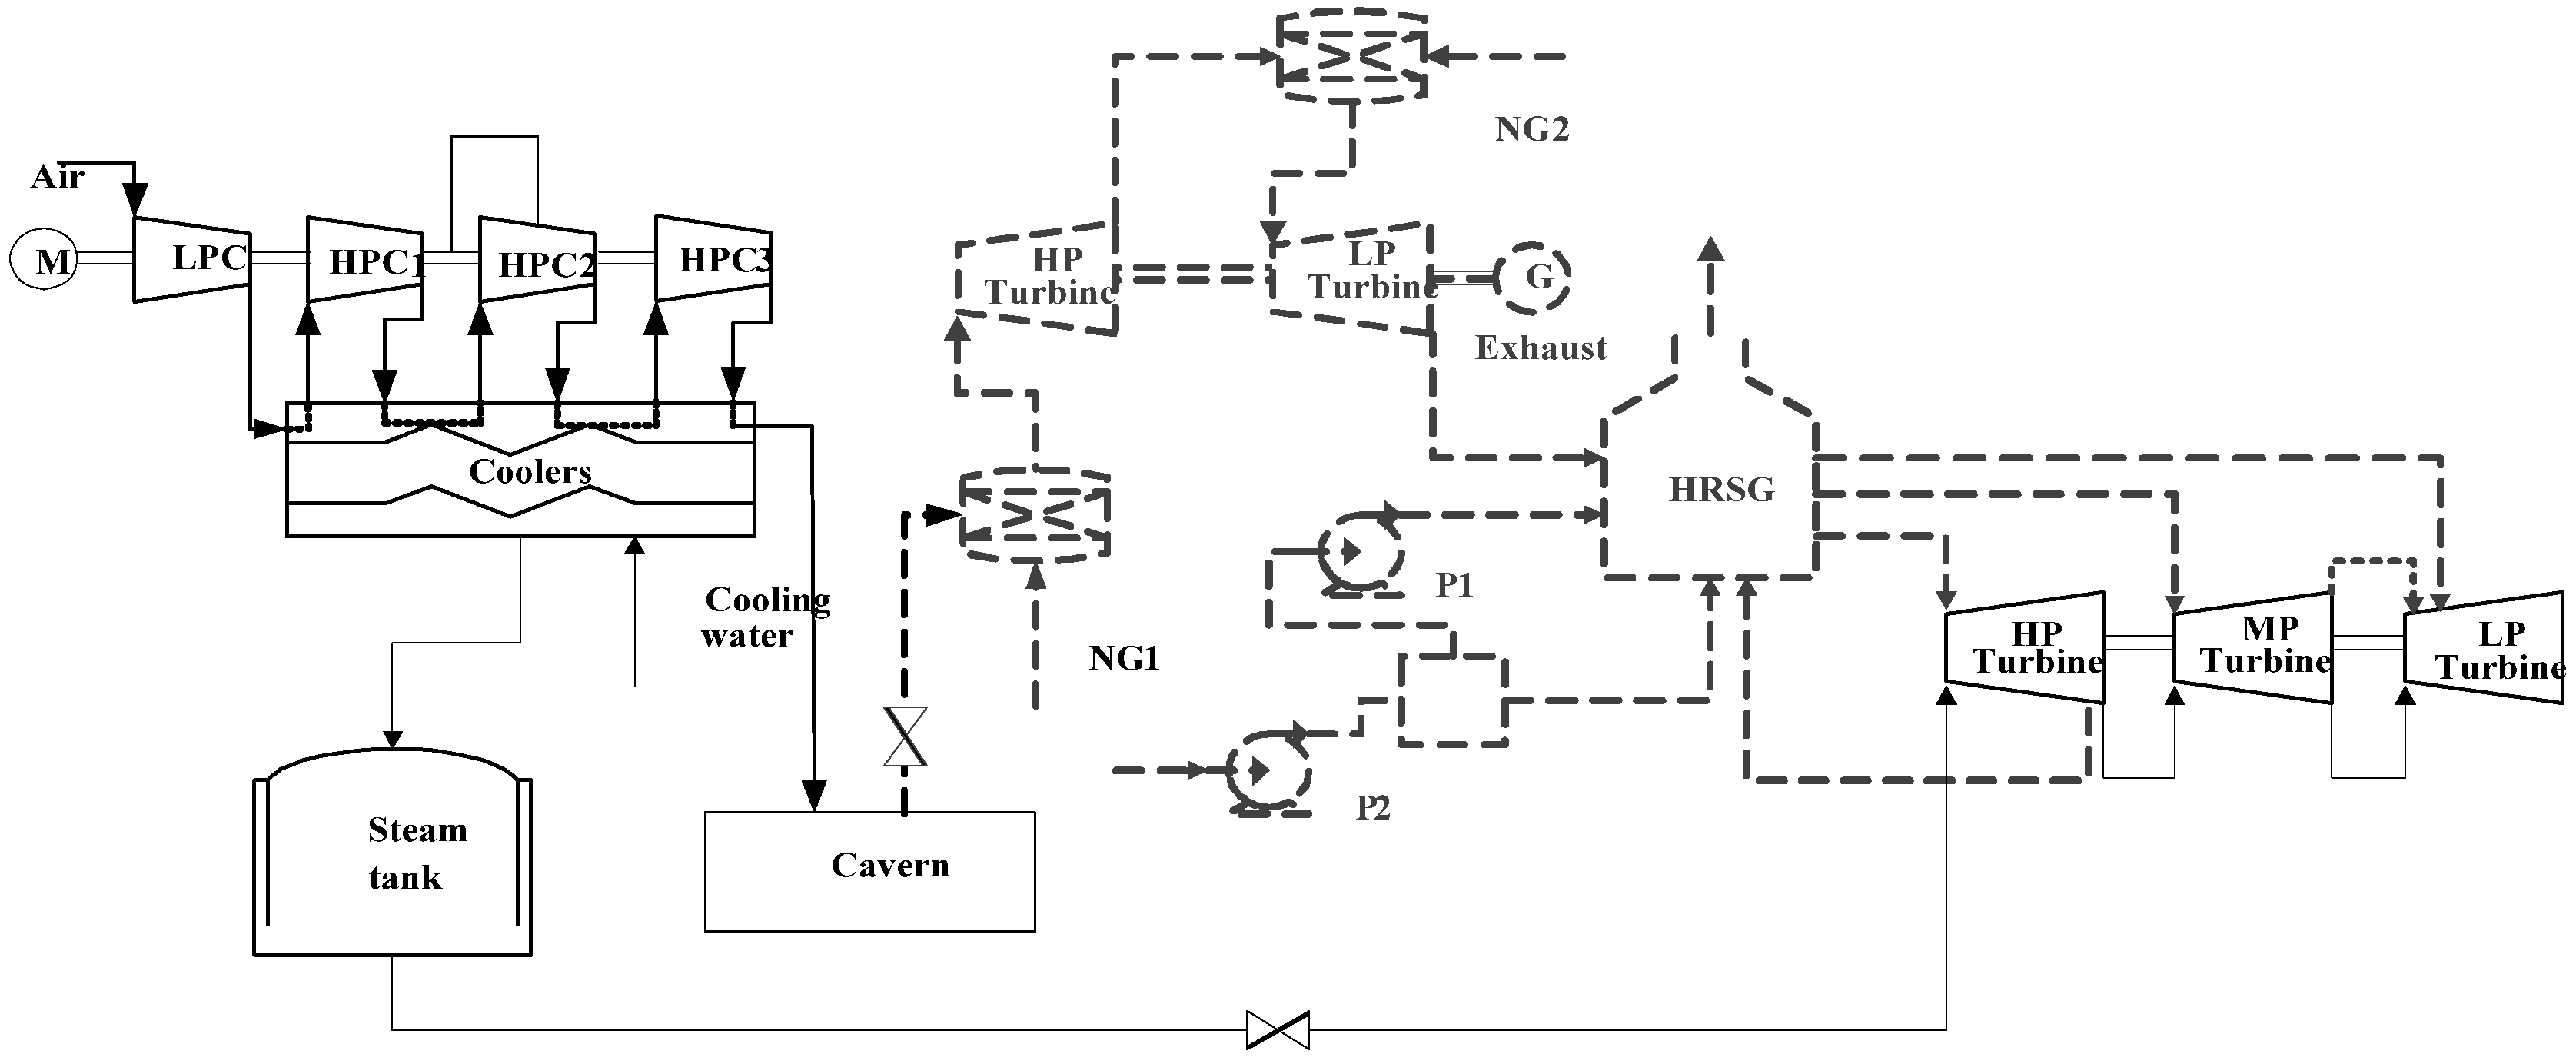
3.2. Process Introduction of a CAES-CC System
3.3. Selection of Key Parameters for the Optimized System
| Parameter | Value | Parameter | Value |
|---|---|---|---|
| Inlet temperature of HP turbine | 540 °C | Outlet pressure of HP turbine | 31.5 bar |
| Inlet temperature of MP turbine | 540 °C | Outlet pressure of MP turbine | 5 bar |
| Inlet temperature of LP turbine | 313.5 °C | Outlet pressure of LP turbine | 0.055 bar |
| Inlet pressure of HP turbine | 98 bar | Isentropic efficiency of HP turbine | 87% |
| Inlet pressure of MP turbine | 26 bar | Isentropic efficiency of MP turbine | 89% |
| Inlet pressure of LP turbine | 5 bar | Isentropic efficiency of LP turbine | 85% |
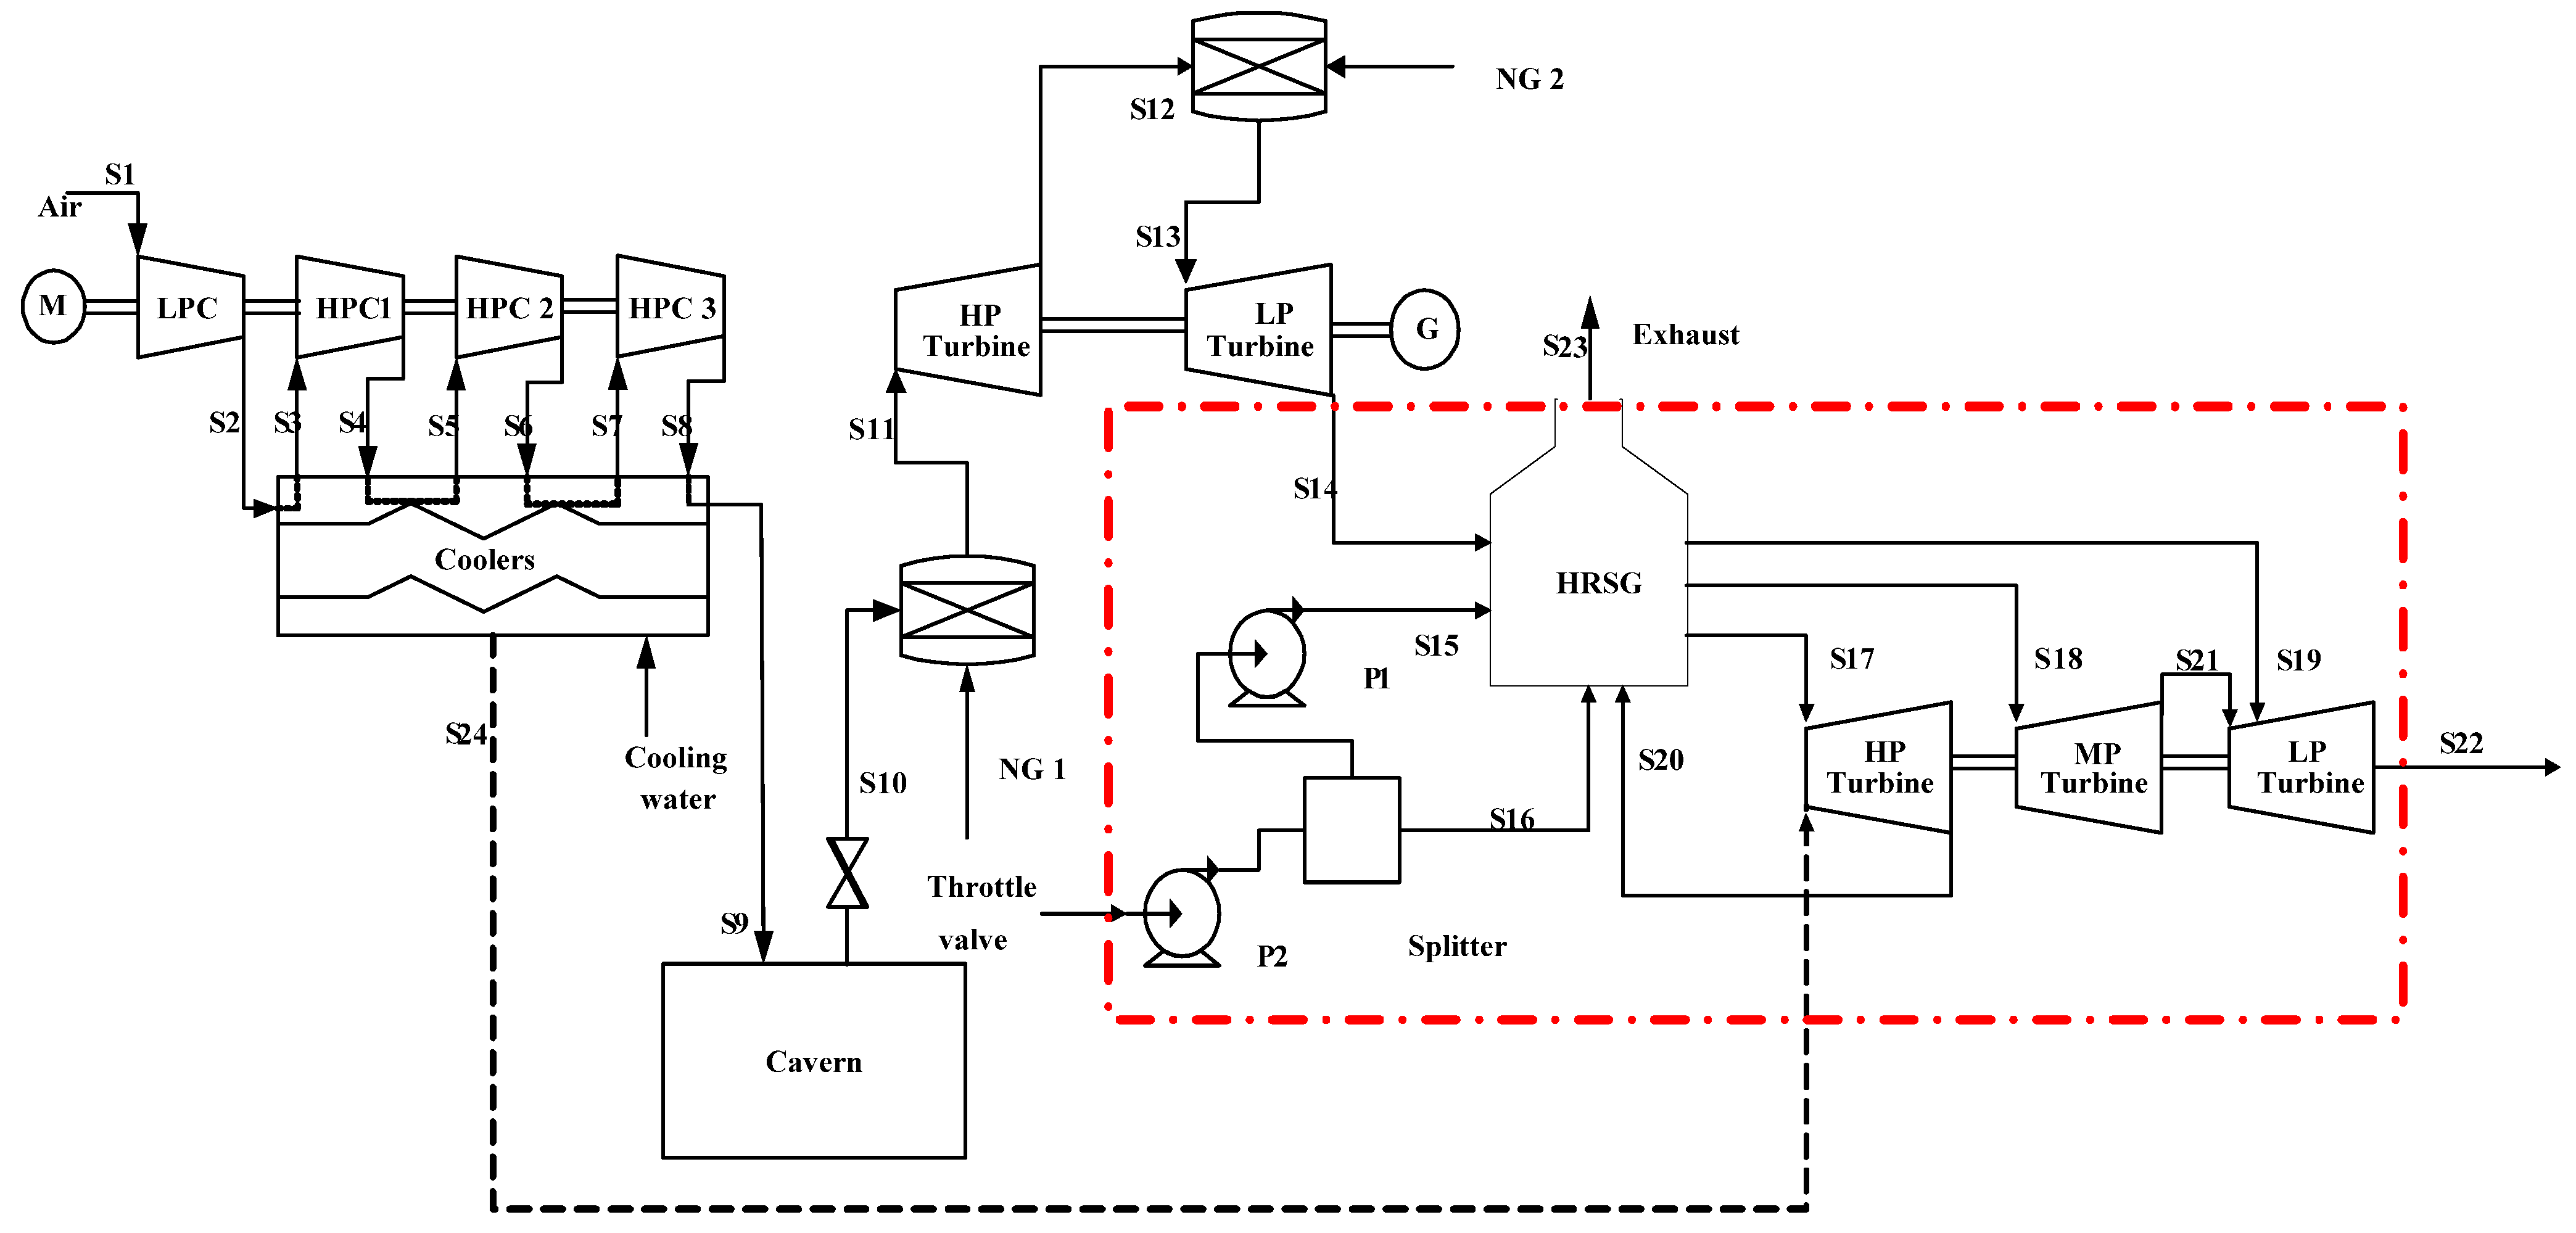
4. Process Simulation and Evaluation of CAES-CC
4.1. Process Simulation
| No. | Temperature (°C) | Pressure (bar) | Gas Flux (kg/s) | Mole Percentage (%) | ||||
|---|---|---|---|---|---|---|---|---|
| N2 | O2 | CH4 | CO2 | H2O | ||||
| S1 | 10.00 | 1.01 | 108.00 | 79.00 | 21.00 | 0.00 | 0.00 | 0.00 |
| S2 | 237.80 | 6.08 | 108.00 | 79.00 | 21.00 | 0.00 | 0.00 | 0.00 |
| S3 | 50.00 | 6.08 | 108.00 | 79.00 | 21.00 | 0.00 | 0.00 | 0.00 |
| S4 | 147.80 | 13.05 | 108.00 | 79.00 | 21.00 | 0.00 | 0.00 | 0.00 |
| S5 | 50.00 | 13.05 | 108.00 | 79.00 | 21.00 | 0.00 | 0.00 | 0.00 |
| S6 | 147.90 | 28.00 | 108.00 | 79.00 | 21.00 | 0.00 | 0.00 | 0.00 |
| S7 | 50.00 | 28.00 | 108.00 | 79.00 | 21.00 | 0.00 | 0.00 | 0.00 |
| S8 | 148.00 | 60.11 | 108.00 | 79.00 | 21.00 | 0.00 | 0.00 | 0.00 |
| S9 | 50.00 | 60.12 | 108.00 | 79.00 | 21.00 | 0.00 | 0.00 | 0.00 |
| S10 | 50.00 | 42.00 | 417.00 | 79.00 | 21.00 | 0.00 | 0.00 | 0.00 |
| S11 | 600.00 | 42.00 | 422.15 | 77.30 | 16.20 | 0.00 | 2.20 | 4.30 |
| S12 | 389.40 | 11.50 | 422.15 | 77.30 | 16.20 | 0.00 | 2.20 | 4.30 |
| S13 | 1050.00 | 11.00 | 428.70 | 75.00 | 9.90 | 0.00 | 5.00 | 10.10 |
| S14 | 583.50 | 1.130 | 429.30 | 75.00 | 9.90 | 0.00 | 5.00 | 10.10 |
| S15 | 45.90 | 500.00 | 50.14 | 0.00 | 0.00 | 0.00 | 0.00 | 100.00 |
| S16 | 42.10 | 5.20 | 17.16 | 0.00 | 0.00 | 0.00 | 0.00 | 100.00 |
| S17 | 540.00 | 98.00 | 50.14 | 0.00 | 0.00 | 0.00 | 0.00 | 100.00 |
| S18 | 540.00 | 26.00 | 50.14 | 0.00 | 0.00 | 0.00 | 0.00 | 100.00 |
| S19 | 313.50 | 5.00 | 17.16 | 0.00 | 0.00 | 0.00 | 0.00 | 100.00 |
| S20 | 368.90 | 31.50 | 50.14 | 0.00 | 0.00 | 0.00 | 0.00 | 100.00 |
| S21 | 313.50 | 5.00 | 50.14 | 0.00 | 0.00 | 0.00 | 0.00 | 100.00 |
| S22 | 37.70 | 0.06 | 67.31 | 0.00 | 0.00 | 0.00 | 0.00 | 100.00 |
| S23 | 94.80 | 1.00 | 429.30 | 75.00 | 9.90 | 0.00 | 5.00 | 10.10 |
4.2. Evaluation Criteria
- (1)
- Energy rate
- (2)
- Heat rate
- (3)
- Overall efficiency
- (4)
- Efficiency of electricity storage
4.3. Thermal Performance Analysis
| Parameter | CAES-CC | Recuperated CAES | Reference CAES | |||
|---|---|---|---|---|---|---|
| Value | Unit | Value | Unit | Value | Unit | |
| Compressor power | 57.90 | MW | 57.90 | MW | 57.90 | MW |
| Gas turbine power | 349.14 | MW | 342.06 | MW | 349.14 | MW |
| Steam turbine power | 83.24 | MW | ||||
| Exhaust gas temperature | 94.80 | °C | 182 | °C | 583.50 | °C |
| LHV of natural gas | 50,030.04 | kJ/kg | 50,030.04 | kJ/kg | 50,030.04 | kJ/kg |
| Fuel flow of combustion chamber #1 | 18,549.79 | kg/h | 4,462.12 | kg/h | 18,549.79 | kg/h |
| Fuel flow of combustion chamber #2 | 25,719.33 | kg/h | 24,965.51 | kg/h | 25,719.33 | kg/h |
| Fuel consumption heat | 615.22 | MW | 408.96 | MW | 615.22 | MW |
| Qf | 1,230.44 | MWh | 817.93 | MWh | 1,230.44 | MWh |
| Total compression power Wc | 463.22 | MWh | 463.22 | MWh | 463.22 | MWh |
| Total expansion power Wt | 864.76 | MWh | 684.12 | MWh | 698.28 | MWh |
| ER | 0.536 | 0.677 | 0.663 | |||
| HR | 1.423 | 1.196 | 1.761 | |||
| ηsys | 0.500 | 0.500 | 0.500 | |||
| ηee | 0.511 | 0.534 | 0.413 | |||
| ηes | 0.802 | 0.784 | 0.648 | |||
4.4. System Analysis according to the Second Law of Thermodynamics
| Components | Schematic View | Exergy Destruction |
|---|---|---|
| Compressor |  | |
| Cooler |  | |
| Storage cavern |  | |
| Combustion chamber |  | |
| Gas turbine |  | |
| HRSG |  | |
| Steam turbine |  | |
| Condenser |  | |
| Pump |  | |
| Splitter |  |
| Name | Reference CAES | CAES-CC | ||
|---|---|---|---|---|
| Value | Proportion of Exergy Input | Value | Proportion of Exergy Input | |
| MWh | % | MWh | % | |
| Air | 1.98 | 0.11 | 1.98 | 0.11 |
| Compressor power consumption | 463.22 | 26.48 | 463.22 | 26.48 |
| Natural gas input | 1284.19 | 73.41 | 1284.19 | 73.41 |
| Subtotal of exergy input | 1749.39 | 100 | 1749.39 | 100 |
| Subtotal of compressor series and cooler | 161.40 | 9.23 | 161.40 | 9.23 |
| Storage cavern | 34.39 | 2.04 | 34.39 | 2.04 |
| Subtotal of combustion chamber | 529.63 | 30.27 | 529.63 | 30.27 |
| Subtotal of gas turbine | 56.18 | 3.21 | 56.18 | 3.21 |
| HRSG | 47.69 | 2.73 | ||
| Subtotal of steam turbine | 20.42 | 1.17 | ||
| Condenser | 13.01 | 0.74 | ||
| Auxiliary equipment and other parts | 0.44 | 0.03 | ||
| Power output | 698.28 | 39.92 | 864.76 | 49.43 |
| Exergy of exhaust gas | 265.61 | 15.18 | 24.15 | 1.38 |
| Subtotal output exergy | 1745.49 | 99.78 | 1752.07 | 100.15 |
| Error of exergy input and output | 0.22% | 0.15% | ||
| Exergy efficiency | 49.43% | 39.92% | ||
5. Further Discussion
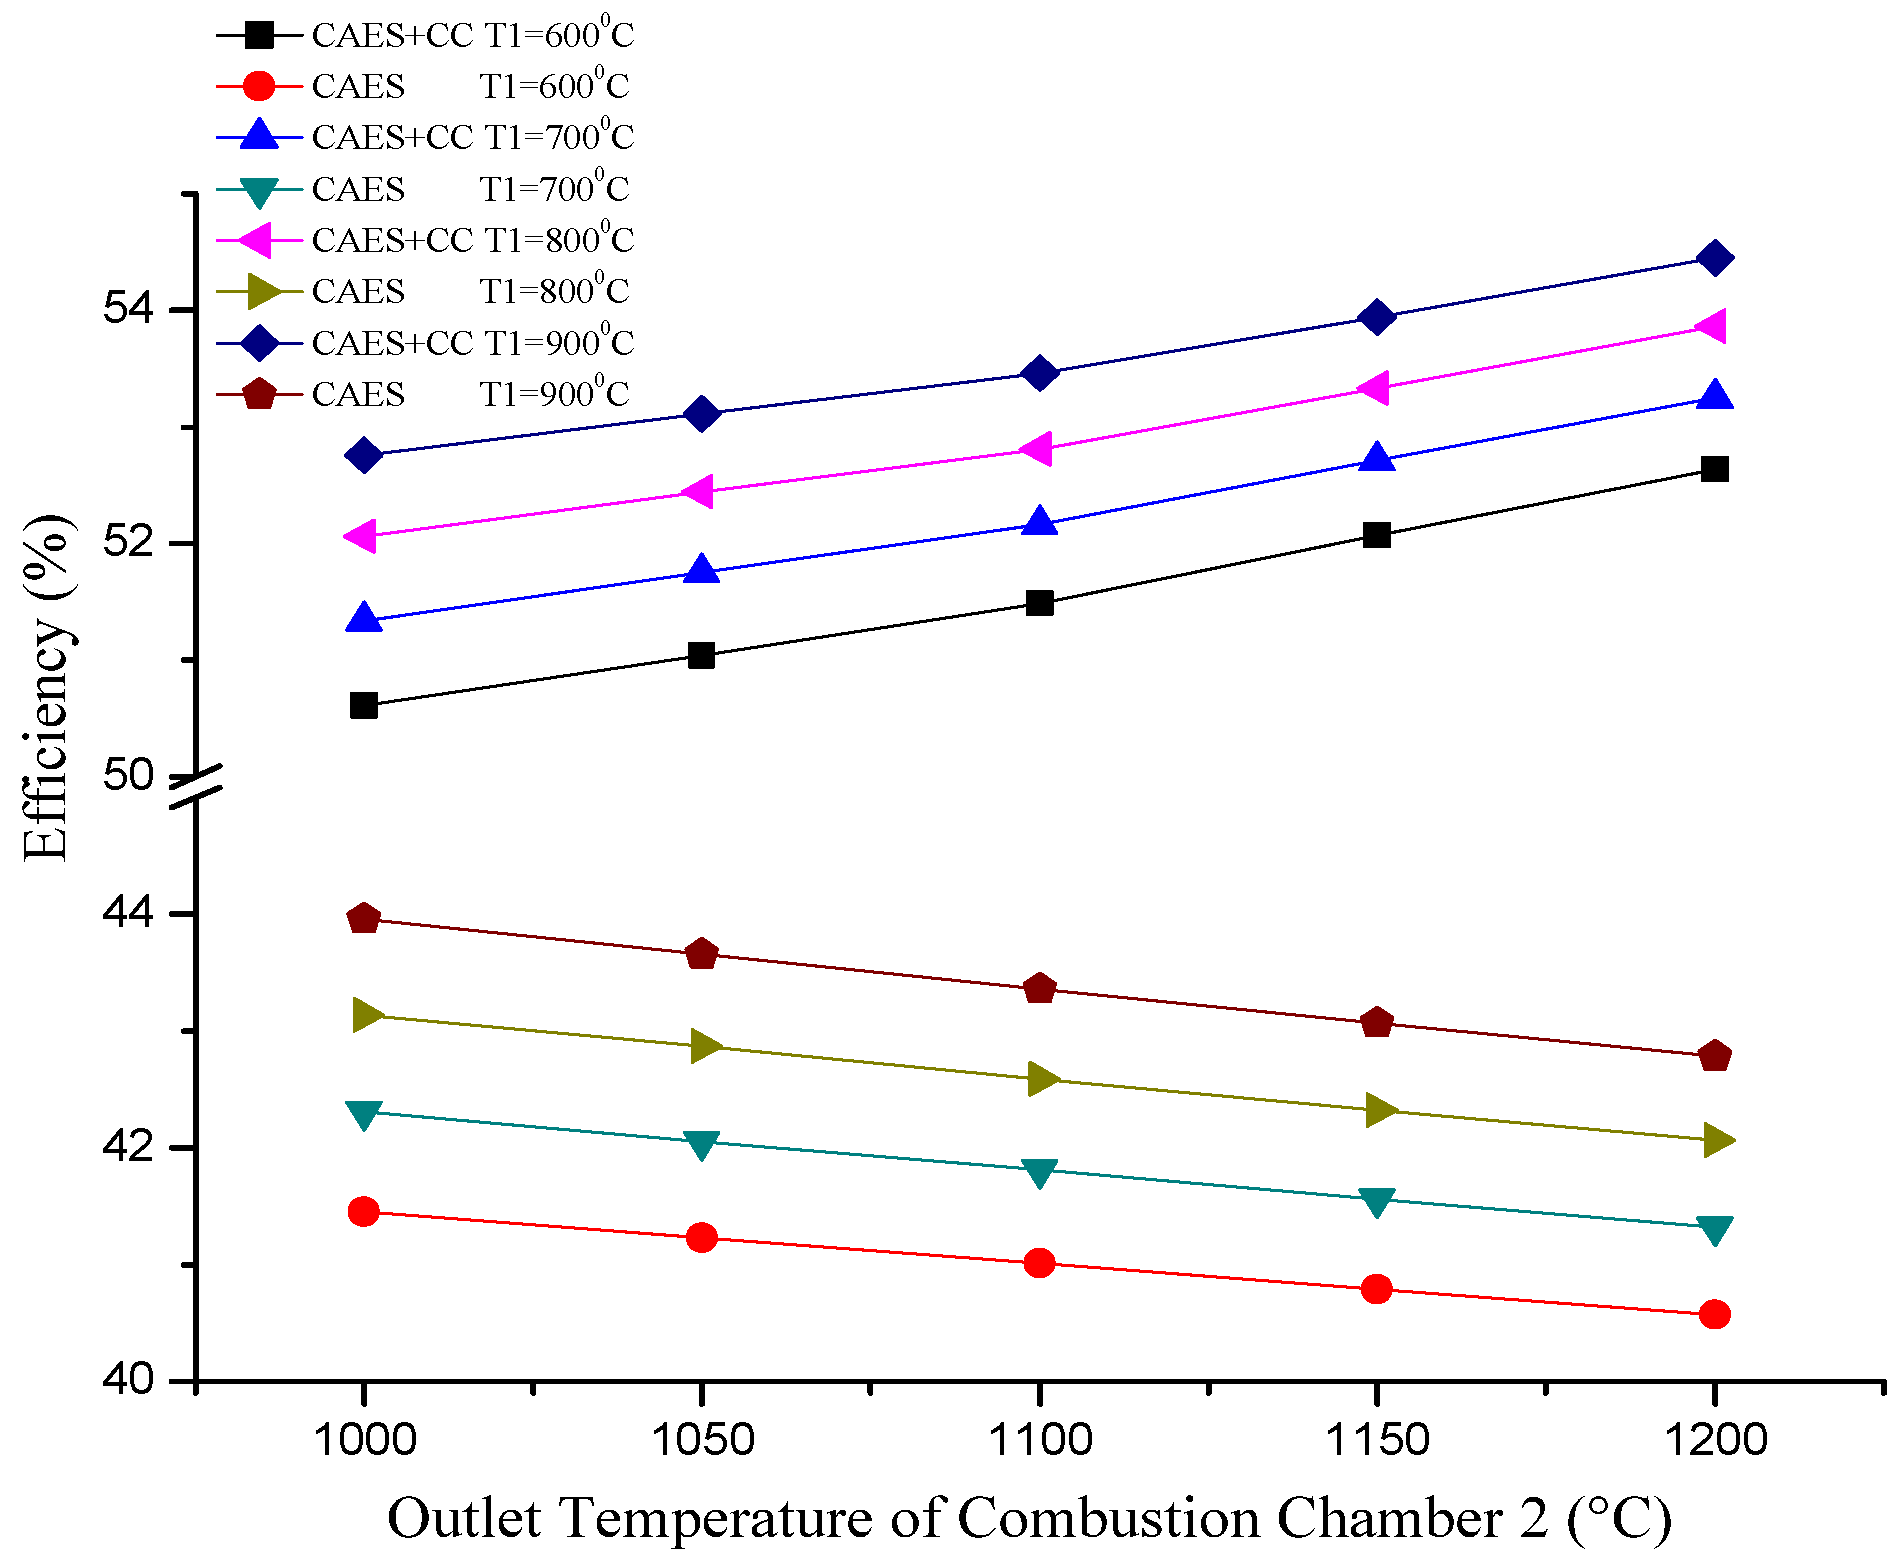
5.1. Effects of Combustion Chamber Outlet Temperature Variation on System Efficiency

- (1)
- The overall efficiency of the CAES-CC system is higher than that of the reference CAES system with the same T1. As mentioned above, this difference is attributed mainly to the effectively recycled exhaust heat of the CAES-CC system.
- (2)
- The overall efficiency of the CAES system decreases with increasing T2 at a constant T1. The results of ASPEN PLUS show that although the output power of the LP gas turbine increases with increasing T2, the LP gas turbine incurs considerable heat loss because of high exhaust gas temperature. Conversely, the overall efficiency of the CAES-CC system increases with increasing T2 at a constant T1. This result can be attributed to two conditions. One is the output power of the LP gas turbine increasing with increasing T2. The other is the utilization of additional exhaust heat from the LP gas turbine in the HRSG to produce more steam as the exhaust gas temperature increases.
- (3)
- The overall efficiency of both the CAES-CC system and the reference system increases with increasing T1 at a constant T2. Increasing T1 can increase gas turbine power output and reduce the fuel consumption of combustion chamber #2. In this way, the overall efficiency of both systems will increase inevitably.
5.2. Increasing Flexibility of CAES-CC Using Intercooler Heat
6. Conclusions
- (1)
- The first-generation CAES system is characterized by large gas displacement and energy loss that result in poor efficiency. The proper utilization of exhaust air waste heat is crucial to increasing system efficiency.
- (2)
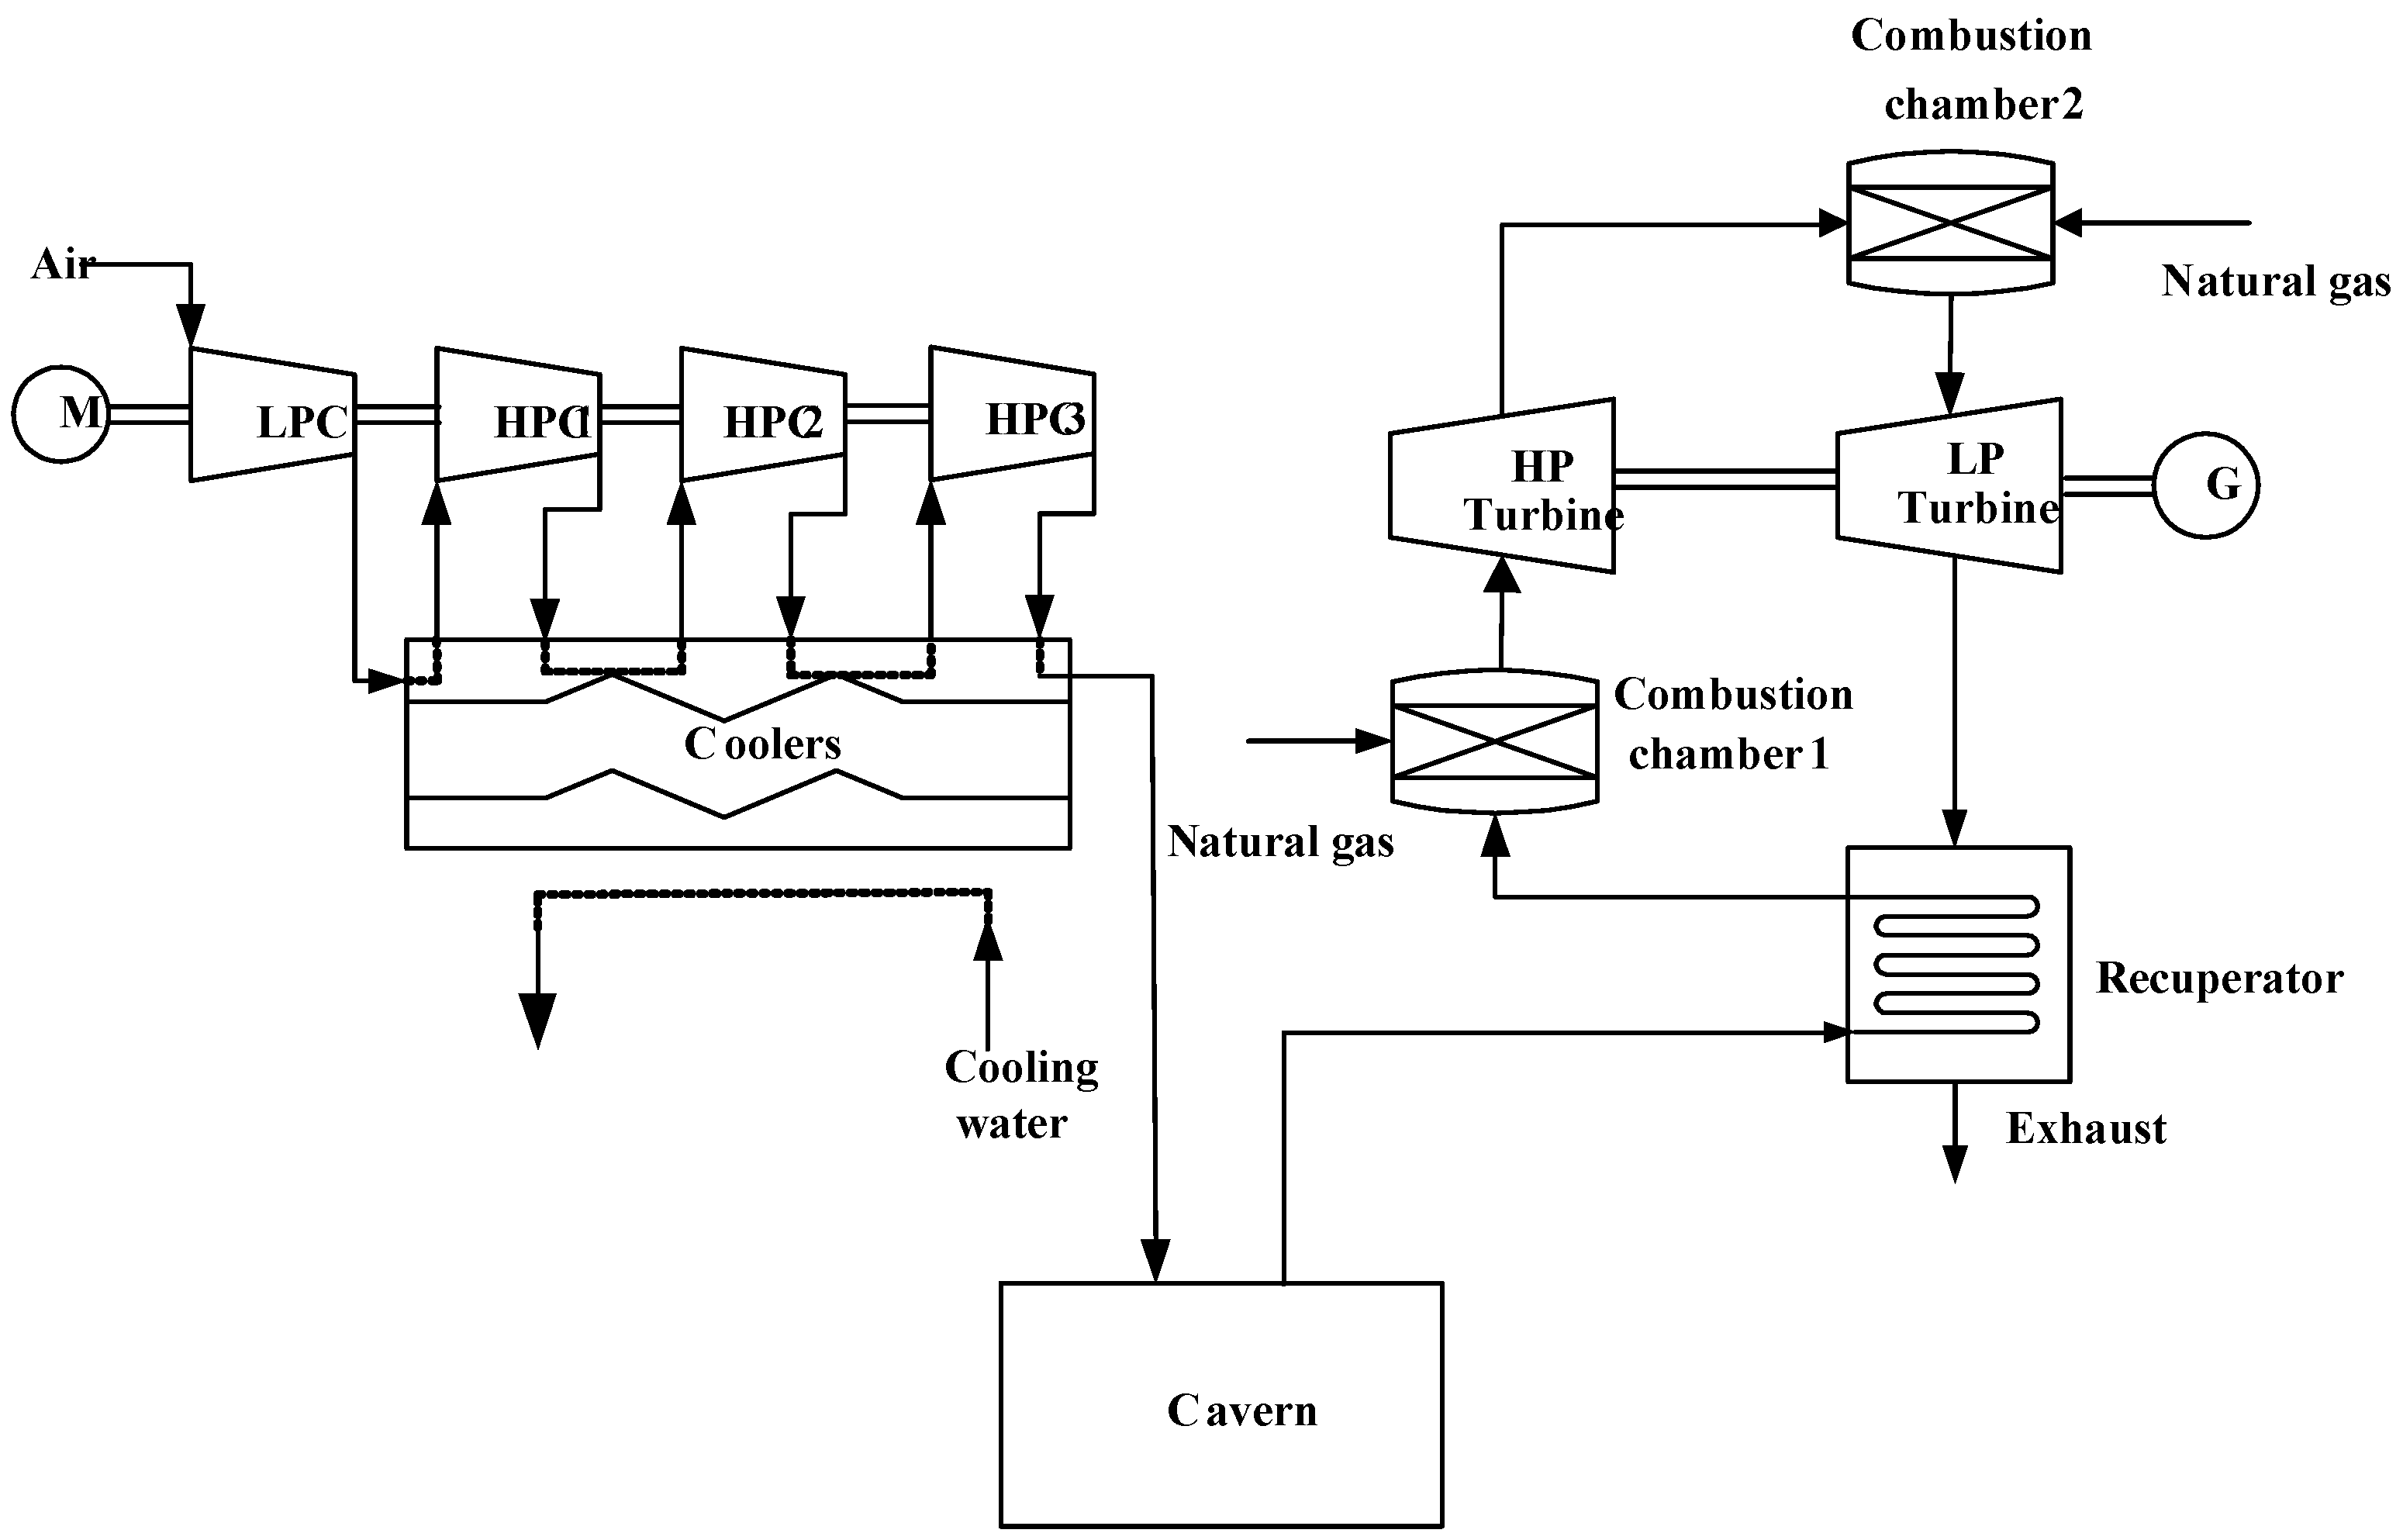
- The recuperator is a reliable technology and has been utilized in small-scale CAES plants. However, for a large-scale CAES plant with high parameters and large discharge flow, it is difficult to recycle the exhaust heat by adding a recuperator. The reason lies in that the heat transfer area is too large, leading to a large volume and high investment of the CAES plant. Conversely, CAES-CC is more suitable under the high parameter conditions.
- (3)
- Compared with the conventional CAES, CAES-CC has lower exhaust air temperature. The ER and HR of the CAES-CC system are lower than those of the reference CAES system by 0.127 kWh/kWh and 0.338 kWh/kWh, respectively. The overall efficiency of CAES-CC is improved by approximately 10% after recovering the exhaust heat from the gas turbine to produce steam for the combined cycle.
- (4)
- Intercooler heat can be used to produce low parameter steam to keep a steam turbine running on stand-by. This low-cost method of using intercooler heat can definitely improve system flexibility.
Acknowledgements
Author Contributions
Conflicts of Interest
References
- Liu, W.-Y.; Yang, Y.-P.; Zhang, X.G.; Xin, Y.B. Present situation and development trend of compressed air energy storage (CAES) power plant. Shandong Electr. Power 2007, 2, 10–14. (in Chinese). [Google Scholar]
- Wind Power. Available online: http://en.wikipedia.org/wiki/Wind_power#cite_note-gws-2012–46 (accessed on 12 December 2013).
- The Central People’s Government of the People’s Republic of China. Available online: http://www.gov.cn/jrzg/2013-08/26/content_2474123.htm (accessed on 14 December 2013). (in Chinese)
- White Paper on the Research of the Energy Storage Industry 2013. Available online: http://www1.cnesa.org/do/bencandy.php?fid=84&id=2128 (accessed on 23 August 2013). (in Chinese).
- Rastler, D.M. Electricity Energy Storage Technology Options: A White Paper Primer on Applications, Costs and Benefits; Electric Power Research Institute (EPRI): Palo Alto, CA, USA, 2010. [Google Scholar]
- National Development and Reform Commission. China’s Twelfth Five-Year Plan (2011–2015). In Proceedings of the Fifth Plenary Session of the 17th CPC Central Committee; Beijing, China: 18 October 2010 (in Chinese).
- Party of China’s Conditions on the Construction of Pumped Storage Power Station by the End of 2012. Available online: http://news.bjx.com.cn/html/20130912/459422.shtml (accessed on 12 December 2013). (in Chinese).
- Eckroad, S.; Gyuk, I. EPRI-DOE Handbook of Energy Storage for Transmission & Distribution Applications; Electric Power Research Institute (EPRI): Palo Alto, CA, USA, 2003. [Google Scholar]
- Bullough, C.; Gatzen, C.; Jakiel, C.; Koller, M.; Nowi, A.; Zunft, S. Advanced adiabatic compressed air energy storage for the integration of wind energy. In Proceedings of the European Wind Energy Conference (EWEC) 2004, London, UK, 22–25 November 2004.
- Zafirakis, D.; Kaldellis, J.K. Economic evaluation of the dual mode CAES solution for increased wind energy contribution in autonomous island networks. Energy Policy 2009, 37, 1958–1969. [Google Scholar] [CrossRef]
- Denholm, P. Improving the technical, environmental and social performance of wind energy systems using biomass-based energy storage. Renew. Energy 2006, 31, 1355–1370. [Google Scholar] [CrossRef]
- Kim, Y.M.; Daniel, F. Energy and exergy analysis of a micro-compressed air energy storage and air cycle heating and cooling system. Energy 2010, 35, 213–220. [Google Scholar] [CrossRef]
- Nakhamkin, M. New compressed air energy storage concept improves the profitability of existing simple cycle, combined cycle, wind energy, and landfill gas power plants. In Proceedings of the ASME Turbo Expo 2004: Power for Land, Sea, and Air, Vienna, Austria, 14–17 June 2004; American Society of Mechanical Engineers: New York, NY, USA, 2004. [Google Scholar]
- Nakhamkin, M. Conversion of Combined Cycle Power Plant to Compressed Air Energy Storage Power Plant. U.S. Patent No. 7640643, 5 January 2010. [Google Scholar]
- Huntorf Air Storage Gas Turbine Power Plant. Available online: http://www.kraftwerk-wilhelmshaven.com/pages/ekw_de/Kraftwerk_Wilhelmshaven/Mediencenter/_documents/BBC-Huntorf_engl.pdf (accessed on 3 June 2014).
- Crotogino, F.; Mohmeyer, K.U.; Scharf, R. Huntorf CAES: More than 20 Years of Successful Operation. In Proceedings of the Solution Mining Research Institute (SMRI) Spring Meeting 2001, Orlando, FL, USA, 15–18 April 2001; pp. 351–357.
- Compressed Air Energy Storage Power Plant. Available online: http://www.bine.info/fileadmin/content/Publikationen/Englische_Infos/projekt_0507_engl_internetx.pdf (accessed on 3 June 2014).
- Pickard, W.F.; Hansing, N.J.; Shen, A.Q. Can large-scale advanced-adiabatic compressed air energy storage be justified economically in an age of sustainable energy? J. Renew. Sustain. Energy. 2009, 1, 033102. [Google Scholar] [CrossRef]
- Jiao, S.J. Gas-Steam Combined Cycle; Mechanical Industry Press: Beijing, China, 2004. [Google Scholar]
- Taylor, J.; Halnes, A. Analysis Of compressed air energy storage. In Proceedings of the PCIC Europe 2010 Conference Record, Oslo, Norway, 15–17 June 2010; pp. 1–5.
- Elmegaard, B.; Brix, W. Efficiency of compressed air energy storage. In Proceedings of the 24th International Conference on Efficiency, Cost, Optimization, Simulation and Environmental Impact of Energy Systems, Novi Sad, Serbia, 4–7 July 2011.
- Najjar, Y.S.; Zaamout, M.S. Performance analysis of compressed air energy storage (CAES) plant for dry regions. Energy Convers. Manag. 1998, 39, 1503–1511. [Google Scholar] [CrossRef]
- Kim, Y.M.; Lee, J.H.; Kim, S.J.; Favrat, D. Potential and evolution of compressed air energy storage: Energy and exergy analyses. Entropy 2012, 14, 1501–1521. [Google Scholar] [CrossRef]
- Buffa, F.; Kemble, S.; Manfrida, G.; Milazzo, A. Exergy and exergoeconomic model of a ground-based CAES plant for peak-load energy production. Energies 2013, 6, 1050–1067. [Google Scholar] [CrossRef]
© 2014 by the authors; licensee MDPI, Basel, Switzerland. This article is an open access article distributed under the terms and conditions of the Creative Commons Attribution license (http://creativecommons.org/licenses/by/3.0/).
Share and Cite
Liu, W.; Liu, L.; Zhou, L.; Huang, J.; Zhang, Y.; Xu, G.; Yang, Y. Analysis and Optimization of a Compressed Air Energy Storage—Combined Cycle System. Entropy 2014, 16, 3103-3120. https://doi.org/10.3390/e16063103
Liu W, Liu L, Zhou L, Huang J, Zhang Y, Xu G, Yang Y. Analysis and Optimization of a Compressed Air Energy Storage—Combined Cycle System. Entropy. 2014; 16(6):3103-3120. https://doi.org/10.3390/e16063103
Chicago/Turabian StyleLiu, Wenyi, Linzhi Liu, Luyao Zhou, Jian Huang, Yuwen Zhang, Gang Xu, and Yongping Yang. 2014. "Analysis and Optimization of a Compressed Air Energy Storage—Combined Cycle System" Entropy 16, no. 6: 3103-3120. https://doi.org/10.3390/e16063103
APA StyleLiu, W., Liu, L., Zhou, L., Huang, J., Zhang, Y., Xu, G., & Yang, Y. (2014). Analysis and Optimization of a Compressed Air Energy Storage—Combined Cycle System. Entropy, 16(6), 3103-3120. https://doi.org/10.3390/e16063103