
Potential of Erythrocyte Membrane Lipid Profile as a Novel Inflammatory Biomarker to Distinguish Metabolically Healthy Obesity in Children


 ,
,  and
and 
Abstract
1. Introduction
2. Materials and Methods
2.1. Subjects and Study Design
2.2. Anthropometric Measures
2.3. Nutrient Intakes
2.4. Red Blood Cell (RBC) Membrane Fatty Acid Analysis
2.5. Red Blood Cell Membrane Fatty Acid Profile
2.6. Statistical Analysis
3. Results
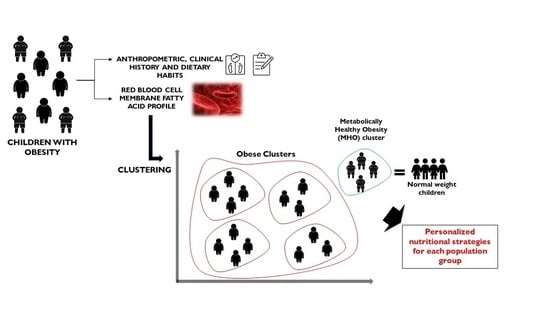
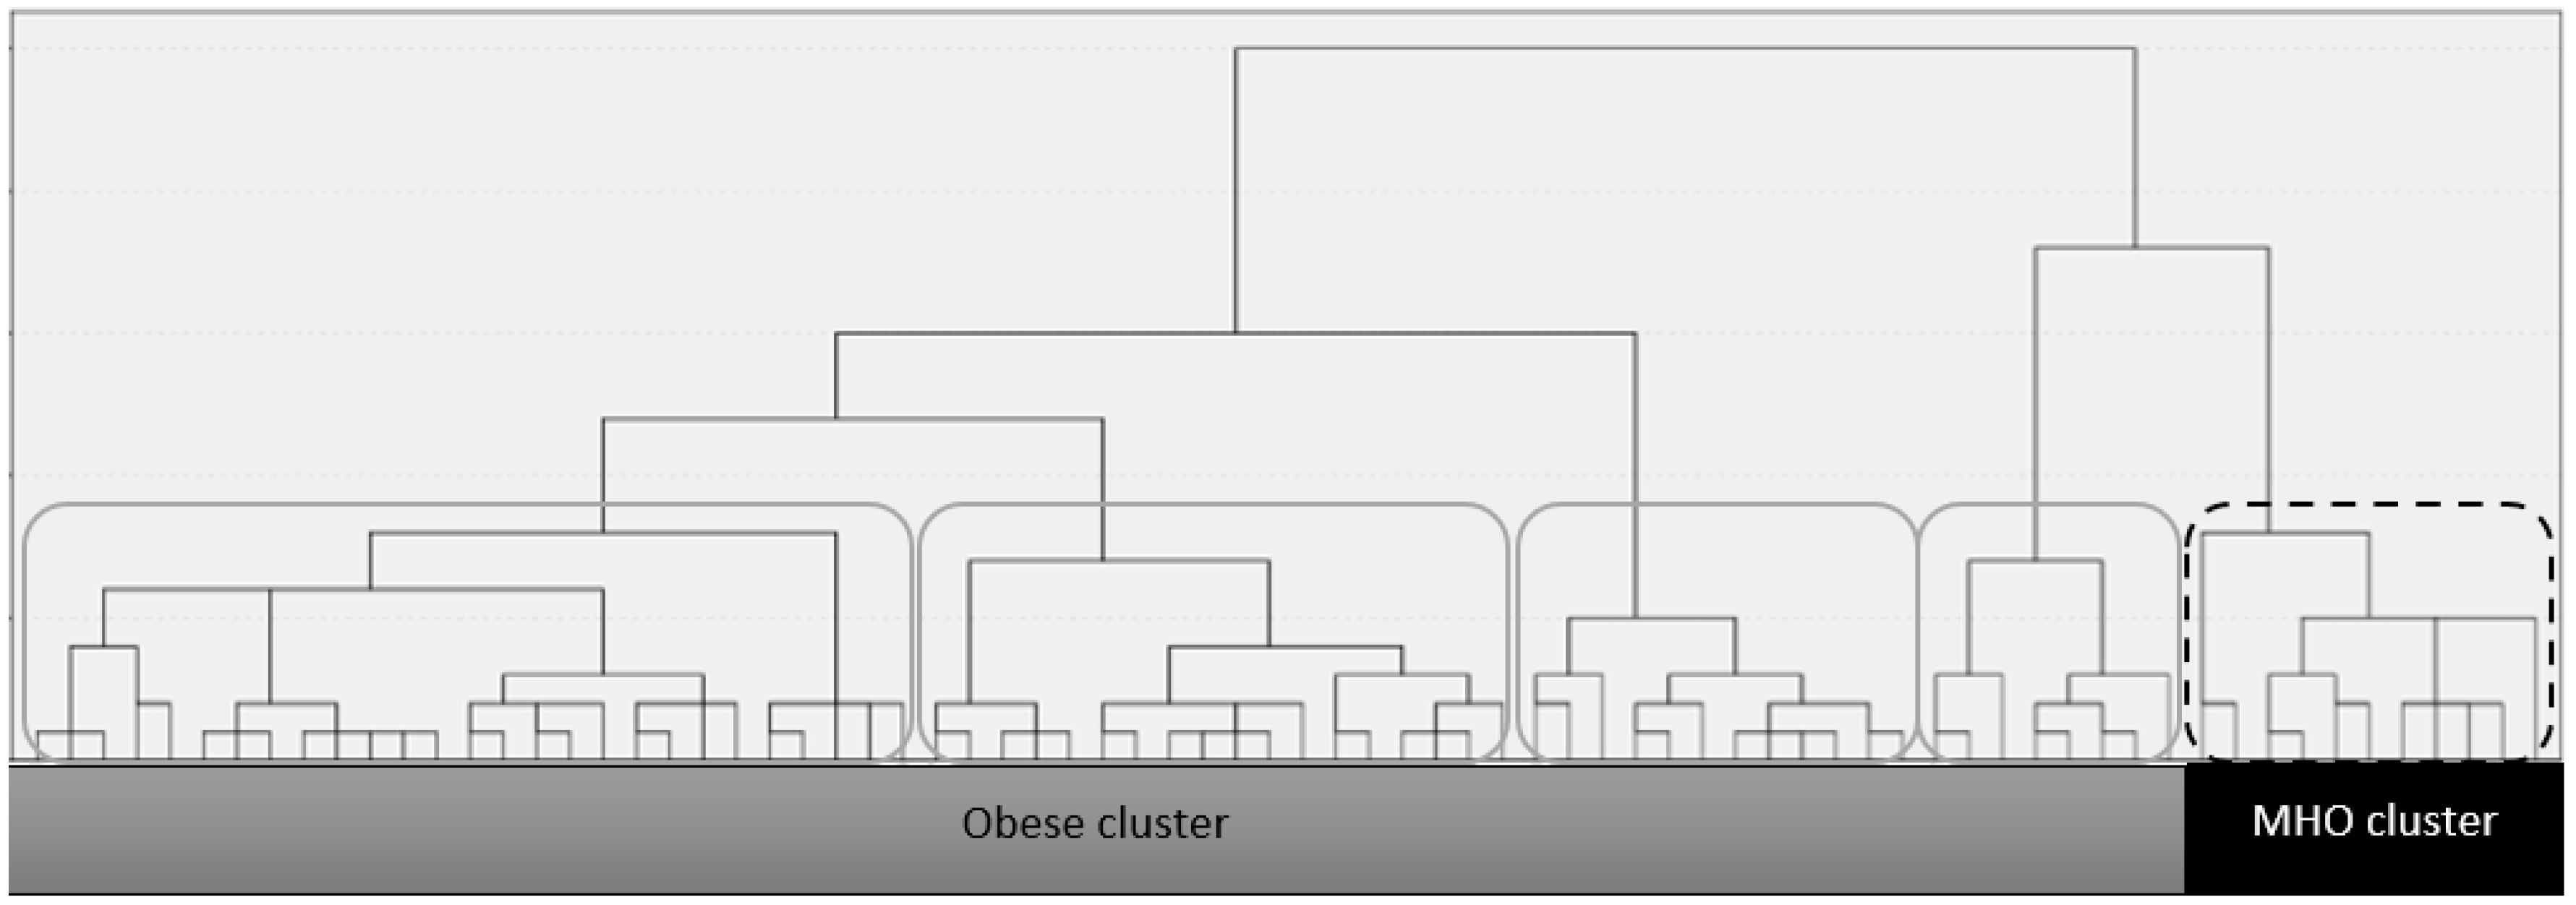
3.1. Clustering
3.2. Descriptive Characteristics of the Clusters
3.3. Red Blood Cell Membrane Fatty Acids Profile
3.4. Dietary Intake
3.5. Food Groups
4. Discussion
5. Conclusions
Author Contributions
Funding
Institutional Review Board Statement
Informed Consent Statement
Data Availability Statement
Acknowledgments
Conflicts of Interest
References
- WHO. Obesity and Overweight. Available online: https://www.who.int/en/news-room/fact-sheets/detail/obesity-and-overweight. (accessed on 1 April 2020).
- Juonala, M.; Magnussen, C.G.; Berenson, G.S.; Venn, A.; Burns, T.L.; Sabin, M.A.; Srinivasan, S.R.; Daniels, S.R.; Davis, P.H.; Chen, W.; et al. Childhood Adiposity, Adult Adiposity, and Cardiovascular Risk Factors. N. Engl. J. Med. 2011, 365, 1876–1885. [Google Scholar] [CrossRef] [PubMed]
- Blüher, S.; Schwarz, P. Metabolically healthy obesity from childhood to adulthood—Does weight status alone matter? Metabolism 2014, 63, 1084–1092. [Google Scholar] [CrossRef] [PubMed]
- Sims, E.A.H. Are there persons who are obese, but metabolically healthy? Metabolism 2001, 50, 1499–1504. [Google Scholar] [CrossRef] [PubMed]
- Roberson, L.L.; Aneni, E.C.; Maziak, W.; Agatston, A.; Feldman, T.; Rouseff, M.; Tran, T.; Blaha, M.J.; Santos, R.D.; Sposito, A.; et al. Beyond BMI: The “Metabolically healthy obese” phenotype & its association with clinical/subclinical cardiovascular disease and all-cause mortality—A systematic review. BMC Public Health 2014, 14, 1471–2458. [Google Scholar]
- Wildman, R.; Muntner, P.; Reynolds, K.; McGinn, A.; Rajpathak, S.; Wylie-Rosett, J.; Sowers, M. The Obese Without Cardiometabolic Risk Factor Clustering and the Normal Weight With Cardiometabolic Risk Factor Clustering: Prevalence and Correlates of 2 Phenotypes Among the US Population (NHANES 1999–2004). Arch. Intern. Med. 2008, 168, 1617–1624. [Google Scholar] [CrossRef] [PubMed]
- Pajunen, P.; Kotronen, A.; Korpi-Hyövälti, E.; Keinänen-Kiukaanniemi, S.; Oksa, H.; Niskanen, L.; Saaristo, T.; Saltevo, J.T.; Sundvall, J.; Vanhala, M.; et al. Metabolically healthy and unhealthy obesity phenotypes in the general population: The FIN-D2D Survey. BMC Public Health 2011, 11, 1471–2458. [Google Scholar] [CrossRef] [PubMed]
- Shea, J.L.; Randell, E.W.; Sun, G. The Prevalence of Metabolically Healthy Obese Subjects Defined by BMI and Dual-Energy X-Ray Absorptiometry. Obesity 2011, 19, 624–630. [Google Scholar] [CrossRef]
- Karelis, A.D.; St-Pierre, D.H.; Conus, F.; Rabasa-Lhoret, R.; Poehlman, E.T. Metabolic and body composition factors in subgroups of obesity: What do we know? J. Clin. Endocrinol. Metab. 2004, 89, 2569–2575. [Google Scholar] [CrossRef]
- Brochu, M. What Are the Physical Characteristics Associated with a Normal Metabolic Profile Despite a High Level of Obesity in Postmenopausal Women? J. Clin. Endocrinol. Metab. 2001, 86, 1020–1025. [Google Scholar] [CrossRef] [PubMed]
- Primeau, V.; Coderre, L.; Karelis, A.D.; Brochu, M.; Lavoie, M.E.; Messier, V.; Sladek, R.; Rabasa-Lhoret, R. Characterizing the profile of obese patients who are metabolically healthy. Int. J. Obes. 2011, 35, 971–981. [Google Scholar] [CrossRef]
- Karelis, A.D.; Rabasa-Lhoret, R. Obesity: Can inflammatory status define metabolic health? Nat. Rev. Endocrinol. 2013, 9, 694–695. [Google Scholar] [CrossRef] [PubMed]
- Hamer, M.; Stamatakis, E. Metabolically healthy obesity and risk of all-cause and cardiovascular disease mortality. J. Clin. Endocrinol. Metab. 2012, 97, 2482–2488. [Google Scholar] [CrossRef] [PubMed]
- Phillips, C.; Perry, I. Does Inflammation Determine Metabolic Health Status in Obese and Nonobese Adults? J. Clin. Endocrinol. Metab. 2013, 98, E1610–E1619. [Google Scholar] [CrossRef] [PubMed]
- Damanhoury, S.; Newton, A.S.; Rashid, M.; Hartling, L.; Byrne, J.L.S.; Ball, G.D.C. Defining metabolically healthy obesity in children: A scoping review. Obes. Rev. 2018, 19, 1476–1491. [Google Scholar] [CrossRef] [PubMed]
- Vukovic, R.; Dos Santos, T.J.; Ybarra, M.; Atar, M. Children with Metabolically Healthy Obesity: A Review. Front. Endocrinol. 2019, 10, 865. [Google Scholar] [CrossRef] [PubMed]
- Innis, S.M. Dietary lipids in early development: Relevance to obesity, immune and inflammatory disorders. Curr. Opin. Endocrinol. Diabetes Obes 2007, 14, 359–364. [Google Scholar] [CrossRef]
- Innes, J.K.; Calder, P.C. Omega-6 fatty acids and inflammation. Prostaglandins Leukot. Essent. Fat. Acids 2018, 132, 41–48. [Google Scholar] [CrossRef]
- Ferreri, C.; Chatgilialoglu, C. Role of fatty acid-based functional lipidomics in the development of molecular diagnostic tools. Expert Rev. Mol. Diagn. 2012, 12, 767–780. [Google Scholar] [CrossRef]
- Genio, G. Morbid Obesity is Associated to Altered Fatty Acid Profile of Erythrocyte Membranes. J. Diabetes Metab. 2015, 6. [Google Scholar] [CrossRef]
- Ghezzo, A.; Visconti, P.; Abruzzo, P.M.; Bolotta, A.; Ferreri, C.; Gobbi, G.; Malisardi, G.; Manfredini, S.; Marini, M.; Nanetti, L.; et al. Oxidative Stress and Erythrocyte Membrane Alterations in Children with Autism: Correlation with Clinical Features. PLoS ONE 2013, 8, e66418. [Google Scholar] [CrossRef]
- Ferreri, C.; Chatgilialoglu, C. Membrane Lipidomics for Personalized Health; John Wiley & Sons: Chichester, UK, 2015. [Google Scholar]
- Wang, X.; Lin, H.; Gu, Y. Multiple roles of dihomo-γ-linolenic acid against proliferation diseases. Lipids Health Dis. 2012, 11, 25. [Google Scholar] [CrossRef] [PubMed]
- Simopoulos, A.P. An Increase in the Omega-6/Omega-3 Fatty Acid Ratio Increases the Risk for Obesity. Nutrients 2016, 8, 128. [Google Scholar] [CrossRef] [PubMed]
- Jauregibeitia, I.; Portune, K.; Rica, I.; Tueros, I.; Velasco, O.; Grau, G.; Trebolazabala, N.; Castaño, L.; Larocca, A.V.; Ferreri, C.; et al. Fatty Acid Profile of Mature Red Blood Cell Membranes and Dietary Intake as a New Approach to Characterize Children with Overweight and Obesity. Nutrients 2020, 12, 3446. [Google Scholar] [CrossRef] [PubMed]
- Giardina, S.; Sala-Vila, A.; Hernandez-Alonso, P.; Calvo, C.; Salas-Salvado, J.; Bullo, M. Carbohydrate quality and quantity affects the composition of the red blood cell fatty acid membrane in overweight and obese individuals. Clin. Nutr. 2018, 37, 481–487. [Google Scholar] [CrossRef]
- Riezzo, G.; Ferreri, C.; Orlando, A.; Martulli, M.; D’Attoma, B.; Russo, F. Lipidomic analysis of fatty acids in erythrocytes of coeliac patients before and after a gluten-free diet intervention: A comparison with healthy subjects. Br. J. Nutr. 2014, 112, 1787–1796. [Google Scholar] [CrossRef]
- González, E.S.; Lezcano, A.C.; García, J.M.F.; Longás, A.F.; López de Lara, D.; López-Siguero, J.P. Estudios españoles de crecimiento: Situación actual, utilidad y recomendaciones de uso. An. Pediatría 2011, 74, 193.e1–193.e16. [Google Scholar] [CrossRef]
- Carrascosa, A.; Fernández, J.M.; Fernández, C.; Ferrández, A.; López-Siguero, J.P.; Sánchez, E.; Sobradillo, B.; Yeste, D. Estudios españoles de crecimiento 2008. Nuevos patrones antropométricos. Endocrinol. Y Nutr. 2008, 55, 484–506. [Google Scholar] [CrossRef]
- Madrigal, C.; Soto-Mendez, M.J.; Hernandez-Ruiz, A.; Ruiz, E.; Valero, T.; Avila, J.M.; Lara-Villoslada, F.; Leis, R.; Victoria, E.M.; Moreno, J.M.; et al. Dietary and Lifestyle Patterns in the Spanish Pediatric Population (One to <10 Years Old): Design, Protocol, and Methodology of the EsNuPI Study. Nutrients 2019, 11, 3050. [Google Scholar] [CrossRef] [PubMed]
- Fernandez-Ballart, J.D.; Pinol, J.L.; Zazpe, I.; Corella, D.; Carrasco, P.; Toledo, E.; Perez-Bauer, M.; Martinez-Gonzalez, M.A.; Salas-Salvado, J.; Martin-Moreno, J.M. Relative validity of a semi-quantitative food-frequency questionnaire in an elderly Mediterranean population of Spain. Br. J. Nutr. 2010, 103, 1808–1816. [Google Scholar] [CrossRef] [PubMed]
- Pérez-Farinós, N.; Villar-Villalba, C.; López Sobaler, A.M.; Dal Re Saavedra, M.; Aparicio, A.; Santos Sanz, S.; Robledo de Dios, T.; Castrodeza-Sanz, J.J.; Ortega Anta, R.M. The relationship between hours of sleep, screen time and frequency of food and drink consumption in Spain in the 2011 and 2013 ALADINO: A cross-sectional study. BMC Public Health 2017, 17, 33. [Google Scholar] [CrossRef]
- Stefan, L.; Prosoli, R.; Juranko, D.; Cule, M.; Milinovic, I.; Novak, D.; Sporis, G. The Reliability of the Mediterranean Diet Quality Index (KIDMED) Questionnaire. Nutrients 2017, 9, 419. [Google Scholar] [CrossRef] [PubMed]
- Serra-Majem, L.; Ribas, L.; Ngo, J.; Ortega, R.M.; Garcia, A.; Perez-Rodrigo, C.; Aranceta, J. Food, youth and the Mediterranean diet in Spain. Development of KIDMED, Mediterranean Diet Quality Index in children and adolescents. Public Health Nutr. 2004, 7, 931–935. [Google Scholar] [CrossRef]
- Sansone, A.; Tolika, E.; Louka, M.; Sunda, V.; Deplano, S.; Melchiorre, M.; Anagnostopoulos, D.; Chatgilialoglu, C.; Formisano, C.; Di Micco, R.; et al. Hexadecenoic Fatty Acid Isomers in Human Blood Lipids and Their Relevance for the Interpretation of Lipidomic Profiles. PLoS ONE 2016, 11, e0152378. [Google Scholar] [CrossRef] [PubMed]
- Giacometti, G.; Ferreri, C.; Sansone, A.; Chatgilialoglu, C.; Marzetti, C.; Spyratou, E.; Georgakilas, A.G.; Marini, M.; Abruzzo, P.M.; Bolotta, A.; et al. High predictive values of RBC membrane-based diagnostics by biophotonics in an integrated approach for Autism Spectrum Disorders. Sci. Rep. 2017, 7, 9854. [Google Scholar] [CrossRef]
- Amezaga, J.; Arranz, S.; Urruticoechea, A.; Ugartemendia, G.; Larraioz, A.; Louka, M.; Uriarte, M.; Ferreri, C.; Tueros, I. Altered Red Blood Cell Membrane Fatty Acid Profile in Cancer Patients. Nutrients 2018, 10, 1853. [Google Scholar] [CrossRef] [PubMed]
- Van Der Vegt, S.G.L.; Ruben, A.M.T.; Werre, J.M.; Palsma, D.M.H.; Verhoef, C.W.; de Gier, J.; Staal, G.E.J. Counterflow centrifugation of red cell populations: A cell age related separation technique. Br. J. Haematol. 1985, 61, 393–403. [Google Scholar] [CrossRef] [PubMed]
- Breil, C.; Abert Vian, M.; Zemb, T.; Kunz, W.; Chemat, F. "Bligh and Dyer" and Folch Methods for Solid-Liquid-Liquid Extraction of Lipids from Microorganisms. Comprehension of Solvatation Mechanisms and towards Substitution with Alternative Solvents. Int. J. Mol. Sci. 2017, 18, 708. [Google Scholar] [CrossRef] [PubMed]
- Ferreri, C.; Mennella, M.R.F.; Formisano, C.; Landi, L.; Chatgilialoglu, C. Arachidonate geometrical isomers generated by thiyl radicals: The relationship with trans lipids detected in biological samples. Free Radic. Biol. Med. 2002, 33, 1516–1526. [Google Scholar] [CrossRef]
- Jacobs, S.; Jäger, S.; Jansen, E.; Peter, A.; Stefan, N.; Boeing, H.; Schulze, M.B.; Kröger, J. Associations of Erythrocyte Fatty Acids in the De Novo Lipogenesis Pathway with Proxies of Liver Fat Accumulation in the EPIC-Potsdam Study. PLoS ONE 2015, 10, e0127368. [Google Scholar] [CrossRef] [PubMed]
- Plaza-Díaz, J.; Molina-Montes, E.; Soto-Méndez, M.J.; Madrigal, C.; Hernández-Ruiz, Á.; Valero, T.; Villoslada, F.L.; Leis, R.; De Victoria, E.M.; Moreno, J.M.; et al. Clustering of Dietary Patterns and Lifestyles Among Spanish Children in the EsNuPI Study (†). Nutrients 2020, 12, 2536. [Google Scholar] [CrossRef]
- Köhn, H.-F.; Hubert, L.J. Hierarchical Cluster Analysis; American Cancer Society Center: Atlanta, GA, USA, 2015; pp. 1–13. [Google Scholar]
- Bobbioni-Harsch, E.; Pataky, Z.; Makoundou, V.; Laville, M.; Disse, E.; Anderwald, C.; Konrad, T.; Golay, A.; Investigators, O.B.o.t.R. From Metabolic Normality to Cardiometabolic Risk Factors in Subjects with Obesity. Obesity 2012, 20, 2063–2069. [Google Scholar] [CrossRef]
- Burns, J.L.; Nakamura, M.T.; Ma, D.W.L. Differentiating the biological effects of linoleic acid from arachidonic acid in health and disease. Prostaglandins Leukot. Essent. Fat. Acids 2018, 135, 1–4. [Google Scholar] [CrossRef] [PubMed]
- Sonnweber, T.; Pizzini, A.; Nairz, M.; Weiss, G.; Tancevski, I. Arachidonic Acid Metabolites in Cardiovascular and Metabolic Diseases. Int. J. Mol. Sci. 2018, 19, 3285. [Google Scholar] [CrossRef]
- Martinez-Fernandez, L.; Laiglesia, L.M.; Huerta, A.E.; Martinez, J.A.; Moreno-Aliaga, M.J. Omega-3 fatty acids and adipose tissue function in obesity and metabolic syndrome. Prostaglandins Other Lipid Mediat. 2015, 121, 24–41. [Google Scholar] [CrossRef] [PubMed]
- Oh, D.Y.; Talukdar, S.; Bae, E.J.; Imamura, T.; Morinaga, H.; Fan, W.; Li, P.; Lu, W.J.; Watkins, S.M.; Olefsky, J.M. GPR120 Is an Omega-3 Fatty Acid Receptor Mediating Potent Anti-inflammatory and Insulin-Sensitizing Effects. Cell 2010, 142, 687–698. [Google Scholar] [CrossRef] [PubMed]
- Kim, H.-K.; Della-Fera, M.; Lin, J.; Baile, C.A. Docosahexaenoic Acid Inhibits Adipocyte Differentiation and Induces Apoptosis in 3T3-L1 Preadipocytes. J. Nutr. 2006, 136, 2965–2969. [Google Scholar] [CrossRef] [PubMed]
- De Caterina, R. n–3 Fatty Acids in Cardiovascular Disease. N. Engl. J. Med. 2011, 364, 2439–2450. [Google Scholar] [CrossRef]
- Saravia, L.; Miguel-Berges, M.L.; Iglesia, I.; Nascimento-Ferreira, M.V.; Perdomo, G.; Bove, I.; Slater, B.; Moreno, L.A. Relative validity of FFQ to assess food items, energy, macronutrient and micronutrient intake in children and adolescents: A systematic review with meta-analysis. Br. J. Nutr. 2020, 125, 792–818. [Google Scholar] [CrossRef]
- Bertoia, M.L.; Mukamal, K.J.; Cahill, L.E.; Hou, T.; Ludwig, D.S.; Mozaffarian, D.; Willett, W.C.; Hu, F.B.; Rimm, E.B. Changes in Intake of Fruits and Vegetables and Weight Change in United States Men and Women Followed for Up to 24 Years: Analysis from Three Prospective Cohort Studies. PLoS Med. 2015, 12, e1001878. [Google Scholar] [CrossRef] [PubMed]
- Silbernagel, G.; Kovarova, M.; Cegan, A.; Machann, J.; Schick, F.; Lehmann, R.; Häring, H.-U.; Stefan, N.; Schleicher, E.; Fritsche, A.; et al. High Hepatic SCD1 Activity Is Associated with Low Liver Fat Content in Healthy Subjects under a Lipogenic Diet. J. Clin. Endocrinol. Metab. 2012, 97, E2288–E2292. [Google Scholar] [CrossRef] [PubMed]
- Tobias, D.K.; Chen, M.; Manson, J.E.; Ludwig, D.S.; Willett, W.; Hu, F.B. Effect of low-fat diet interventions versus other diet interventions on long-term weight change in adults: A systematic review and meta-analysis. Lancet Diabetes Endocrinol. 2015, 3, 968–979. [Google Scholar] [CrossRef]


| Obese Clusters (G1) n = 65 | MHO Cluster (G2) n = 11 | Normoweight (G3) n = 118 | Kruskal–Wallis H Test (p) | Post Hoc Pairwise Comparison (p) | ||||||
|---|---|---|---|---|---|---|---|---|---|---|
| Mean | SD | Mean | SD | Mean | SD | G1:G2 | G1:G3 | G2:G3 | ||
| Age | 11.0 | 0.3 | 10.8 | 0.7 | 10.9 | 0.3 | 0.94 | |||
| Sex (% girls) | 68 | 72.7 | 46.5 | 0.01 | 1.00 | 0.01 | 0.26 | |||
| BMI | 28.7 | 0.4 | 29.0 | 1.23 | 18.4 | 0.3 | <0.001 | 1.0 | <0.001 | <0.001 |
| Obese Cluster (G1) n = 65 | MHO Cluster (G2) n = 11 | Normoweight (G3) n = 118 | ANCOVA | Post Hoc Pairwise Comparison (p-Value) | ||||||
|---|---|---|---|---|---|---|---|---|---|---|
| Fatty acids (%) | Mean | SE | Mean | SE | Mean | SE | p | G1:G2 | G1:G3 | G2:G3 |
| 16:0 | 22.38 | 0.13 | 22.62 | 0.32 | 22.50 | 0.09 | 0.64 | 1.00 | 1.00 | 1.00 |
| 18:0 | 18.35 | 0.13 | 17.59 | 0.32 | 17.72 | 0.10 | <0.001 | 0.08 | <0.001 | 1.00 |
| Total SFA | 40.72 | 0.12 | 39.84 | 0.32 | 40.13 | 0.09 | <0.001 | 0.03 | <0.001 | 1.00 |
| 16:1/9c | 0.42 | 0.02 | 0.50 | 0.04 | 0.40 | 0.01 | 0.07 | 0.28 | 0.83 | 0.76 |
| 18:1/9c | 16.34 | 0.15 | 17.34 | 0.37 | 17.45 | 0.11 | <0.001 | 0.04 | <0.001 | 1.00 |
| 18:1/11c b | 1.13 | 0.03 | 1.32 | 0.07 | 1.19 | 0.02 | 0.02 | - | - | - |
| Total MUFA | 17.92 | 0.16 | 19.15 | 0.39 | 19.06 | 0.12 | <0.001 | 0.01 | <0.001 | 1.00 |
| 18:2 | 13.90 | 0.17 | 13.91 | 0.41 | 14.24 | 0.12 | 0.26 | 1.00 | 0.33 | 1.00 |
| 20:3 | 2.32 | 0.05 | 2.05 | 0.11 | 2.02 | 0.03 | <0.001 | 0.08 | <0.001 | 1.00 |
| 20:4 | 20.02 | 0.17 | 18.16 | 0.43 | 18.62 | 0.13 | <0.001 | <0.001 | <0.001 | 0.93 |
| Total ω6 | 36.23 | 0.20 | 34.12 | 0.49 | 34.94 | 0.15 | <0.001 | <0.001 | <0.001 | 0.33 |
| 20:5 | 0.46 | 0.03 | 0.77 | 0.07 | 0.61 | 0.02 | <0.001 | <0.001 | <0.001 | 0.09 |
| 22:6 | 4.52 | 0.13 | 5.57 | 0.33 | 5.01 | 0.10 | 0.001 | 0.01 | 0.01 | 0.33 |
| Total ω3 | 4.92 | 0.15 | 6.33 | 0.36 | 5.63 | 0.11 | <0.001 | <0.001 | <0.001 | 0.20 |
| Total PUFA | 41.20 | 0.18 | 40.45 | 0.46 | 40.57 | 0.14 | 0.02 | 0.38 | 0.03 | 1.00 |
| 18:1t | 0.09 | 0.01 | 0.06 | 0.02 | 0.08 | 0.01 | 0.52 | 0.79 | 1.00 | 1.00 |
| 20:4t | 0.06 | 0.01 | 0.13 | 0.02 | 0.07 | 0.01 | <0.01 | <0.001 | 0.72 | <0.001 |
| Total TRANS | 0.14 | 0.01 | 0.19 | 0.03 | 0.16 | 0.01 | 0.21 | 0.27 | 1.00 | 0.61 |
| Indexes | ||||||||||
| ω6/ω3 | 7.65 | 0.21 | 5.58 | 0.51 | 6.47 | 0.15 | <0.001 | <0.001 | <0.001 | 0.29 |
| SFA/MUFA | 2.28 | 0.02 | 2.11 | 0.06 | 2.13 | 0.02 | <0.001 | 0.01 | <0.001 | 1.00 |
| Δ6D+ELO | 6.09 | 0.16 | 6.91 | 0.38 | 7.20 | 0.11 | <0.001 | 0.14 | <0.001 | 1.00 |
| Δ5D 20:4 | 8.87 | 0.24 | 9.06 | 0.59 | 9.43 | 0.18 | 0.18 | 1.00 | 0.20 | 1.00 |
| Δ9D 16:0 | 58.21 | 2.49 | 51.42 | 6.17 | 59.11 | 1.86 | 0.50 | 0.91 | 1.00 | 0.72 |
| Δ9D 18:0 | 1.13 | 0.01 | 1.01 | 0.03 | 1.02 | 0.01 | <0.001 | <0.001 | <0.001 | 1.00 |
| PUFA balance | 12.02 | 0.35 | 15.72 | 0.86 | 13.91 | 0.26 | <0.001 | <0.001 | <0.001 | 0.14 |
| Peroxidation Index | 137.00 | 1.05 | 140.18 | 2.55 | 137.12 | 0.76 | 0.74 | 0.74 | 1.00 | 0.77 |
| Unsaturation Index | 162.17 | 0.76 | 163.00 | 1.88 | 161.33 | 0.56 | 1.0 | 1.00 | 1.00 | 1.00 |
| DNL Index | 1.63 | 0.02 | 1.60 | 0.05 | 1.59 | 0.02 | 1.0 | 1.00 | 0.36 | 1.00 |
| Obese Clusters (G1) n = 65 | MHO Cluster (G2) n = 11 | Normoweight (G3) n = 118 | Kruskal–Wallis H Test (p) | Post Hoc Pairwise Comparison (p) | ||||||
|---|---|---|---|---|---|---|---|---|---|---|
| Macronutrients | ||||||||||
| Mean | SD | Mean | SD | Mean | SD | G1:G2 | G1:G3 | G2:G3 | ||
| Calories (Kcal/day) | 2002.34 | 583.09 | 2320.70 | 371.52 | 2479.31 | 1811.90 | 0.09 | |||
| Proteins (%E) | 16.54 | 2.16 | 16.34 | 1.89 | 16.37 | 2.68 | 0.96 | |||
| Carbohydrates (%E) | 46.96 | 5.25 | 45.73 | 5.84 | 42.64 | 7.50 | 0.64 * | |||
| Simple sugars (%E) | 21.74 | 5.25 | 21.72 | 2.28 | 20.38 | 5.84 | 0.90 * | |||
| Lipids (%E) | 33.34 | 6.25 | 35.05 | 6.83 | 37.28 | 7.33 | 0.64 | |||
| Individual FA (% E) | ||||||||||
| C14:0 | 0.95 | 0.43 | 1.17 | 0.73 | 0.91 | 0.39 | 0.31 * | |||
| C16:0 | 6.07 | 1.21 | 6.58 | 1.74 | 5.93 | 1.18 | 0.17 | |||
| C18:0 | 2.32 | 0.56 | 2.49 | 0.83 | 2.33 | 0.58 | 0.62 * | |||
| Total SFA | 10.61 | 2.65 | 11.84 | 4.32 | 10.98 | 2.45 | 0.09 | |||
| C16:1 | 0.52 | 0.14 | 0.56 | 0.18 | 0.52 | 0.12 | 0.65 | |||
| C18:1 | 13.91 | 3.63 | 14.63 | 2.95 | 16.27 | 4.17 | 0.55 * | |||
| Total MUFA | 14.86 | 3.72 | 15.66 | 3.09 | 17.22 | 4.22 | 0.50 | |||
| C18:2 | 4.19 | 1.78 | 3.63 | 1.30 | 5.00 | 2.44 | 0.33 | |||
| C20:4 | 0.53 | 0.12 | 0.60 | 0.14 | 0.65 | 0.27 | 0.82 * | |||
| Total ω-6 | 4.23 | 1.78 | 3.68 | 1.33 | 5.07 | 2.46 | 0.37 | |||
| C18:3 | 0.04 | 0.01 | 0.04 | 0.01 | 0.06 | 0.03 | 0.25 | |||
| C20:5 (EPA) | 0.08 | 0.06 | 0.07 | 0.05 | 0.07 | 0.05 | 0.97 | |||
| C22:5 (DPA) | 0.02 | 0.01 | 0.02 | 0.01 | 0.02 | 0.01 | 0.68 | |||
| 22:6 (DHA) | 0.15 | 0.10 | 0.14 | 0.08 | 0.15 | 0.09 | 0.96 | |||
| Total ω-3 | 0.78 | 0.22 | 0.82 | 0.24 | 0.90 | 0.33 | 0.46 | |||
| Total PUFA | 5.14 | 1.84 | 4.67 | 1.48 | 6.11 | 2.67 | 0.01 | 1.00 | 0.03 | 0.12 |
| ω6/ω3 | 5.70 | 2.34 | 4.57 | 1.19 | 6.00 | 3.20 | 0.05 | |||
| Obese Clusters (G1) n = 65 | MHO Cluster (G2) n = 11 | Normoweight (G3) n = 118 | Kruskal–Wallis H Test (p) | Post Hoc Pairwise Comparison (p *) | ||||||
|---|---|---|---|---|---|---|---|---|---|---|
| Food Groups (g/day) | Mean | SD | Mean | SD | Mean | SD | G1:G2 | G1:G3 | G2:G3 | |
| Fruits | 434.7 | 39.5 | 611.3 | 56.4 | 445.9 | 23.8 | 0.01 | 0.01 | 0.77 | 0.02 |
| Vegetables | 166.4 | 16.3 | 180.0 | 27.6 | 192.1 | 13.4 | 0.3 | |||
| Cereals | 142.9 | 7.0 | 173.8 | 20.8 | 172.9 | 8.5 | 0.04 | 0.45 | 0.04 | 1.0 |
| Legumes | 79.0 | 3.7 | 75.0 | 8.3 | 81.2 | 3.6 | 0.86 | |||
| Olive oil | 19.5 | 1.6 | 27.3 | 3.5 | 21.1 | 1.1 | 0.06 | |||
| Dairy products | 340.0 | 28.7 | 271.9 | 37.4 | 360.3 | 15.8 | 0.12 | |||
| Eggs | 20.9 | 1.4 | 28.5 | 4.1 | 24.4 | 1.9 | 0.28 | |||
| Red meat | 30.2 | 2.5 | 36.7 | 6.8 | 27.7 | 1.8 | 0.34 | |||
| White meat | 40.3 | 2.3 | 47.4 | 2.6 | 41.2 | 2.6 | 0.25 | |||
| Dried fruits and nuts | 3.8 | 0.9 | 4.7 | 2.6 | 5.3 | 0.7 | 0.24 | |||
| Lean fish | 29.0 | 2.5 | 41.8 | 7.8 | 31.6 | 1.8 | 0.16 | |||
| Oily fish and shellfish | 28.4 | 2.9 | 32.5 | 6.6 | 26.1 | 2.1 | 0.27 | |||
| Sugary drinks | 46.0 | 10.3 | 43.8 | 16.2 | 43.6 | 12.0 | 0.65 | |||
| Juices | 123.8 | 15.0 | 148.5 | 28.4 | 134.9 | 15.2 | 0.68 | |||
| KIDMED | 7.11 | 2.23 | 7.60 | 1.90 | 7.95 | 1.87 | 0.02 | 1.0 | 0.02 | 1.0 |
Publisher’s Note: MDPI stays neutral with regard to jurisdictional claims in published maps and institutional affiliations. |
© 2021 by the authors. Licensee MDPI, Basel, Switzerland. This article is an open access article distributed under the terms and conditions of the Creative Commons Attribution (CC BY) license (https://creativecommons.org/licenses/by/4.0/).
Share and Cite
Jauregibeitia, I.; Portune, K.; Rica, I.; Tueros, I.; Velasco, O.; Grau, G.; Castaño, L.; Di Nolfo, F.; Ferreri, C.; Arranz, S. Potential of Erythrocyte Membrane Lipid Profile as a Novel Inflammatory Biomarker to Distinguish Metabolically Healthy Obesity in Children. J. Pers. Med. 2021, 11, 337. https://doi.org/10.3390/jpm11050337
Jauregibeitia I, Portune K, Rica I, Tueros I, Velasco O, Grau G, Castaño L, Di Nolfo F, Ferreri C, Arranz S. Potential of Erythrocyte Membrane Lipid Profile as a Novel Inflammatory Biomarker to Distinguish Metabolically Healthy Obesity in Children. Journal of Personalized Medicine. 2021; 11(5):337. https://doi.org/10.3390/jpm11050337
Chicago/Turabian StyleJauregibeitia, Iker, Kevin Portune, Itxaso Rica, Itziar Tueros, Olaia Velasco, Gema Grau, Luis Castaño, Federica Di Nolfo, Carla Ferreri, and Sara Arranz. 2021. "Potential of Erythrocyte Membrane Lipid Profile as a Novel Inflammatory Biomarker to Distinguish Metabolically Healthy Obesity in Children" Journal of Personalized Medicine 11, no. 5: 337. https://doi.org/10.3390/jpm11050337
APA StyleJauregibeitia, I., Portune, K., Rica, I., Tueros, I., Velasco, O., Grau, G., Castaño, L., Di Nolfo, F., Ferreri, C., & Arranz, S. (2021). Potential of Erythrocyte Membrane Lipid Profile as a Novel Inflammatory Biomarker to Distinguish Metabolically Healthy Obesity in Children. Journal of Personalized Medicine, 11(5), 337. https://doi.org/10.3390/jpm11050337