Abstract
Reduced graphene oxide (r-GO) has physical–chemical properties like graphene and therefore it can be used for most graphene-based technological applications. r-GO is produced by chemical or thermal reduction of graphene oxide (GO). GO is a highly water-soluble organic compound that can be easily processed in the form of aqueous/alcoholic ink to produce thick self-standing films (i.e., GO paper) or thin coatings supported on a variety of substrates (e.g., polymers, cellulose, glass, silicon, etc.). The best GO reduction technique depends on the substrate chemical/thermal stability, and in the case of thermally unstable substrates (e.g., cellulose), the chemical approach is mandatory. However, traditional reductants, like hydrazine and phenyl-hydrazine, are highly active and therefore detrimental for the substrate. Among the mild reducing agents, L-ascorbic acid (L-aa), a green chemical reductant, has been widely investigated for GO reduction in aqueous solutions. Here, L-aa has been used to convert a GO gel-phase to r-GO by (i) swelling the GO phase with hot water, in order to allow L-aa permeation inside its lamellar structures by diffusion; and (ii) periodically restoring the reductant on the GO layer surface. According to the morphological–structural characterization (SEM, FT-IR, etc.), the proposed approach allowed GO conversion to r-GO, preserving a thin GO interfacial layer essential for a good adhesion.
1. Introduction
Graphene oxide (GO) is a flexible lamellar material with a wide range of functional groups such as epoxy, hydroxyl (-OH), and carboxyl (-COOH) on both basal planes and edges [1,2]. The existence of oxygen functional groups and aromatic Sp2 domains allow improvement of the distribution of GO sheets, generating interfacial bonding with hanging groups of natural polymer matrices, thus taking advantage of the outstanding properties of graphene materials. Much work has recently been targeted at mechanically or electrically enhanced cellulose composites using GO nanosheets or reduced GO (r-GO) because the hydroxyl groups present on the fiber surface may ensure an adequate interfacial adhesion [3,4,5].
Cellulose offers the advantages of being a renewable, biodegradable, biocompatible, and almost inexhaustible source of raw materials that can replace petrochemical compounds in many cases [6,7]. In addition, paper substrate is interesting because it leads to devices that are light in weight, portable, flexible, and foldable, which are strongly needed properties in fields like microfluidics, sensors, etc. [8,9,10,11,12,13].
Inspired by the growing concerns regarding environmental pollution, a novel experimental procedure for quantitative reduction of GO films on paper by a green and low-cost chemical reductant (L-ascorbic acid, L-aa) was proposed in our previous work [14]. L-aa is much more environmentally friendly then typical GO reductants like hydrazine and hydrazine hydrate [15,16,17].
In our process, the solid GO deposit on paper was reduced by L-aa, taking advantage of a diffusion-based mass transport mechanism, that is possible for the L-aa molecules, in a closed water-refluxing environment. This ecofriendly technique has been shown to be very adequate to produce flexible nanocomposite films of r-GO on paper thanks to a uniform and highly reduced GO layer preserving the paper substrate. The precursor materials and the obtained nanocomposites were characterized by thermogravimetric analysis (TGA) and Fourier transform infrared spectroscopy in attenuated total reflectance mode (FT-IR/ATR), to provide structural information and to establish the reduction degree. In addition, the morphologies of the sample surfaces, and the interface between the GO and paper, were analyzed by scanning electron microscopy (SEM) before and after the reduction process. All experimental results confirm that the developed procedure allows the reduction of the GO deposit and preserves the paper substrate and the presence of strong interactions between the GO and cellulose that persist after the reduction process.
2. Materials and Methods
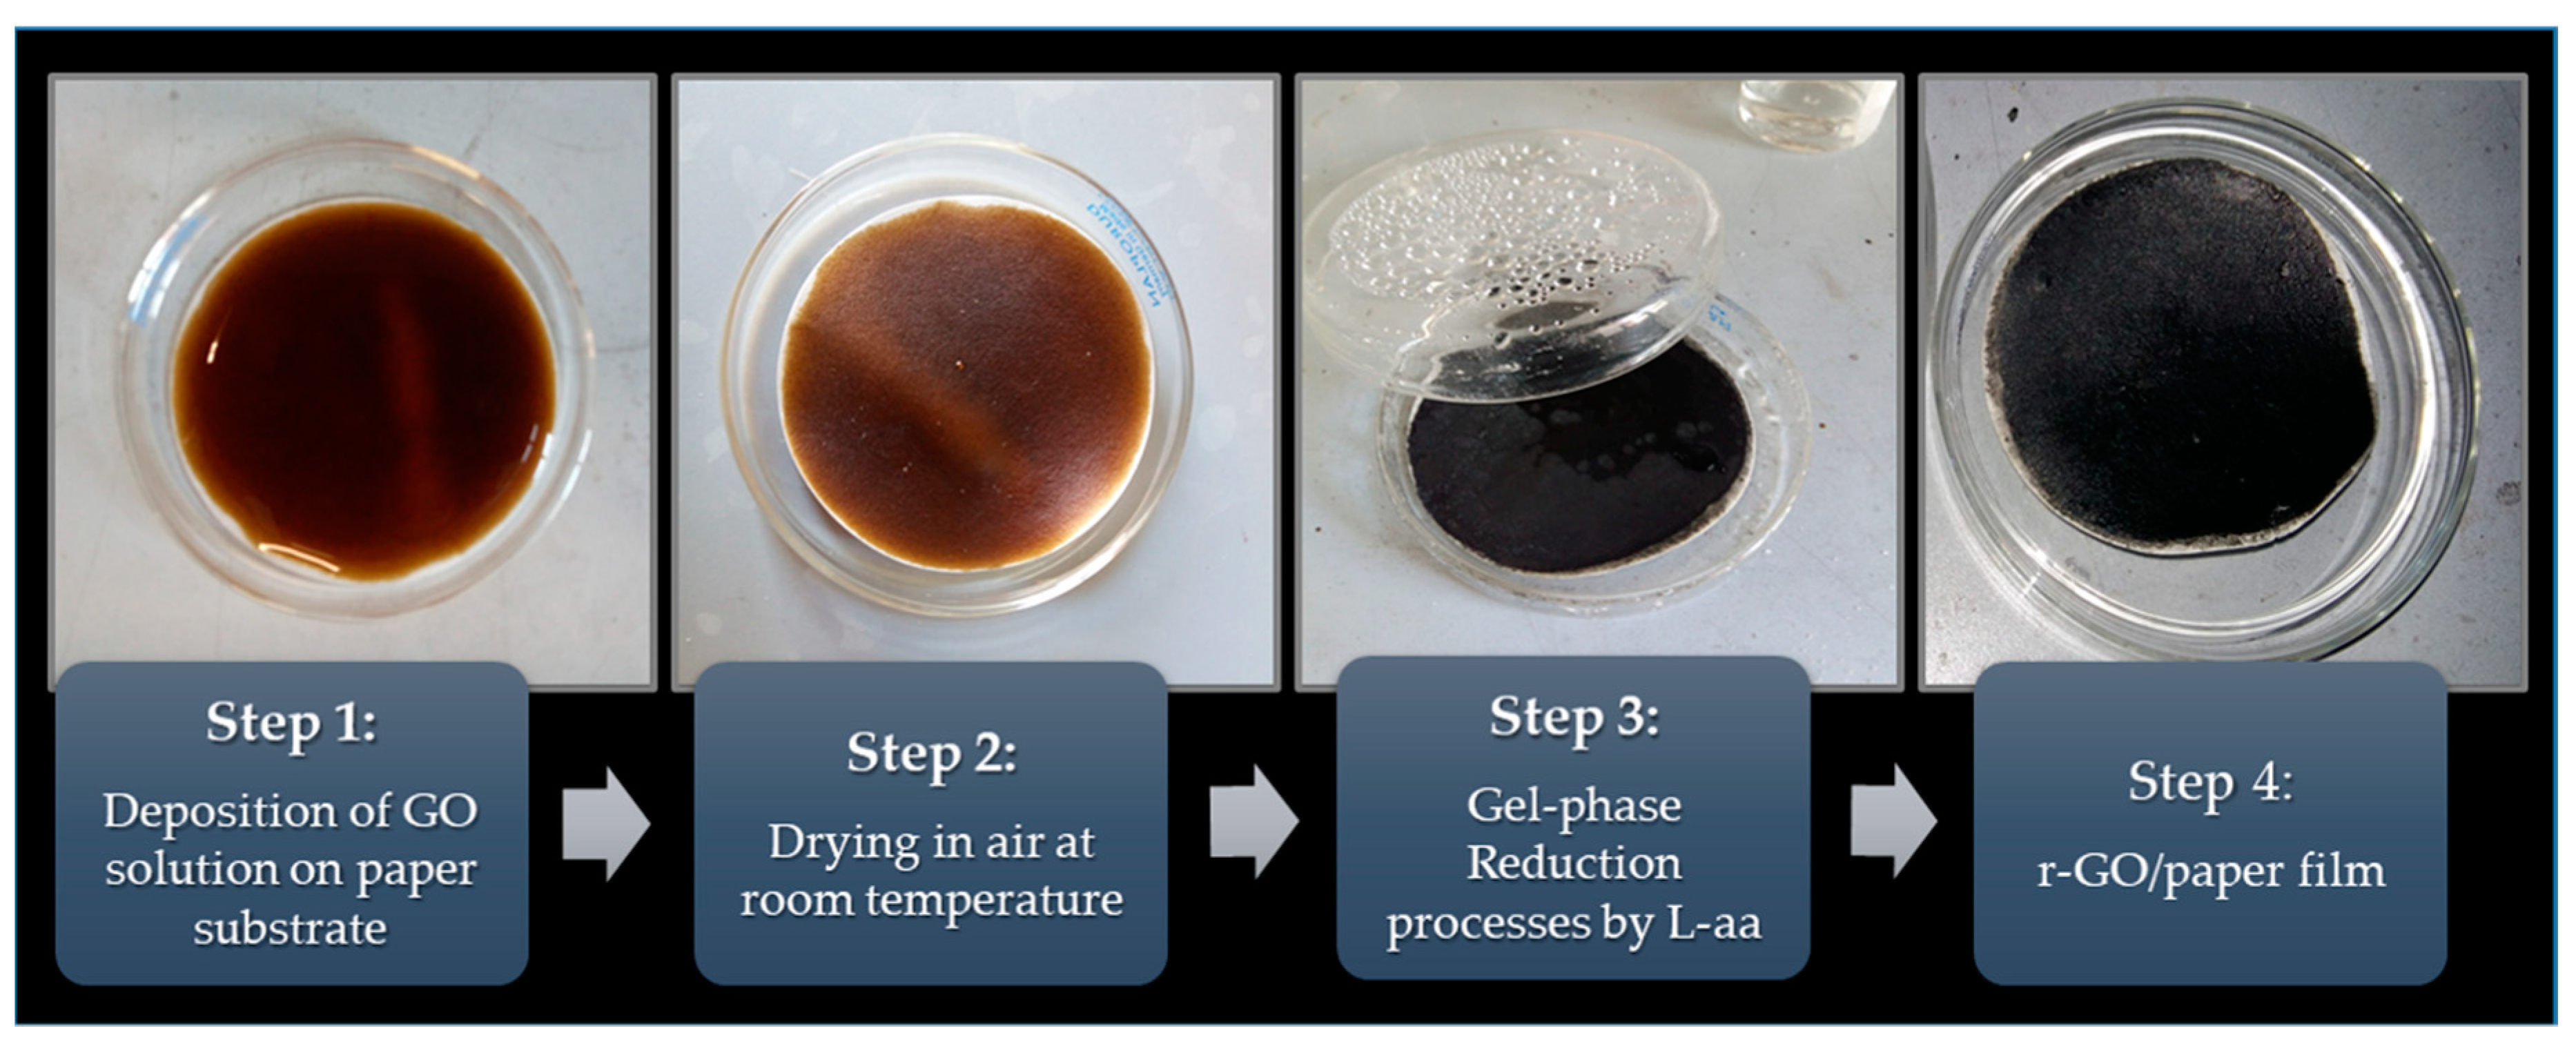
Briefly, our procedure involves the synthesis of GO by a modified Hummers’ method that was based on the oxidation of graphite nanoplatelets (GNPs) by KMnO4 (≥99%) and KNO3 (≥99%) solution in absolute H2SO4 [18,19]. Then, the concentrated aqueous solution of GO was cast onto a paper substrate and this system was airdried at room temperature. A Whatman® quantitative filter paper, grade 42 circles, diam. 42.5 mm, was selected as the substrate. The obtained GO on paper sample was periodically sprayed with L-ascorbic acid (L-aa, Sigma-Aldrich, St. Louis, Missouri, Stati Uniti, 99%) aqueous solution to reduce GO. This treatment lasted for ca. 48 h. More details about the developed procedure can be found in Longo et al. [14]. To improve the diffusion of the reductant agent into a thin coating of GO, the system was closed in a suitable Petri dish and was heated at a low temperature (50 °C) by using a controlled hot plate. In these experimental conditions, an effective mass transport diffusion of the L-aa reductant was possible inside the GO layer swelled by water. At the end of process, to remove all possible reduction by-products, the samples were washed by spraying distilled water onto them. Figure 1 shows the sequence of all steps that constitute the developed preparation of r-GO on paper.
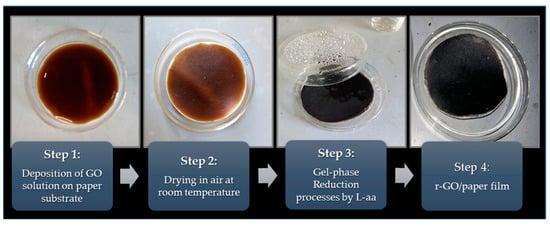
Figure 1.
Images of all process steps.
To establish the thermal stability of the cellulose substrate, the pure L-aa, and the GO, thermogravimetric analyses (TGAs) were carried out by a TA-Instruments Q5000, operating in flowing nitrogen, with a constant heating rate of 10 °C/min. In addition, the substrate, the pure L-aa, and the GO supported on paper samples, before and after the reduction treatment, were characterized by FT-IR spectroscopy in ATR mode in the 4000–700 cm−1 range by using a PerkinElmer Frontier NIR spectrophotometer. The surface and the cross-section morphologies of the coating layer were visualized by SEM using an FEI Quanta 200 FEG.
The chemical structures were drawn by ACD/ChemSketch (Freeware Software, version 2019.2.1, Advanced Chemistry Development, Inc., Toronto, ON, Canada, www.acdlabs.com) to clarify some aspects about the interactions present in the system.
3. Results and Discussion
Thermogravimetric analysis was carried out to verify the thermal stability of the used paper, L-aa, and GO. The TGA thermogram of a paper sample is shown in Figure 2a. The sample is characterized by a little weight loss in the range 25–250 °C and a high level of weight loss in the range 300–400 °C, with a maximum degradation rate at ca. 346 °C, as can be seen by the derivative curve (red line in Figure 2a). These two weight loss stages correspond to the slow pyrolysis and fast pyrolysis stages [20]. At the early and slow pyrolysis stage, weight loss was associated with volatilization and vaporization of water. Cellulose is hydrophilic and was subjected to dehydration, by which water was released. Further weight loss was relatively fast, which was due to dehydration and decomposition of the cellulose. The onset decomposition temperature is the temperature at which the oxidation process begins. The percentage weight residue for the cellulose was 3% [20]. Figure 2b show the TGA thermogram of a pure L-aa. The L-aa started to decompose at approximately 191 °C, with the maximum rate of decomposition occurring at approximately 208 °C (see derivative curve in red in Figure 2b). This maximum was followed by two additional decomposition steps in the 251–500 °C temperature range. At 500 °C, approximately 11% of the initial sample remained as charred residue [21].
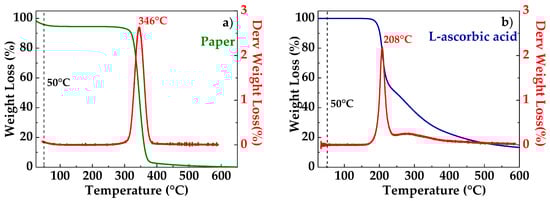
Figure 2.
TGA thermogram of paper (a); L-ascorbic acid (b).
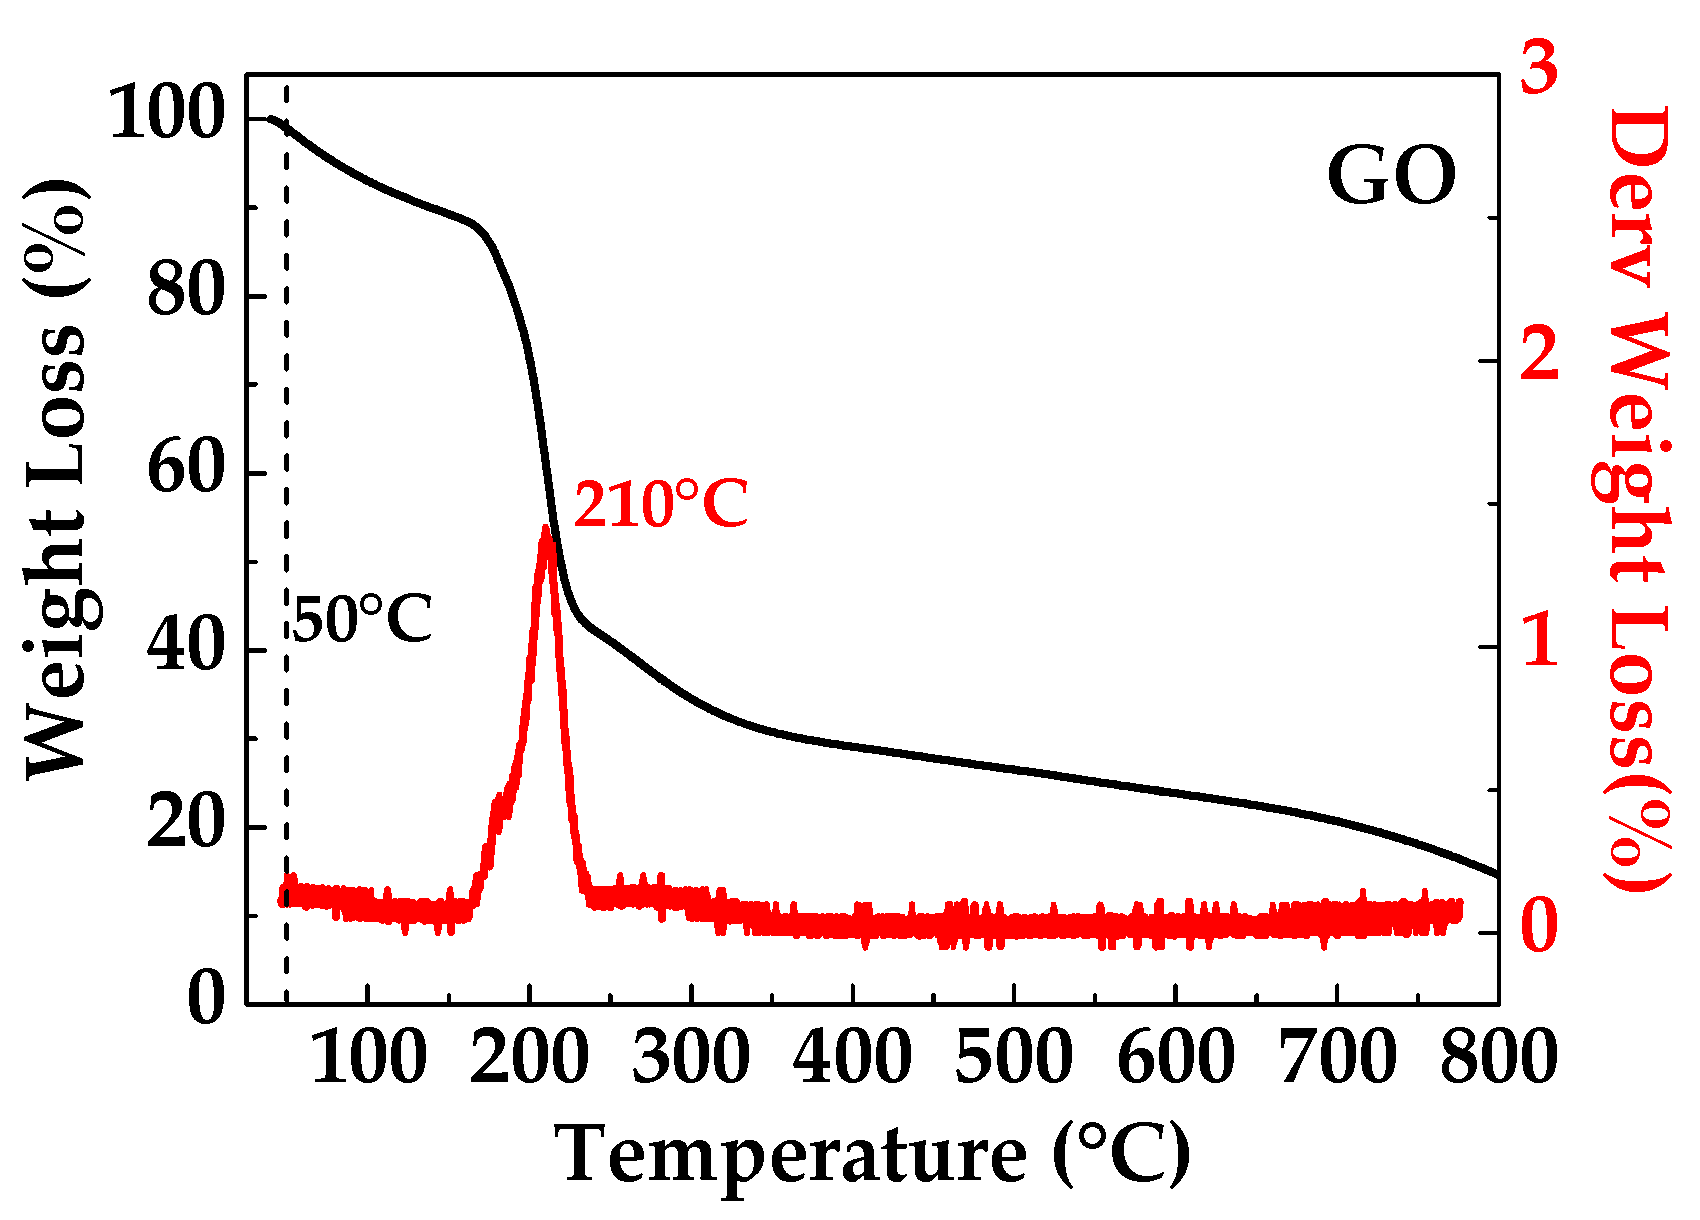
The TGA curve of GO film shown in Figure 3 shows obvious mass loss below 170 °C, presumably due to the evaporation of absorbed water, due to the higher hydrophobicity of the GO sample. The GO film exhibits major mass loss (40%) in the range of 170–800 °C, which is attributed to the loss of oxygen functional groups [22].
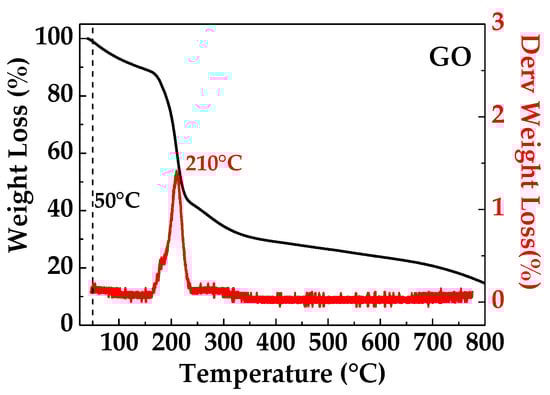
Figure 3.
TGA thermogram of GO.
The thermogravimetric analysis confirms that the high temperatures needed to obtain the thermal reduction of GO are not compatible with the paper substrate’s thermal stability, while the low process temperature (50 °C) used here is able to guarantee thermal stability for both the substrate and the reducing agent. The selected process temperature is used to improve the diffusion mechanics of L-aa in the swelled GO coating and to ensure a bulky reduction. The presence of abundant oxygenated functional groups on GO makes the material very hydrophilic and thus provides it with a high tendency to absorb water and swell in humid or aqueous environments [23]. In fact, the possible absorption of water molecules by the interaction with the epoxide and/or hydroxyl groups present on the GO layer is well known (see Figure 4). This absorption gives to the layered–stacked GO a natural tendency to swell as a consequence of the enlarged interlayer spacing. For this region, the process temperature was selected to increase both the mobility of water and the corresponding mobility of L-aa molecules in the GO channels.
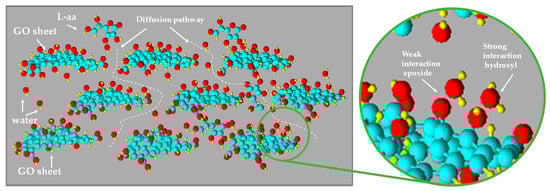
Figure 4.
Representation of swelled GO and diffusion pathway of L-aa aqueous solution.
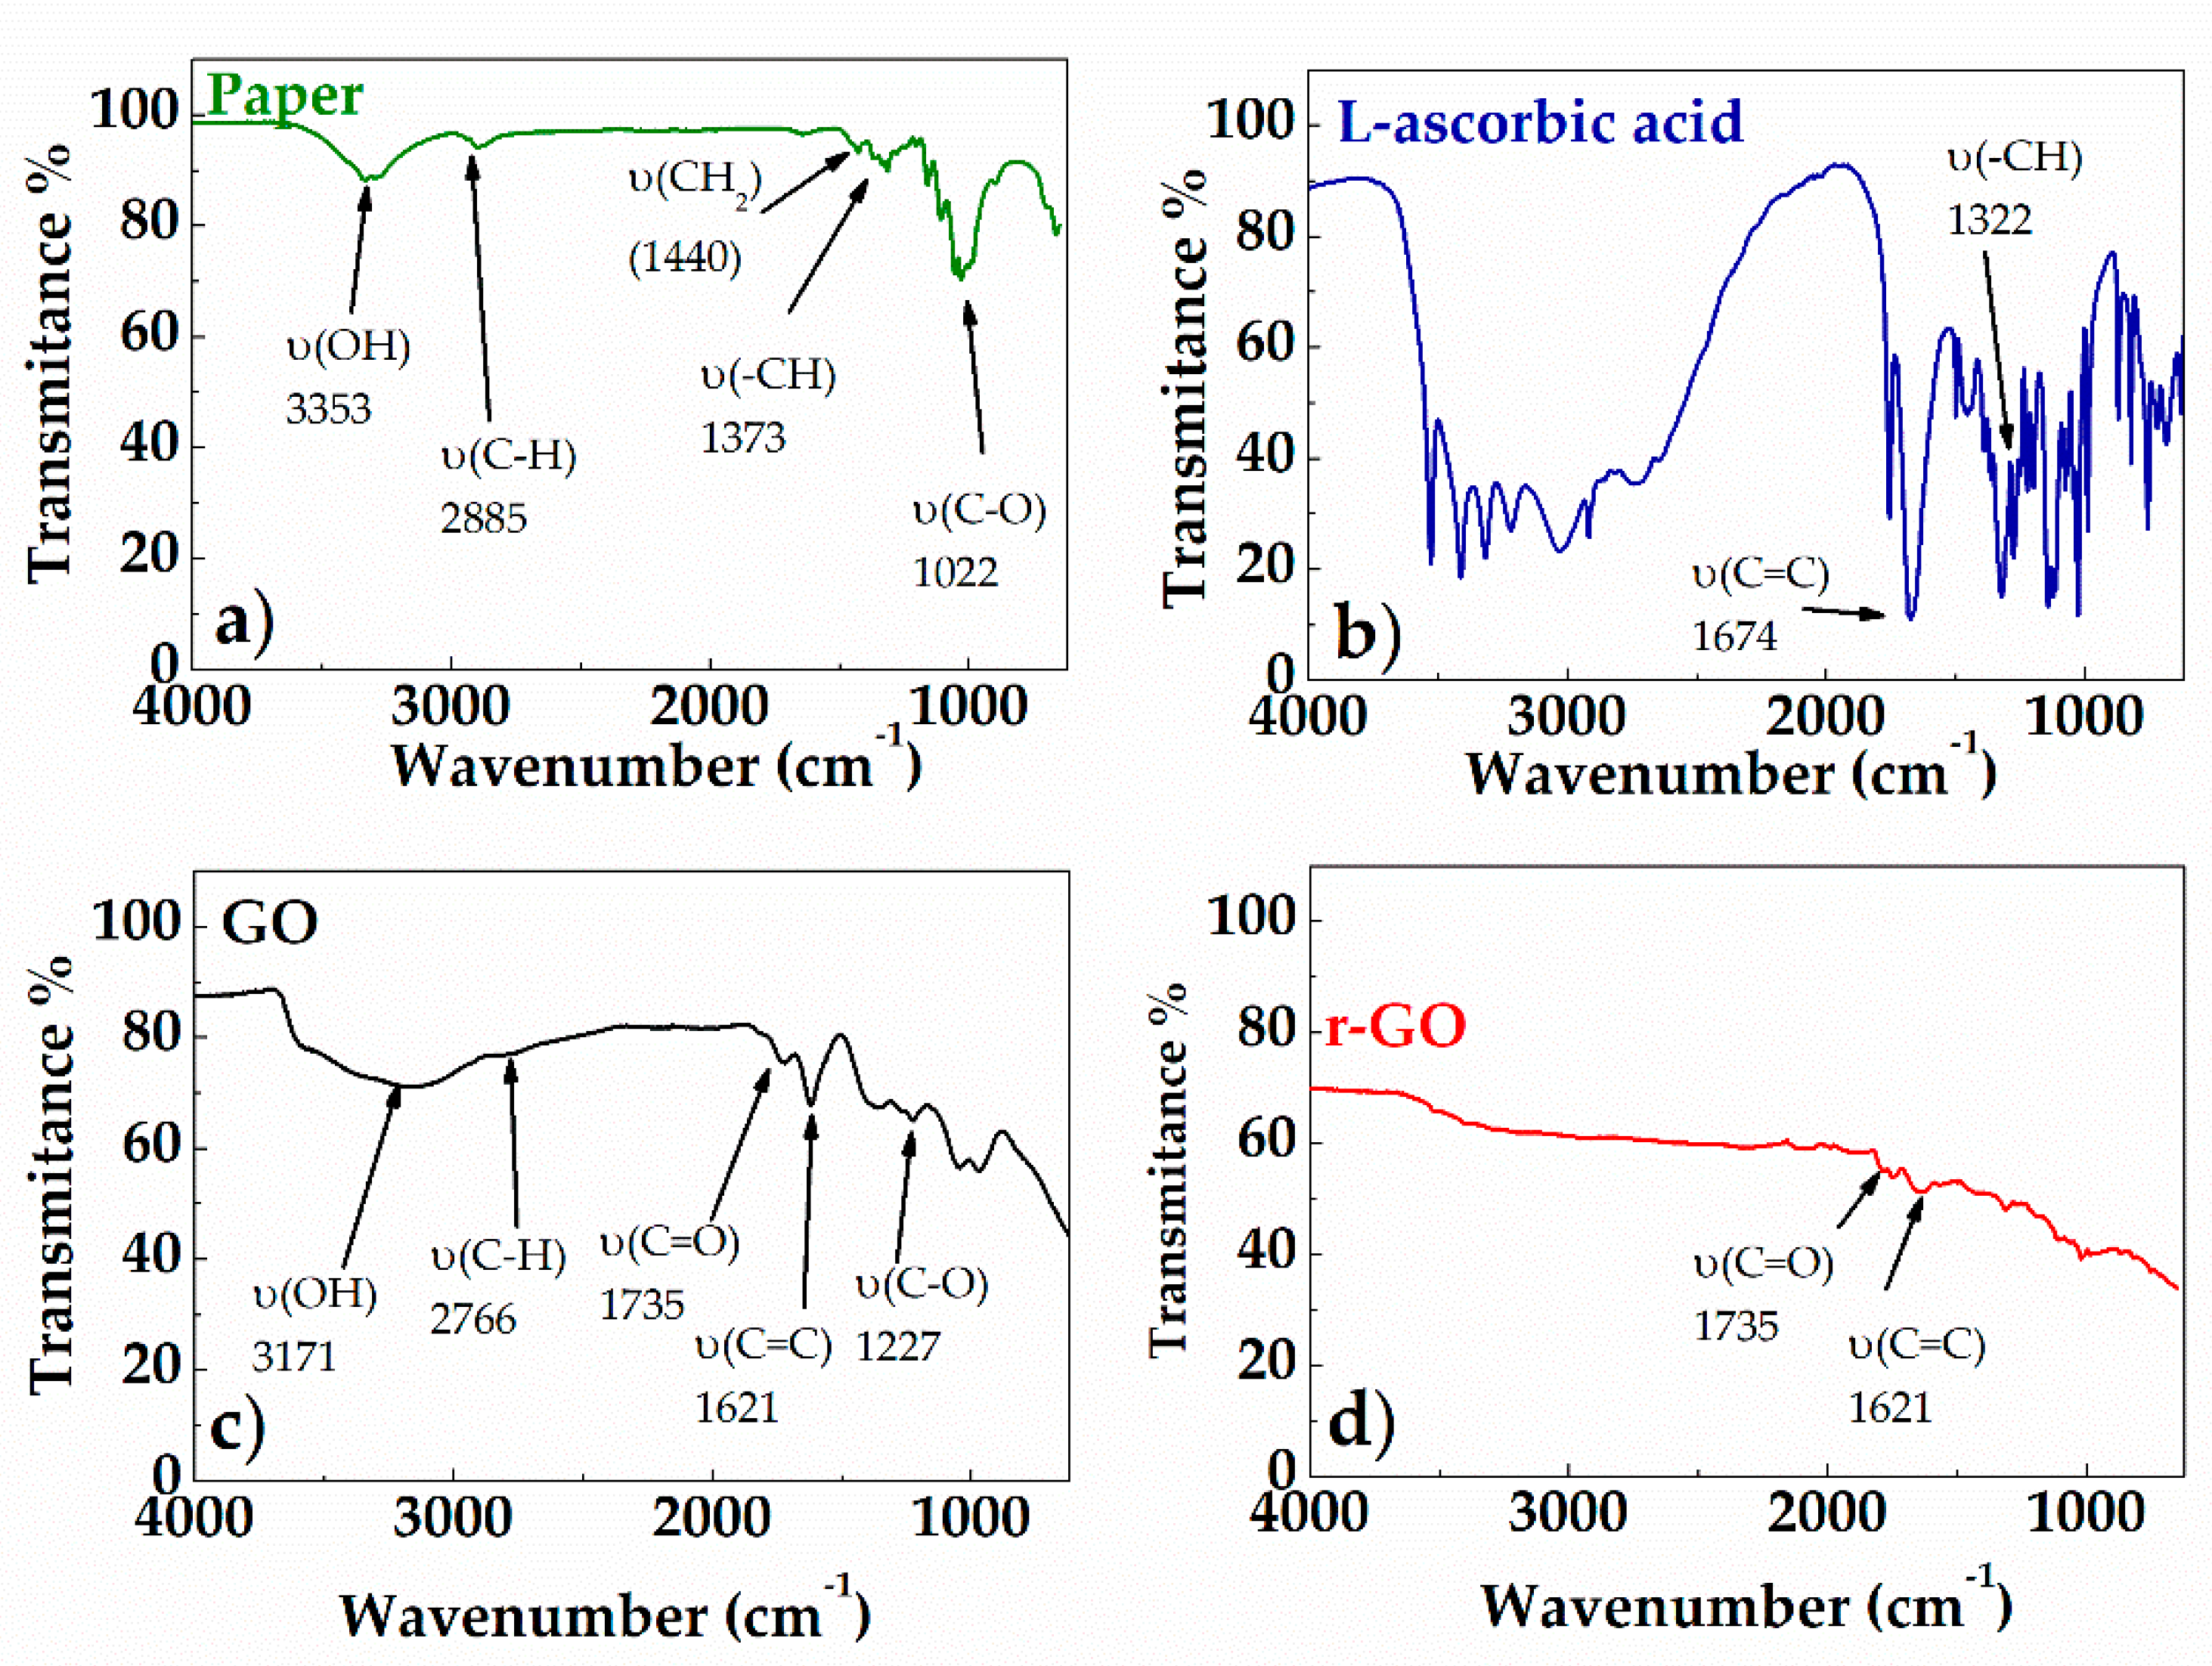
Figure 5 shows the FT-IR spectra (ATR mode) of: paper substrate (Figure 5a), L-ascorbic acid (Figure 5b), GO before (Figure 5c) and after (Figure 5d) treatment with L-aa aqueous solution. The absorption bands of the paper are observed in two spectral regions: 3660–2800 cm−1 and 1650–400 cm−1 (see Figure 5a). The peaks belonging to the 3660–2900 cm−1 range correspond to the stretching vibrations of O-H and C-H bonds in polysaccharides. The peak at 3353 cm−1 also includes contributions from -OH involved in inter- and intra-molecular hydrogen bonds possible in the cellulose. The band at 2885 cm−1 is attributed to the C-H stretching vibration of all hydrocarbon groups contained in this polysaccharide. The peak located at 1633 cm−1 corresponds to bending vibration of water molecules absorbed in cellulose. The absorption bands at 1440 cm−1, 1373 cm−1, 1022 cm−1, and 896 cm−1 belong to stretching and bending vibrations of -CH2 and -CH and C-O bonds in cellulose, respectively. The intensity of the band at around 1440 cm−1 depends on the cellulose crystalline fraction, while the intensity of the band at 896 cm−1 depends on the amount of the amorphous phase [24]. The spectrum of pure L-ascorbic acid (see Figure 5b) revealed that the stretching vibrations of C=C and enol-hydroxyl groups were observed at 1674 cm−1 and 1322 cm−1, respectively [25]. According to Figure 5c, the GO spectrum includes six main peaks, that can be attributed to the resonance vibrations of the oxygen-containing groups, and the carbon skeleton. In particular, the very strong and broad peak at 3171 cm−1 can be attributed to the resonance vibration of hydroxyl groups (–OH), the peak at 1735 cm−1 to the resonance vibration of carbonyl groups (C=O), the peak at 1227 cm−1 to the alkoxy groups (C-O-H), and the peak at 1061 cm−1 to the epoxide groups (C-O-C). In addition, the stretching absorption of C=C groups is also clearly visible in the spectrum at 1621 cm−1, and the band centered at 2840 cm−1 is due to the C–H stretching vibration [26]. The spectrum of GO after the chemical reduction (see Figure 5d) shows a decrease in absorption band number and intensities, thus confirming the formation of r-GO by the removal of most oxygen-containing functional groups. In particular, the C–O stretching resonance completely disappears, while the C=C and C=O stretching vibrations slightly attenuate [26]. This confirms that the removal of carbonylic groups is not complete.
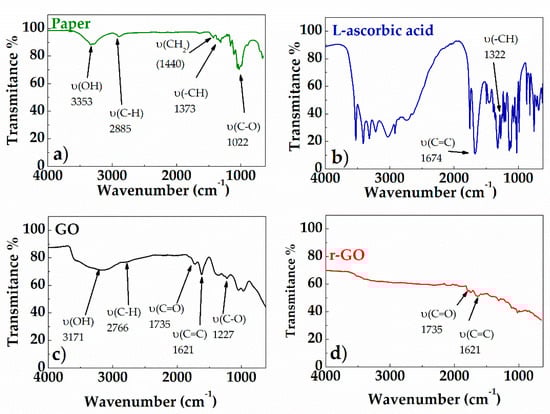
Figure 5.
FT-IR spectra of paper (a); L-ascorbic acid (b); GO (c); r-GO (d).
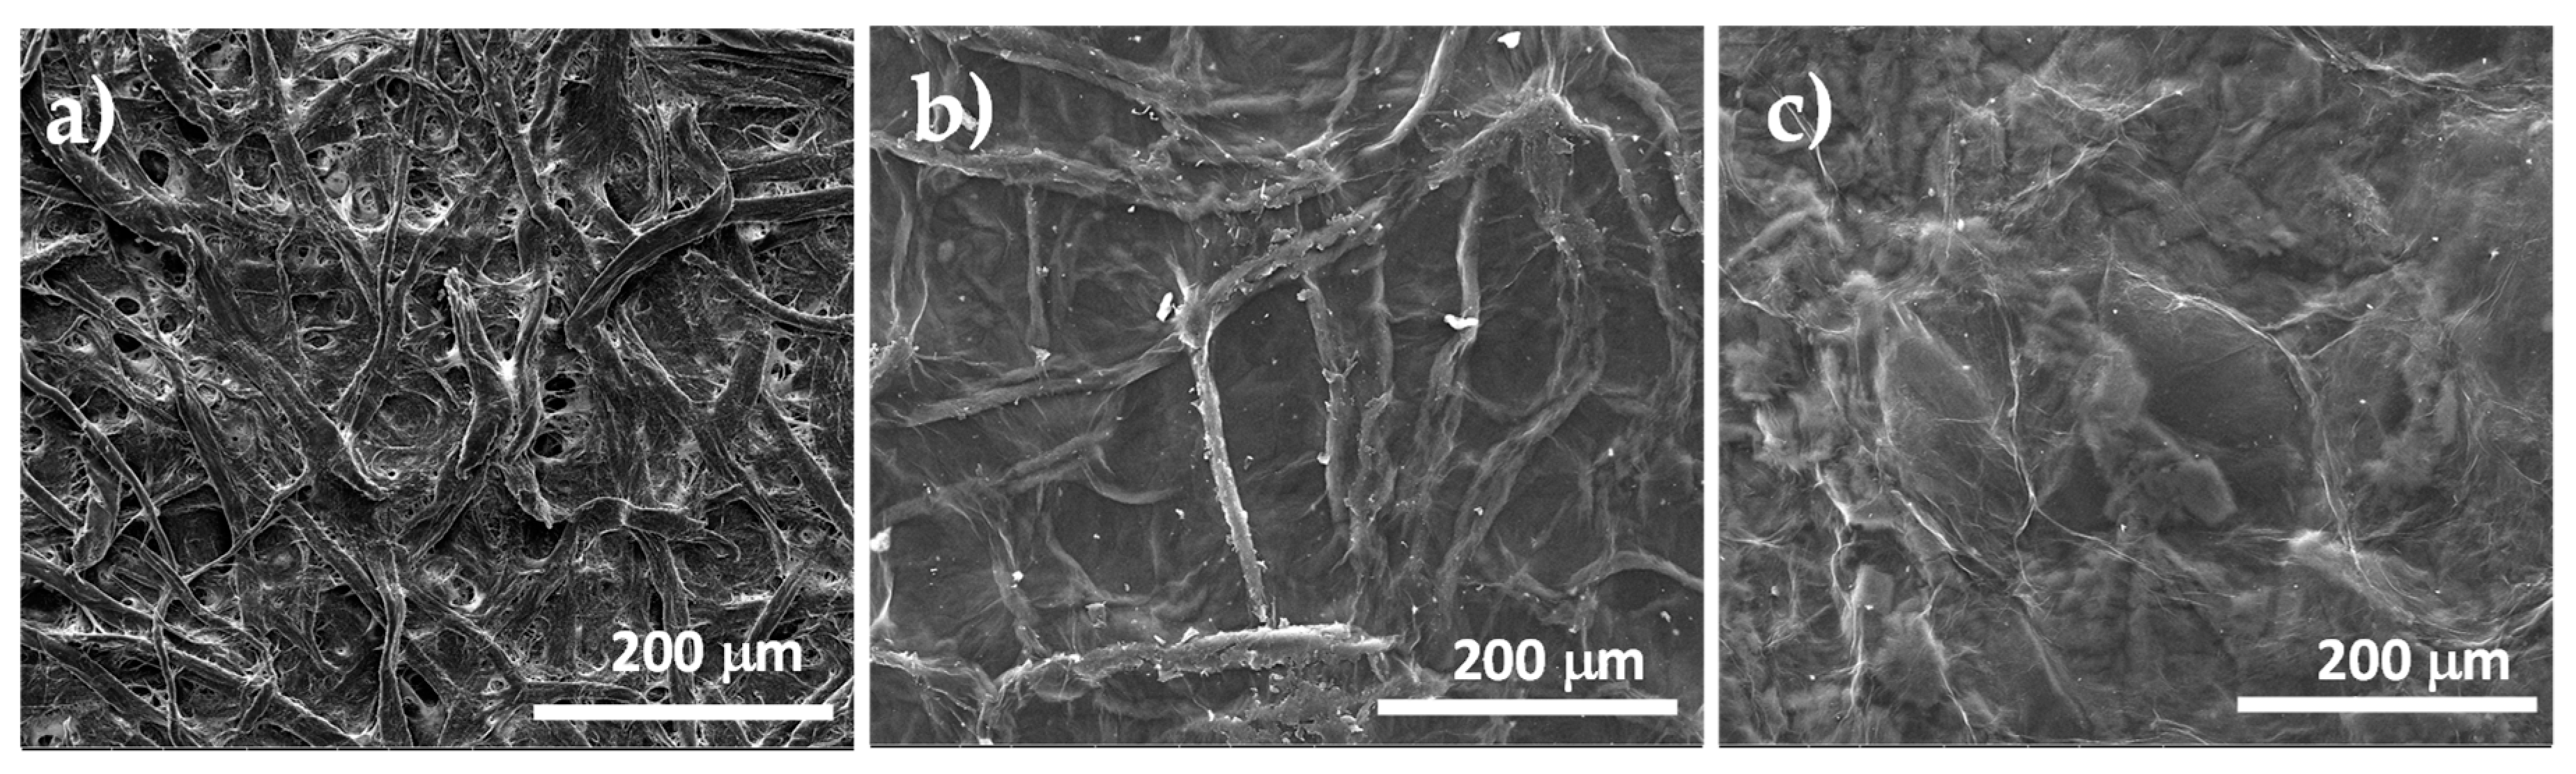
The morphologies of the paper substrate, and the GO supported on paper, before and after the chemical reduction, were investigated by SEM, as shown in Figure 6. As visible in Figure 6a, the substrate was made of compacted cellulose microfibers with a diameter in the 20–50 μm range. Several pores, with a size of ca. 2.5 μm, were uniformly distributed on the substrate surface. After coating the paper substrate with GO and drying this system in air, according to the SEM micrographs shown in Figure 6b, continuous and uniform coverage of both the cellulose fibers and pores by a thin GO layer was obtained. Obviously, the observed roughness on the GO surface can be ascribed to the substrate fibrous morphology that is perfectly reproduced because of the conformational flexibility of the GO chemical structure due to the presence of the sp3-hybridized carbon atoms. As visible in Figure 6c, the coating morphology slightly changed after the chemical reduction treatment, indeed, the surface roughness was reduced significantly, and all deep grooves and folds are no longer visible because of the increased stiffness of the graphene coating layer, which consists mainly of Sp2-hybridized carbon atoms. This lower roughness of the sample surface, that followed the chemical treatment, proves a complete conversion of GO sheets to r-GO, near the coating top.

Figure 6.
SEM micrographs of paper substrate (a), GO supported on paper (b) and GO supported on paper after treatment with L-aa aqueous solution (c).
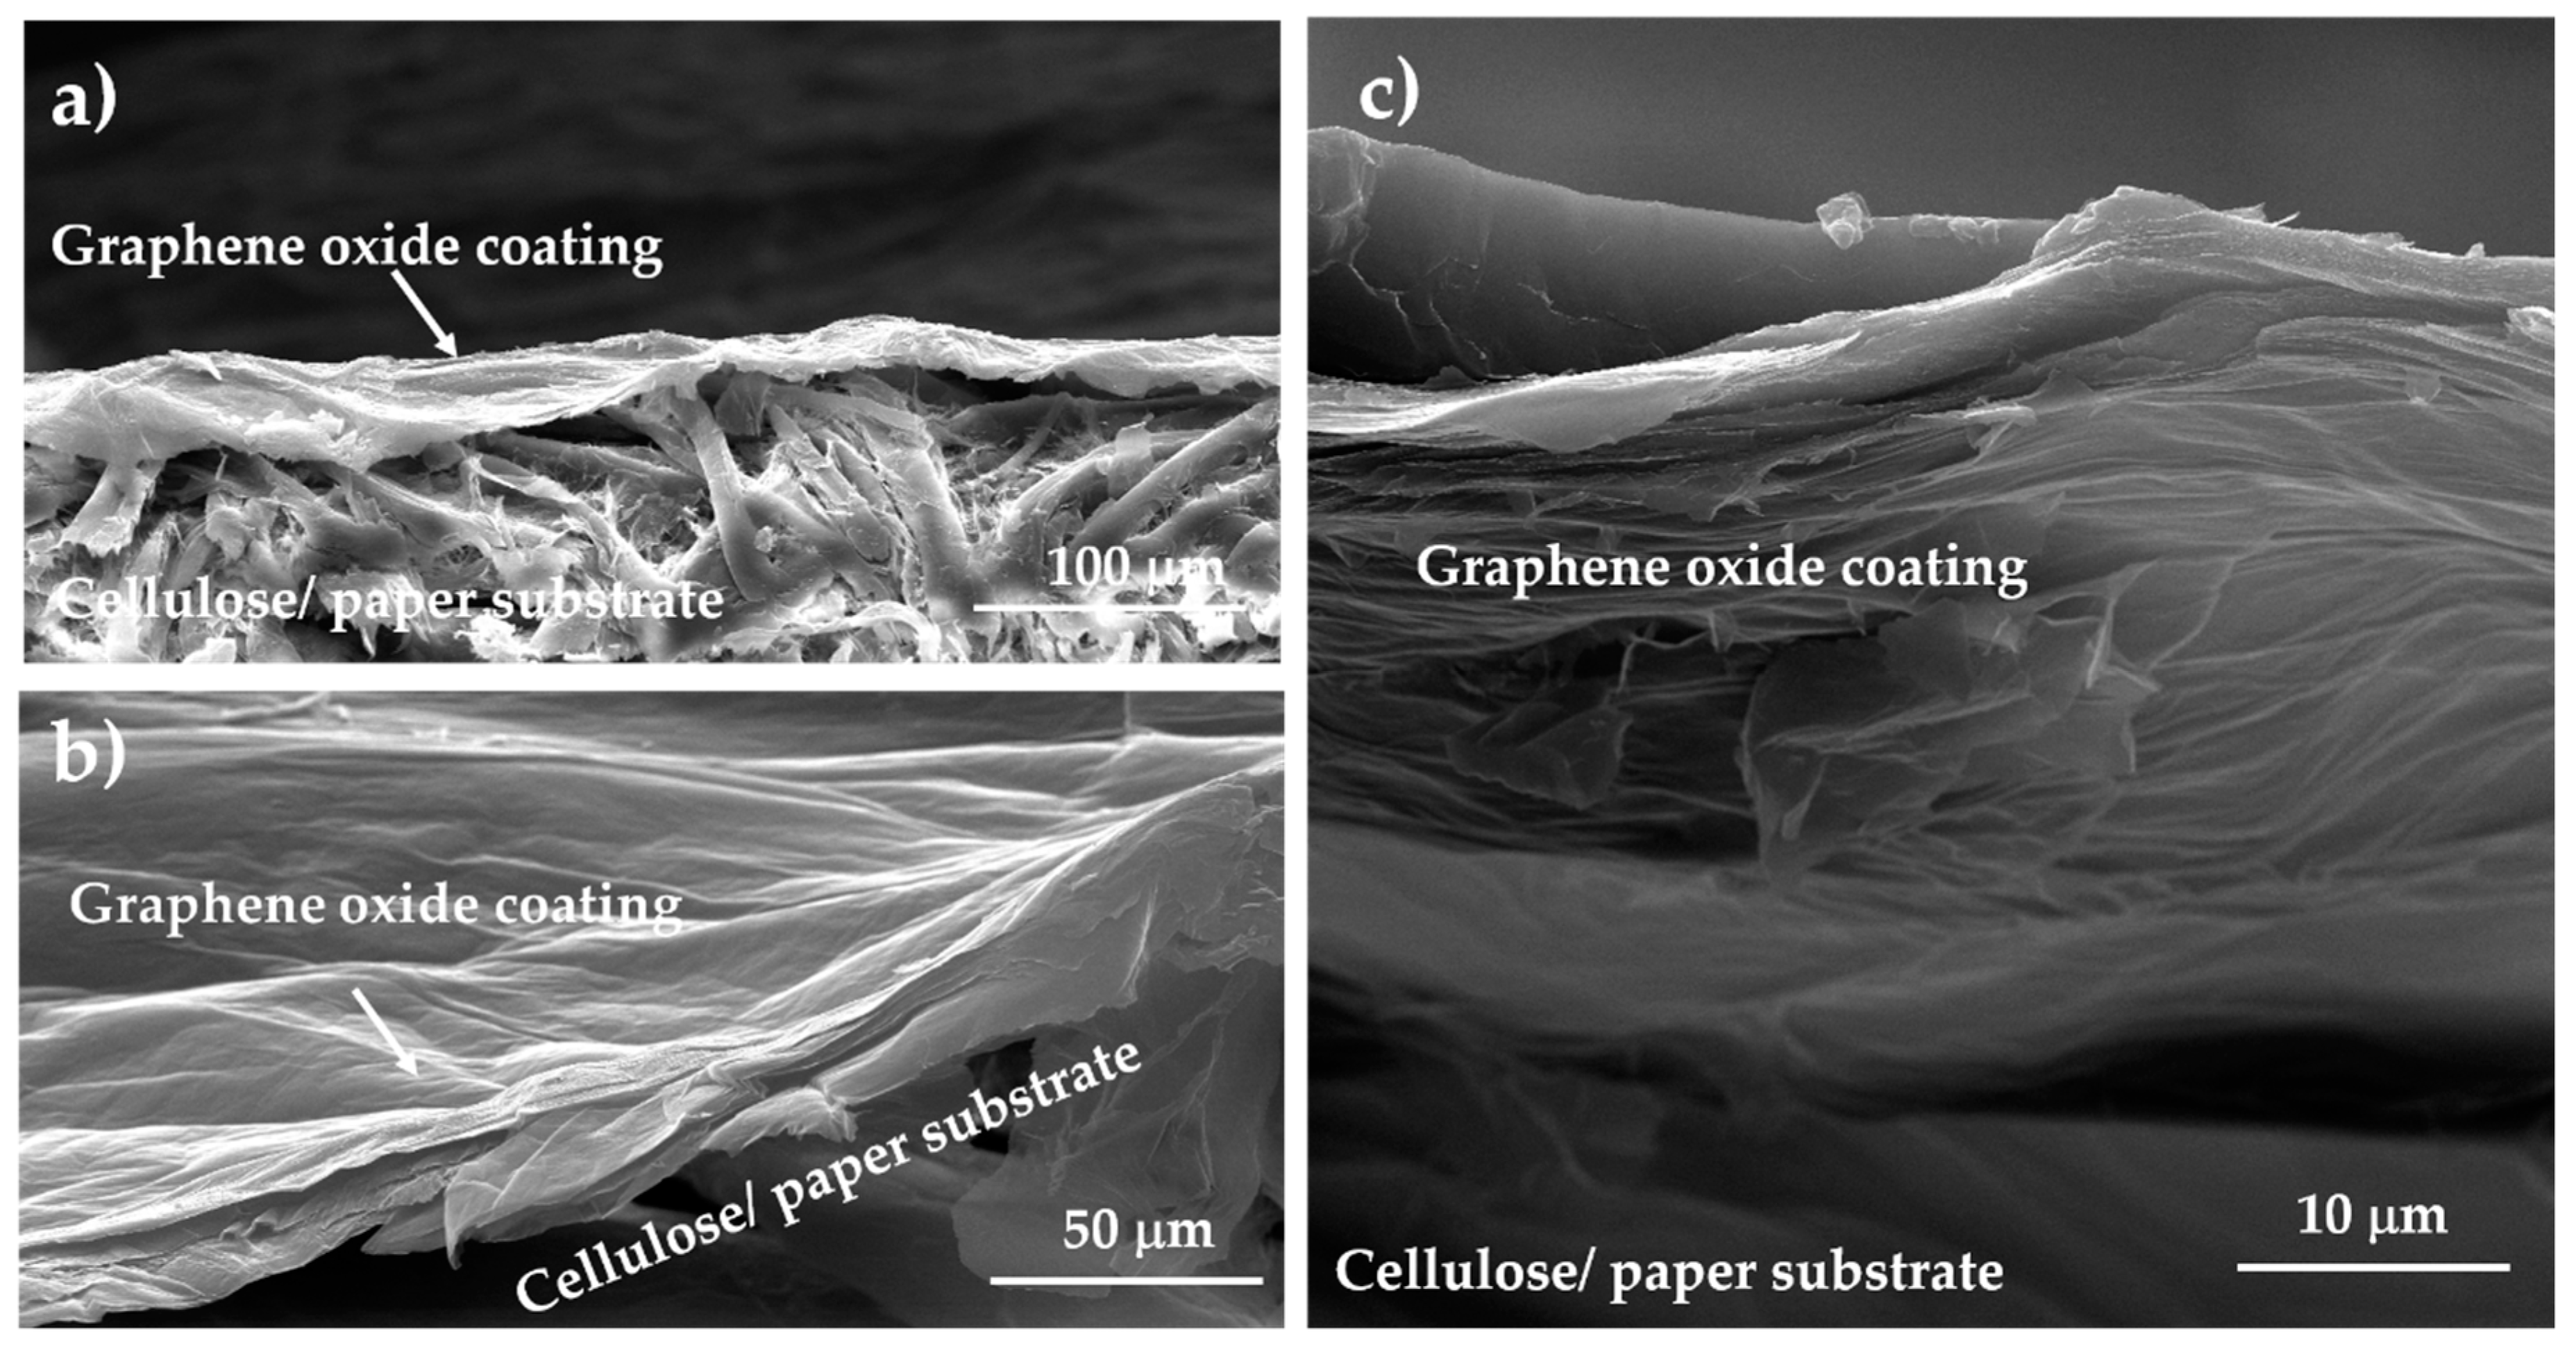
To analyze the interfacial interaction between the GO coating and cellulose substrate, SEM investigation was carried out on the cross-section of the samples of GO on paper (see Figure 7). Figure 7a show that the thickness of the paper substrate was ca. 120 μm, while the thickness of the GO layer was ca. 30 μm. As visible in Figure 7b, the coating layer appeared to be quite compact and cavities or other defects were not present in this layer. The SEM micrographs of the r-GO sample shown in Figure 7c suggest the formation of air cavities inside the layer because of the reduction treatment, and the layer thickness was ca. 50 μm. In addition, these results confirm a good interfacial adhesion that occurred between the GO substrate and the fibrous coating before and after the reduction process.

Figure 7.
Cross-section SEM micrographs of GO (a,b) and r-GO (c) supported on paper.
Owing to the chemical affinity between the GO layer and the cellulose fibers, related to the presence of hydroxyl and carboxylic groups in both solid phases, a strong interfacial adhesion was possible. In Figure 8 is schematized the possible interactions at the solid interface of cellulose/graphene oxide [27]. The experiment results show that strong interactions are also present after reduction. According to the FT-IR results, these interactions can probably be related to a partial reduction process that does not involve the carboxylic groups present in the nearest GO layer on the cellulose substrate.
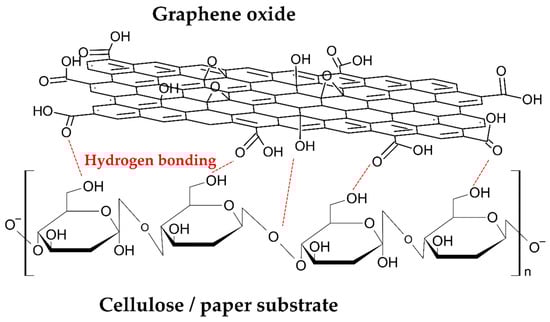
Figure 8.
Schematic interaction of GO coating and cellulose substrate.
4. Conclusions
The possibility to reduce thin GO deposits on paper substrate by a non-toxic, ecofriendly, and low-cost chemical reductant, like L-aa aqueous solution, has been investigated. The achieved results confirm that this procedure creates a uniform and bulky layer of r-GO on paper. This process requires refluxing of the L-aa aqueous solution in the presence of the GO deposit in a closed microenvironment for 48 h at a temperature of ca. 50 °C. In these experimental conditions, GO forms a swelled phase where the reductant diffusion can easily take place. According to the TGA investigation, the selected temperature process is necessary to increase both the mobility of water and the corresponding mobility of L-aa molecules in the GO channels. Infrared spectroscopy (FT-IR) showed that most of the oxygen-containing groups present in the GO layer were removed after the reduction, while the SEM characterization confirms a strong interfacial adhesion between the GO/r-GO coating and the fibrous substrate before and after the reduction process. This structural characteristic is relevant to achieve a highly flexible film based on an r-GO layer supported on paper substrate that can be analyzed and used for industrial exploitation.
Author Contributions
Conceptualization, G.C. and A.L.; methodology, G.C.; software, A.L.; validation, G.C., M.P., and A.L.; investigation, G.C., M.P., and A.L.; data curation, A.L. and M.P.; writing—original draft preparation, A.L. and M.P.; writing—review and editing, G.C., A.L., and M.P.; supervision, G.C.; project administration, G.C. All authors have read and agreed to the published version of the manuscript.
Funding
This research received no external funding.
Acknowledgments
The authors are grateful to Maria Cristina Del Barone of LAMEST laboratory (IPCB-CNR) for SEM analysis, and Mario De Angioletti and Maria Rosaria Marcedula of Thermo-Analysis Laboratory (IPCB-CNR) for FT-IR and TGA analysis. The authors acknowledge the funding support by the CNR project titled: “Nanocompositi polimerici per applicazione ottiche”.
Conflicts of Interest
The authors declare no conflict of interest.
References
- Dreyer, D.R.; Park, S.; Bielawski, C.W.; Ruoff, R.S. The chemistry of graphene oxide. Chem. Soc. Rev. 2010, 39, 228–240. [Google Scholar] [CrossRef] [PubMed]
- Marcano, D.C.; Kosynkin, D.V.; Berlin, J.M.; Sinitskii, A.; Sun, Z.; Slesarev, A.; Alemany, L.B.; Lu, W.; Tour, J.M. Improved synthesis of graphene oxide. ACS Nano 2010, 4, 4806–4814. [Google Scholar] [CrossRef] [PubMed]
- Malho, J.-M.; Laaksonen, P.; Walther, A.; Ikkala, O.; Linder, M.B. Facile method for stiff, tough, and strong nanocomposites by direct exfoliation of multilayered graphene into native nanocellulose matrix. Biomacromolecules 2012, 13, 1093–1099. [Google Scholar] [CrossRef]
- Wang, B.; Lou, W.; Wang, X.; Hao, J. Relationship between dispersion state and reinforcement effect of graphene oxide in microcrystalline cellulose–graphene oxide composite films. J. Mater. Chem. 2012, 22, 12859–12866. [Google Scholar] [CrossRef]
- Feng, Y.; Zhang, X.; Shen, Y.; Yoshino, K.; Feng, W. A mechanically strong, flexible, and conductive film based on bacterial cellulose/graphene nanocomposite. Carbohydr. Polym. 2012, 87, 644–649. [Google Scholar] [CrossRef] [PubMed]
- Namazi, H.; Mosadegh, M.; Hayasi, M. New developments in polycaprolactone-layered silicate nano-biocomposites: Fabrication and properties. In Handbook of Polymer Nanocomposites. Processing, Performance and Application; Jitendra, K.P., Kummetha, R.R., Amar Kumar, M., Manjusri, M., Eds.; Springer: Heidelberg, Germany, 2014; pp. 21–25. [Google Scholar]
- Yu, L.; Petinakis, S.; Dean, K.; Bilyk, A.; Wu, D. Green polymeric blends and composites from renewable resources. Macromol. Symp. 2007, 249–250, 535–539. [Google Scholar] [CrossRef]
- Costa, M.N.; Veigas, B.; Jacob, J.M.; Santos, D.S.; Gomes, J.; Baptista, P.V.; Martins, R.; Inácio, J.; Fortunato, E. A low cost, safe, disposable, rapid and self-sustainable paper-based platform for diagnostic testing: Lab-on-paper. Nanotechnology 2014, 25, 094006. [Google Scholar] [CrossRef]
- Lua, Y.; Wang, H.; Zhao, W.; Zhang, M.; Qin, H.; Xie, Y. Flexible, Stretchable Sensors for Wearable Health Monitoring: Sensing Mechanisms, Materials, Fabrication Strategies and Features. Sensor 2018, 18, 645–652. [Google Scholar]
- Akyazi, T.; Basabe-Desmonts, L.; Benito-Lopez, F. Review on microfluidic paper-based analytical devices towards commercialization. Anal. Chim. Acta 2017, 1001, 1–17. [Google Scholar] [CrossRef]
- Song, S.; Zhai, Y.; Zhang, Y. Bioinspired Graphene Oxide/Polymer Nanocomposite Paper with High Strength, Toughness, and Dielectric Constant. Appl. Mater. Interfaces 2016, 8, 31264–31272. [Google Scholar] [CrossRef]
- Saha, B.; Baek, S.; Lee, J. Highly Sensitive Bendable and Foldable Paper Sensors Based on Reduced Graphene Oxide. Appl. Mater. Interfaces 2017, 9, 4658–4666. [Google Scholar] [CrossRef] [PubMed]
- Luong, N.D.; Pahimanolis, N.; Hippi, U.; Korhonen, J.T.; Ruokolainen, J.; Johansson, L.-S.; Namd, J.-D.; Seppälä, J. Graphene/cellulose nanocomposite paper with high electrical and mechanical performances. J. Mater. Chem. 2011, 21, 13991–13998. [Google Scholar] [CrossRef]
- Longo, A.; Palomba, M.; Carotenuto, G. Green Solid-State Chemical Reduction of Graphene Oxide Supported on a Paper Substrate. Coatings 2020, 10, 693. [Google Scholar] [CrossRef]
- Zhang, J.; Yang, H.; Sheng, G.; Cheng, P.; Zang, J.; Guo, S. Reduction of graphene oxide vial-ascorbic acid. Chem. Commun. 2010, 46, 1112–1114. [Google Scholar] [CrossRef]
- Liu, J.; Liu, L.; Wu, X.; Zhang, X.; Li, T. Environmentally friendly synthesis of graphene–silver composites with surface-enhanced Raman scattering and antibacterial activity via reduction with l-ascorbic acid/water vapor. New J. Chem. 2015, 39, 5272–5281. [Google Scholar] [CrossRef]
- Habte, A.T.; Ayele, D.W. Synthesis and Characterization of Reduced Graphene Oxide (rGO) Started from Graphene Oxide (GO) Using the Tour Method with Different Parameters. Adv. Mater. Sci. Eng. 2019, 15, 1–9. [Google Scholar] [CrossRef]
- Longo, A.; Verrucchi, R.; Aversa, L.; Tatti, R.; Ambrosio, A.; Orabona, E.; Coscia, U.; Carotenuto, G.; Maddalena, P. Graphene oxide prepared by graphene nanoplatelets and reduced by laser treatment. Nanotecnology 2017, 28, 224002. [Google Scholar] [CrossRef] [PubMed]
- Orabona, E.; Ambrosio, A.; Longo, A.; Carotenuto, G.; Nicolais, L.; Maddalena, P. Holographic patterning of graphene-oxide films by light-driven reduction. Optics Lett. 2014, 39, 4263–4266. [Google Scholar] [CrossRef]
- Lee, C.Y.; Mat, U.W.; Norhayani, O. Thermal and flexural properties of regenerated cellulose(rc)/poly(3-hydroxybutyrate)(phb) biocomposites. J. Teknol. 2015, 75, 107–122. [Google Scholar]
- Juhász, M.; Kitahara, Y.; Takahashi, S.; Fujii, T. Thermal stability of vitamin C: Thermogravimetric analysis and use of total ion monitoring chromatograms. J. Pharm. Biomed. Anal. 2012, 59, 190–193. [Google Scholar] [CrossRef]
- Jin, S.; Gao, Q.; Zeng, X.; Zhang, R.; Liu, K.; Shao, X.; Jin, M. Effects of reduction methods on the structure and thermal conductivity of free-standing reduced graphene oxide films. Diamond Relat. Mater. 2015, 58, 54–61. [Google Scholar] [CrossRef]
- Neklyudov, V.V.; Khafizov, N.R.; Sedov, I.A.; Dimiev, A.M. New insights into the solubility of graphene oxide in water and alcohols. Phys. Chem. Chem. Phys. 2017, 19, 17000–17008. [Google Scholar] [CrossRef] [PubMed]
- Hospodarova, V.; Singovszka, E.; Stevulova, N. Characterization of Cellulosic Fibers by FTIR Spectroscopy for Their Further Implementation to Building Materials. Am. J. Anal. Chem. 2018, 9, 303–310. [Google Scholar] [CrossRef]
- Umer, A.; Naveed, S.; Ramzan, N.; Rafique, M.S.; Imran, M. A green method for the synthesis of Copper Nanoparticles using L-ascorbic acid. Rev. Mater. 2014, 19, 197–203. [Google Scholar] [CrossRef]
- Faniyi, I.O.; Fasakin, O.; Olofnjana, B.; Adekunle, A.S.; Oluwasusi, T.V.; Eleruja, M.A.; Ajayi, E.O.B. The comparative analyses of reduced graphene oxide (RGO) prepared via green, mild and chemical approaches. SN Appl. Sci. 2019, 1, 1181. [Google Scholar] [CrossRef]
- Kabiri, N.; Namazi, H. Nanocrystalline cellulose acetate (NCCA)/graphene oxide (GO) nanocomposites with enhanced mechanical properties and barrier against water vapor. Cellulose 2014, 21, 3527–3539. [Google Scholar] [CrossRef]


Publisher’s Note: MDPI stays neutral with regard to jurisdictional claims in published maps and institutional affiliations. |
© 2020 by the authors. Licensee MDPI, Basel, Switzerland. This article is an open access article distributed under the terms and conditions of the Creative Commons Attribution (CC BY) license (https://creativecommons.org/licenses/by/4.0/).