Article

Comparative Investigation of Yield and Quality of Bio-Oil and Biochar from Pyrolysis of Woody and Non-Woody Biomasses

1
Energy Technology Program, Faculty of Engineering, Prince of Songkla University, Hat Yai, Songkhla 90110, Thailand
2
Department of Mechanical Engineering, Delhi Technological University, Delhi 110042, India
3
Centre for Energy and Environment, Delhi Technological University, Delhi 110042, India
4
Department of Mechanical Engineering, Faculty of Engineering, Prince of Songkla University, Hat Yai, Songkhla 90110, Thailand
5
Pyrolysis Technology Research Group, Higher Institution Centre of Excellence (HICoE), Institute of Tropical Aquaculture and Fisheries (AKUATROP), University Malaysia Terengganu, Kuala Nerus 21030, Terengganu, Malaysia
6
Energy Technology Program, Department of Specialized Engineering, Faculty of Engineering, Prince of Songkla University, 15 Karnjanavanich Rd., Hat Yai, Songkhla 90110, Thailand
7
Energy Technology Research Center, Faculty of Engineering, Prince of Songkla University, 15 Karnjanavanich Rd., Hat Yai, Songkhla 90110, Thailand
*
Author to whom correspondence should be addressed.
Energies 2021, 14(4), 1092; https://doi.org/10.3390/en14041092
Submission received: 27 January 2021 / Revised: 15 February 2021 / Accepted: 16 February 2021 / Published: 19 February 2021

Abstract

:
This study investigated the quantitative and qualitative attributes of liquid product and biochar obtained from pyrolysis of woody biomass (rubberwood sawdust (RWS)) and non-woody biomasses (oil palm trunk (OPT) and oil palm fronds (OPF)). The prepared biomass was pyrolyzed at temperatures of 500 °C, 550 °C, and 600 °C by using an agitated bed pyrolysis reactor, and then the yields and characteristics of liquid product and biochar were determined. The results showed that liquid product and biochar yields were in the respective ranges of 35.94–54.40% and 23.46–25.98% (wt.). Pyrolysis of RWS at 550 °C provided the highest liquid yield. The energy content of the water free liquid product was in the range 12.19–22.32 MJ/kg. The liquid product had a low pH and it mainly contained phenol groups as indicated by GC-MS. The biochars had high carbon contents (75.07–82.02%), while their oxygen contents were low (14.22–22%). The higher heating value (HHV) of biochar was in the range 26.42–29.33 MJ/kg. XRF analysis revealed that inorganic elements had higher contents in biochar than in the original biomass. The slagging and fouling indexes of biochar were also different from those of the biomass. High carbon content of the biochar confirms potential for its use in carbon sequestration. The specific surface of biochar was lower than that of biomass, while the average pore diameter of biochar was larger than for raw biomass as revealed by BET and SEM. These results on liquid product and biochar obtained from RWS, OPT, and OPF demonstrate that they are promising feedstocks for biofuels and other value-added products.

1. Introduction

Biomass is a promising resource for reducing the reliance on fossil fuel resources such as coal, crude oil, and natural gas. This is because biomass can be converted into various products such as biofuels, bioenergy, bio-products, and biochemical products [1]. Currently, bioenergy is gaining interest in many countries, both developed and developing, especially those with high biomass potential. Previous studies have reported that heavy utilization of fossil fuels has negative impacts on the environment, such as climate change and global warming [2,3]. Moreover, heavy reliance on fossil fuels is associated with low energy security and sustainability, particularly in countries that need to import their fossil fuels [4]. Thus, increased utilization of alternative and renewable energy resources is a most appropriate way to reduce dependency on fossil fuels and the associated impacts [5]. Alternative energy sources are sought to replace the fossil fuels. The sources of alternative energy cover nuclear energy and renewable energy (i.e., wind, hydro, solar, and biomass). Conventionally, distribution of alternative energy and renewable energy resources differs from country to country due to a number of factors. Biomass is well known as a valuable renewable resource of biofuel, bioenergy, and biorefinery products. This is because biomass can be harvested, stored, managed, and processed. Compared to fossil fuels, biomass energy gives lesser or even zero carbon emissions. Additionally, bioenergy is very advantageous for heat and power generation among the renewable and alternative energy resources. This is because management, storage, and transportation of solid biomass can be performed easily. Also, bioenergy can be compared to other renewable energy resources in terms of reliability, accessibility, cost of the technologies, affordability, and technicalities. In addition, applications of biomass following the concept of circular bioeconomy and bioenergy also provide many benefits to the local people in an area or country [6]. For each country, the potential of biomass depends on several factors such as location, weather, agricultural activity, and agro-industrial processes. Thus, the applications of biomass for biofuels, bioenergy, and bio-products need to be pursued from local perspectives.
Biomass is an emerging feedstock in the bioenergy systems and the bioeconomy in Thailand. This is because Thailand has available large quantities of biomass from residues and wastes generated from harvesting and processing of agricultural products, such as rice, corn, cassava, and oil palm fruit bunches. The replantation of crops and plants also generate a huge amount of biomass. For example, the southern part of Thailand is very rich in abundant rubberwood and oil palm biomasses. In 2018, Thailand had plantation areas of rubber and oil palm trees of 3.68 and 0.78 million hectares, respectively, and the southern part contributed 69.7% and 87.3% of these areas, respectively [7]. Replantation to replace old rubber trees and processing of rubberwood provide various biomasses from roots, branches, bark, and rubberwood sawdust (RWS). On replantation of oil palm trees, large amounts of oil palm trunks and oil palm fronds with leaves are generated. Applications of these biomasses in Thailand are not yet extensive. Thus, there is high potential to make use of these biomasses. Besides this, oil palm biomass also comes from the processing of oil palm fruit bunches to produce crude palm oil. This processing generates huge amounts of biomasses, such as palm kernel shell, oil palm fiber, and empty fruit bunches [8,9,10,11]. Some rubberwood and oil palm biomasses have been used as solid fuels for heat and power generation in conventional processes, namely by combustion. However, the potential of these biomasses for alternative uses in producing biofuels, bio-products, and value-added products is still high and challenging. Valorization of biomass can be performed by various conversion technologies, such as thermochemical and biochemical processes [12,13]. Biomass pyrolysis an emerging conversion process among the alternatives. Pyrolysis is a thermochemical conversion process that can be applied to biomass for producing bio-oil, biochar, and synthesis gas. These biofuels are gaining interest as potential substitutes for fossil fuels.
Pyrolysis of lignocellulosic biomasses obtained from woody and non-woody feedstocks is widely applied and has been investigated in many studies [5,14,15,16]. They indicate that the yield and characteristics of pyrolysis products, including bio-oil, biochar, and pyrolysis gas, strongly depend on many factors such biomass properties and composition, operating conditions, and reactor type [17,18,19]. There are some previous studies on characterization of the products obtained from pyrolysis along with a comparison of woody and non woody biomasses. Some studies have also investigated the upgrading of bio-oil and biochar for further value-added applications [15,20,21]. According to those previous studies, production of high bio-oil yield should be performed with biomass having high cellulose and hemicellulose contents. On the other hand, pyrolysis of biomass with high lignin content tends to give a high biochar yield [22,23]. Fast pyrolysis is preferred for converting biomass into bio-oil with high yield and quality. For liquid fuel applications, the bio-oil must contain little water, ash, and solids, while the energy content should be high, and the pH and viscosity at appropriate levels [24,25,26]. Realistically, producing bio-oil of high quality by fast pyrolysis is relatively complicated and costly. Therefore, increasing the value of bio-oil by transforming it into value-added products is essential and has gained attention [17,27]. Besides fast pyrolysis, other studies have assessed biomass conversion by slow pyrolysis. Compared to fast pyrolysis, the yield and quality of bio-oil or liquid product are low from the slow process. However, the liquid product or bio-oil obtained from slow pyrolysis can be applied or upgraded as liquid fuel and value-added products. The bio-oil or liquid product with appropriate chemical compounds can be applied to improve the flavor and odor of food on in agricultural and animal farms [28,29]. The biochar can be applied as solid fuel, bio-filter, activated carbon, and bio-fertilizer. Biochar with a high energy content and a low ash content, as well as appropriate fuel properties, can be used as a solid fuel in forms of briquettes or pellets [15]. Likewise, biochar with high specific surface and suitable pore structure can be modified into activated carbon and used as bio-filter [30]. Moreover, biochar with a high ash content and high in inorganic elements is an alternative material for soil improvement [5]. Only few recent studies have examined the yield and characteristics of pyrolysis products from rubberwood and oil palm biomass using slow pyrolysis [21,31,32], and there are not many studies that have investigated characteristics of pyrolysis products (liquid and biochar) using slow pyrolysis at higher temperatures (above 500 °C) of two different lignocellulosic biomasses of woody and non-woody types [5,33,34,35,36,37,38,39,40,41,42,43,44,45,46,47,48,49,50,51,52,53,54,55,56].
Therefore, the objectives of this study were to investigate the yield and the characteristics of liquid product and biochar obtained from pyrolysis of woody biomass (rubberwood sawdust (RWS)) and of non-woody biomasses (oil palm trunk (OPT) and oil palm frond (OPF)) using an agitated bed pyrolysis reactor. The present work focuses on comprehensive feedstock characterization, followed by an investigation of product yields at pyrolysis temperatures from 500 °C to 600 °C; and finally, an in-depth characterization of the liquid product and the biochar. The liquid product parameters investigated were the basic properties, energy content, elemental composition, and chemical compounds. Then, the elemental composition and energy content of biochar were determined. Carbon sequestration in the biochar was analyzed in order to assess the recalcitrant nature of biochar, which can be applied for soil improvement. Moreover, X-ray Fluorescence (XRF) analysis was used to distinguish the inorganic compounds or oxides in the biochar ash, which helps to predict the slagging and fouling indices for solid fuel applications by combustion. The results from this study will be beneficial for further applications of liquid products and biochars from the pyrolysis of RWS, OPT, and OPF.

2. Materials and Methods

2.1. Biomass Preparation

The samples of non-woody biomass (OPT, OPF) were taken from Krabi Province, Thailand, whereas woody biomass was in the form of RWS obtained from a rubberwood processing factory located at Khlong Ngae, Sadao district, Songkhla province, Thailand. A chopping machine (MCH-420, Machinery789, Lamphun, Thailand) was used to chop the fresh OPT (with bark) and OPF (without leaves) into smaller size of around 4–5 mm. The freshly chopped OPT and OPF, and raw RWS were dried in a solar greenhouse dryer for a week to reduce the moisture content below 10% (wt.). A grinding machine (model YPS-102, Bonny, Bangkok, Thailand) equipped with 1 mm sieve was used to grind the dried samples. The ground biomass was stored in sealed plastic bags until use.

2.2. Biomass Physicochemical Properties Determination

The physicochemical properties of biomass samples were determined following the standard procedures listed in Table 1.

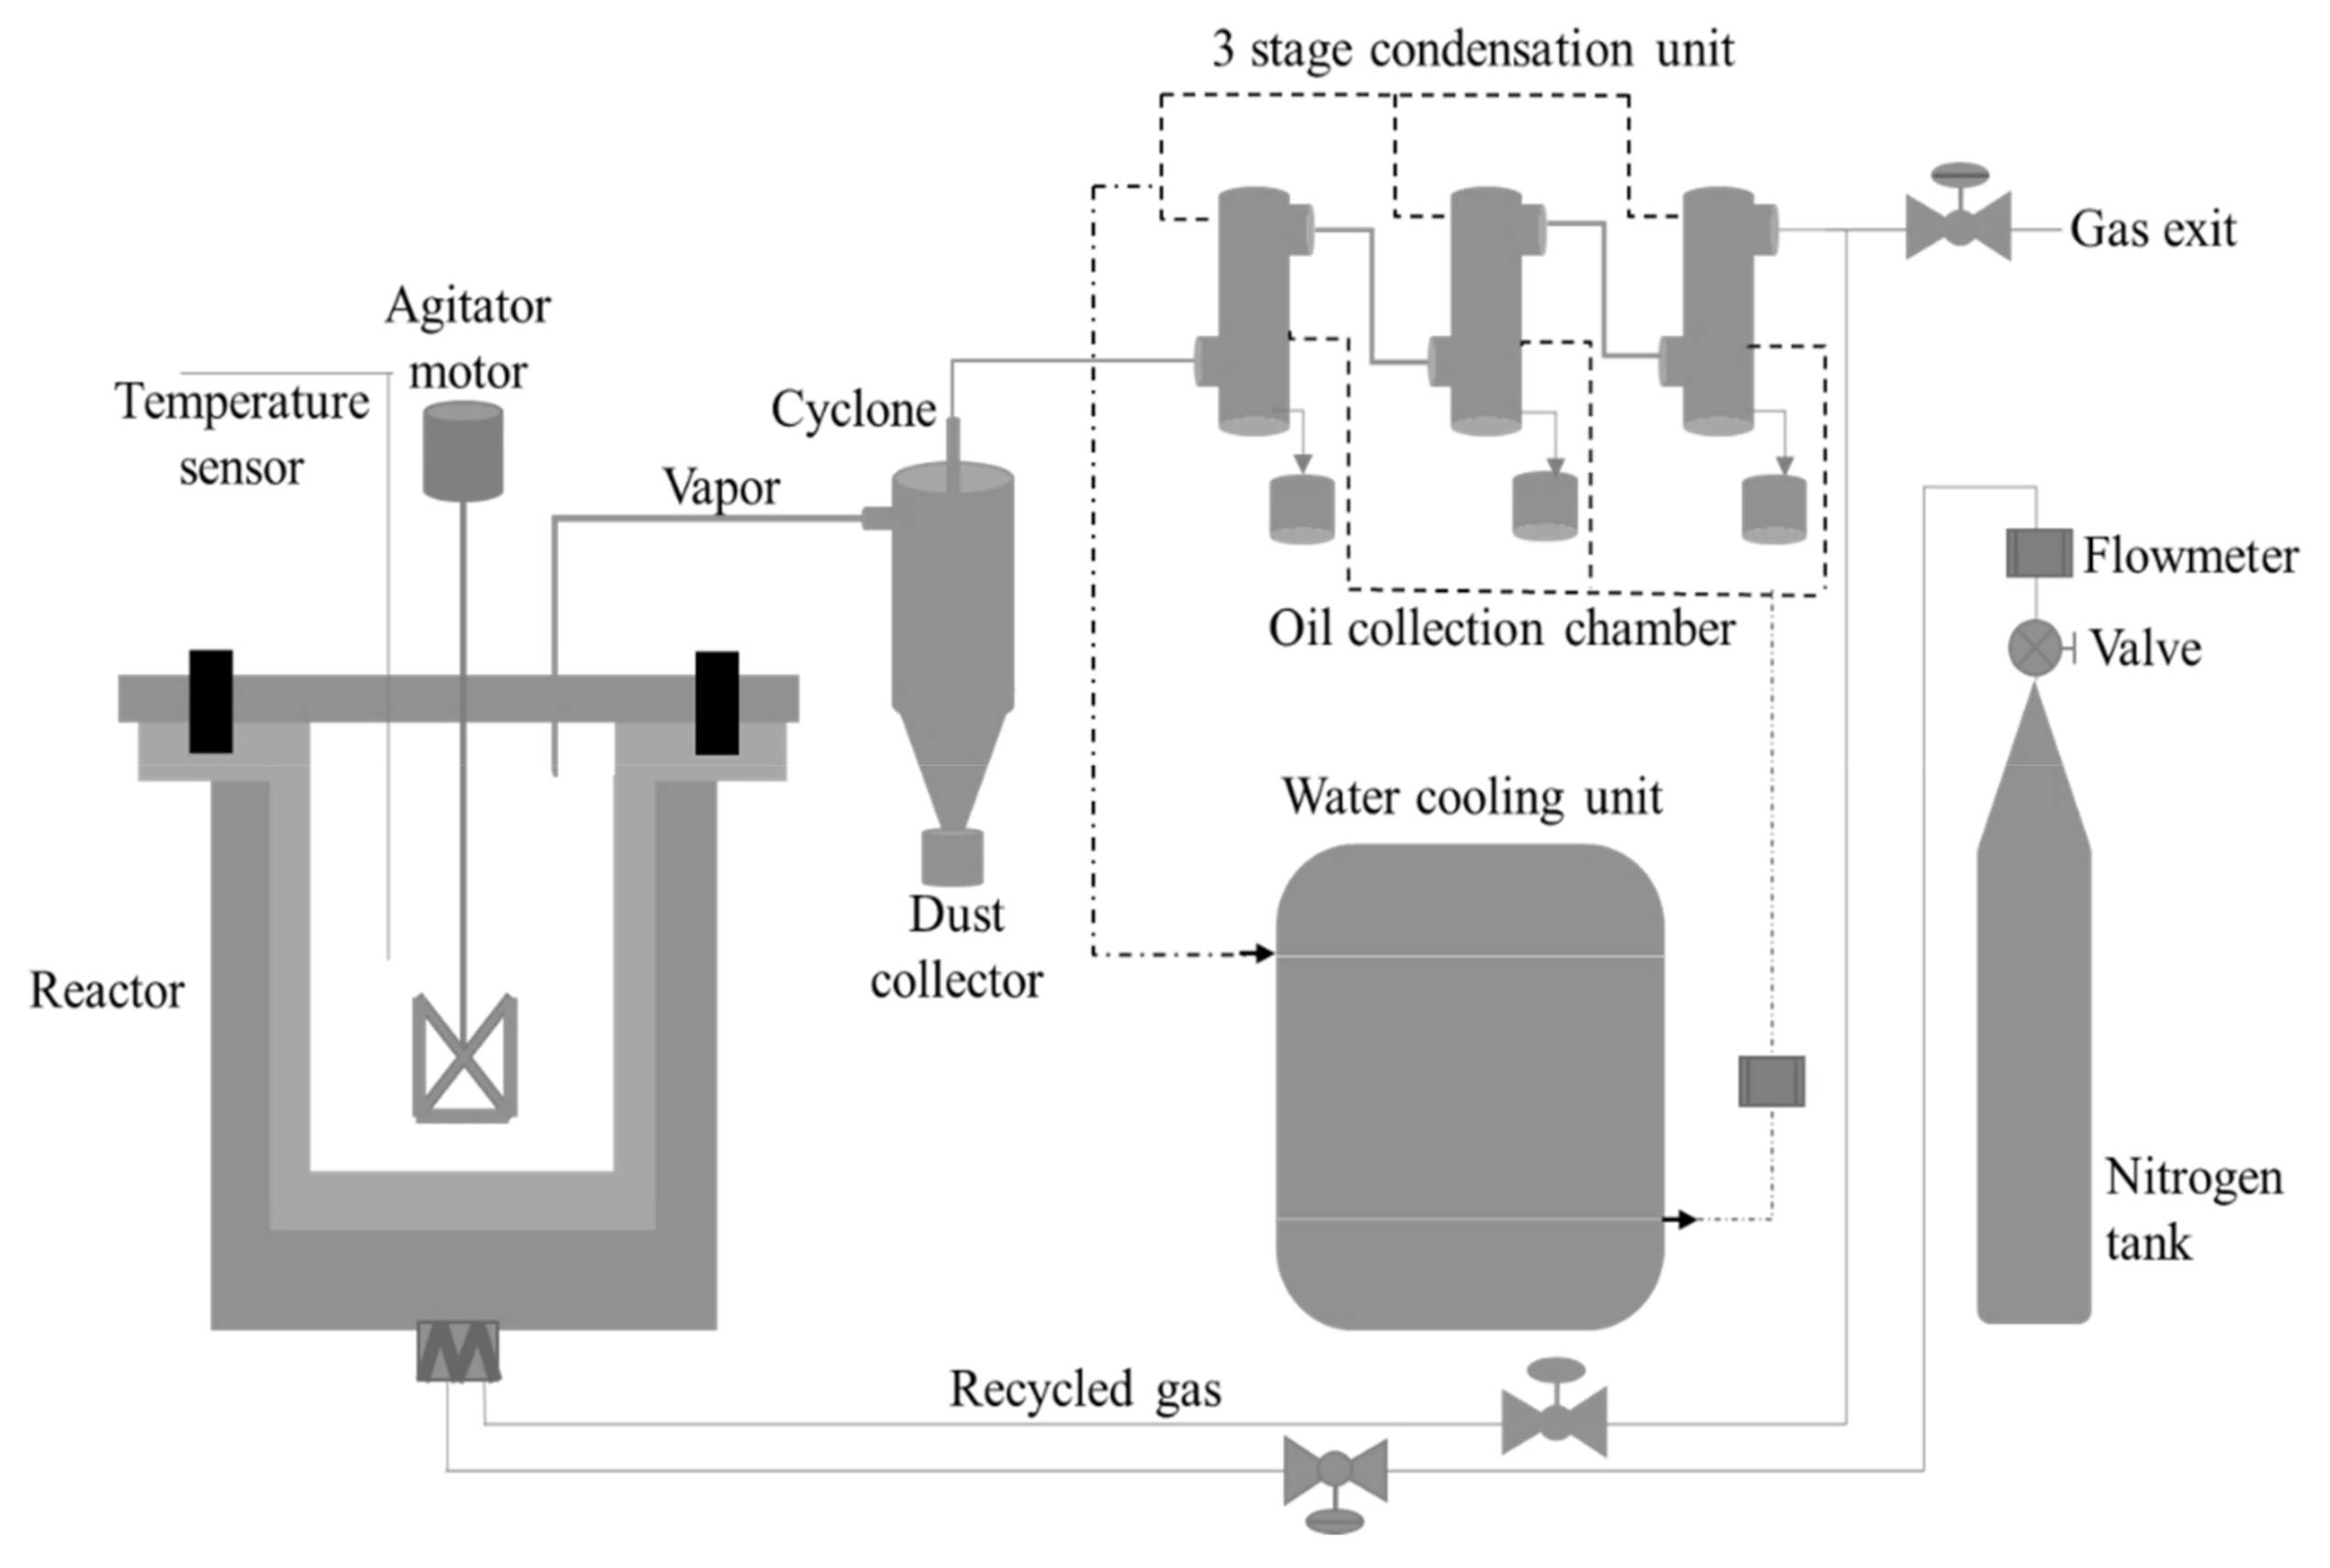
2.3. Experimental Setup

Figure 1 shows schematically the agitated bed pyrolysis system used in this work. The system consists of a reactor, proportional–integral–derivative (PID) controlled heating system, magnetic coupling driver operated with electrical motor, cyclone for char collection, 3-stage condensation unit, water cooling bath, and nitrogen gas supply system. The cylindrically shaped reactor was made from SUS316 stainless steel with 13 cm diameter, 15 cm height, and 5 mm thickness. A 3 kW electrical heater was used as the heat source for the reactor. K-type thermocouple probes were used to measure the temperature during the pyrolysis. The biomass feedstock inside the reactor was continuously stirred by a mixing blade attached to a magnetic coupling driver, which was controlled by an electrical motor (25 W, 4RK25GN-C, Zhengke Electromotor Co., Ltd., Zhejiang, China). N2 gas was supplied from the bottom of the reactor in a controlled manner. The vapors formed inside the reactor exited from the top of the reactor and entered the cyclone chamber. The solid particles were separated from the condensable pyrolysis vapors in the cyclone chamber, after which the vapors passed through a 3-stage series of shell-and-tube condensers. Cold water was supplied to the condensers from a cooling water bath, which could control the water temperature within 5–27 °C. The condensed liquid was collected in the collectors connected to the bottom of each condenser. The experimental setup used in this work was designed, implemented, and installed at the Prince of Songkla University, Hat Yai, Songkhla province, Thailand.

2.4. Experimental Procedure

The reaction chamber was preheated to 90 °C before feeding the samples in the reactor, to prevent initial thermal losses. A 100 g sample was filled into the reactor chamber from the top and continuously stirred by the mixing blade at a speed of 10 rpm. N2 gas was supplied to the reaction chamber at the rate of 2 L/min to maintain an inert atmosphere throughout the thermal decomposition of biomass. The biomass was partly converted into vapors in an inert atmosphere and condensed to liquid form in the collection chambers. Once the biomass temperature reached the highest treatment temperature (HTT), the N2 gas flow rate was increased to 5 L/min to prevent any secondary reactions. Vapors were condensed in the condensers by flowing cold water at 10 °C with a flow rate of 5 L/min. The biomass was pyrolyzed for 45 min in each experiment in order to maximize the thermal decomposition or biomass conversion. The condensable and incondensable vapors were collected in the forms of liquid and gaseous products, respectively. The biochar remained in the reaction chamber as solid residue. The yields of liquid product and biochar were directly determined by weighing. The yield of pyrolysis gas was evaluated by subtraction. The properties of the liquid product, biochar, and pyrolysis gas were analyzed.

2.5. Products Analyses

2.5.1. Determination of Liquid Product Properties

Basic Properties

The water content of the liquid product was determined by the Karl-Fisher volumetric technique using Metrohm 758 KFD Titrino instrument, Herisau, Switzerland. The pH of the sample was determined using UB-10 Denver Instrument (Vernon Hills, IL, USA) pH meter at room temperature [46]. The density was calculated based on standard procedure (ASTM D-4052) using a 25 mL density bottle [47,48]. The liquid product was treated to 775 °C, cooled, and weighed in order to find the ash content based on ASTM D-482 [46,48]. The solid content was measured using the technique of vacuum filtration. Three grams of bio-oil were mixed with ethanol and filtered through a pre-dried Whatman No. 2 filter paper. The filter paper with the solid residue was pre-dried for 15 min with ambient air and then dried for 30 min with hot air in an oven at 105 °C. The solid content was weighed and recorded as a mass ratio, after keeping the filter paper in a desiccator for 30 min (wt. %) [15,49].

Ultimate Analysis

The ultimate analysis determined carbon, hydrogen, nitrogen, and sulfur contents using a CHNS analyzer (Flash 2000, Thermo Scientific, Monza, Italy) following the standard procedures ASTM D-4239 and EN 15104 at the Office of Scientific Instruments and Testing (OSIT), Prince of Songkla University, Thailand. The HHV was calculated on a dry basis, as given in Table 1.

Gas Chromatography Mass Spectrometry (GC-MS)

A quadrupole detector and a DB-1MS capillary column (30 mm × 0.25 mm internal diameter × 0.25 μm thickness) were used on determining the chemical composition of the liquid product by gas chromatography–mass spectrometry (GC-MS) Agilent Technologies 5977A, Santa Clara, CL, USA). The initial temperature of the oven was set at 70 °C and held for 2 min, then increased to 250 °C at 5 °C/min and held for 10 min. The injector temperature was 250 °C. The injected sample volume (10% bio-oil in ethanol) was 1 μL. In the MS, full scan electron ionization (EI) was used, and standard mass spectra at 70 eV ionization energy were scanned from 35 to 550 m/z. Using the NIST14 and WILEY10 libraries, computer matching of the mass spectra was performed, and retention times of known species injected into the chromatographic column were used for peak identification.

2.5.2. Determination of Biochar Properties

Proximate Analysis, Ultimate Analysis, and Higher Heating Value (HHV)

The proximate analysis, ultimate analysis, and HHV were done as per the standards and procedures shown in Table 1.

Carbon Sequestration and Recalcitrance

The index R50 was used to evaluate the thermal recalcitrance of biochar. It can be obtained from TG analysis of biochar, as recently proposed by Harvey et al. [50]:
R 50 , biochar = T 50 , biochar T 50 , graphite
where T50,biochar and T50,graphite are the temperatures corresponding to 50% weight loss by oxidation/volatilization, for biochar and graphite, respectively. TG thermograms are corrected for water and ash content to obtain the temperatures directly. The final carbon retained in the solids is termed carbon sequestration (CS) potential. It is calculated by subtracting the carbon loss during pyrolysis from the initial C in raw biomass and multiplying by the recalcitrance (R50) of C in the biochar as follows.
CS % = M ( g ) × Yield ( % ) × C % Biochar × R 50 M ( g ) × C % Feedstock
where M is weight of the feedstock.

Ash Composition, Slagging and Fouling Indexes

The biomass samples were analyzed with an X-ray fluorescence spectrometer (Zetium, PANalytical, Eindhoven, The Netherlands). The chemical compositions were based on high-temperature ash analysis (normalized to 100 wt. %). The ashing of the biochar obtained from pyrolysis temperature of 550 °C was done at 825 °C for 3 h. The analysis was carried out using XRF to determine the oxides SiO2, Al2O3, Fe2O3, TiO2, CaO, MgO, K2O, Mn3O4, SO3, and Na2O. Slagging index (SI) and fouling index (FI) were estimated using Equations (4) and (5) [51]:
Slagging   index   SI   ( wt .   % ) = ( B / A ) × S d
Fouling   index   FI   ( wt .   % ) = B / A × ( Na 2 O + K 2 O )
where,
B / A = base / acid   ratio = wt .   % ( Fe 2 O 3   + CaO   +   MgO   +   Na 2 O   +   K 2 O ) wt .   % ( SiO 2   +   Al 2 O 3 + TiO 2 )
Sd = wt. % of sulfur in dry feedstock

Surface Morphology

The structure, morphology, and pore distribution on the surface of biochar were examined by scanning electron microscopy (SEM) (JSM-5800 LV, JEOL, Tokyo, Japan). Before SEM observations, all the samples were sputter coated with gold. Under high-vacuum conditions, the SEM used an acceleration voltage of 20 kV and a secondary electron detector (SE2) with a magnification of 500×. The working distance was 10–15 mm, and 1024 × 768 pixel images were recorded.

BET Surface Area

Brunauer–Emmett–Teller (BET) (ASAP2460, Micromeritics, GA, USA) analysis was used to determine the specific surface of biochar based on static volumetric N2 gas adsorption. Samples were pre-treated at temperature from 80 °C to 200 °C for 15 h under vacuum, and isothermal adsorption-desorption was fit with static volumetric model. Both the carrier gas and the adsorbed gas were N2. The pore volume was obtained using the multi-condensation-point adsorption isotherm (p/p0 = 0.05−0.03, >200 points). The pore structure was determined from the adsorption isotherm and the average pore width was estimated as 4 V/A, where the pore volume is “V” while “A” denotes its surface area.

3. Results

3.1. Characteristics of Raw Biomass

Initial characteristics of the raw samples are listed in Table 2. The physicochemical properties of the biomass influence the bio-product yields during the pyrolysis [1,2,3]. All the biomass samples tested had high volatile matter contents. RWS had the most volatile matter and the least ash, which should lead to a large liquid yield [4,5]. It was noted that the RWS had a greater fixed carbon content than OPT or OPF. The portion that can be converted into biochar is the fixed carbon in a biomass. Biomass with a high fixed carbon content is necessary for making biochar. The ultimate analysis results were consistent with the proximate analyses. The carbon and hydrogen contents of RSW and OPT were relatively high among typical biomasses (e.g., wheat straw, oak wood, corn stalk, corncob, rice husk, cassava rhizomes, cassava stalk, wood sawdust, bamboo, and birch wood) [1,6,7,8,9]. Biomass with high contents of carbon and hydrogen usually has high HHV and LHV [3,10]. The contents of nitrogen and sulfur in the biomasses tested were low. Low nitrogen and sulfur contents in a biomass help preventing partial formation of NOx and SOx during combustion of the biomass [3,11].
The bulk density was the least for OPF followed by OPT and RWS, and this is an essential parameter for designing the pyrolysis reactor. The mass of biomass in the reaction chamber directly affects the volume of biomass and thus the heat transfer during pyrolysis. The bulk density of a biomass also relates to its energy density (MJ/m3), storage space requirement, and costs of handling and transport [7,12,13]. TGA curve represents the thermal decomposition in four main stages, and also the decomposition trends of a lignocellulosic biomass containing cellulose, hemicellulose, and lignin. Initially, biomass weight decreases merely due to the evaporation of moisture, from 90 °C to 150 °C. In the second stage, there was a gradual decrease in the biomass weight possibly due to the evaporation of light volatile compounds, which lasted until 300 °C. Then the next stage comprised significant thermal decomposition of the biomass from 300 °C. to 550 °C. The last stage constituted prolonged decomposition of lignin, which is a tough compound to break down completely [14,15,16]. All feedstocks show similar trends in the TGA analysis, in Figure 2.

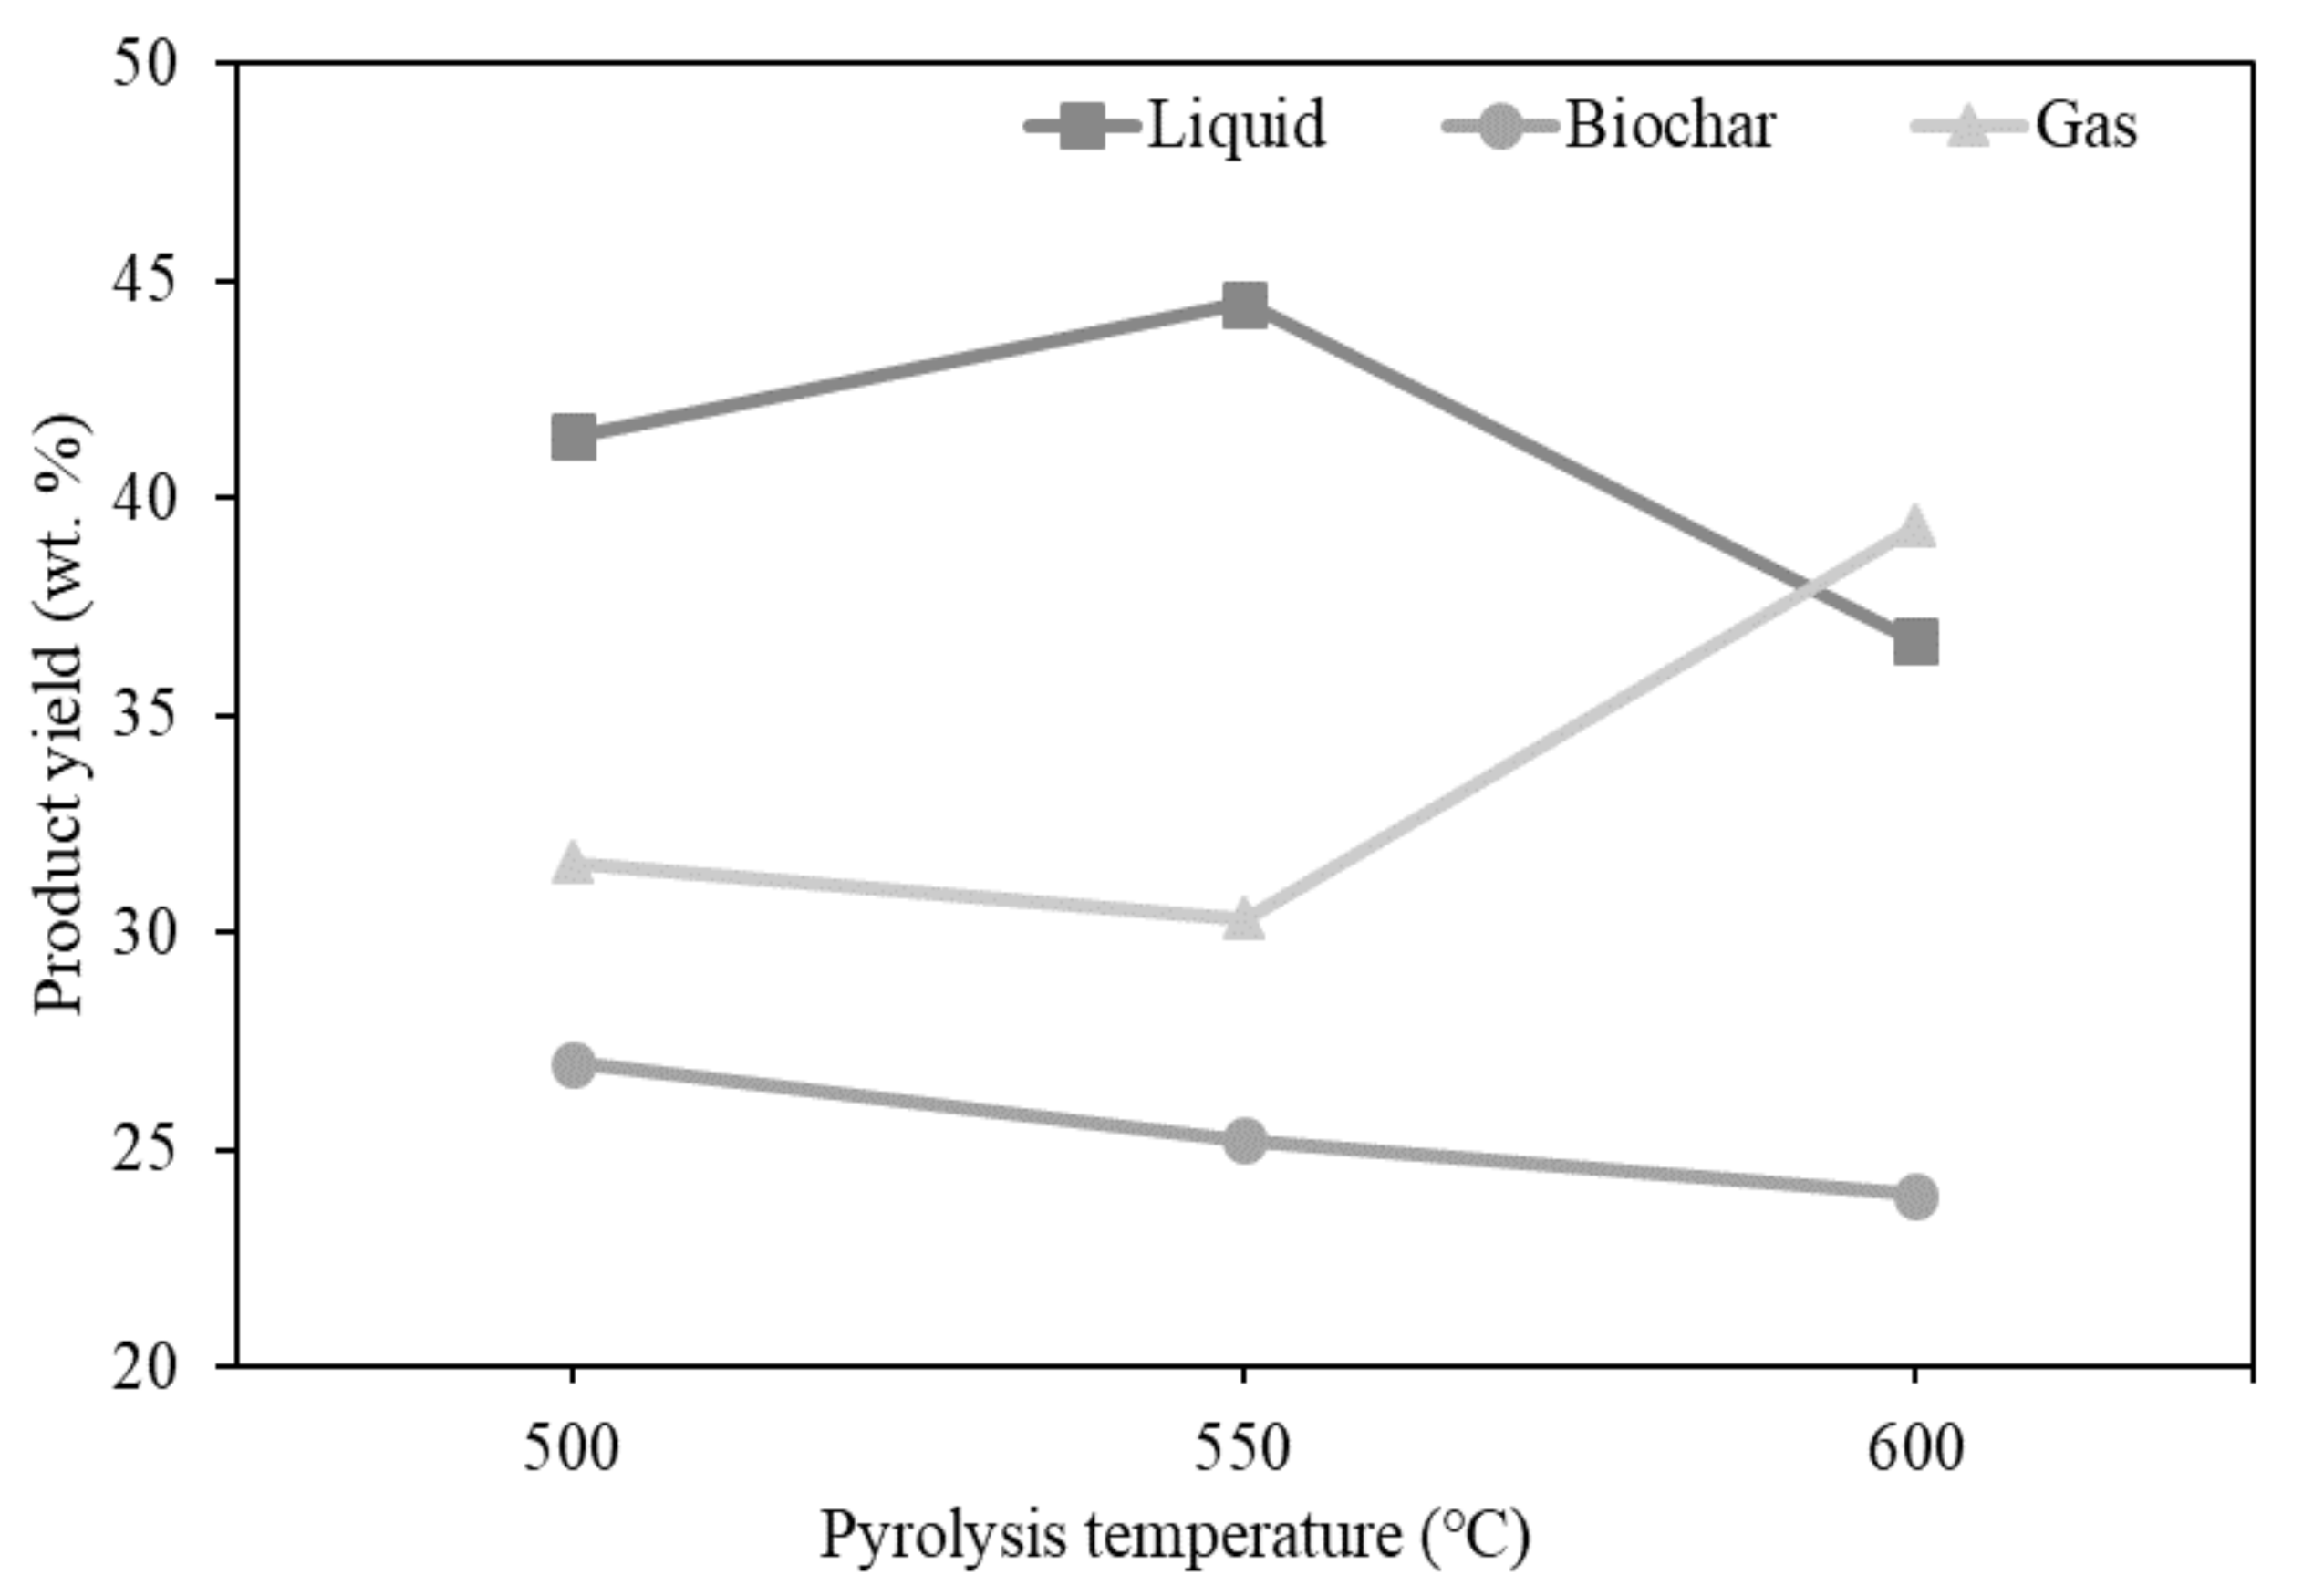
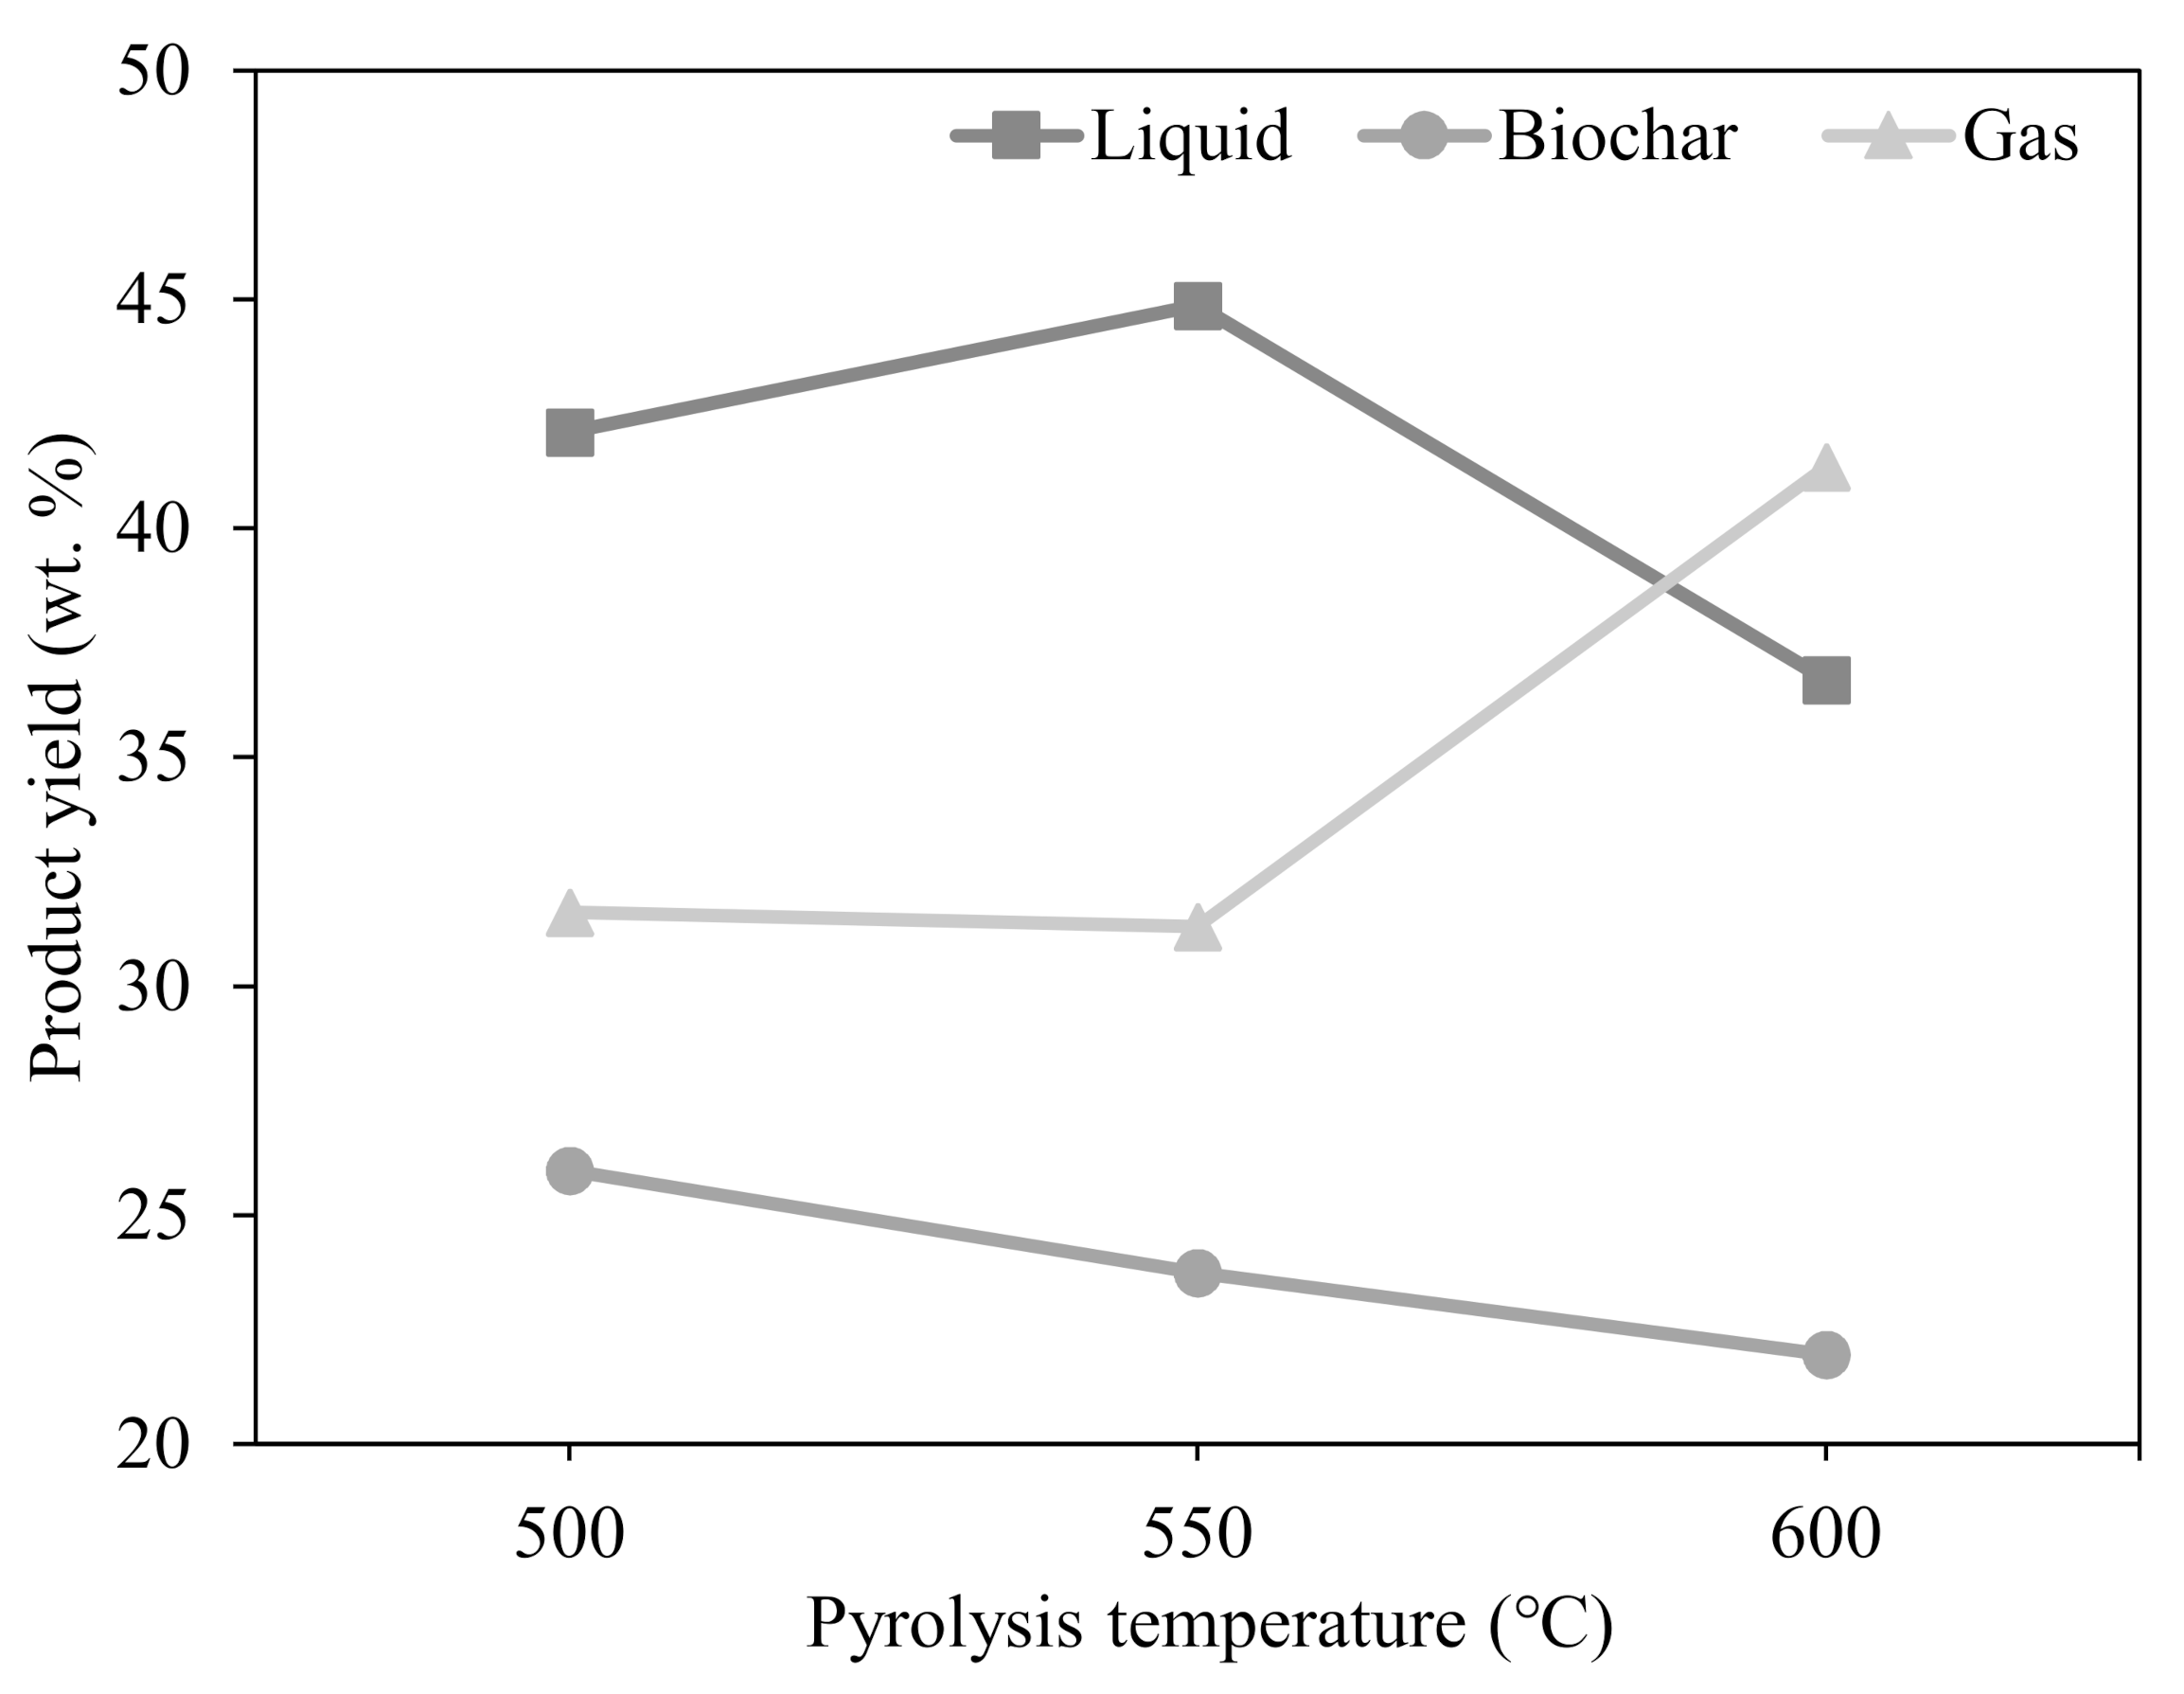
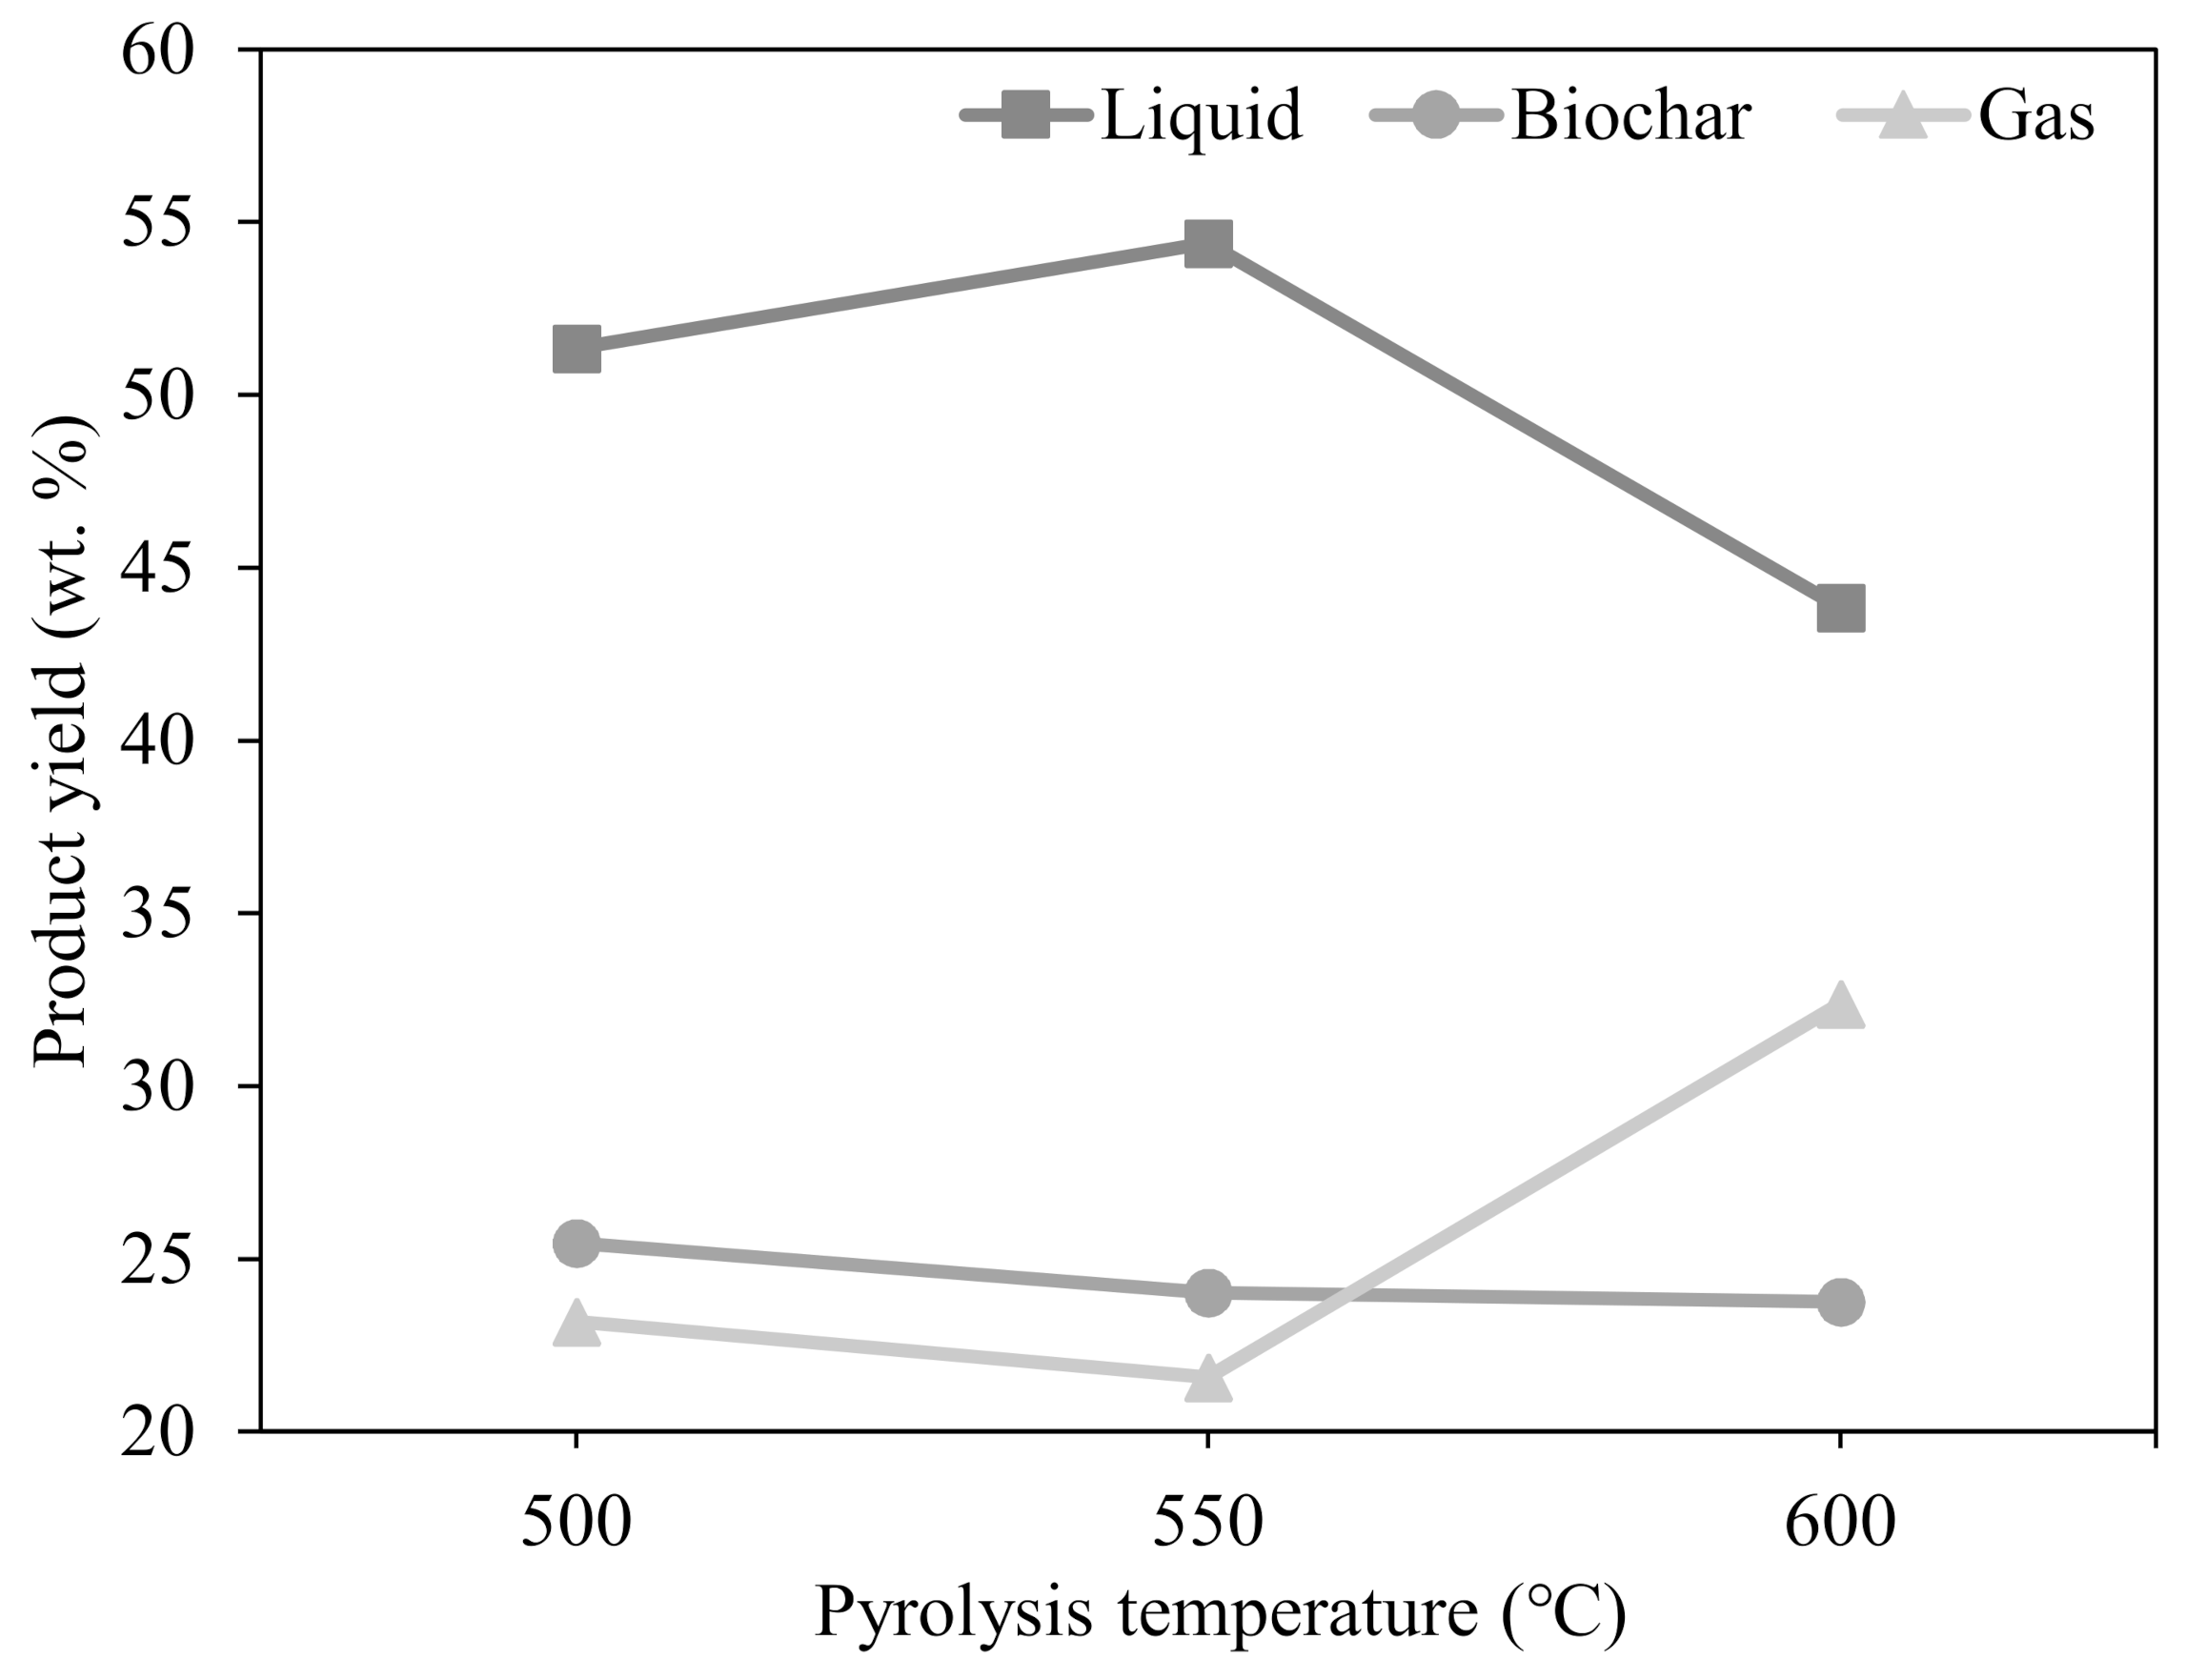
3.2. Effects of Temperature on Product Yields

The products obtained from OPT, OPF, and RWS in an agitated pyrolysis process at 500 °C, 550 °C, and 600 °C are shown in Figure 3, Figure 4 and Figure 5, respectively. The yields of liquid product, biochar, and pyrolysis gas were in the ranges 35.94–54.40% wt., 23.46–26.98% wt., and 21.58–40.60% wt., respectively. The RWS treated at 550 °C gave the most liquid at 54.40% by weight, while OPF and OPT treated at the same temperature provided 44.86% and 44.48% liquid by weight, respectively. Therefore, the quantity of liquid product depends upon the type of feedstock as well as on the treatment temperature. There is higher liquid yield from woody biomass than from non-woody biomass, because of thermal decomposition of the high cellulose and hemicellulose contents in woody biomass. The amount of liquid product increases with pyrolysis temperatures from 500 °C to 550 °C. However, a steep decrease in liquid yield was noticed when the temperature was further increased to 600 °C. This is possibly due to secondary reactions of the vapors from the biomass, which significantly reduced the yield of liquid product. A high yield of liquid product and a low yield of biochar from RWS are due to the low ash content of this woody biomass, which reduces the secondary reactions in the reaction chamber. It has been observed in prior studies that the inorganic compounds present in non-woody biomass (i.e., ash content) act as catalysts in biomass decomposition [5,15]. This is likely the reason for getting lesser liquid yields and more non-condensable gases compared to woody biomass [46,56,57,58,59,60,61,62,63]. However, previous studies have indicated that the bio-oil yield of pyrolysis depends not only on the composition and properties of the biomass, but also on the operating parameters and type of the reactor [48,63,64,65,66,67,68]. Using moving bed reactors, biomass pyrolysis at a high heating rate gave bio-oil production exceeding 47 (wt. %) [48,69]. In comparison to fixed bed reactors, biomass pyrolysis with moving bed reactors usually provides higher bio-oil yields [68,70].
On considering the effects of reaction temperature on bio-product yields, an increase in temperature leads to lower char yield and increased non-condensable gas yield. Similar results have been observed in many previous studies [5,47,52,70,71,72,73], irrespective of the type of biomass or the pyrolysis reactor type. The decrease in biochar product yield with increasing temperature was likely due to more initial decomposition of the lignocellulosic feedstock at a higher temperature and/or secondary degradation of char formed before it is extracted from the reaction zone. Secondary thermal cracking of the evolved vapors from pyrolysis of biomass was likely increasing gas yields at the higher temperatures. Therefore, the optimum temperature for the pyrolysis, to obtain the most liquid from either woody or non woody biomass, is 550 ± 10 °C. In comparison, biomass pyrolysis with a high fixed carbon content gives a high biochar yield. The highest biochar yield at 500 °C was obtained from OPT (25.98 wt. %) and the least from RWS (23.67 wt. %). The biochar yield decreased due to more thermal decomposition of lignocellulosic components when temperature was increased further [5]. The gas yield, however, showed the opposite pattern. It decreased on increasing temperature from 500 °C to 550 °C because the condensable gases were converted to bio-oil or liquid product. However, the gas yield increased at 600 °C probably because of the increased extent of secondary reactions inside the reactor at higher temperatures, which formed non condensable vapors. The highest and lowest yields of gas at 600 °C were 39.35 wt. % and 32.39 wt. % from OPT and RWS, respectively. The liquid could be used as a chemical feedstock or a low speed engine fuel [74,75] while the solid product (biochar) might be used as soil recalcitrant, absorbent, or co-firing fuel in boilers [76,77,78].

3.3. Physicochemical Properties of Products

Detailed analyses of the products are discussed in the next subsections.

3.3.1. Liquid Product

Water Content

The preliminary properties of liquid product obtained from pyrolysis of OPT, OPF, and RWS at 500 °C, 550 °C and 600 °C are shown in Table 3. The liquid product contains 52.89–72.84% (wt.) water. These results indicate that for OPT, OPF, and RWS, pyrolysis temperature significantly affected water content in the liquid product. The liquid product from RWS pyrolysis showed less water than those of OPT and OPF, because of the woody nature of RWS: It had the least initial moisture content in the biomass. The water content of the liquid product depends on the initial moisture and oxygen content in biomass, as concluded in prior studies. The reaction between the oxygen and hydrogen in the feedstock forms water that condenses into the liquid product [15,79]. The heating rate was around 20 °C/min (considered as slow pyrolysis), due to which the water content of liquid product is slightly high. Previous studies have shown results consistent with this current study, with water content in liquid product exceeding 50% (wt.) for slow pyrolysis [5,80,81]. Moreover, the water content in liquid product not only depends on the moisture content but is also influenced by pyrolysis conditions, such as vapor residence time and pyrolysis reaction temperature [5,45,82]. A high water content has both merits and demerits, as high water content in the liquid product helps reduce its viscosity and improves stability. Simultaneously, a high water content in the liquid product also reduces the HHV of the yield [83,84]. However, the water content can be reduced by fuel upgrading.

pH, Solids Content, Ash Content, and Density

The pH, solids content, ash content, and density of liquid product at different pyrolysis temperatures for OPT, OPF, and RWS are shown in Table 3. The pH of the liquid product was in the range 2.15–2.98. The acidic nature of bio-oil is due to oxidation of hydrocarbon groups in hemicellulose and cellulose. During the pyrolysis, volatile vapors released from the reaction chamber condensed into liquid product that might contain some lighter solid particles. In this study, there was very little solids content (less than 0.07% (wt.)) found in the liquid products, because of the high thermal decomposition of lignocellulosic biomass at high reaction temperatures. Fuels with solid contents less than 0.25% (wt.) are acceptable, however an ideal fuel would not contain any solids [85]. The liquid yield from RWS contains less ash than those from OPT and OPF. The ash content in the liquid product was in the range 0.02–0.09% (wt.), which is consistent with the solids’ contents. High ash content in a liquid fuel (the liquid pyrolysis product) can cause high wear in pumps and injectors, and deposits and corrosion in combustion equipment due to the possible presence of alkali metals [49]. The density of the liquid product was in the range 1,001–1,012 kg/m3. The normal range of densities of the liquid product from pyrolysis is 1,000–1,300 kg/m3 [86]. The density of the liquid product affects the energy value of the oil or fuel. As the density increases, the energy content also tends to increase.

Ultimate Analysis and Energy Content of the Liquid Product

The ultimate analyses of liquid products from OPT, OPF, and RWS are shown in Table 4. In the liquid products the contents of C, H, N, S, and O were in the ranges 13.75–26.54, 9.38–10.39, 0.12–0.24, <0.01, and 12.99–16.74 (wt. %), respectively. Pyrolysis of RWS provided a liquid product with higher contents of carbon and hydrogen than in those from OPT and OPF. The carbon content in liquid from woody biomass is higher for higher temperatures than from non-woody biomass, but the hydrogen content shows the opposite trend. This is possibly due to decarboxylation and dehydration reactions during the processing, involving breakage of bonds at high temperatures [87]. The sum of hydrogen and carbon contents in the liquid product was in the range 23.89–36.11% (wt.). The sum of hydrogen and carbon contents was higher for woody biomass because of the high cellulose content in RWS. The thermal decomposition of cellulose at higher temperatures gave more hydrogen and carbon in the liquid product [88]. The oxygen content is high because of slow exothermic decomposition of xylan, which leads to slow conversion of hemicellulose linkages into condensable vapors [52]. RWS possesses less oxygen than the other tested non-woody biomasses. The high hydrogen and carbon contents with a low oxygen content of bio-oil enhance fuel properties, especially by increasing HHV of the liquid product [5]. Regarding contents of nitrogen and sulphur, it was found that the liquid product contained low amounts of nitrogen and sulphur since the biomasses used in this study had low nitrogen and sulphur contents. Lower nitrogen and sulphur contents enable the liquid product from this work to be upgraded for value added applications. The HHV of bio-oil was in the range 12.19–22.32 MJ/kg when calculated on water free basis. The HHV of bio-oil from RWS is better than those from OPF and OPT. The HHV of bio-oils obtained in this study are comparable with prior studies, in which HHV has been within 17–28 MJ/kg [5,15,67,89]. The variations are due to differences in type of biomass, compositions of biomasses, and type of pyrolysis process. Moreover, the bio-oil HHVs in the studies done by Palamanit et al. [5] and Sakulkit et al. [15] that performed pyrolysis of oil palm biomass were in the range 16–23 MJ/kg.

Chemical Compounds

The GC-MS was also used to analyze the condensable compounds from pyrolysis at 550 °C in the liquid product for OPT, OPF, and RWS. It can be inferred from the results of GC-MS that the liquid products of pyrolysis are highly complex and consist of hundreds of different forms of organic compounds. Table 5 lists the major compounds and their peak area percentages for the liquid products obtained at 550 °C from OPT, OPF, and RWS. The results indicate that the main chemical compounds of the liquid product samples were oxygenated compounds such as phenols, phenol derivatives and anhydro-sugars. The biomass cellulose and hemicellulose could decompose into glucopyranoses (anhydro-sugars) and heterocyclic compounds (furan and furan derivatives, and acetic acid). From lignin, oxygenated aromatic compounds such as phenols and phenolic derivatives were devolatilized to the liquid product [67,90]. Anhydro-sugars are bicyclic monosaccharides with 1,6- and 1,5-anhydro rings for hexoses and 1,4- and 1,5-rings for pentoses, respectively, which are formed by thermochemical decomposition of monosaccharides or polysaccharides such as cellulose, hemicellulose, and amylose [91]. The presence of aromatic and oxygenated compounds in the liquid product is due to biomass biopolymer remnants from cellulose and hemicellulose in the liquid product. The lignin is hemicellulose-covalently bonded and polysaccharide-crosslinked and is thus extremely rigid and strong. In addition, lignin consists mostly of aromatic rings; the bio-oil derived from lignin is therefore rich in aromatic compounds. The results obtained from GC-MS are consistent with the elemental compositions of these biomasses and physicochemical characterizations of the liquid products.

3.3.2. Biochar

Proximate Analysis

Table 6 displays the proximate analysis results for the biochars from various pyrolysis temperatures of OPT, OPF, and RWS. The moisture content, volatile matter, fixed carbon content, and ash content of the biochars are within 3.74–4.61 wt. %, 10.25–16.16 wt. %, 71.69–76.70 wt. %, and 6.89–11.44 wt. %, respectively. It was observed that the moisture content of biochar was not zero after pyrolysis, matching results of the study conducted by Kabir et al. (2017), in which moisture content of biochar was in the range 3.06–4.42 wt. % [67]. However, the moisture content and volatile matter of biochar decreased with pyrolysis temperature. This is because the volatile matter changed to low molecular weight liquid and gas rather than biochar as the temperature increased [92]. There is a decreasing trend in volatile matter of biochar with pyrolysis temperature. This is because of the thermal decomposition of volatile matter present in the biomass to lower molecular weight liquid and gas components [92]. The volatile content is found to be in the range 10.25–16.16% (wt.), because of the complexity involved in thermal decomposition of lignin at low pyrolysis temperature. The high lignin content in the woody biomass results in more volatile matter in the biochar produced, in this study.
Less volatile matter gave a higher carbon content in the biochar. Biochar with high fixed carbon content is favorable for solid fuel applications because it has a high energy content [5,92,93]. High fixed carbon content of biochar also improves its storage stability compared to raw biomass, since biomass hemicellulose and cellulose contribute to microbial decomposition during storage [94]. OPT’s ash content was higher than those of RWS and OPF, which is consistent with the raw biomass gross proportions. The ash is a non-volatile matter and non-combustible part of biomass and biochar [95]. The increased ash content in biochar was attributed to destructive volatilization at higher pyrolysis temperatures of lignocellulosic components [96].

Ultimate Analysis and Energy Content

The elemental compositions of the biochar are shown in Table 7. The C, H, N, S and O contents of the biochars were in the ranges of 75.07–82.02 wt. %, 1.59–3.45 wt. %, 0.35–1.78 wt. %, 0.03–0.40 wt. % and 14.22–22.00 wt. %, respectively. The carbon content was lower for RWS and OPF than for OPT. Due to the extensive thermal decomposition at higher temperatures, the pyrolysis temperature had a strong impact on the biochar. Biomass pyrolysis provided biochar with a high carbon and a low oxygen content, close to the results of previous studies [68]. High pyrolysis temperature caused losses of hydrogen and oxygen by the cleavage of weak bonds in the biomass, or by dehydration and decarboxylation reactions [97]. Owing to the incorporation of nitrogen into complex structures that are heat resistant and not easily volatilized, the nitrogen and sulfur contents of the biochar were relatively low [98]. Biochar’s higher heating value (HHV) was in the range 26.42–29.33 MJ/kg, and RWS had a higher HHV than OPT or OPF. The higher carbon content and lower oxygen content of the biochar resulted in higher HHV, while the presence of elements C, H, and O in biomass resulted in higher levels of char formation [99]. High biochar HHV is suitable for solid fuel applications for both heat and power generation, as these properties help reduce airborne waste and energy losses [100].

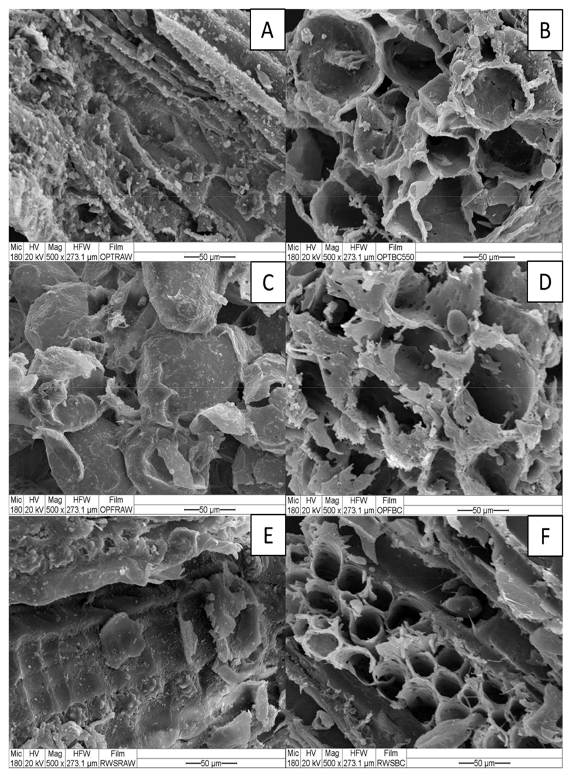
Surface Morphology and Specific Surface Area

Figure 6A–F shows the surface characteristics of the biomass and biochar derived from OPT, OPF, and RWS at a pyrolysis temperature of 550 °C. The surface of biomass samples was smooth without any ridges or pores in Figure 6A,C,E. Biochar formed by the pyrolysis process is shown in Figure 6B,D,F; many well-defined pores were created, probably by the volatilization of organic compounds [101]. Consequently, more void space and higher porosity are evident on the surfaces of the biochars. The biochar from RWS had more pores than those from OPT and OPF. The BET surface areas of biomasses and biochar samples prepared at 550 °C were determined and are shown in Table 8. At the high 500 °C temperature, the BET surface area of biochar was decreased from that of the biomass. The BET surface area of biochar from OPT was higher than those of biochars from RWS or OPF.
This is possibly due to the thermal decomposition of OPT biomass and also the woody nature of RWS. The TGA curve showed the weight loss percentage for OPT at 550 °C to decline more than that of RWS. The large pore size of biochar is caused by the progressive degradation of organic materials or lignocellulose content, including cellulose, hemicelluloses, and lignin. Also, high temperatures facilitated the release of volatile materials and created more pores, resulting in larger pores in the biochar [102]. Previous work has reported that when the heating rate was more than 10 °C/min, volatiles were formed inside the particles and released from the surface, which resulted in opened fiber structures leading with cavities, and this corresponded to a low BET surface area but a large pore diameter for the biochar when compared with the initial biomass [103]. High porosity of biochar is beneficial for bio-filter applications and soil mixing, and also for use as a solid fuel.

Recalcitrance and Stability

The functionality of atmospheric carbon sequestration in soil is crucially dependent on the ability of biochar to resist biotic and abiotic degradation (termed recalcitrance). The recalcitrant nature of biochar is evaluated by an index (R50) based on a model developed by Harvey et.al. (2012). The R50 index is based on the energy usage for thermal oxidation at 50% weight loss of biochar [50]. The temperatures at which R50 is calculated are obtained from water and ash content-corrected TG thermograms of biochar and were found in the range 422–476 °C for all the biochars of this study. The calculated R50 for biochar from all feedstocks fell in a range of 0.49–0.53. Previous studies showed that the recalcitrance of biochar is mainly determined by the pyrolysis temperature, as indicated in Table 9 [50,104]. Biochar recalcitrance is connected to aromatic C, which increases with pyrolysis temperature and N loss caused by the higher temperature pyrolysis [105]. The reaction temperature has dominating control of recalcitrant nature of biochar. Carbon sequestration potential (CS) was evaluated using the R50 index and carbon contents from the ultimate and proximate analyses. Lower pyrolysis temperature produces more char, but a large amount of biochar C will be abiotically or microbially mineralized because of its poor recalcitrance [104,106]. Pyrolysis temperatures past 550 °C on the other hand, generate less biochar, but the recalcitrance of biochar formed is higher than of biochar from lower pyrolysis temperature [107]. The C sequestration potential is primarily determined by the biomass feedstock’s intrinsic molecular structure, which may not be very varied [108]. The carbon sequestration capacity of the biochar for R50 > 0.7 is considered to be similar as those of graphite or soot [50]. The biochar obtained at 600 °C possessed higher capacity to sequestrate carbon, but the solid yield at 600 °C was found to be the least among all the experimental runs.

Ash Composition, and Slagging and Fouling Indexes of Biochar

K2O and SiO2 are viewed as the major oxide compounds influencing slacking index and fouling index. When comparing the magnitudes of these effects, K2O should be of more concern because of its outstanding concentration of over 20 wt. % (compared to around 18 wt. % of SiO2), which is also much higher than of the other compounds in Table 10. This is because K is a crucial nutrient in flowering fertilizers for fruit bearing palm plantations [109]. After burning, the K in ash can react to form KCl and K2SO4 with impurities present in the biochar, which will lower the ash melting temperature. This improves the adhesion of fly ash particles that would otherwise cause the formation of slag in boiler heat transfer sections [110,111]. The suggested categories by slagging index (SI) are slight (<0.6), moderate (0.6–2.0), high (2.0–2.6), and extremely high (>2.6) and for fouling index (FI) they are slight (<0.6), high (0.6–40), and extremely high (>40) [112]. While the biochars of this study have very high SI and Fi, they can be used as cofiring substances in combustion chambers. The high SiO2 contents in biochars from pyrolysis are possibly due to the comparatively heavier mass and more stable shape of silica oxide compared with the other mineral oxides [113]. For further use of biochar as co-firing fuel, addition of another high Si content biomass would benefit by lowering the tendency of slagging and fouling in the combustion chamber. Also, removal of potassium can be done to decrease slagging and fouling in combustion.

4. Conclusions

This study investigated yields and characteristics of liquid product and biochar obtained from pyrolysis of rubberwood sawdust (RWS), oil palm trunk (OPT), and oil palm frond (OPF) under various run conditions using an agitated bed pyrolysis reactor. The results indicate that the yields and characteristics of liquid product and biochar obtained from biomass samples vary widely. The yields of liquid product and biochar were in the ranges 35.94–54.40% and 23.46–25.98% (wt.), respectively. The highest liquid yield was obtained from pyrolysis of RWS at 550 °C. The energy content of the water-free liquid product or bio-oil was relatively low, due to the low carbon and hydrogen contents in the bio-oil. The results of GC-MS analysis showed high content of phenol groups in the liquid product. The biochars had high carbon contents (75.07–82.02%) and low oxygen contents (14.22–22%). Consequently, the higher heating values of biochars were high (26.42–29.33 MJ/kg). However, for solid fuel applications of biochar, particularly those from OPT and OPF have concerns regarding slagging and fouling, due to high contents of some oxides in biochar ashes as revealed by XRF. Aside for potential fuel applications, the biochars also have potential for use in carbon sequestration. The results also indicate that pyrolysis of biomass gave enlarged average pore diameters to the biochar, while its surface area was decreased from that of raw biomass, as revealed by BET and SEM.

Author Contributions

Conceptualization, methodology, experimentation, original draft preparation, P.S.; writing, proof reading, A.K.; supervision, P.T.; reviewing and editing, S.S.L.; conceptualization, visualization, investigation, writing, proof reading, A.P. All authors have read and agreed to the published version of the manuscript.

Funding

This research received no external funding.

Data Availability Statement

Not applicable.

Acknowledgments

The authors express their sincere appreciation to Graduate School, Prince of Songkla University, and Interdisciplinary Graduate School of Energy Systems (IGS-Energy), Prince of Songkla University, for partially financial support. The authors also thank to Energy Technology Research Centre, Faculty of Engineering, Prince of Songkla University, for partially financial support. This study was also supported by Office of Scientific Instrument and Testing (OSIT), Prince of Songkla University for testing the properties of biomass and products.

Conflicts of Interest

The authors declare no conflict of interest.

References

  1. British Petroleum Company. BP Statistical Review of World Energy. 2019. Available online: https://www.bp.com/content/dam/bp/business-sites/en/global/corporate/pdfs/energy-economics/statistical-review/bp-stats-review-2019-full-report.pdf (accessed on 16 September 2020).
  2. Kumar, A.; Kumar, N.; Baredar, P.; Shukla, A. A review on biomass energy resources, potential, conversion and policy in India. Renew. Sustain. Energy Rev. 2015, 45, 530–539. [Google Scholar] [CrossRef]
  3. Johnsson, F.; Kjärstad, J.; Rootzén, J. The threat to climate change mitigation posed by the abundance of fossil fuels. Clim. Policy 2019, 19, 258–274. [Google Scholar] [CrossRef] [Green Version]
  4. Rathore, D.; Nizami, A.-S.; Singh, A.; Pant, D. Key issues in estimating energy and greenhouse gas savings of biofuels: Challenges and perspectives. Biofuel Res. J. 2016, 3, 380–393. [Google Scholar] [CrossRef] [Green Version]
  5. Palamanit, A.; Khongphakdi, P.; Tirawanichakul, Y.; Phusunti, N. Investigation of yields and qualities of pyrolysis products obtained from oil palm biomass using an agitated bed pyrolysis reactor. Biofuel Res. J. 2019, 6, 1065–1079. [Google Scholar] [CrossRef] [Green Version]
  6. Davis, S.J.; Lewis, N.S.; Shaner, M.; Aggarwal, S.; Arent, D.; Azevedo, I.L.; Benson, S.M.; Bradley, T.; Brouwer, J.; Chiang, Y.-M.; et al. Net-zero emissions energy systems. Science 2018, 360, eaas9793. [Google Scholar] [CrossRef] [Green Version]
  7. Office of Agricultural Economics. Agricultural Statistics of Thailand. 2018. Available online: http://www.oae.go.th/view/1/Home/EN-US (accessed on 6 September 2020).
  8. Yusoff, S. Renewable energy from palm oil-innovation on effective utilization of waste. J. Clean. Prod. 2006, 14, 87–93. [Google Scholar] [CrossRef]
  9. Shuit, S.H.; Tan, K.T.; Lee, K.T.; Kamaruddin, A.H. Oil palm biomass as a sustainable energy source: A Malaysian case study. Energy 2009, 34, 1225–1235. [Google Scholar] [CrossRef] [Green Version]
  10. Sulaiman, F.; Abdullah, N.; Gerhauser, H.; Shariff, A. An outlook of Malaysian energy, oil palm industry and its utilization of wastes as useful resources. Biomass Bioenergy 2011. [Google Scholar] [CrossRef]
  11. Loh, S.K. The potential of the Malaysian oil palm biomass as a renewable energy source. Energy Convers. Manag. 2017, 141, 285–298. [Google Scholar] [CrossRef]
  12. Azwar, E.; Mahari, W.A.W.; Chuah, J.H.; Vo, D.-V.N.; Ma, N.L.; Lam, W.H.; Lam, S.S. Transformation of biomass into carbon nanofiber for supercapacitor application. A review. Int. J. Hydrogen Energy 2018, 43, 20811–20821. [Google Scholar] [CrossRef]
  13. Lam, S.S.; Su, M.H.; Nam, W.L.; Thoo, D.S.; Ng, C.M.; Liew, R.K.; Yek, P.N.Y.; Ma, N.L.; Vo, D.V.N. Microwave Pyrolysis with Steam Activation in Producing Activated Carbon for Removal of Herbicides in Agricultural Surface Water. Ind. Eng. Chem. Res. 2018, 58, 695–703. [Google Scholar] [CrossRef]
  14. Anwar, Z.; Gulfraz, M.; Irshad, M. Agro-industrial lignocellulosic biomass a key to unlock the future bio-energy: A brief review. J. Radiat. Res. Appl. Sci. 2014, 7, 163–173. [Google Scholar] [CrossRef]
  15. Sakulkit, P.; Palamanit, A.; Dejchanchaiwong, R.; Reubroycharoen, P. Characteristics of pyrolysis products from pyrolysis and co-pyrolysis of rubber wood and oil palm trunk biomass for biofuel and value-added applications. J. Environ. Chem. Eng. 2020, 8, 104561. [Google Scholar] [CrossRef]
  16. Shrivastava, P.; Khongphakdi, P.; Palamanit, A.; Kumar, A.; Tekasakul, P. Investigation of physicochemical properties of oil palm biomass for evaluating potential of biofuels production via pyrolysis processes. Biomass Convers. Biorefin. 2020, 1–15. [Google Scholar] [CrossRef]
  17. Pawar, A.; Panwar, N.L.; Salvi, B.L. Comprehensive review on pyrolytic oil production, upgrading and its utilization. J. Mater. Cycles Waste Manag. 2020, 22, 1712–1722. [Google Scholar] [CrossRef]
  18. Ronsse, F.; Van Hecke, S.; Dickinson, D.; Prins, W. Production and characterization of slow pyrolysis biochar: Influence of feedstock type and pyrolysis conditions. GCB Bioenergy 2012, 5, 104–115. [Google Scholar] [CrossRef]
  19. Abhijeet, P.; Swagathnath, G.; Rangabhashiyam, S.; Rajkumar, M.A.; Balasubramanian, P. Prediction of pyrolytic product composition and yield for various grass biomass feedstocks. Biomass Convers. Biorefin. 2020, 10, 663–674. [Google Scholar] [CrossRef]
  20. Kan, T.; Strezov, V.; Evans, T.J. Lignocellulosic biomass pyrolysis: A review of product properties and effects of pyrolysis parameters. Renew. Sustain. Energy Rev. 2016, 57, 1126–1140. [Google Scholar] [CrossRef]
  21. Foong, S.Y.; Liew, R.K.; Yang, Y.; Cheng, Y.W.; Yek, P.N.Y.; Mahari, W.A.W.; Lee, X.Y.; Han, C.S.; Vo, D.-V.N.; Van Le, Q.; et al. Valorization of biomass waste to engineered activated biochar by microwave pyrolysis: Progress, challenges, and future directions. Chem. Eng. J. 2020, 389, 124401. [Google Scholar] [CrossRef]
  22. Wang, D.; Jiang, P.; Zhang, H.; Yuan, W. Biochar production and applications in agro and forestry systems: A review. Sci. Total Environ. 2020, 723, 137775. [Google Scholar] [CrossRef] [PubMed]
  23. Veiga, T.R.L.A.; Lima, J.T.; Dessimoni, A.L.D.A.; Pego, M.F.F.; Soares, J.R.; Trugilho, P.F. Different Plant Biomass Characterizations for Biochar Production. Cerne 2017, 23, 529–536. [Google Scholar] [CrossRef] [Green Version]
  24. Rueangsan, K.; Suwapaet, N.; Pattiya, A. Bio-oil production by fast pyrolysis of cassava residues in a free-fall reactor using liquid media-assisted condensation. Energy Sources Part. A Recover. Util. Environ. Eff. 2018, 40, 615–622. [Google Scholar] [CrossRef]
  25. Güngör, A.; Önenç, S.; Uçar, S.; Yanik, J. Comparison between the “one-step” and “two-step” catalytic pyrolysis of pine bark. J. Anal. Appl. Pyrolysis 2012, 97, 39–48. [Google Scholar] [CrossRef]
  26. Kilic, M.; Pütün, E.; Pütün, A.E.; Kılıç, M. Optimization of Euphorbia rigida fast pyrolysis conditions by using response surface methodology. J. Anal. Appl. Pyrolysis 2014, 110, 163–171. [Google Scholar] [CrossRef]
  27. Oni, B.A.; Oziegbe, O.; Olawole, O.O. Significance of biochar application to the environment and economy. Ann. Agric. Sci. 2019, 64, 222–236. [Google Scholar] [CrossRef]
  28. Czernik, S.; Bridgwater, A.V. Overview of Applications of Biomass Fast Pyrolysis Oil. Energy Fuels 2004, 18, 590–598. [Google Scholar] [CrossRef]
  29. Jahirul, M.I.; Rasul, M.G.; Chowdhury, A.A.; Ashwath, N. Biofuels Production through Biomass Pyrolysis—A Technological Review. Energies 2012, 5, 4952–5001. [Google Scholar] [CrossRef]
  30. Biswas, B.; Pandey, N.; Bisht, Y.; Singh, R.; Kumar, J.; Bhaskar, T. Pyrolysis of agricultural biomass residues: Comparative study of corn cob, wheat straw, rice straw and rice husk. Bioresour. Technol. 2017, 237, 57–63. [Google Scholar] [CrossRef]
  31. Mahari, W.A.W.; Zainuddin, N.F.; Chong, C.T.; Lee, C.L.; Lam, W.H.; Poh, S.C.; Lam, S.S. Conversion of waste shipping oil into diesel-like oil via microwave-assisted pyrolysis. J. Environ. Chem. Eng. 2017, 5, 5836–5842. [Google Scholar] [CrossRef]
  32. Kong, S.; Lam, S.S.; Yek, P.N.Y.; Liew, R.K.; Ma, N.L.; Osman, M.S.; Wong, C.C. Self-purging microwave pyrolysis: An innovative approach to convert oil palm shell into carbon-rich biochar for methylene blue adsorption. J. Chem. Technol. Biotechnol. 2019, 94, 1397–1405. [Google Scholar] [CrossRef]
  33. Abnisa, F.; Daud, W.M.A.W. A review on co-pyrolysis of biomass: An optional technique to obtain a high-grade pyrolysis oil. Energy Convers. Manag. 2014, 87, 71–85. [Google Scholar] [CrossRef]
  34. Mohammed, I.Y.; Abakr, Y.A.; Hui, J.N.X.; Alaba, P.A.; Morris, K.I.; Ibrahim, M.D. Recovery of clean energy precursors from Bambara groundnut waste via pyrolysis: Kinetics, products distribution and optimisation using response surface methodology. J. Clean. Prod. 2017, 164, 1430–1445. [Google Scholar] [CrossRef]
  35. Sareekam, N.; Kamarudin, S.K.; Kasmuri, N.H. Optimization of Bio Oil from Palm Oil Fronds Via Fast Pyrolysis. Indian J. Sci. Technol. 2016, 9. [Google Scholar] [CrossRef] [Green Version]
  36. Asadullah, M.; Ab Rasid, N.S.; Kadir, S.A.S.A.; Azdarpour, A. Production and detailed characterization of bio-oil from fast pyrolysis of palm kernel shell. Biomass Bioenergy 2013, 59, 316–324. [Google Scholar] [CrossRef]
  37. Ruengvilairat, P.; Tanatavikorn, H.; Vitidsant, T. Bio-Oil Production by Pyrolysis of Oil Palm Empty Fruit Bunch in Nitrogen and Steam Atmospheres. J. Sustain. Bioenergy Syst. 2012, 2, 75–85. [Google Scholar] [CrossRef] [Green Version]
  38. Mao, Y.; Dong, L.; Dong, Y.; Liu, W.; Chang, J.; Yang, S.; Lv, Z.; Fan, P. Fast co-pyrolysis of biomass and lignite in a micro fluidized bed reactor analyzer. Bioresour. Technol. 2015, 181, 155–162. [Google Scholar] [CrossRef] [PubMed]
  39. Imran, A.; Bramer, E.A.; Seshan, K.; Brem, G. An overview of catalysts in biomass pyrolysis for production of biofuels. Biofuel Res. J. 2018, 5, 872–885. [Google Scholar] [CrossRef] [Green Version]
  40. Chen, J.; Liang, J.; Wu, S. Lignin-rich biomass of cotton by-products for biorefineries via pyrolysis. Bioresour. Technol. 2016, 218, 402–409. [Google Scholar] [CrossRef]
  41. Wang, Y.; Zeng, Z.; Tian, X.; Dai, L.; Jiang, L.; Zhang, S.; Wu, Q.; Wen, P.; Fu, G.; Liu, Y.; et al. Production of bio-oil from agricultural waste by using a continuous fast microwave pyrolysis system. Bioresour. Technol. 2018, 269, 162–168. [Google Scholar] [CrossRef]
  42. Guedes, R.E.; Luna, A.S.; Torres, A.R. Operating parameters for bio-oil production in biomass pyrolysis: A review. J. Anal. Appl. Pyrolysis 2018, 129, 134–149. [Google Scholar] [CrossRef]
  43. Leng, L.; Huang, H. An overview of the effect of pyrolysis process parameters on biochar stability. Bioresour. Technol. 2018, 270, 627–642. [Google Scholar] [CrossRef]
  44. Kurnia, J.C.; Jangam, S.V.; Akhtar, S.; Sasmito, A.; Mujumdar, A.S. Advances in biofuel production from oil palm and palm oil processing wastes: A review. Biofuel Res. J. 2016, 3, 332–346. [Google Scholar] [CrossRef]
  45. Guda, V.K.; Toghiani, H. Altering bio-oil composition by catalytic treatment of pinewood pyrolysis vapors over zeolites using an auger-packed bed integrated reactor system. Biofuel Res. J. 2016, 3, 448–457. [Google Scholar] [CrossRef] [Green Version]
  46. Pattiya, A. Bio-oil production via fast pyrolysis of biomass residues from cassava plants in a fluidised-bed reactor. Bioresour. Technol. 2011, 102, 1959–1967. [Google Scholar] [CrossRef]
  47. Sirijanusorn, S.; Sriprateep, K.; Pattiya, A. Pyrolysis of cassava rhizome in a counter-rotating twin screw reactor unit. Bioresour. Technol. 2013, 139, 343–348. [Google Scholar] [CrossRef]
  48. Sukiran, M.A.; Loh, S.K.; Bakar, N.A. Production of Bio-oil from Fast Pyrolysis of Oil Palm Biomass using Fluidised Bed Reactor. J. Energy Technol. Policy 2016, 6, 52–62. [Google Scholar]
  49. Oasmaa, A.; Peacocke, C. A Guide to Physical Property Characterisation of Biomass-Derived Fast Pyrolysis Liquids; Technical Research Centre of Finland, Bergsmansgården: Espoo, Finland, 2001. [Google Scholar]
  50. Harvey, O.R.; Kuo, L.-J.; Zimmerman, A.R.; Louchouarn, P.; Amonette, J.E.; Herbert, B.E. An Index-Based Approach to Assessing Recalcitrance and Soil Carbon Sequestration Potential of Engineered Black Carbons (Biochars). Environ. Sci. Technol. 2012, 46, 1415–1421. [Google Scholar] [CrossRef]
  51. Tan, C.; Saritpongteeraka, K.; Kungsanant, S.; Charnnok, B.; Chaiprapat, S. Low temperature hydrothermal treatment of palm fiber fuel for simultaneous potassium removal, enhanced oil recovery and biogas production. Fuel 2018, 234, 1055–1063. [Google Scholar] [CrossRef]
  52. Pattiya, A.; Suttibak, S. Production of bio-oil via fast pyrolysis of agricultural residues from cassava plantations in a fluidised-bed reactor with a hot vapour filtration unit. J. Anal. Appl. Pyrolysis 2012, 95, 227–235. [Google Scholar] [CrossRef]
  53. McKendry, P. Energy production from biomass (part 2): Conversion technologies. Bioresour. Technol. 2002, 83, 47–54. [Google Scholar] [CrossRef]
  54. Mishra, R.K.; Mohanty, K. Pyrolysis kinetics and thermal behavior of waste sawdust biomass using thermogravimetric analysis. Bioresour. Technol. 2018, 251, 63–74. [Google Scholar] [CrossRef] [PubMed]
  55. Widjaya, E.R.; Chen, G.; Bowtell, L.; Hills, C. Gasification of non-woody biomass: A literature review. Renew. Sustain. Energy Rev. 2018, 89, 184–193. [Google Scholar] [CrossRef] [Green Version]
  56. Pattiya, A.; Suttibak, S. Influence of a glass wool hot vapour filter on yields and properties of bio-oil derived from rapid pyrolysis of paddy residues. Bioresour. Technol. 2012, 116, 107–113. [Google Scholar] [CrossRef]
  57. Uzun, B.B.; Varol, E.A.; Pütün, E. Pyrolysis: A Sustainable Way from Biomass to Biofuels and Biochar. In Biochar; Amsterdam University Press: Amsterdam, The Netherlands, 2016; pp. 239–265. [Google Scholar]
  58. Mishra, R.K.; Mohanty, K. Pyrolysis characteristics, fuel properties, and compositional study of Madhuca longifolia seeds over metal oxide catalysts. Biomass Convers. Biorefin. 2020. [Google Scholar] [CrossRef]
  59. Brar, J.S.; Singh, K.B.; Wang, J.; Kumar, S. Cogasification of Coal and Biomass: A Review. Int. J. For. Res. 2012, 2012, 1–10. [Google Scholar] [CrossRef] [Green Version]
  60. McKendry, P. Energy production from biomass (part 1): Overview of biomass. Bioresour. Technol. 2002, 83, 37–46. [Google Scholar] [CrossRef]
  61. Quan, C.; Gao, N.; Song, Q. Pyrolysis of biomass components in a TGA and a fixed-bed reactor: Thermo-chemical behaviors, kinetics, and product characterization. J. Anal. Appl. Pyrolysis 2016, 121, 84–92. [Google Scholar] [CrossRef]
  62. Basu, P. Analytical Techniques. Biomass Gasif. Pyrolysis Torrefaction 2018, 479–495. [Google Scholar] [CrossRef]
  63. Huang, X.; Cao, J.-P.; Zhao, X.-Y.; Wang, J.-X.; Fan, X.; Zhao, Y.-P.; Wei, X.-Y. Pyrolysis kinetics of soybean straw using thermogravimetric analysis. Fuel 2016, 169, 93–98. [Google Scholar] [CrossRef]
  64. Das, P.; Ganesh, A.; Wangikar, P. Influence of pretreatment for deashing of sugarcane bagasse on pyrolysis products. Biomass Bioenergy 2004, 27, 445–457. [Google Scholar] [CrossRef]
  65. Fahmi, R.; Bridgwater, A.; Darvell, L.; Jones, J.; Yates, N.; Thain, S.; Donnison, I. The effect of alkali metals on combustion and pyrolysis of Lolium and Festuca grasses, switchgrass and willow. Fuel 2007, 86, 1560–1569. [Google Scholar] [CrossRef]
  66. Müller-Hagedorn, M.; Bockhorn, H.; Krebs, L.; Müller, U. A comparative kinetic study on the pyrolysis of three different wood species. J. Anal. Appl. Pyrolysis 2003, 69, 231–249. [Google Scholar] [CrossRef]
  67. Kabir, G.; Din, A.M.; Hameed, B. Pyrolysis of oil palm mesocarp fiber and palm frond in a slow-heating fixed-bed reactor: A comparative study. Bioresour. Technol. 2017, 241, 563–572. [Google Scholar] [CrossRef]
  68. Bensidhom, G.; Ben Hassen-Trabelsi, A.; Alper, K.; Sghairoun, M.; Zaafouri, K.; Trabelsi, I. Pyrolysis of Date palm waste in a fixed-bed reactor: Characterization of pyrolytic products. Bioresour. Technol. 2018, 247, 363–369. [Google Scholar] [CrossRef] [PubMed]
  69. Madhu, P.; Livingston, T.S.; Kanagasabapathy, H. Flash Pyrolysis of Lemon Grass (Cymbopogon flexuosus) for Bio-oil Production in an Electrically Heated Fluidized Bed Reactor. Waste Biomass Valorization 2017, 9, 1037–1046. [Google Scholar] [CrossRef]
  70. Şensöz, S.; Can, M. Pyrolysis of Pine (Pinus brutia Ten.) Chips: 1. Effect of Pyrolysis Temperature and Heating Rate on the Product Yields. Energy Sources 2002, 24, 347–355. [Google Scholar] [CrossRef]
  71. Tsai, W.T.; Lee, M.K.; Chang, Y.M. Fast pyrolysis of rice straw, sugarcane bagasse and coconut shell in an induction-heating reactor. J. Anal. Appl. Pyrolysis 2006, 76, 230–237. [Google Scholar] [CrossRef]
  72. Lee, Y.; Park, J.; Ryu, C.; Gang, K.S.; Yang, W.; Park, Y.-K.; Jung, J.; Hyun, S. Comparison of biochar properties from biomass residues produced by slow pyrolysis at 500 °C. Bioresour. Technol. 2013, 148, 196–201. [Google Scholar] [CrossRef]
  73. Sokoto, M.A.; Biswas, B.; Kumar, J.; Bhaskar, T. Slow pyrolysis of Defatted Seeds Cakes of African star apple and silk cotton for production of bio-oil. Renew. Energy 2020, 146, 1710–1716. [Google Scholar] [CrossRef]
  74. Callegari, A.; Bolognesi, S.; Cecconet, D.; Capodaglio, A.G. Production technologies, current role, and future prospects of biofuels feedstocks: A state-of-the-art review. Crit. Rev. Environ. Sci. Technol. 2020, 50, 384–436. [Google Scholar] [CrossRef]
  75. Sukumar, V.; Manieniyan, V.; Senthilkumar, R.; Sivaprakasam, S. Production of bio oil from sweet lime empty fruit bunch by pyrolysis. Renew. Energy 2020, 146, 309–315. [Google Scholar] [CrossRef]
  76. Kappler, G.; De Souza, D.M.; Moraes, C.A.M.; Modolo, R.C.E.; Brehm, F.A.; Wander, P.R.; da Cruz Tarelho, L.A. Conversion of Lignocellulosic Biomass Through Pyrolysis to Promote a Sustainable Value Chain for Brazilian Agribusiness. In Lignocellulosic Biorefining Technologies; Wiley: Hoboken, NJ, USA, 2020; pp. 265–283. [Google Scholar]
  77. Azni, A.A.; Ghani, W.A.W.A.K.; Idris, A.; Ja’Afar, M.F.Z.; Salleh, M.A.M.; Ishak, N.S. Microwave-assisted pyrolysis of EFB-derived biochar as potential renewable solid fuel for power generation: Biochar versus sub-bituminous coal. Renew. Energy 2019, 142, 123–129. [Google Scholar] [CrossRef]
  78. Maguyon-Detras, M.C.; Migo, M.V.P.; Van Hung, N.; Gummert, M. Thermochemical Conversion of Rice Straw. In Sustainable Rice Straw Management; Springer: Cham, Switzerland, 2019; pp. 43–64. [Google Scholar]
  79. Pimenidou, P.; Dupont, V. Characterisation of palm empty fruit bunch (PEFB) and pinewood bio-oils and kinetics of their thermal degradation. Bioresour. Technol. 2012, 109, 198–205. [Google Scholar] [CrossRef] [PubMed] [Green Version]
  80. Chen, T.; Wu, C.; Liu, R.; Fei, W.; Liu, S. Effect of hot vapor filtration on the characterization of bio-oil from rice husks with fast pyrolysis in a fluidized-bed reactor. Bioresour. Technol. 2011, 102, 6178–6185. [Google Scholar] [CrossRef] [PubMed]
  81. Gómez, N.; Banks, S.; Nowakowski, D.; Rosas, J.; Cara, J.; Sánchez, M.; Bridgwater, A. Effect of temperature on product performance of a high ash biomass during fast pyrolysis and its bio-oil storage evaluation. Fuel Process. Technol. 2018, 172, 97–105. [Google Scholar] [CrossRef] [Green Version]
  82. Odetoye, T.E.; Onifade, K.R.; Abubakar, M.S.; Titiloye, J.O. Pyrolysis of Parinari polyandra Benth fruit shell for bio-oil production. Biofuel Res. J. 2014, 1, 85–90. [Google Scholar] [CrossRef]
  83. Zhang, W.; Yuan, C.; Xu, J.; Yang, X. Beneficial synergetic effect on gas production during co-pyrolysis of sewage sludge and biomass in a vacuum reactor. Bioresour. Technol. 2015, 183, 255–258. [Google Scholar] [CrossRef]
  84. Bardalai, M.; Mahanta, D. Characterisation of Biochar Produced by Pyrolysis from Areca Catechu Dust. Mater. Today Proc. 2018, 5, 2089–2097. [Google Scholar] [CrossRef]
  85. Oasmaa, A.; Elliott, D.; Muller, S. Quality control in fast pyrolysis bio-oil production and use. Environ. Prog. Sustain. Energy 2009, 28, 404–409. [Google Scholar] [CrossRef]
  86. Feng, F.; Liu, W.Y.; Chen, Y.S. Study on derivatives of gambogic acid. J. China Pharm. Univ. 2005, 36, 302–305. [Google Scholar]
  87. Akhtar, J.; Amin, N.S. A review on operating parameters for optimum liquid oil yield in biomass pyroly-sis. Renew. Sustain. Energy Rev. 2012, 16, 5101–5109. [Google Scholar] [CrossRef]
  88. Alvarez, J.; Amutio, M.; Lopez, G.; Bilbao, J.; Olazar, M. Fast co-pyrolysis of sewage sludge and lignocellulosic biomass in a conical spouted bed reactor. Fuel 2015, 159, 810–818. [Google Scholar] [CrossRef]
  89. Suttibak, S.; Sriprateep, K.; Pattiya, A. Production of Bio-oil via Fast Pyrolysis of Cassava Rhizome in a Fluidised-Bed Reactor. Energy Procedia 2012, 14, 668–673. [Google Scholar] [CrossRef] [Green Version]
  90. Mushtaq, F.; Abdullah, T.A.T.; Mat, R.; Ani, F.N. Optimization and characterization of bio-oil produced by microwave assisted pyrolysis of oil palm shell waste biomass with microwave absorber. Bioresour. Technol. 2015, 190, 442–450. [Google Scholar] [CrossRef]
  91. Yoshida, T. Synthesis of polysaccharides having specific biological activities. Prog. Polym. Sci. 2001, 26, 379–441. [Google Scholar] [CrossRef]
  92. Thangalazhy-Gopakumar, S.; Adhikari, S.; Ravindran, H.; Gupta, R.B.; Fasina, O.; Tu, M.; Fernando, S.D. Physiochemical properties of bio-oil produced at various temperatures from pine wood using an auger reactor. Bioresour. Technol. 2010, 101, 8389–8395. [Google Scholar] [CrossRef]
  93. Nudri, N.A.; Bachmann, R.T.; Ghani, W.A.W.A.K.; Sum, D.N.K.; Azni, A.A. Characterization of oil palm trunk biocoal and its suitability for solid fuel applications. Biomass Convers. Biorefin. 2019, 10, 45–55. [Google Scholar] [CrossRef]
  94. Wilk, M.; Magdziarz, A.; Kalemba, I. Characterisation of renewable fuels’ torrefaction process with different instrumental techniques. Energy 2015, 87, 259–269. [Google Scholar] [CrossRef]
  95. Angin D Effect of pyrolysis temperature and heating rate on biochar obtained from pyrolysis of saf-flower seed press cake. Bioresour. Technol. 2013, 128, 593–597. [CrossRef]
  96. Tsai, W.-T.; Liu, S.-C.; Chen, H.-R.; Chang, Y.-M.; Tsai, Y.-L. Textural and chemical properties of swine-manure-derived biochar pertinent to its potential use as a soil amendment. Chemosphere 2012, 89, 198–203. [Google Scholar] [CrossRef]
  97. Zhang, J.; Liu, J.; Liu, R. Effects of pyrolysis temperature and heating time on biochar obtained from the pyrolysis of straw and lignosulfonate. Bioresour. Technol. 2015, 176, 288–291. [Google Scholar] [CrossRef]
  98. Pereira, R.C.; Kaal, J.; Arbestain, M.C.; Lorenzo, R.P.; Aitkenhead, W.; Hedley, M.; Macias, F.D.; Hindmarsh, J.P.; Agulló, J.A.M. Contribution to characterisation of biochar to estimate the labile fraction of carbon. Org. Geochem. 2011, 42, 1331–1342. [Google Scholar] [CrossRef]
  99. Obernberger, I.; Thek, G. Physical characterisation and chemical composition of densified biomass fuels with regard to their combustion behaviour. Biomass Bioenergy 2004, 27, 653–669. [Google Scholar] [CrossRef]
  100. Liu, Z.; Quek, A.; Hoekman, S.K.; Balasubramanian, R. Production of solid biochar fuel from waste biomass by hydrothermal carbonization. Fuel 2013, 103, 943–949. [Google Scholar] [CrossRef]
  101. Shaaban, A.; Se, S.-M.; Dimin, M.; Juoi, J.M.; Husin, M.H.M.; Mitan, N.M.M. Influence of heating temperature and holding time on biochars derived from rubber wood sawdust via slow pyrolysis. J. Anal. Appl. Pyrolysis 2014, 107, 31–39. [Google Scholar] [CrossRef]
  102. Lua, A.C. A detailed study of pyrolysis conditions on the production of steam-activated carbon derived from oil-palm shell and its application in phenol adsorption. Biomass Convers. Biorefin. 2019, 10, 523–533. [Google Scholar] [CrossRef]
  103. Chen, B.; Zhou, D.; Zhu, L. Transitional Adsorption and Partition of Nonpolar and Polar Aromatic Contaminants by Biochars of Pine Needles with Different Pyrolytic Temperatures. Environ. Sci. Technol. 2008, 42, 5137–5143. [Google Scholar] [CrossRef]
  104. Zimmerman, A.R. Abiotic and Microbial Oxidation of Laboratory-Produced Black Carbon (Biochar). Environ. Sci. Technol. 2010, 44, 1295–1301. [Google Scholar] [CrossRef]
  105. Spokas, K.; Koskinen, W.; Baker, J.; Reicosky, D. Impacts of woodchip biochar additions on greenhouse gas production and sorption/degradation of two herbicides in a Minnesota soil. Chemosphere 2009, 77, 574–581. [Google Scholar] [CrossRef]
  106. Cheng, C.-H.; Lehmann, J.; Thies, J.E.; Burton, S.D.; Engelhard, M.H. Oxidation of black carbon by biotic and abiotic processes. Org. Geochem. 2006, 37, 1477–1488. [Google Scholar] [CrossRef]
  107. Worasuwannarak, N.; Sonobe, T.; Tanthapanichakoon, W. Pyrolysis behaviors of rice straw, rice husk, and corncob by TG-MS technique. J. Anal. Appl. Pyrolysis 2007, 78, 265–271. [Google Scholar] [CrossRef]
  108. Mašek, O.; Brownsort, P.; Cross, A.; Sohi, S. Influence of production conditions on the yield and environmental stability of biochar. Fuel 2013, 103, 151–155. [Google Scholar] [CrossRef] [Green Version]
  109. Rankine I, Fairhurst TH Management of phosphorus, potassium and magnesium in mature oil palm. Better Crop Int. 1999, 13, 11.
  110. Wang, X.; Liu, Y.; Tan, H.; Ma, L.; Xu, T. Mechanism Research on the Development of Ash Deposits on the Heating Surface of Biomass Furnaces. Ind. Eng. Chem. Res. 2012, 51, 12984–12992. [Google Scholar] [CrossRef]
  111. Abdullah, N.; Sulaiman, F. The properties of the washed empty fruit bunches of oil palm. J. Phys. Sci. 2013, 24, 117–137. [Google Scholar]
  112. Zhu, Y.; Niu, Y.; Tan, H.; Wang, X. Short Review on the Origin and Countermeasure of Biomass Slagging in Grate Furnace. Front. Energy Res. 2014, 2. [Google Scholar] [CrossRef] [Green Version]
  113. Omar, F.N.; Mohammed, M.A.P.; Baharuddin, A.S. Effect of Silica Bodies on the Mechanical Behaviour of Oil Palm Empty Fruit Bunch Fibres. BioResources 2014, 9, 7041–7058. [Google Scholar] [CrossRef] [Green Version]
Figure 1. Schematic of the experimental setup.
Energies 14 01092 g001
Figure 2. (a) TGA and (b) DTG for the biomass samples.
Energies 14 01092 g002
Figure 3. Effects of temperature on pyrolysis yields from oil palm trunk (OPT).
Energies 14 01092 g003
Figure 4. Effects of temperature on pyrolysis yields from oil palm frond (OPF).
Energies 14 01092 g004
Figure 5. Effects of temperature on pyrolysis yields from rubberwood sawdust (RWS).
Energies 14 01092 g005
Figure 6. SEM photographs of (A) OPT, (B) OPT biochar, (C) OPF, (D) OPF biochar, (E) RWS, (F) RWS biochar.
Energies 14 01092 g006
Table 1. Biomass physicochemical properties characterization.
AnalysisProcedureStandard
Bulk densityBased on the mass and volume ratio, the bulk or apparent density of the ground biomass was determined. A cylindrical container with a particular inside diameter and volume (1000 mL) was used for this method. The samples were filled in the container up to a certain height and tapped down from top to maintain the proper top surface. The net weight was then reported for each sample, and the bulk density was determined.-
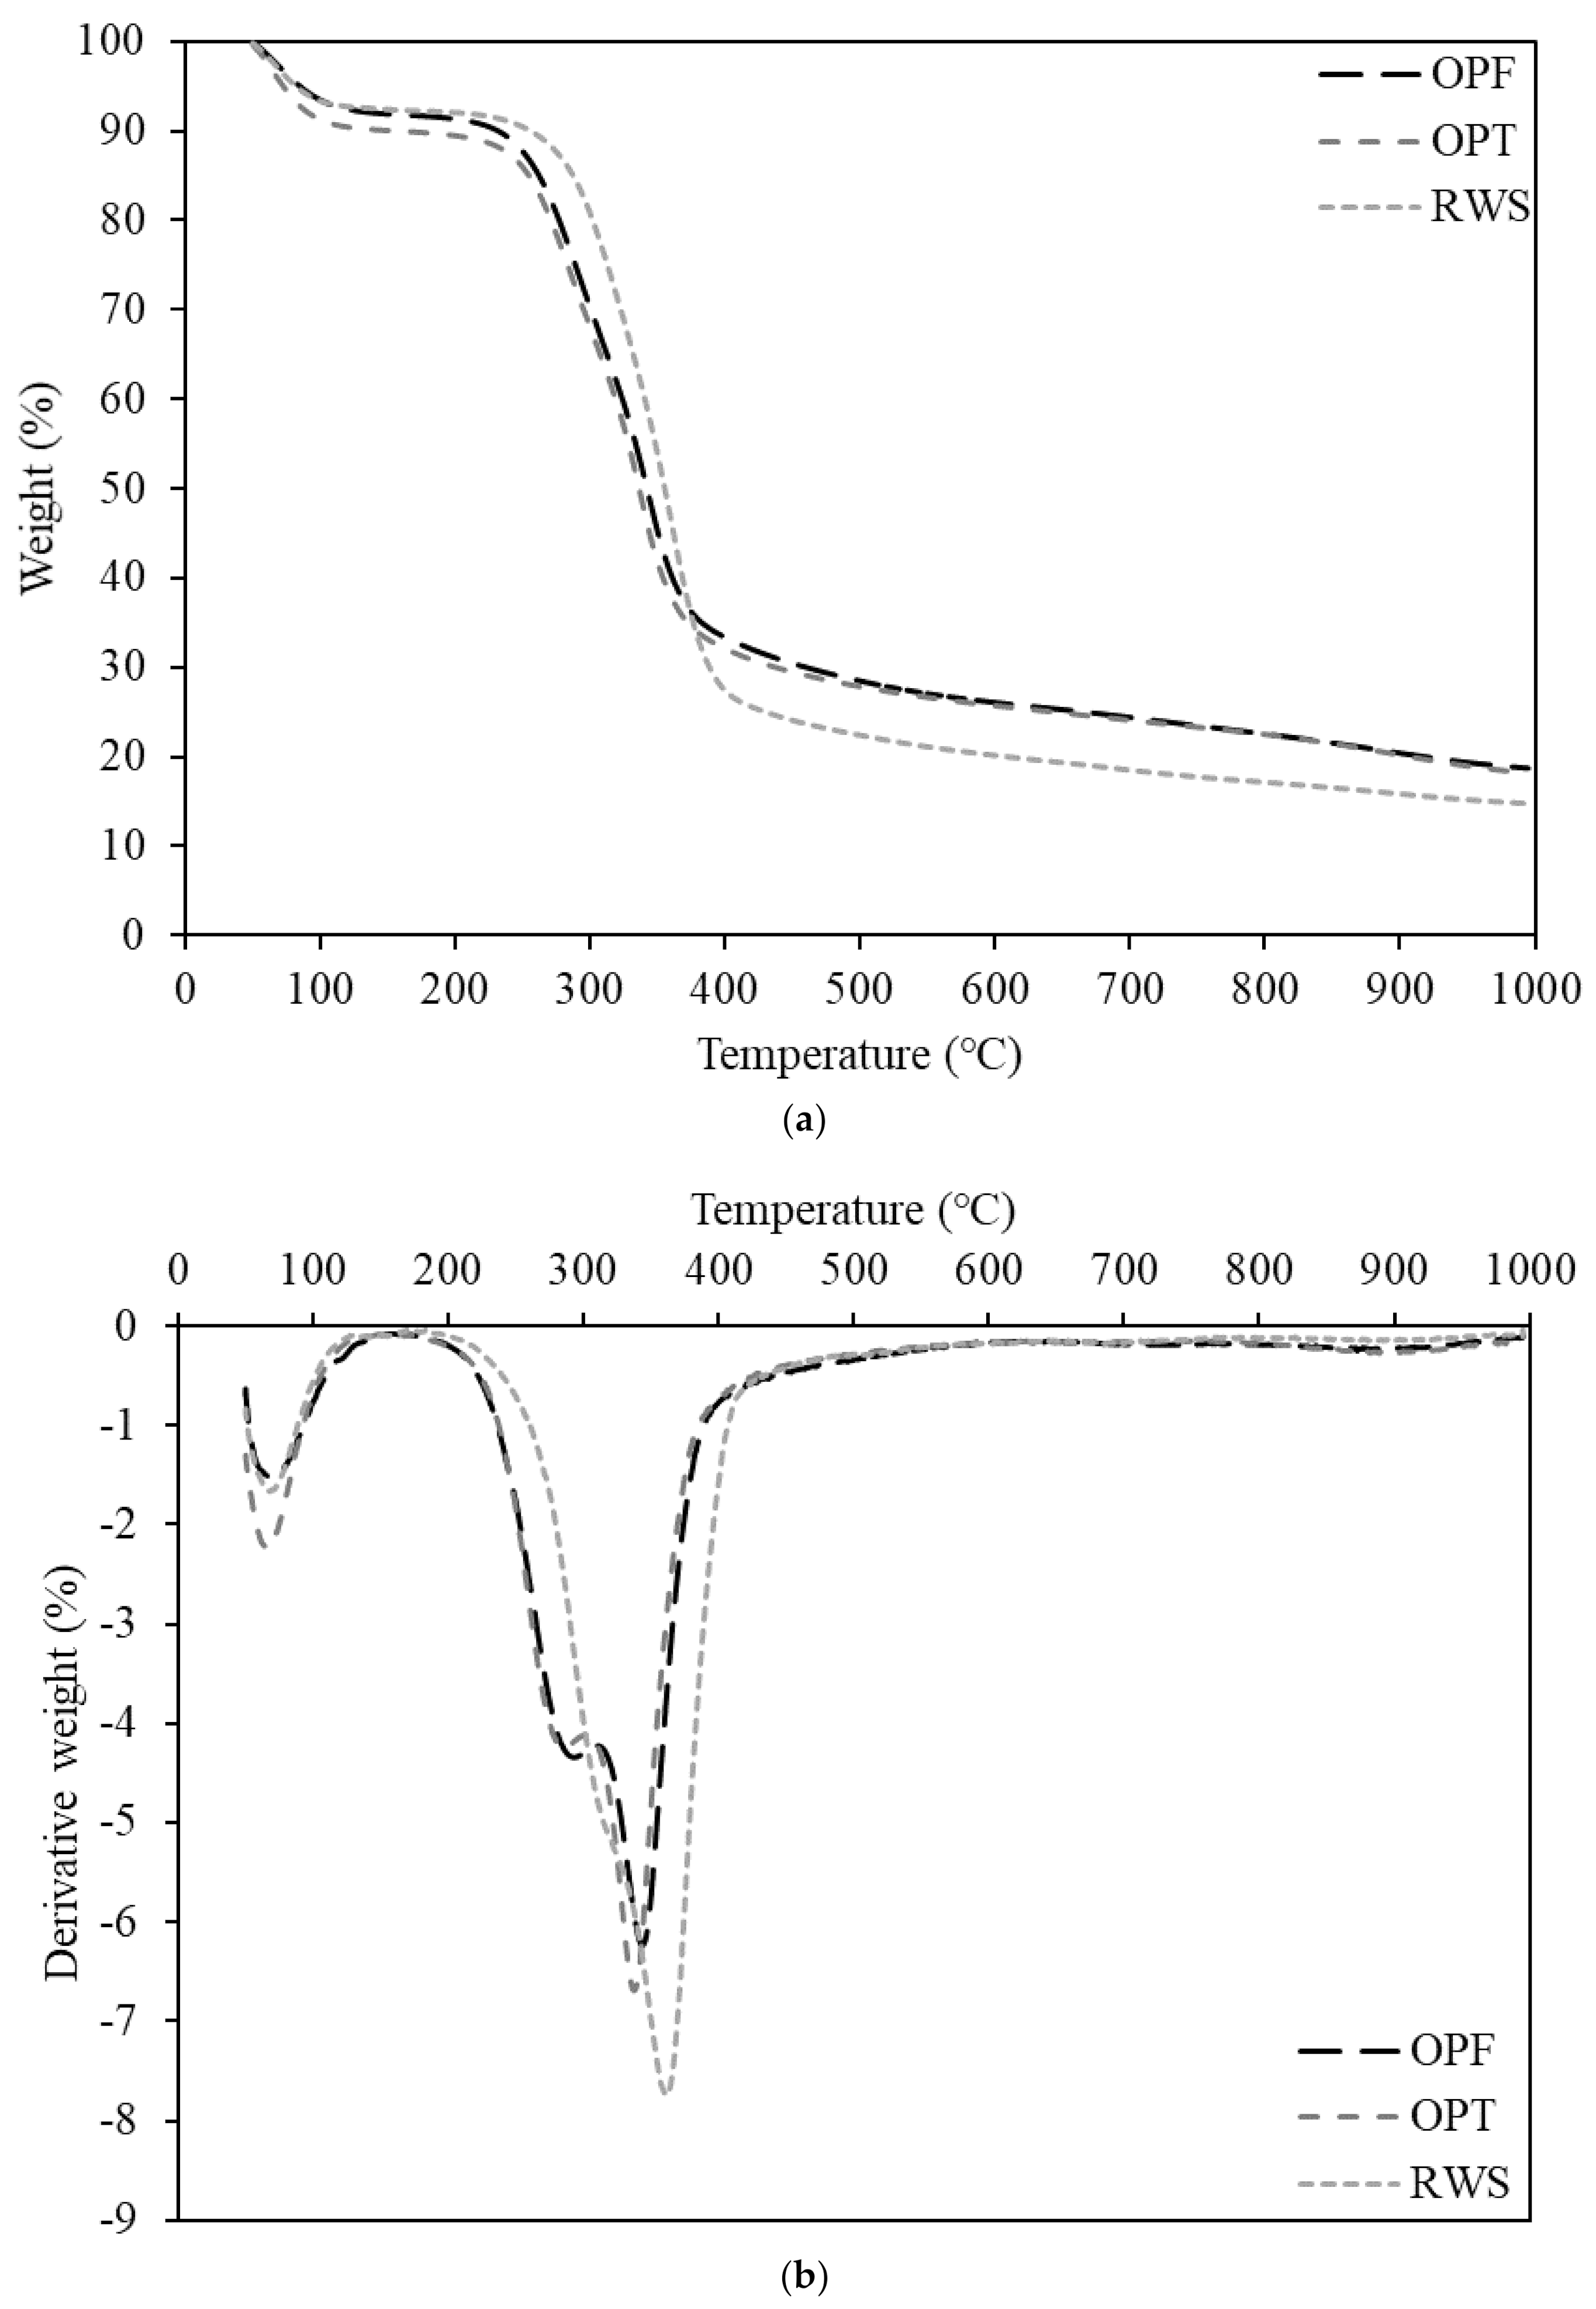
Thermogravimetric analysis (TGA)Thermogravimetric analysis (TGA) and derivative thermogravimetric analysis (DTG) were applied using a thermogravimetric analyzer (Perkin Elmer, Waltham, MA, USA). The observations were performed at temperatures ranging from 50 to 1000 °C and at a heating rate of 10 °C/min under a nitrogen gas atmosphere.ASTM E1131
Proximate analysisA macro thermogravimetric analyzer (TGA 701, LECO, USA) was used for proximate analysis, including moisture content, volatile matter, fixed carbon content and ash content.ASTM D7582
Ultimate analysisA CHNS/O Analyzer (FLASH 2000, Thermo Scientific, Monza, Italy) was used to analyze the basic elemental composition of each sample, including carbon (C), hydrogen (H), nitrogen (N), and sulfur (S). The oxygen content was determined by calculating a difference.EN 15104 and ASTM D4239
Lignocellulosic analysisThe acid detergent fiber (ADF), neutral detergent fiber (NDF), and acid detergent lignin (ADL) were used to determine the percentage of cellulose, hemicellulose, and lignin.
Cellulose content = ADF–ADL
Hemicellulose content = NDF–ADF
Lignin content = ADL
Extractives = 100 − (Cellulose + Hemicellulose + Lignin)
-
Higher heating value (HHV)This was estimated by the following formula:
HHV ( MJ / kg ) = 0.3491 C + 1.1783 H + 0.1005 S 0.1034 O 0.0151 N 0.0211 Ash
where, C, H, O, N, S and Ash are from the elemental composition found by proximate analysis and ultimate analysis.
-
Lower heating value (LHV)Estimated from the formula:
LHV dry ( MJ / kg ) = HHV dry   2.442 × 8.936 H 100
where H is hydrogen (% wt.) on dry basis.
-
Table 2. Characterization of biomass samples.
Property or ComponentType of Biomass
OPTOPFRWS
Proximate Analysis
Moisture Content (wt. %, wet basis)7.07 ± 0.046.48 ± 0.037.13 ± 0.02
Volatile Matter (wt. %, dry basis)71.14 ± 0.2071.31 ± 0.3075.98 ± 0.26
Fixed Carbon (wt. %, dry basis)15.42 ± 0.2216.68 ± 0.2815.21 ± 0.24
Ash (wt. %, dry basis)6.38 ± 0.025.24 ± 0.031.68 ± 0.01
Ultimate Analysis (wt. %, Dry Basis)
Carbon45.79 ± 0.0744.95 ± 0.1547.55 ± 0.23
Hydrogen6.15 ± 0.025.89 ± 0.066.22 ± 0.02
Nitrogen1.47 ± 0.010.40 ± 0.010.32 ± 0.01
Oxygen *46.33 ± 0.0748.71 ± 0.0145.91 ± 0.26
Sulphur1.47 ± 0.010.06 ± 0.010.03 ± 0.01
Lignocellulosic Component (wt. %, Dry Basis)
Cellulose47.81 ± 0.36 48.56 ± 0.2856.91 ± 0.47
Hemicellulose23.19 ± 0.1422.41 ± 0.4215.21 ± 0.28
Lignin9.52 ± 0.0913.15 ± 0.0817.44 ± 0.16
Extractives19.48 ± 0.1615.88 ± 0.3810.44 ± 0.44
Element (mg/kg)
Silicon (Si)356016942538
Iron (Fe)15892722189
Calcium (Ca)543270955164
Magnesium (Mg)278920351058
Sodium (Na)106525068
Potassium (K)961032405037
Higher and Lower Heating Values (MJ/kg)
HHV23.22 ± 0.2322.52 ± 0.4123.77 ± 0.19
LHV21.88 ± 0.1821.24 ± 0.3722.42 ± 0.47
Other Properties
Molecular FormulaCH1.597O0.759CH1.559O0.813CH1.556O0.725
H/C Molar Ratio1.591.551.55
O/C Molar Ratio0.750.810.72
Bulk Density (kg/m3)150.97 ± 0.36220.68 ± 0.31293.58 ± 0.29
* oxygen by difference.
Table 3. Basic properties of liquid product.
Type of
Biomass
Pyrolysis Temperature (°C)Properties of Liquid Product
Water Content
(wt. %)
Ash Content
(wt. %)
pH
Value
Density (kg/m3)Solid Content
(wt. %)
OPT50070.84 ± 0.220.08 ± 0.022.91 ± 0.021011 ± 0.010.02 ± 0.01
55067.99 ± 0.590.09 ± 0.012.96 ± 0.011008 ± 0.020.04 ± 0.02
60065.16 ± 0.810.09 ± 0.022.98 ± 0.011003 ± 0.010.05 ± 0.01
OPF50067.96 ± 0.320.05 ± 0.012.67 ± 0.041013 ± 0.020.03 ± 0.02
55065.11 ± 0.130.07 ± 0.022.59 ± 0.031007 ± 0.020.05 ± 0.03
60064.13 ± 0.300.08 ± 0.042.64 ± 0.021001 ± 0.010.06 ± 0.02
RWS50059.30 ± 0.210.02 ± 0.012.15 ± 0.031012 ± 0.020.05 ± 0.05
55054.80 ± 0.340.03 ± 0.012.18 ± 0.021009 ± 0.020.06 ± 0.03
60052.89 ± 0.700.05 ± 0.012.15 ± 0.021006 ± 0.010.07 ± 0.01
Table 4. Ultimate analysis of liquid product.
Biomass Pyrolysis
Temperature (°C)
Ultimate Analysis (wt. %, As Water Free Basis)
CarbonHydrogenNitrogenSulphur* Oxygen** HHV
OPT50013.75 ± 0.206.20 ± 0.190.16 ± 0.00<0.0112.99 ± 0.0212.19 ± 0.15
55014.62 ± 0.306.46 ± 0.210.23 ± 0.00<0.0114.41 ± 0.2414.28 ± 0.18
60015.37 ± 0.216.77 ± 0.170.24 ± 0.00ND16.10 ± 0.3716.61 ± 0.23
OPF50015.31 ± 0.186.40 ± 0.230.18 ± 0.18<0.0113.48 ± 0.4113.97 ± 0.19
55017.30 ± 0.136.08 ± 0.120.20 ± 0.01<0.0114.90 ± 0.2416.01 ± 0.17
60017.34 ± 0.366.15 ± 0.260.12 ± 0.01ND15.83 ± 0.2417.10 ± 0.09
50022.85 ± 0.256.09 ± 0.070.12 ± 0.01ND14.95 ± 0.2818.53 ± 0.20
RWS55024.64 ± 0.086.38 ± 0.210.13 ± 0.01ND17.12 ± 0.3021.89 ± 0.14
60026.54 ± 0.106.65 ± 0.180.12 ± 0.01ND16.74 ± 0.0922.32 ± 0.13
* Oxygen estimated as a difference and then converted to water free basis using molecular weight balance method. ** HHV calculated on water free basis. ND means not detected.
Table 5. Main compounds in liquid products obtained from pyrolysis at 550 °C.
CompoundsPeak Area (%)
OPT OPF RWS
Phenol21.7910.247.46
3-Penten-2-one, 3,4-dimethyl-9.87N/DN/D
Butyric acid hydrazide4.192.65N/D
2-Cyclopenten-1-one, 2-hydroxy-3-methyl-3.814.125.02
o-Cresol3.311.101.34
p-Cresol2.83N/DN/D
Phenol, 2-methoxy-2.844.404.99
1,3-Propanediamine2.621.86N/D
Creosol2.151.551.95
Catechol2.10N/D1.68
1,2-Benzenediol, 3-methoxy-2.102.602.29
Propanoic acid, 2-methyl-, propyl ester2.07N/D2.26
Phenol, 4-ethyl-2-methoxy-1.921.882.16
Phenol, 2,6-dimethoxy-1.8311.3211.72
3,5-Dimethoxy-4-hydroxytoluene1.593.214.23
1,3-BenzenediolN/D5.125.09
2-Pentanone, 1-(2,4,6-trihydroxyphenyl)2.152.992.67
5-tert-Butylpyrogallol1.423.082.29
(E)-2,6-Dimethoxy-4-(prop-1-en-1-yl) phenol1.421.541.62
Anhydro-sugarN/D8.147.79
N/D means not detected.
Table 6. Proximate analyses of biochar samples.
Type of BiomassPyrolysis Temperature (°C)Proximate Analysis (wt. %, As Received Basis)
Moisture ContentVolatile MatterFixed Carbon Ash Content
OPT5003.85 ± 0.0113.02 ± 0.7571.69 ± 0.4211.44 ± 0.87
5503.74 ± 0.0412.72 ± 0.2572.51 ± 0.2311.03 ± 0.29
6004.61 ± 0.0411.41 ± 0.6072.69 ± 0.6511.29 ± 0.41
OPF5004.58 ± 0.0514.05 ± 1.1474.06 ± 1.067.31 ± 0.30
5504.13 ± 0.0412.43 ± 0.1875.42 ± 0.238.02 ± 0.20
6004.17 ± 0.1310.25 ± 0.2776.70 ± 0.748.88 ± 0.55
RWS5003.41 ± 0.0716.16 ± 0.1873.29 ± 0.607.14 ± 0.43
5503.76 ± 0.0314.56 ± 0.2874.48 ± 0.287.20 ± 0.11
6003.74 ± 0.0313.06 ± 0.1476.31 ± 0.276.89 ± 0.41
Table 7. Ultimate analyses and energy contents of biochars.
Type of
Biomass
Pyrolysis
Temperature (°C)
Ultimate Analysis (wt. %, Dry Basis)
CarbonHydrogenNitrogenSulphurOxygen *HHV
OPT50077.53 ± 0.113.45 ± 0.130.43 ± 0.010.04 ± 0.0118.63 ± 0.7128.82 ± 0.52
55079.35 ± 0.131.87 ± 0.051.78 ± 0.010.38 ± 0.0116.65 ± 0.7527.96 ± 0.38
60082.02 ± 0.141.59 ± 0.041.78 ± 0.010.40 ± 0.0114.22 ± 0.4228.79 ± 0.21
OPF50075.07 ± 0.012.41 ± 0.010.43 ± 0.010.11 ± 0.0122.00 ± 0.5126.61 ± 0.22
55076.41 ± 0.021.80 ± 0.040.40 ± 0.010.09 ± 0.0121.31 ± 0.8226.42 ± 0.39
60078.34 ± 0.011.91 ± 0.010.46 ± 0.010.11 ± 0.0119.19 ± 0.5127.43 ± 0.22
RWS50076.65 ± 0.012.71 ± 0.060.41 ± 0.010.04 ± 0.0120.21 ± 0.4127.70 ± 0.23
55078.59 ± 0.353.30 ± 0.020.49 ± 0.010.09 ± 0.0117.63 ± 0.0229.33 ± 0.02
60080.19 ± 0.022.09 ± 0.060.35 ± 0.010.03 ± 0.0117.35 ± 0.2328.50 ± 0.12
* Oxygen by difference.
Table 8. Specific surface areas and average pore diameters of biomasses and biochars pyrolyzed at 550 °C.
Name of SampleBET Surface Area (m2/g)Average Pore Diameter (nm)
OPT3.803499.9636
OPT biochar0.3629142.7742
OPF3.12796.4568
OPF biochar0.3358160.6406
RWS4.7785113.8839
RWS biochar0.4854175.7577
Table 9. Recalcitrant nature of biochar.
Type of Biomass Pyrolysis Temperature (°C)Carbon Sequestration
Carbon (% wt.)Fixed Carbon (wt. %)R50CS (%)
OPT55079.35 ± 0.1372.51 ± 0.230.4918.70
OPF55076.41 ± 0.0275.42 ± 0.230.5121.41
RWS55078.59 ± 0.3574.48 ± 0.280.5322.49
Table 10. Ash composition, and slagging and fouling indexes of biochar samples.
Oxides (wt. %)Biochar
OPTOPFRWS
Fe2O32.9914.921.124
CaO12.62514.06911.361
MgO5.1555.3839.096
Na2O1.1691.1180.541
K2O23.87724.82920.002
SiO218.1119.88918.575
Al2O30.6860.6430.676
TiO21.4110.6720.16
B/A2.272.372.17
Sd0.090.090.38
SI0.200.210.82
FI56.7961.5744.58
Publisher’s Note: MDPI stays neutral with regard to jurisdictional claims in published maps and institutional affiliations.

