Article

Vulnerability of Smallholder Farmers to Climate Change-Induced Shocks in East Hararghe Zone, Ethiopia

1
College of Agriculture and Natural Resources, Debre Markos University, Debre Markos, Ethiopia
2
Africa Center of Excellence for Climate Smart Agriculture and Biodiversity Conservation, Haramaya University, Haramaya, Ethiopia
3
College of Agriculture and Environmental Sciences, Haramaya University, Haramaya, Ethiopia
4
Department of Economics, George Washington University, Washington, DC 20052, USA
5
College of Bussiness and Economics, Haramaya University, Haramaya, Ethiopia
*
Author to whom correspondence should be addressed.
Sustainability 2021, 13(4), 2162; https://doi.org/10.3390/su13042162
Submission received: 4 January 2021 / Revised: 23 January 2021 / Accepted: 27 January 2021 / Published: 18 February 2021

Abstract

:
Vulnerability assessment varies widely across households, countries, and regions. Though many previous studies assessed vulnerability to climate change, their unit of analysis was aggregate. Therefore, the objective of this study was to measure the vulnerability of smallholder farmers to climate change at the household level and identify its determinant factors in east Hararghe zone. A multi-stage sampling procedure was used to select districts, kebeles, and sample respondents. Vulnerability as expected poverty approach was used to measure household-level vulnerability. Logit model was also used to assess factors contributing to households’ vulnerability. The study revealed that 73% of households were vulnerable to climate-induced shocks. Households with better farm experience, land size, livestock ownership, access to credit, access to extension service, social capital, access to climate information, non-farm income, and headed by a male were not vulnerable to climate change; whereas households who were living in low and midland agro-ecologies, far from the market, and participating in productive safety-net programs were vulnerable to climate change. The study indicated that the vulnerability of smallholder farmers was sensitive to the minimum income required to maintain daily life. Income-generating activities that supplement farm income should be well designed in policy to reduce the vulnerability of smallholder farmers.

1. Introduction

Climate change becomes an important global issue because it brings a serious challenge to the world population. It affects human and animal health, livelihood, assets, market, water and food security, ecosystems, and infrastructure [1]. Having the most sensitive economic sector in the world, Africa has been recognized as one of the most vulnerable continents to the impacts of climate change [2,3]. Like most African countries, the economy of Ethiopia is highly dependent on rainfed agriculture and the productivity of this sector is very low [4,5]. The agricultural sector in this country is vulnerable to climate change. This is because climate change affects the two most important natural inputs, namely precipitation and temperature [6]. This change caused high variability of rainfall, increasing of temperature, high frequency of extreme events, pests, and diseases which are very serious challenges for smallholder farmers who depend on rainfed agriculture [7]. Since their major source of employment is agriculture, the income and poverty level of smallholder farmers in Ethiopia are highly affected by climate change [8]. It is affecting their livelihood by reducing agricultural output and increasing agricultural prices [9]. This has adversely affected the food security status of smallholder farmers [10]. Moreover, climate change-induced shocks such as drought and floods are also affecting the livelihood of smallholder farmers negatively [1]. Thus, the amount and temporal distribution of climatic factors are critical to agricultural production in general and smallholder farmers’ income in particular. In addition to climatic factors, many other factors exacerbate the vulnerability of smallholder farmers to climate change [11]. These factors include low economic and social development, low level of income per capita, limited disaster risk management, and limited institutional and financial capacity of the smallholder farmers to adapt to climate shocks, which make them most vulnerable to climate change [11,12]. Therefore, assessing the vulnerability of smallholder farmers to climate change, in particular, can help to identify and characterize actions toward reducing their vulnerability to climate change [13,14].
Vulnerability studies have been conducted in Ethiopia at the national, regional, and local levels [12,15,16,17,18]. The study conducted by Deressa and Ringler [15] examined farmers’ vulnerability to climate shocks but the result of this study cannot be used for local-level policy design because the study was conducted at the national level which was very much aggregated. The rest of the studies [16,17,19] focused on the agro-ecological level of vulnerability assessment and the unit of analysis was district. These previous studies failed to consider as vulnerability level may vary even among households at the district level. However, other studies such as [12,19,20] assess household-level vulnerability but these studies used aggregate analytical tools to assess household-level vulnerability. These studies also presented different results concerning the agro-ecological based vulnerability of smallholder farmers to climate change. For instance, the results from [4,12] indicated that farmers in the lowland agro-ecology were more vulnerable to climate change than farmers in other agro-ecological settings. However, Tesso et al. [18] made a different observation; farmers in the highland agro-ecology were vulnerable to climate change. The difference in the results of these studies implies that vulnerability differs from location to location. Therefore, a context-specific vulnerability assessment is required.
East Hararghe zone is one among many areas in Ethiopia frequently affected by recurrent drought, erratic rainfall, and severe land degradation [21]. The majority of smallholder farmers in the zone have a very small land size and use traditional crop cultivation methods [22]. Previous studies [21,22] on climate change adaptation strategies recommended the importance of integrating vulnerability assessment results to design appropriate policies that target the most vulnerable households. Even though vulnerability is driven by many local factors that vary with space and time, the assessment of vulnerability in the study area is scarce in the literature. Therefore, the objective of this study was to measure vulnerability at the household level and identify its determinants.

2. Definitions and Concepts of Vulnerability

The scientific use of “vulnerability” has its roots in geography and natural hazards research [23] but scholars from different fields of specialization have conceptualized it in many ways. For instance, social science literature such as [24] defined vulnerability as “the state of individuals, groups or communities in terms of their ability to cope with and adapt to any external stress placed on their livelihoods and well-being”. Similarly, [25] defines vulnerability as the exposure of groups or individuals to stress as a result of the impacts of climate change and related climate extremes. According to Serdecznyet al. [2], vulnerability is the characteristics of a person or a group in terms of their capacity to anticipate, cope with, resist, and recover from the impact of a natural or man-made disaster. The definition indicated that vulnerability is a combination of institutional, economic, environmental, social, and cultural factors. Vulnerability is the degree to which a system, or part of a system, may react adversely during the occurrence of a hazardous event [26]. The Intergovernmental Panel on Climate Change IPCC [27] defines vulnerability as the degree to which a system is susceptible to and unable to cope with adverse effects of climate change, including climate variability and extremes. These definitions show vulnerability combines the risk, impact, and ability of the individuals or communities to adapt. In another way, economics literature defines vulnerability as vulnerability refers to the propensity to suffer a significant welfare shock, bringing the household below a socially defined minimum level [28,29]. Vulnerability in the economic literature is often related to the effects of shocks such as drought and flood resulted in income loss. The current study used the definition of economics literature.
Different literature shows the interlinkage between vulnerability and poverty. For instance, [28] shows the strong link between these two concepts. According to this literature, poverty and vulnerability are “two sides of the same coin”. This implies that the probability of being vulnerable is highly related to the status of poverty. A previous study by Kim [30] indicated that compared to the non-poor households, the poor are two times more vulnerable to climate-induced shocks. This is because due to their low level of capital, resources, access to services and they are highly dependent on climate-sensitive sectors such as agriculture [29]. Similarly, Leichenko and Silva [31] also indicated that poorer households have a higher probability of being vulnerable to climate change due to their low level of adaptive capacity. According to economics literature, there are three major approaches to measure vulnerability. These are vulnerability to expected poverty (VEP), vulnerability to low expected utility (VEU), and vulnerability as uninsured exposure to risk (VER) [28]. VEP considers vulnerability as the probability of a household falling into poverty in a future period. It is based on estimating the probability that a given shock or set of shocks will move household consumption below a given minimum level. VEU vulnerability will be measured for the utility derived from some level of certain equivalent consumption above which the household would not be considered as vulnerable. However, it is difficult to measure individuals’ risk preference which is highly dependent on the level of information they have about uncertain events. The VER is based on the before and after factor assessment of the extent to which a negative shock causes welfare loss. This method needs panel data. Considering the difficulty to measure individuals’ risk preferences in the VEU method and the need for panel data for the VER method, the current study used vulnerability as expected poverty of an econometric method to measure households’ vulnerability to climate change. This method was employed to assess the probability of a farmer falling below a poverty line due to the occurrence of climatic shocks such as drought and flood.

3. Research Methodology

3.1. Description of the Study Area

The East Hararghe zone is located in Oromia National Regional State. Its altitude ranges from 1200 to 3405 m above sea level with minimum and maximum rainfall of 400 and 1200 mm, respectively. The total area covered by this zone is about 22,622.6 km2. The zone contains three agro-ecological zones, highland (>2300), midland (1500–2300), and lowlands (<1500) meters above sea level (m.a.s.l). The lowland occupies the largest area (67.76%), followed by midland (24.5%) and highland (7.67%). The total population of the zone is 3.4 million with 415,575 male-headed and 33,903 female-headed households. The zone contains a total of 20 districts. Among these, five of them are pastoralists and the basic livelihood activities of the community are rain-fed mixed farming systems, livestock husbandry, and small-scale irrigation-based cash crop production for their livelihood. Sorghum and maize are the major staple food crops produced in the zone, constituting about 75% of the annual crop production. The zone has two rainy seasons, such as the short (belg) rainy season which ranges from March to May, and the main (meher) rainy season which ranges from June to September [32].
Due to the unreliable and erratic nature of rainfall resulting from climate change, the zone is repeatedly affected by recurrent drought and food insecurity, which becomes a serious problem. Shortages of surface and groundwater, farmland, grazing land, coupled with climate change challenges smallholder farmers’ livelihood. As a result, food crop production markedly reduces from time to time, leading to an increasing number of poor people. Currently, all the districts are affected by drought and supported by the productive safety net program. The poor resource conditions, reliance on rain-fed agriculture, and the use of traditional production systems exposed smallholder farmers to climate change [7,32].

3.2. Methods

3.2.1. Sampling Procedure

A multistage sampling procedure was used for this study. In the first stage, the zone was clustered as lowland (<1500), midland (1500–2300), and highland (>2300) m.a.s.l based on their altitudinal variation. Two districts (Fedis and Babele) from the lowland, since it covers 67% of the area, and one each from the highland (Dadar) and midland (Kombolcha) were selected randomly to represent all the three agro-ecologies. Finally, a total of 13 kebeles (lower administrative units) and 384 sample households were selected using simple random and systematic random sampling procedures, respectively. The number of respondents was taken based on probability proportional to the population size of each kebele. The list of households was taken from kebeles to get the sampling frame and the sample size was determined by using [33].
n = Z 2 p q N e 2 ( N 1 ) + Z 2 p q
n = ( 1.96 ) 2 0.5 0.5 449 , 478 ( 0.05 ) 2 ( 449,478 1 ) + ( 1.96 ) 2 .0.5 0.5 = 384
where N is the total households (449,478); Z, confidence level 95% (1.96); P, sample proportion, 0.5, q= 1 − p and e—the desired level of precision (0.05).
Sample respondents for focus group discussions and key informant interviews were also used from each district with the help of development workers. Both qualitative and quantitative data were used. Quantitative data was collected using an interview schedule while qualitative data was gathered from focus group discussions (FGD) and key informant interviews (KII). The study also used meteorological data on temperature and rainfall from National Metrological Agency for the years (1983–2016). Secondary data were collected from agricultural offices of administrative units, disaster risk commission offices, and academic literature.

3.2.2. Methods of Data Analysis

Measuring Vulnerability

The study used the vulnerability as expected poverty (VEP) approach of an econometric method to measure vulnerability. The approach developed by [29], allows the use of cross-section data. Other studies also used this approach to assess household-level vulnerability [15,34]. The approach works by estimating expected income per capita, its variance, and the poverty line, and assuming that income per capita (or its log) is normally distributed [35].
According to [29], the income of household h is given by
The income of the household h
ln   C h = X h β + ε h
where Ch is the per capita income of a household Xh is the household’s characteristics (farm experience, sex, dependency ratio, access to services, etc.) and climatic shocks such as drought and flood. β is a vector of parameters and εh is the disturbance term which was estimated using Ordinary Least Squares OLS.
The variance of the disturbance term is
σ h 2 = x h θ
The estimates β and θ were obtained using the three-step feasible generalized least squares (FGLS) procedure suggested by [36]. These estimates are used to determine the expected log of income and variance of log income to each household h.
The expected log of income will be
E [ ln C h X h ] = X h β
and the variance of log income is
V = [ ln C h X h ] = σ , h 2 = X h θ
The probability that a household with X characteristics will be poor or vulnerability level was estimated by using the above equations, by assuming that income is normally distributed. Then, if ϕ(.) denotes the cumulative density of the standard normal, the estimated probability was
V h = P r ( ln C h < ln Z X h ) = ϕ ( ln Z X h β X h θ )
where ln Z is a minimum level of income (poverty line), 1.9 USD being the international poverty line according to [37] below which the household called vulnerable. Following [29], the vulnerability arbitrary cutoff used for this study was 0.5 in which the household was categorized as vulnerable if the estimated vulnerability coefficient was greater than 0.5. Based on this, households were classified into vulnerable and non-vulnerable. Moreover, to check the sensitivity of a household’s vulnerability to the minimum income level additional two different scenarios of poverty lines were used. These were 1.5 USD per day and 2.25 USD per day.
To identify the determinants of vulnerability logit model was used and specified as
P i = F ( Z i ) = 1 1 + ( α + β i X i )
where Pi is the probability that an individual i is being vulnerable given Xi (explanatory variables); F is the cumulative density function, and βs are parameters to be estimated. In the logit model, the probability of a household being vulnerable is given by:
ln ( P i 1 P i ) = Z i = α + β 1 X 1 + β 2 X 2 + .... + β k X k

3.2.3. Variables Used for the Econometric Model

Vulnerability status is the dependent variable of the model measured using the vulnerability as expected poverty approach presented in Section 3.2.2. A household whose index value above 0.5 was considered as vulnerable and assigned a value 1, otherwise 0. Table 1 shows the definitions for explanatory variables hypothesized to affect the dependent variable with their expected signs.

4. Results

4.1. Vulnerability Status of Households

The results indicated in Table 2 show that using the international poverty line for developing countries of 1.9 USD per day per adult equivalent 73% of the sample households were vulnerable to climate change-induced shocks whereas 27% of them were not vulnerable. Similarly, Figure 1 shows the vulnerability level of smallholder farmers considering 1.9 USD poverty lines. As indicated in the graph, 48.5% of the sample households fall in the upper left side, these households were poor in 2019 and were likely to remain poor the following period, while 13.6% of households who fall in the bottom left side were poor in the year 2019, but not likely to become poor next time. On the other hand, those in the upper right corner (24.7%) are not poor currently, but they are likely to become poor next time, while those in the bottom right (13.2%) were above the income threshold and were likely to remain non-poor in the following years. Moreover, results from FGDs revealed that poor households in the study area had limited assets and no savings to recover from aftershocks therefore, they are vulnerable to climate change.

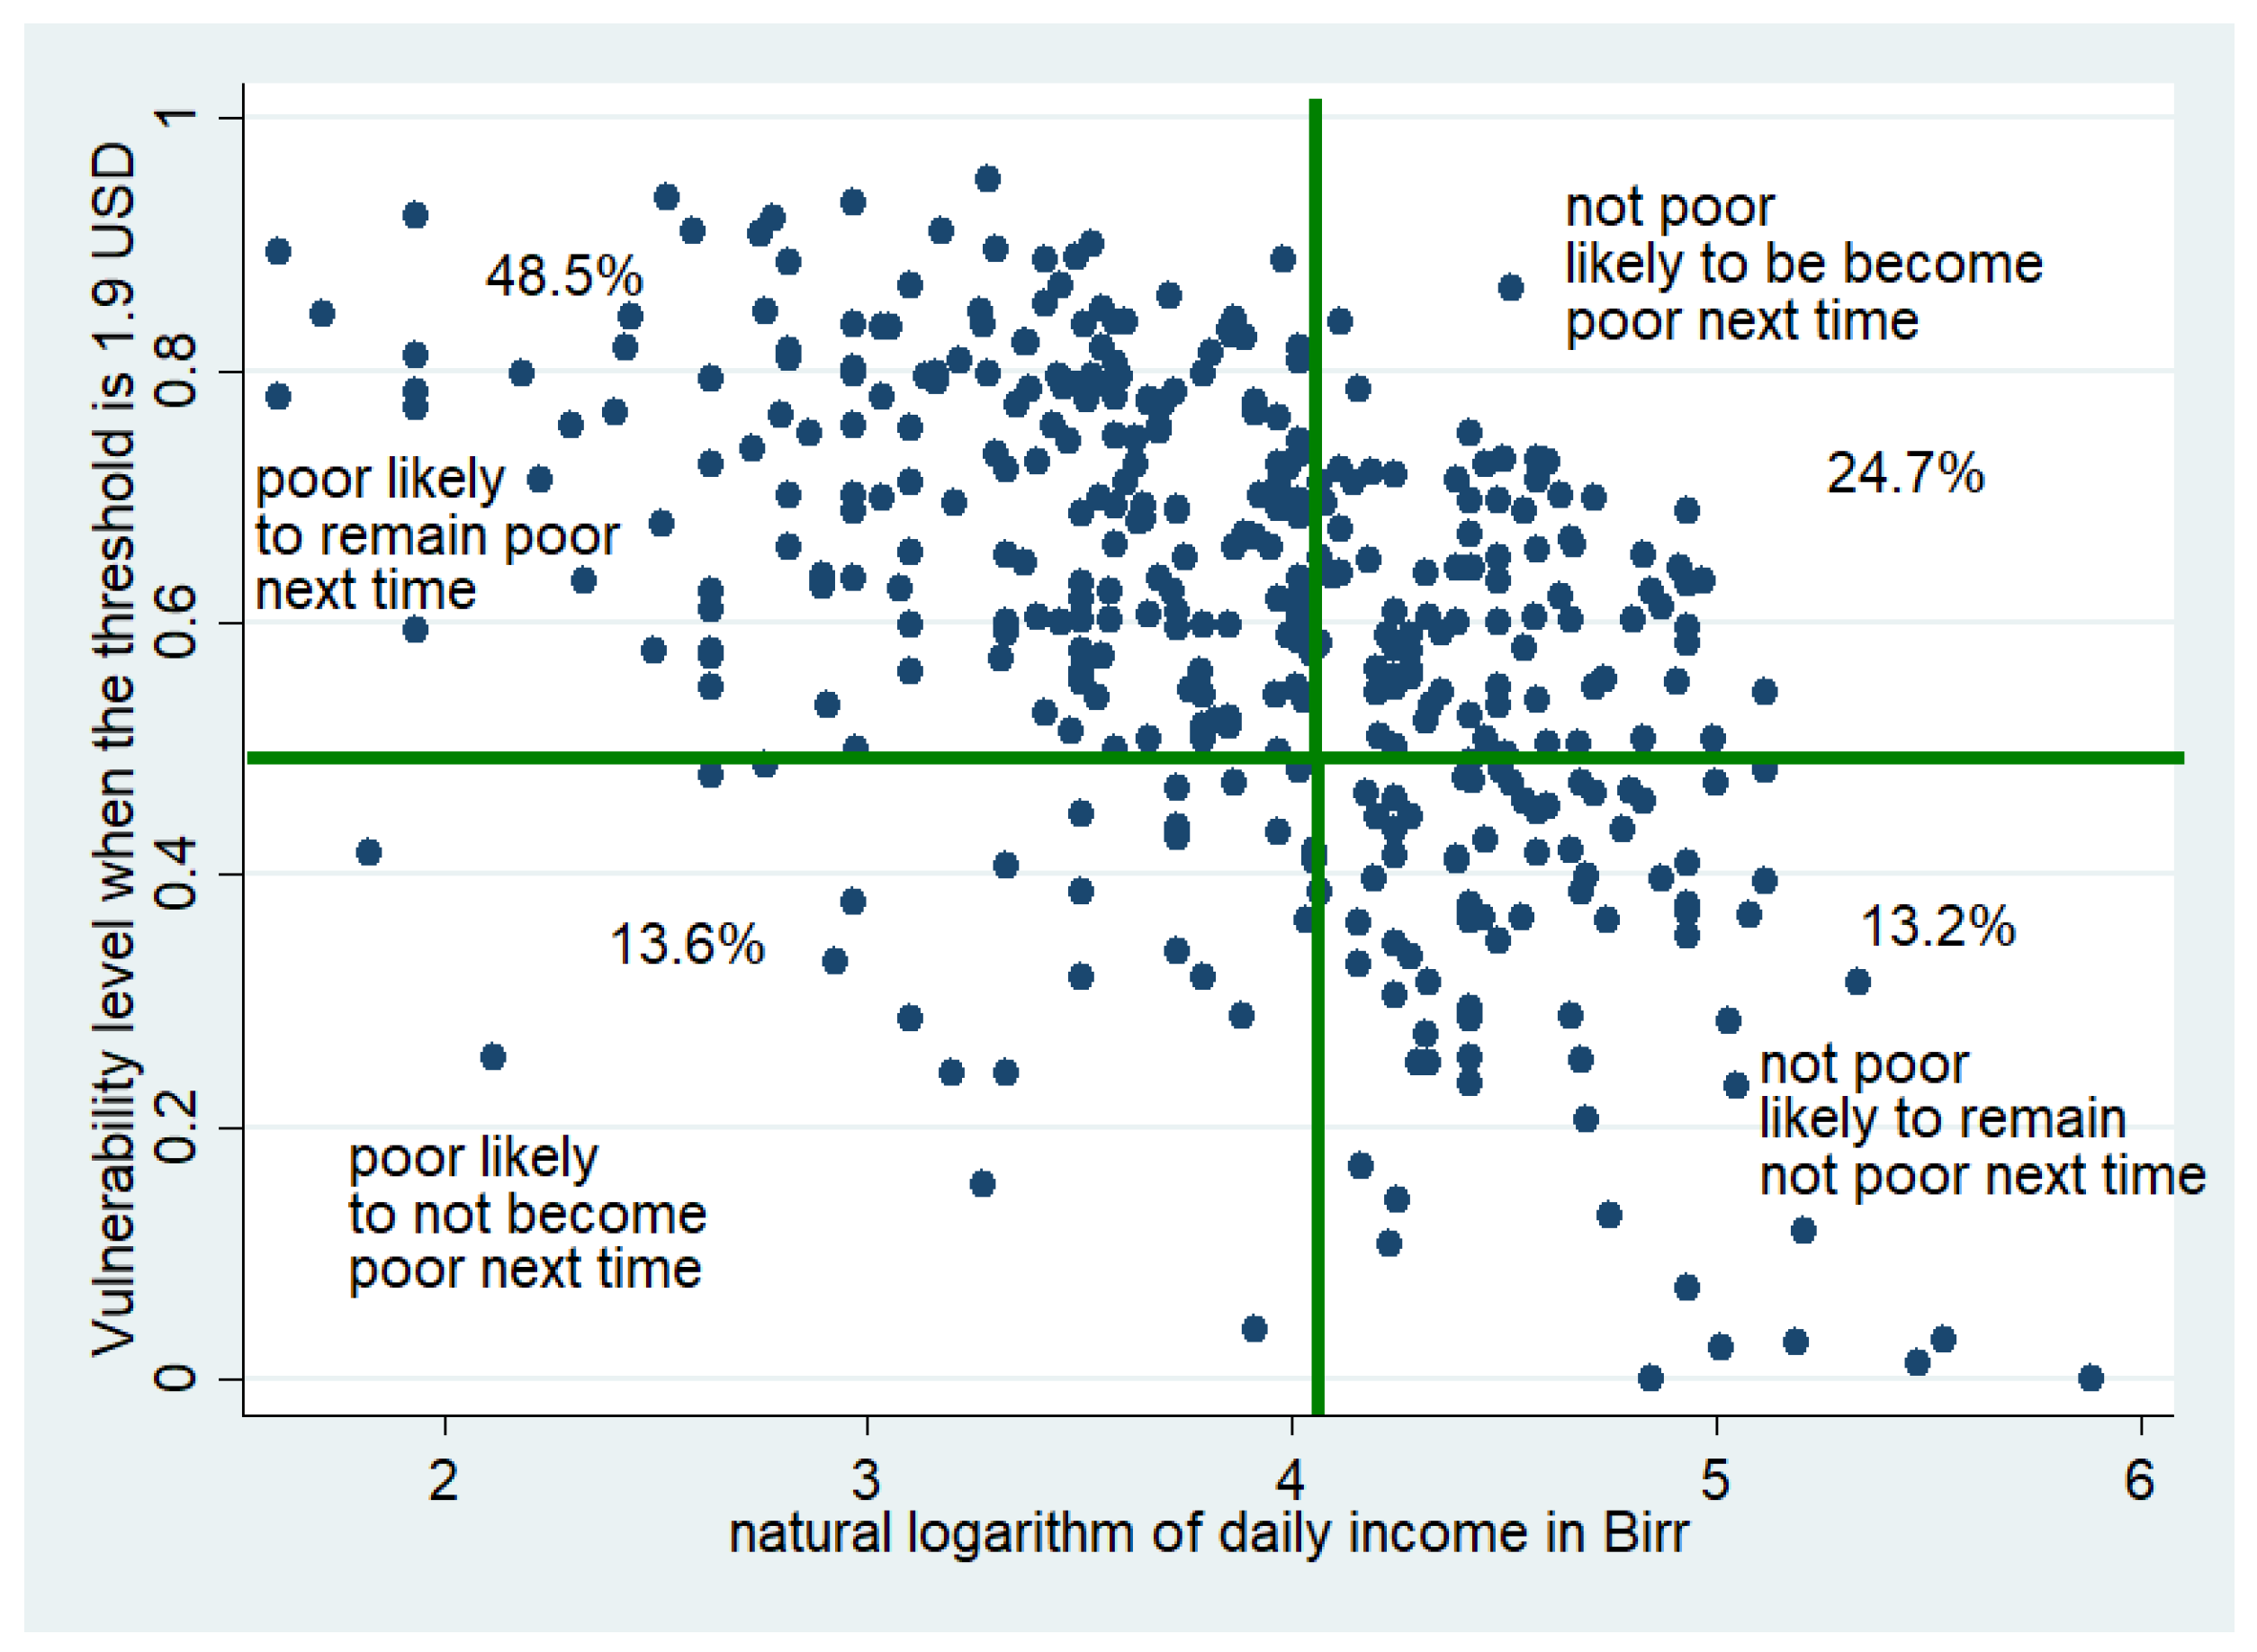
4.2. Sensitivity of Smallholder Farmers Vulnerability to the Poverty Line

Table 3 shows the sensitivity of vulnerability varies with the minimum poverty line threshold. For instance, when the minimum income or poverty line was 1.5 USD per day around 53% of the sample households were vulnerable. Again when the poverty line increased to 1.9 USD, nearly 73% of the sample households were vulnerable. Similarly, when the minimum income level increases to 2.25 USD per day, almost 84% of them were vulnerable. During KII and FGDs, smallholder farmers reported that if there are options like weather index insurance in the study area, their sensitivity to climate change-induced shocks might be reduced.

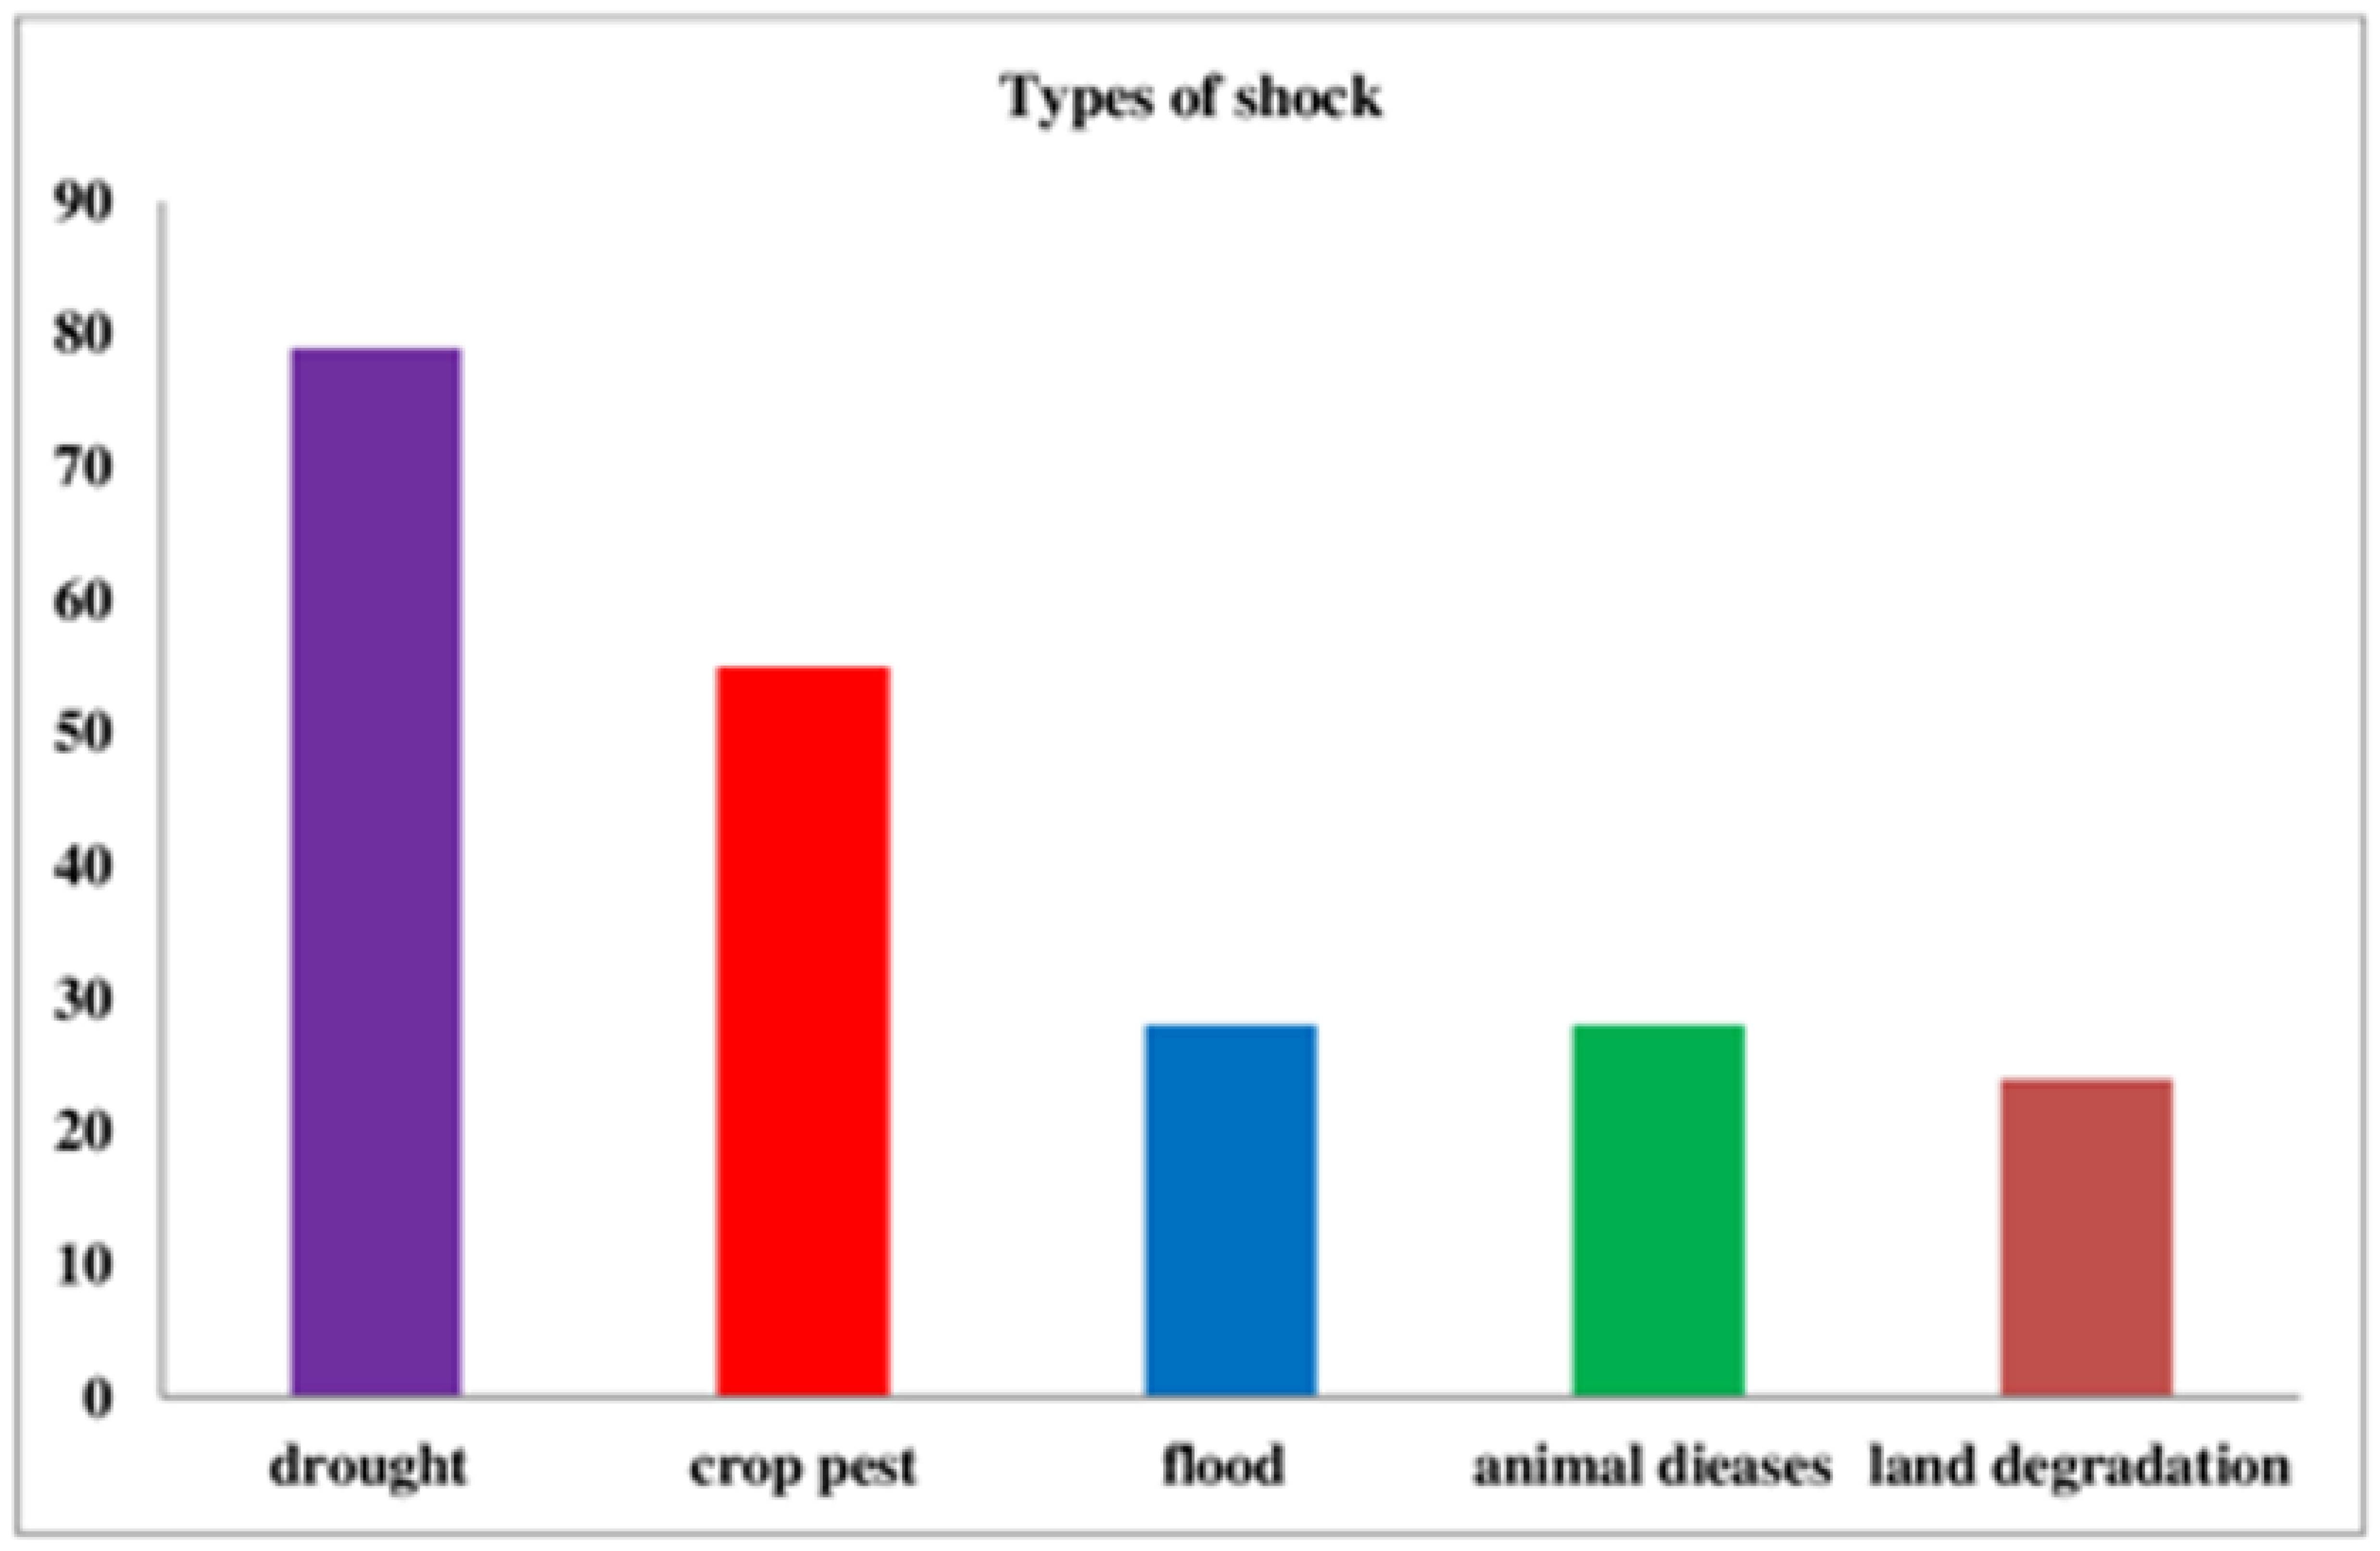
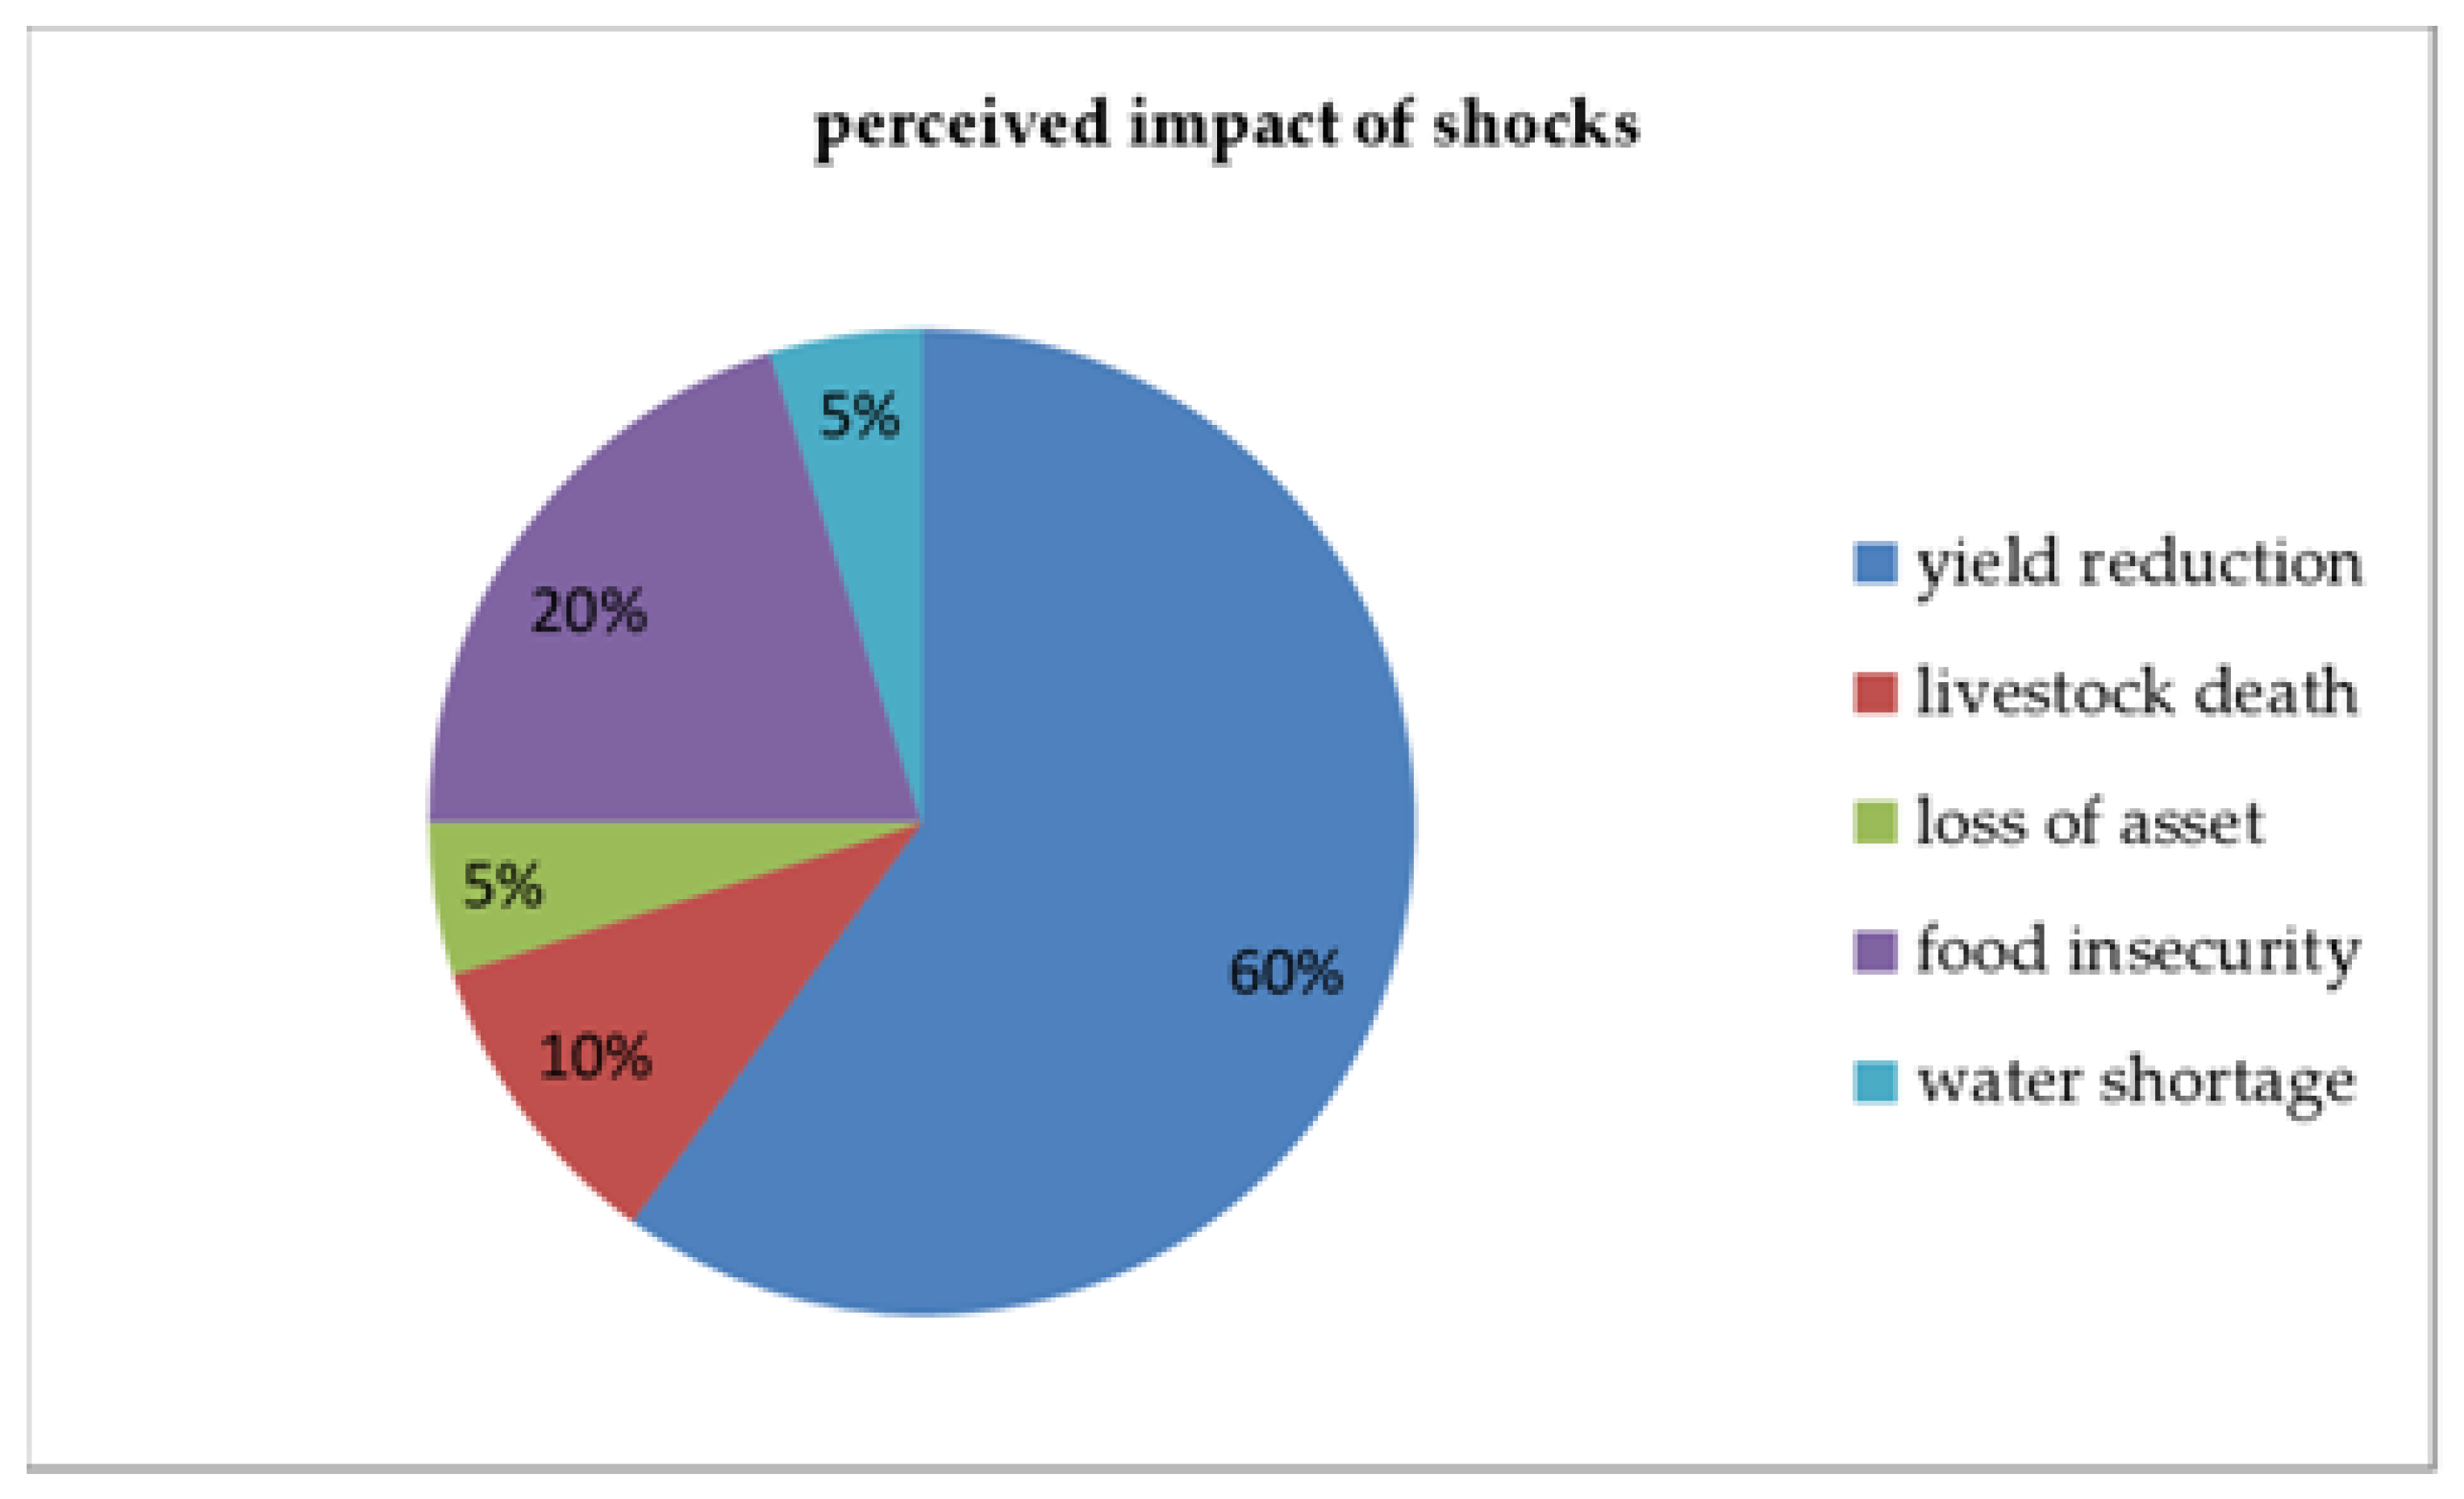
4.3. Types of Shocks and Perceived Impacts

Results from FGDs and KIIs revealed that recurrent drought, erratic, and uneven distribution of rainfall are serious challenges that hinder most smallholder farmers’ livelihood activities. This is serious especially in the lowland and midland agro-ecologies, where crop failure and income loss led them to be poor and food insecure. Smallholder farmers in the study area experienced different types of climate-related shocks. As indicated in Figure 2, about 79% were exposed to drought, nearly 55% reported crop pests, and 28% of them were exposed to floods in the last five years. According to the interviews held with the agricultural office, the frequency of drought was increased from time to time especially in the lowland and midland areas. The officials also indicated that previously, drought occurred every five years but in the last two years, it occurs every year. This shows climate-induced shocks frequently affect the livelihood of smallholder farmers and increased the level of poverty.
The results presented in Figure 3 revealed that a decline in crop yield, death of livestock, loss of assets, food insecurity, and shortage of water were perceived impacts of climate-induced shocks. As a consequence, income from agriculture was decreased and made many households poor.

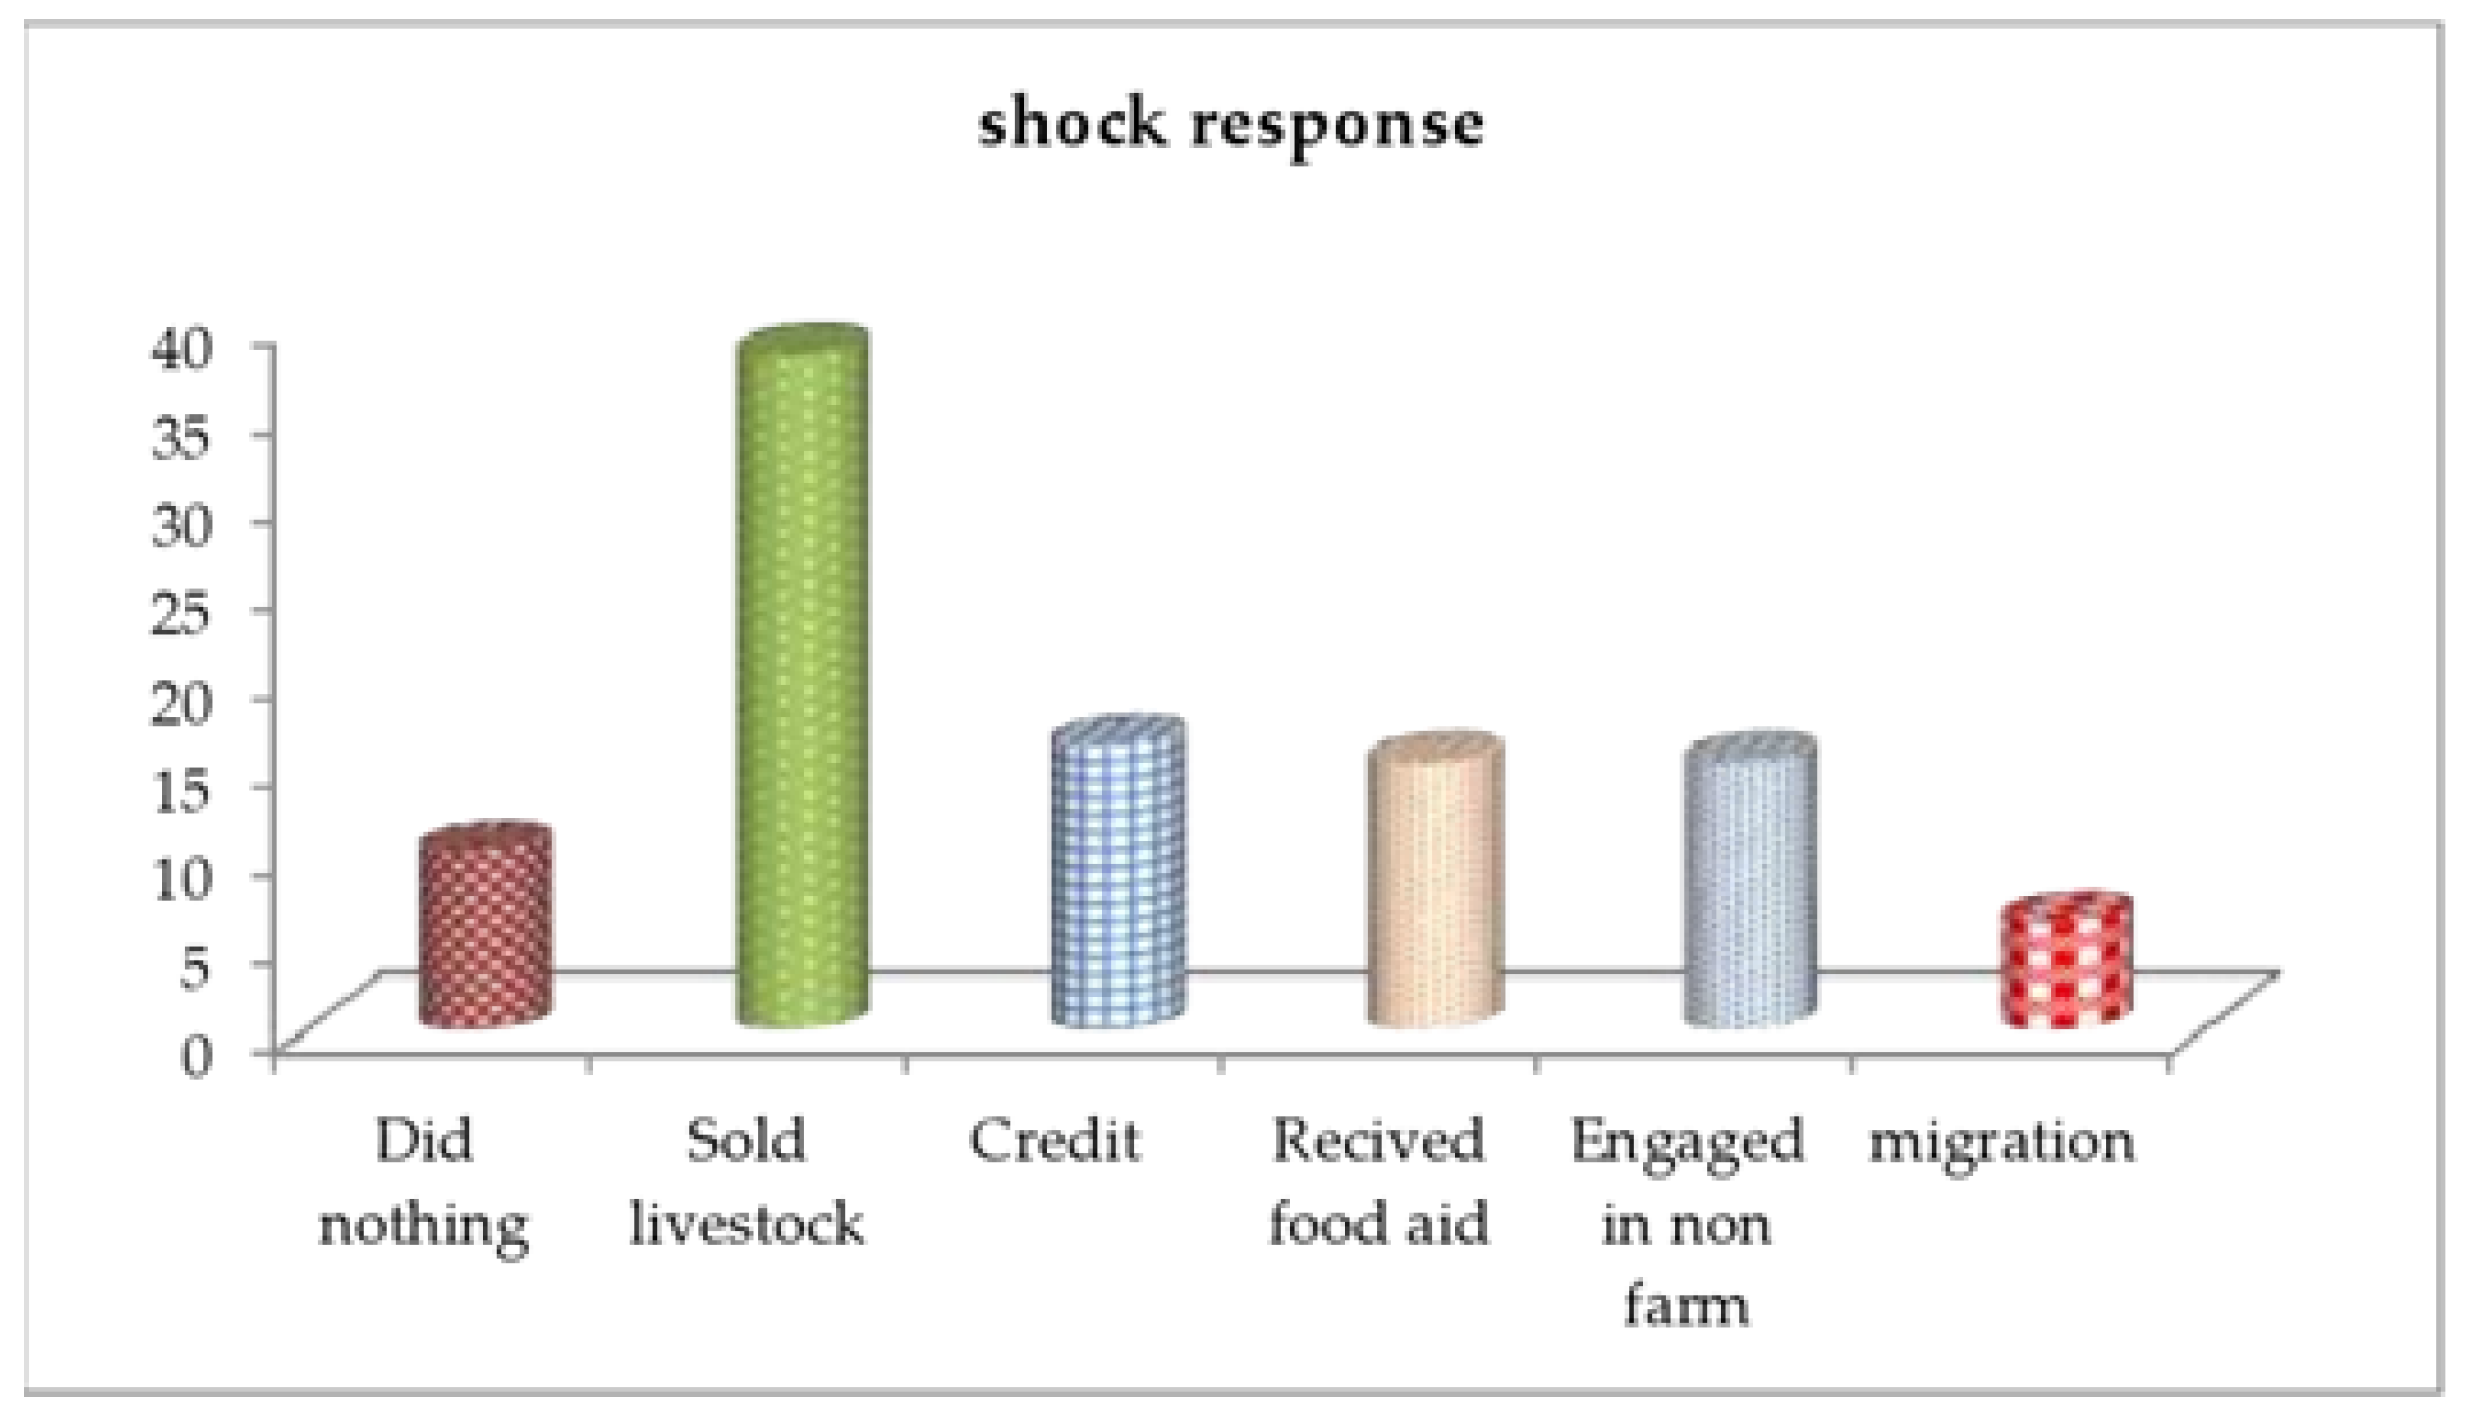
4.4. Major Coping Strategies

In the study area, the occurrence of drought caused crop failure and income loss for most smallholder farmers. In response to the faced shocks, households implemented different coping strategies. The implemented coping strategies indicated in Figure 4 were selling livestock (38%), receiving credit (16%), food for work (15%), participating in non-farm income (15%), and migration (6%). Among these strategies, the largest percentage (38%) of the respondents reported that livestock selling as their major coping strategy. This might be because most of them are agro-pastoralists and mixed farming systems are common in the study area. In response to climatic shocks, smallholder farmers received credit from both formal and informal sources. The result of KIIs revealed that smallholder farmers received credit from microfinance institutions. These institutions give credit and saving services but at the time of shocks, they also provide concessional loans for their members. The study also indicated that smallholder farmers engaged in different income-generating activities to compensate for their income and consumption gap. These income sources include selling firewood and charcoal by deforesting the existing forests. Results from FGDs also confirmed that a dramatic decrease in forest cover over the last 15 years resulted in soil erosion, land degradation, increased frequency of drought. The study further indicated that at the time of climate-induced shocks, few farm households migrate to urban and neighbor districts. The purpose is to support their families’ livelihood through remittance.

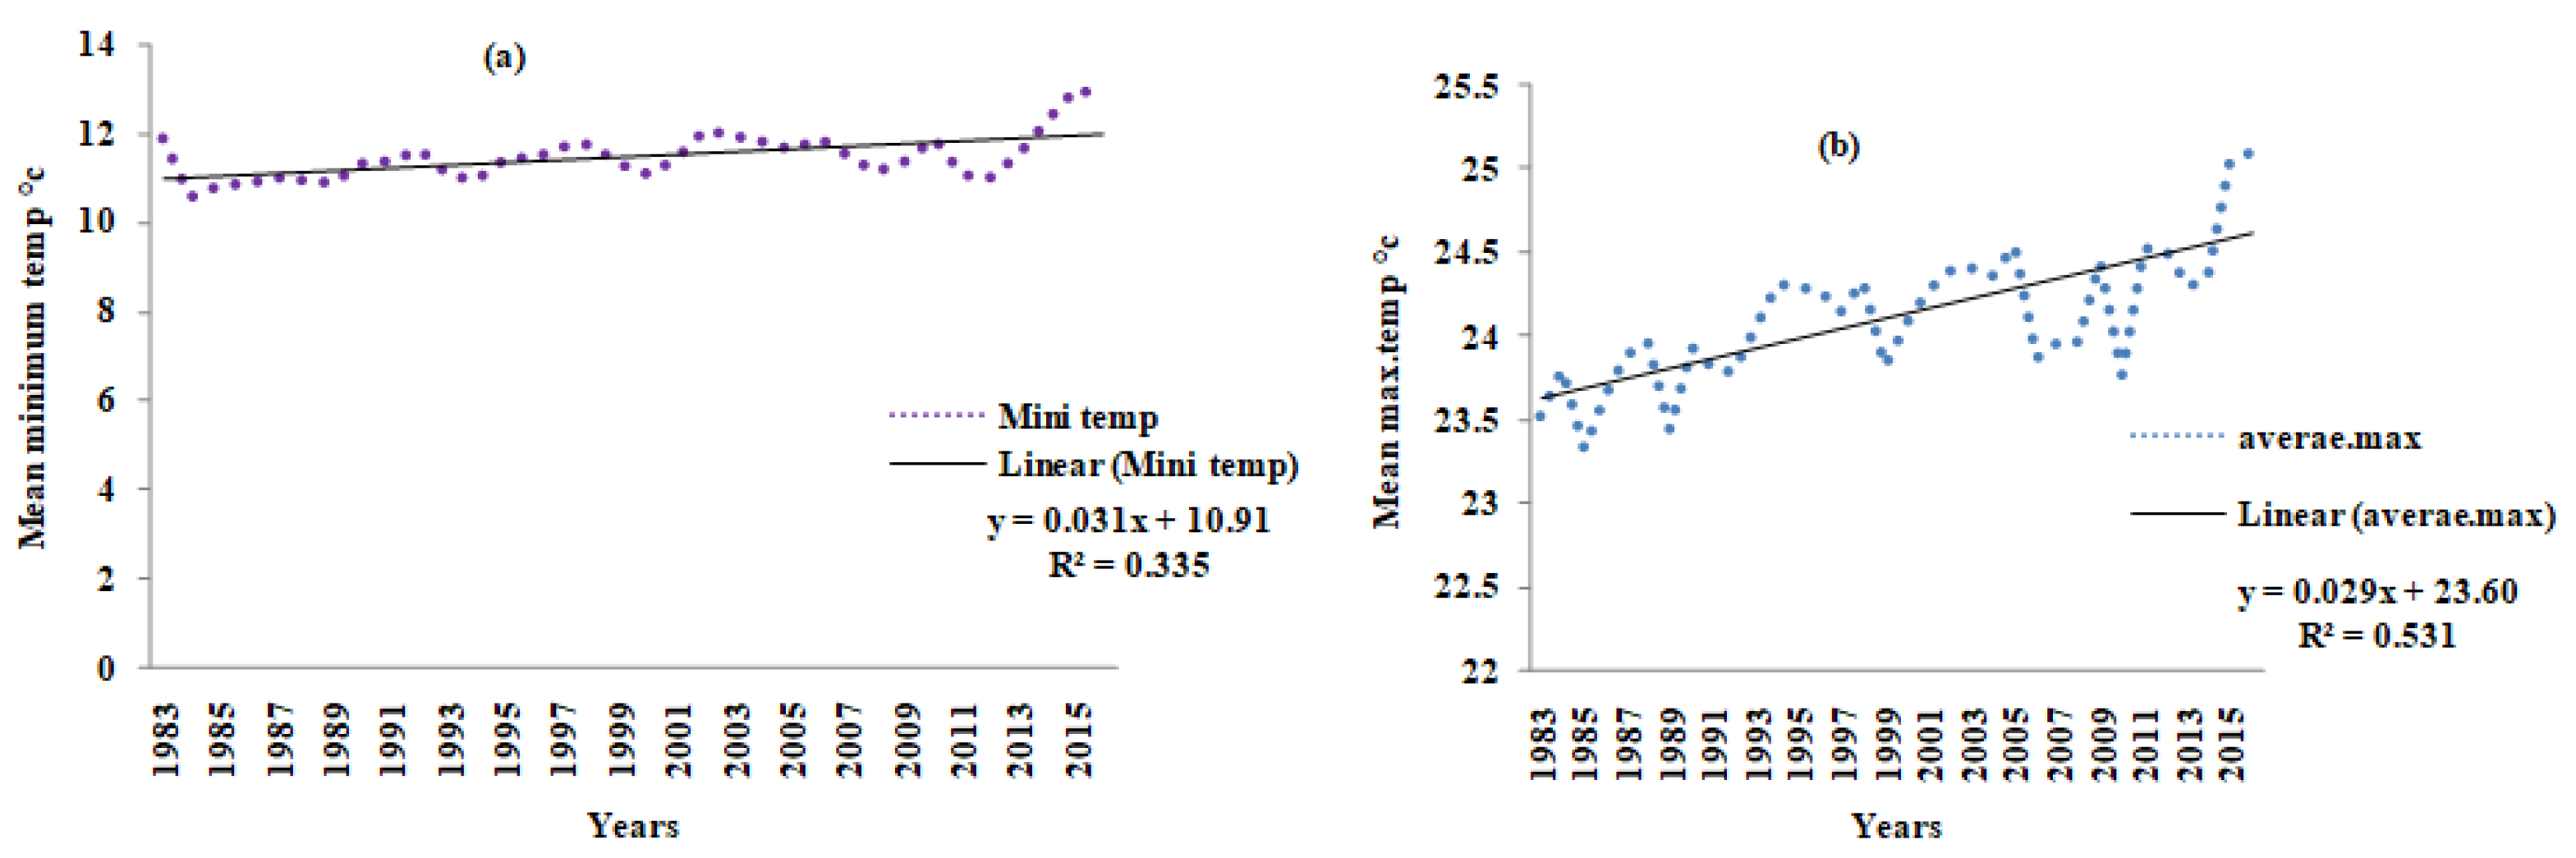
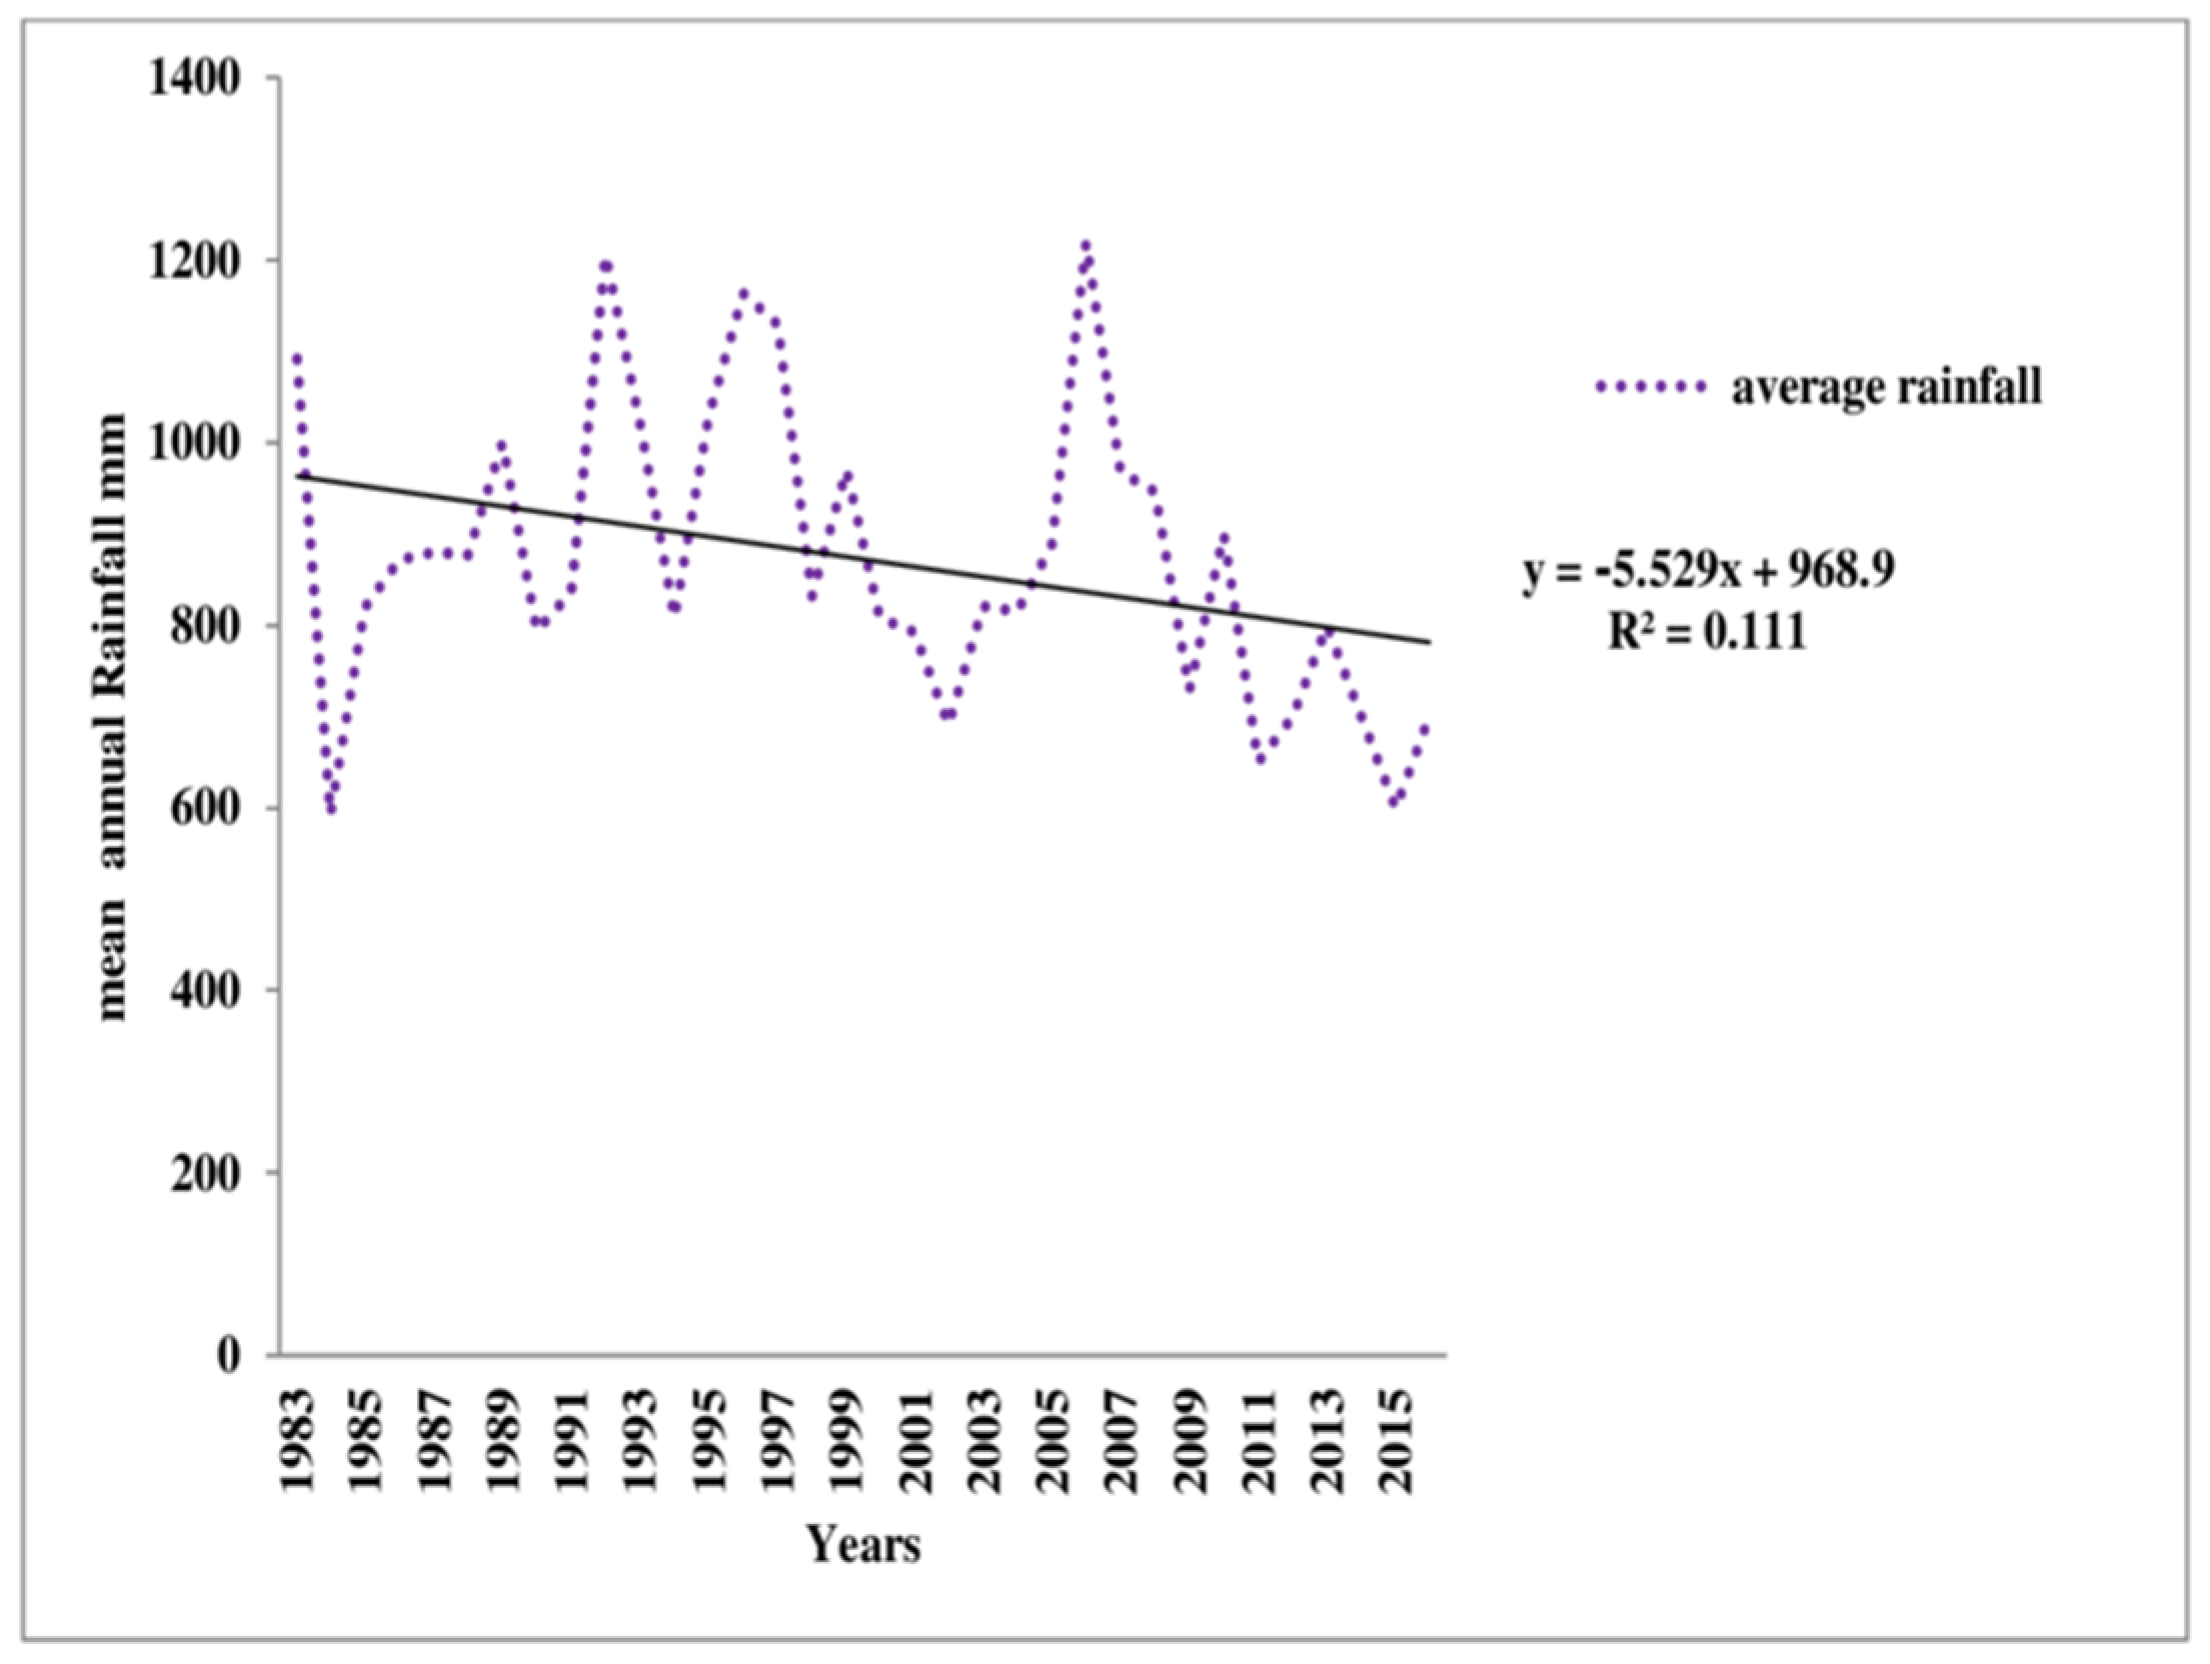
4.5. Rainfall and Temperature Trends of the Study Area

The result presented in Figure 5a,b and Figure 6 show a change in temperature and rainfall, respectively, during the considered years. The positive coefficient of the trend line in both minimum and maximum temperature indicated in Figure 5 shows the increasing trend in temperature. However, the coefficient of the trend line for rainfall presented in Figure 6 was negative which indicates a decreasing trend in rainfall.

4.6. Determinants of Household Vulnerability to Climate Change

The sex of the household head was considered to affect household vulnerability. The current study revealed that the sex of the household head significantly and negatively affected the vulnerability of sample households. Male-headed households were less likely (19%) to be vulnerable to climate change compared to female-headed households (FHH). Moreover, results from the FGDs revealed that cultural norms also increased the vulnerability of female-headed households. For instance, mobility is mainly restricted for FHHs at the time of disasters such as drought. This is because of their multiple roles in the household, such as caring for children and the elderly, that force them to stay at home. The result of KIIs also indicated that climate change is increasing the burden of female-headed households. For example, during drought, they were forced to walk 5-6 h in search of water and firewood. It takes more time and labor if the household did not have a donkey which is mostly true for FHHs. This implies that climate change increased their burden and vulnerability as well.
Increasing the experience of the farmer by one year will significantly decrease the probability of being vulnerable by 0.9%. As the land size of the household increased by one hectare, the probability of the household being vulnerable reduced by 21%. Concerning livestock ownership, the result revealed that as the number of livestock increases by one tropical livestock unit (TLU) unit, the probability of the household being vulnerable was reduced by 4.7%. This is because according to the result obtained from FGDs households used income from livestock to purchase agricultural inputs that improved their income. The result further indicated that households with access to credit are less likely (7.3%) to be vulnerable to climate change than those without access to credit. The study further revealed that households used credit for three basic purposes, namely for the purchase of food items, purchase of agricultural inputs, and animal fatting to fulfill their income and consumption gap.
The current result also indicated that membership in one additional social organization reduced the probability of being vulnerable by 4.2%. Furthermore, according to FGDs results “Equib”, “Idir”, “Feriqa”, and “Guza” were the most common social organizations available in the study area. These organizations are playing a crucial role in reducing the vulnerability of households in many ways. For instance, “Idir” is a funeral association. Its primary purpose is to support households when they lose afamily member. Moreover, when the farm households lose different assets because of drought and flood, they are reimbursed. Similarly, “Guza”and “Feriqa” are labor support systems in which farmers help each other during the harvesting and planting period. These organizations also support those households who cannot farm due to a lack of resources. The result from FGDs revealed that these organizations were reducing their vulnerability to anticipated climate-induced shocks especially during the planting and harvesting periods. This is because the synergy helps them to give quick and on-time responses against the shocks. “Equib” is also another local informal financial association where members make equal and regular contributions to common finance. The purpose is to save money and benefit from lump-sum payment and every member takes the collected money through a rotation system. Specific to the study area, if any member gets difficulty like climate-related shocks, family sickness, or any other urgent issue, priority is given. In general, the results show that these social organizations were playing a crucial role in improving the efficiency of social networking through coordinated action during shocks. Moreover, such type of social capital can help members to recover easily after exposed to climatic shocks.
The current result further revealed that households with better access to climate information were less likely (11%) to be vulnerable to climate change. Moreover, the result indicated that beneficiaries of the productive safety net program (PSNP) were vulnerable compared to non-beneficiaries. The outcome from the econometric model shows that an increase in one-hour travel to the nearest market will increase the probability of being vulnerable by 12.5%. Results from FGDs further indicated that due to lack of market nearest to their village, they were challenged by high transaction costs and forced to sell their product to local agents at a very low price. Moreover, the present study discovered that those households who had relatively better non-farm income had a minimum probability of being vulnerable. The result of this study further revealed that compared to the base category (highland), those farmers living in the lowland and midland agro-ecologies were vulnerable.

5. Discussion

5.1. Vulnerability Status of Households

The result shows that most of the sample smallholder farmers who are currently poor will remain poor next time. This is because most of them were affected by drought repeatedly that aggravated the level of poverty. As poverty and vulnerability to climate change are highly interlinked [35], the poor are vulnerable to climate change. This result is consistent with [44], which explored poverty increased the vulnerability of households to climate change. Since poverty hinders the ability of poor households to respond to climate-induced shocks [39], the poor are vulnerable to these shocks. Poor households in the study area had limited assets and no savings to recover from aftershocks which makes them vulnerable to climate change. Previous studies [15,45] also indicated that poor households were more affected by climate-induced shocks and were considered vulnerable to climate change. The result further indicated that not all the poor, as well as all the non-poor households, were vulnerable to climate-induced shocks. This implies that simply being poor does not make smallholder farmers vulnerable to climatic change, rather it is usually a combination of many factors. These factors are access to institutional services and resources that contribute to their vulnerability. This discovery supports the findings of [15,44].

5.2. Sensitivity of Smallholder Farmers Vulnerability to the Poverty Line

It is revealed that the number of vulnerable households increased as the poverty line increased. The exploration is consistent with the finding of [15], who indicated the vulnerability of Ethiopian farmers increases as the poverty line increases. This is because the livelihood of smallholder farmers in the study area is dependent on rainfed agriculture, which was affected by recurrent drought their income is sensitive to climatic conditions. Experiencing recurrent drought forces households to deplete their productive assets to smooth their current and future consumption. This makes smallholder farmers poor and reduces their ability to respond to climate change. This implies that experiencing climate-induced shocks increases the vulnerability of smallholder farmers to climate change. Farm households in the study area might not be negatively affected by drought if they have access to weather index insurances. This is because weather index insurance can reduce the vulnerability of the poor by improving their capacity to adapt [46]. For the high level of vulnerability in the study area, weather index insurance might be an option to reduce the negative of climate change despite its unavailability. Such institutional service is essential, especially for the poor who may not have the capacity to adapt without external support. Such support helps households to easily recover from aftershocks and reduce forceful asset sales. A similar study by Tafesse et al. [1] measured the vulnerability of smallholder farmers to food insecurity in Eastern Ethiopia and predicted that 63% of the study respondents would have a chance of being food insecure in the future period. In confirmation of this finding, albeit at a higher magnitude, the current study found that 73% of the households were vulnerable to climate change. The discrepancies of statistical figures might be associated with the recent increment of climate-induced shocks such as drought in the study area. This caused the loss of assets and income, limits households’ ability to respond to climate change, and increased their vulnerability.

5.3. Types of Shocks and Major Coping Strategies

Drought, crop pests, and sometimes excessive rainfall were major climate-induced shocks that affected the livelihood of smallholder farmers by reducing the productivity of agriculture. This result is supported by Tesfaye and Seifu [7]. Among these shocks, a higher percentage of respondents reported that drought significantly affected their livelihood and, compared to the highland farmers, the lowland and midland farmers were highly affected. This is because these agro-ecologies receive a low level of rainfall and the farmers in these agro-ecologies have relatively less fertile soil. A similar result was reported by Belay et al. [47] who indicated that lowland and midland farmers were affected by climatic shocks. Furthermore, a high level of deforestation and land degradation were observed in these agro-ecologies which increased the frequency of drought. The result shows how climate-induced shocks aggravate smallholder farmers’ level of poverty by adversely affecting their basic economic sector and increased their vulnerability to climate change. The study conducted by Jamshidi et al. [48] supported this result who indicated that climate-induced shocks such as drought increase the vulnerability of smallholder farmers to climate change. In response to the experienced shocks, farm households used different coping strategies. Among the strategies indicated in Section 4.4, the majority of them used livestock selling as a major coping strategy. Households sold their livestock when they faced climate-related shocks to buffer their income and at the same time to compensate for their consumption gap [49]. This shows that experiencing climate-induced shocks reduced the asset of smallholder farmers’ which reduces their adaptive capacity. For poor households, such shocks increased their vulnerability since they had limited resources which hinder their recovery. The result is consistent with the previous finding [15]. Moreover, the result shows that smallholder farmers also used credit as a coping strategy. Such a coping strategy helps farmers to fill their financial shortage and recover aftershocks. The result indicates that access to credit is extremely useful to recover after they are exposed to climate-induced shocks.The result further indicated that the occurrence of recurrent drought made many households food insecure. Therefore, those farmers who become chronically food insecure participated in the food for work program of PSNP. This is because their participation enables them to smooth their consumption.
The study shows that households used charcoal and firewood selling as a coping strategy. These coping strategies are unsustainable and exacerbate their vulnerability since deforestation negatively affects biodiversity and ecosystem services by increasing soil erosion, nutrient loss, and desertification. This directly contributes to the reduction of agricultural productivity and income of farmers as well. Deforestation also contributes to climate change by increasing greenhouse gas emissions and reduce the amount of carbon that can be stored in forests. The result indicated that although households could fulfill their immediate needs, such strategies increase their vulnerability to climate. This implies that as the level of dependence on natural resources increases, the vulnerability of households to climate change will also increase. Previous studies [39,50] also reported similar results. According to the current result, few respondents reported that households migrate to other areas to search for additional income-generating activities at the time of shocks; such a coping strategy improves the adaptive capacity of farm households by diversifying their income sources and helps to recover. This finding supports the study conducted by Jha et al. [51].

5.4. Temperature and Rainfall Trends

As indicated in the results, rainfall decreased over time but the temperature of the study area increased. Previous studies [52,53,54] also reported similar results in different parts of the country. Mera [55] indicated that climate change is a cause of recurrent drought in Ethiopia. The cause of the occurrence of recurrent drought in the study area is not different from other parts of the country. The reduction in the amount of rainfall and increase of temperature over time caused a reduction in stream flows and water levels in lakes. The best example for this is the drying of lake Haramaya, which was located in the study area. Senti et al. [56] showed that climate change-induced drought was the major factor that contributed to the drying of lake Haramaya. Since the livelihood of smallholder farmers is extremely dependent on rainfed agriculture, the change in these climatic parameters negatively affected their livelihood. Climate change reduced the resilience of the study area with a higher negative effect on the food security status of smallholder farmers. Thus, the study area is one of the chronically food-insecure areas of the country [57].

5.5. Determinants of Household Vulnerability to Climate Change

Female- and male-headed households are impacted by climate change differently. This is because female-headed households have limited access to land, financial services, technologies, and opportunities which made them more vulnerable to climate change than male-headed households. The finding is in line with the results of [1,20,58]. The result also indicated that cultural factors such as restriction of mobility at the time of disasters increased the vulnerability of female-headed households to the negative impact of climate change. This result is in agreement with [58,59]. Moreover, a previous study conducted by Mendoza et al. [59] indicated that female-headed households were more sensitive to the negative impact of climate change. This is because climate change affects their basic responsibilities such as food preparation, fetching water, and collecting firewood. These combined factors made female-headed households more exposed to climatic shocks than their counterparts.
The result in Table 4 shows farming experience negatively and significantly affects the vulnerability of smallholder farmers. This might be because a better farming experience can help farmers to choose and adopt appropriate adaptation strategies and technology. This can help them to increase their farm income and reduce vulnerability. Furthermore, better farming experience will also help farmers to anticipate the negative impact of climate change and adjust their farming accordingly. Previous studies [12,60] also reported that farmers with relatively better farm experience are relatively not vulnerable to climate change.
The current results revealed that smallholder farmers with better land sizes were not vulnerable compared to those with a small size of land. This is because having relatively large farm sizes would allow farmers to implement different adaptation strategies such as crop diversification, irrigation, and soil and water conservation practices that reduce their vulnerability. Moreover, farmers with large land sizes have better incomes [15] so they can use improved technologies to respond to the negative impact of climate change. A previous study by Bedeke et al. [20] indicated that households with small land sizes were vulnerable because of poor soil fertility resulting from intensive cultivation. Similar results were also reported by Israel and Belay [19].
Related to livestock ownership, the logit model result shows that ownership significantly and negatively affected vulnerability. This indicates that those households with better numbers of livestock in TLU were not vulnerable. The probable explanation for this might be livestock can generate additional income through the processing and marketing of its products [61]. This shows that households with better number of livestock have better financial resources to respond to climate-induced shocks. In line with the finding of this study, Deressa et al. [15] indicated that households who own livestock are less vulnerable than households who do not own livestock. Other studies [19,62] also reported a similar result.
Access to credit is one form of institutional support that reduces the negative consequence of climate change. The result of the model output shows access to credit negatively and significantly affects household vulnerability. This is because using credit farm households fulfills their consumption gaps which reduced food insecurity, improved their income, and built their assets. A previous study by Bedeke et al. [20] also showed that households who used credit to begin small businesses such as animal fatting and petty trade were generating additional income besides their farm income. Such income-generating activities improve the adaptive capacity and help them to reduce their vulnerability to climate change. The results are consistent with previous findings of [15,20].
Membership of social groups was used as a proxy for social capital [63] and assessed by the number of social organizations in which a household participates. In the present study, social capital was noticed negatively and significantly contributed to household vulnerability. This might be because social capital can promote group and community discussions which enhance better information flows [15]. Moreover, social capital can be used as an important asset that will be utilized during shocks. This implies that social capital helps poor households to quickly access resources that reduce their vulnerability. This result is in line with the finding of Saptutyningsih and Jaung [40], who indicated farmers’ engagement in groups increased their knowledge on the impact of climate change. This will have the potential capacity in reducing their vulnerability to climatic shocks. The study also indicated the role of local social organizations such as “Equib”, “Idir”, “Feriqa”, and “Guza” in assisting their members through coordinated action before shocks and collective response aftershocks. The findings are in agreement with many previous studies [15,24,64].
Climate information negatively and significantly affects household-level vulnerability. This indicates households with better access to climate and early warning information was not vulnerable compared to those with no access to this service. This is because climate-related information such as the occurrence of drought, flood, crop/animal disease, and onset and offset of rainfall can assist farmers in selecting appropriate climate change adaptation strategies that can reduce the extended impact of these events. According to Shiferaw et al. [42], access to climate information and early warning systems help farmers to reduce their vulnerability to climatic shocks. This is because such information helps farmers prepare themselves for climate-related forecasted shocks. This result implies that climate information will enable households to take early action and reduce their vulnerability. The present result is in line with [60] which indicated that households with better access to climate information were not vulnerable to climatic change.
The findings of the present study revealed that membership in a productive safety net program (PSNP) affected vulnerability significantly and positively. This implies that beneficiaries of the PSNP were vulnerable to climate change. In contrast to this result, [41] reported that membership in PSNP increased the probability of using agricultural technologies which can help them to improve their livelihood and reduces their vulnerability to climate-related shocks. Similarly, Shiferaw et al. [42] also showed the importance of safety nets in protecting vulnerable households from the continual impacts of shocks. However, the current result is in line with the finding of Berhane et al. [65] who reported PSNP beneficiary households were poor and vulnerable compared to non-beneficiary households. This might be because the criteria for beneficiary selection considered those households who are chronically food insecure and who suddenly become poor as a result of climatic shocks like drought [66]. The other probable reason for this result might be most of the beneficiaries received the support only for one year. Therefore, most of them did not improve their income and the impact of PSNP might not be positive within this short period of membership. This result is in line with [65], which reported that those households who received the transfer for only one year remained poor compared to others. This implies that although PSNP was targeted to improve the livelihood of both resource and income poor households simply being a beneficiary of the program might not reduce the vulnerability of the poor.
The outcome from the econometric model revealed that households nearest to the market are not vulnerable compared to those households far from the market. This might be because the market serves as a means of exchanging information with other farmers about new technologies and adaptation strategies [15]. Therefore, using such information, households will adjust themselves accordingly and reduce their vulnerability. According to the result, those households relatively far from the market were challenged by high transaction costs to sell their output and purchase inputs. This implies that having a market nearer to their residence enables farmers to buy different inputs with an optimum price and sell their outputs at a minimum cost. In general, this result shows distance to the market increases vulnerability. This result is supported by the findings of Tesso et al. [18].
The current result shows that those households with relatively better non-farm income were not vulnerable. This might be because income from agriculture is sensitive to climate-induced shocks, therefore having an additional income reduced the financial constraints of households. Previous studies [18,20] also reported that having multiple sources of income reduces the vulnerability of farm households to climatic shocks. Additionally, engaging in different non-farm incomes is very important for farm-based households. This is because involvement in such activities helps households to builds their assets and reduces their vulnerability [39]. This result implied that diversifying income to other sources than relying only on agriculture can reduce vulnerability.
Households living in different agro-ecological settings face different types of climate-related shocks [18]. The current results indicated that farmers living in the lowland and midland agro-ecologies are vulnerable. This is because these agro-ecologies are severely affected by recurrent drought, erratic rainfall, soil erosion, and land degradation compared to the highland. As a result, the productivity of farmland and income from agriculture is reduced, which makes smallholder farmers’ living in these agro-ecologies vulnerable. This result is also consistent with many previous studies [12,15,19]. However, the result of this study contradicts the findings of Tesso et al. [18].

6. Conclusions and Policy Implications

Climate change is a global challenge affecting every individual, household, and community. Its effects are more pronounced on poor farmers compared to others. As agriculture is the major source of income for sample households, experiencing recurrent drought made the majority of them vulnerable to climate change. It was learned that higher exposure to climate-induced shocks such as drought increased the vulnerability of farm households. Therefore, to reduce the level of vulnerability of smallholder farmers to climate change creating, non-farm employment opportunities should be an integral part of climate change adaptation and poverty reduction policies and strategies. In the study area, compared to non-poor households, poor households have a higher chance of being vulnerable to climate change-induced shocks. This is because the poor had lower adaptive capacity due to limited assets and capital. Therefore, there is a need to design climate change adaptation policies that improve the adaptive capacity of the poor. Such policies might include improving access to weather indexed insurances because this can help households to protect their assets and recover easily from aftershocks. Moreover, the study also indicated that in addition to poverty and climatic factors the vulnerability of farm households was also influenced by different factors. This indicates that simply being poor does not make a household vulnerable to climatic change, rather it is usually a mixture of many factors. The current study indicated that a household that was headed by a female was vulnerable due to a lack of access to services and resources. Therefore, local government should also work on women empowerment so that they can claim their right to have access to different services and resources that reduce their vulnerability. Since having better farm experience reduced the vulnerability of farm households, continuous training on climate change impact and adaptation options should be given to young and less experienced farmers.
The current result also indicated that having relatively better resources such as livestock and land reduces the vulnerability of households significantly. Therefore, encouraging and supporting households to have these assets is very crucial in reducing their vulnerability. Having access to institutional services such as agricultural extension, credit, market, and climate information made households non-vulnerable compared to those who did not have access to these services. Therefore, there is a need to design policies that focus on improving access to these services. The local government should also encourage and support the establishment as well as the participation of households in different local social organizations such as “Equib”, “Idir”, “Feriqa”, and “Guza” because these organizations play a crucial role in reducing vulnerability by enhancing better information flows and supporting each other during shocks. The current study further revealed that living in the lowland and midland agro-ecologies made households vulnerable to climate-induced shocks. This suggests considering agroecological differences in designing climate change adaption policies. The current study further revealed that in contrast to the goal of a productive safety net program (PSNP), being a beneficiary of the program rather made households vulnerable. Therefore, this program should be integrated with other income-generating activities to help the poor households quickly recover from shocks, improve their wellbeing, and reduce their vulnerability.

Author Contributions

T.Z. generated the idea and study design, collected data, carried out data analysis, and write up. F.B., T.D., J.Y. and T.K. provided statistical assistance, and read, revised, and shaped the manuscript to the present form. All authors have read and agreed to the published version of the manuscript.

Funding

Africa Centre of Excellence for Climate Smart Agriculture and Biodiversity Conservation, Haramaya University, and Debre Markos University funded this research as part of a Ph.D. study.

Institutional Review Board Statement

Not applicable.

Informed Consent Statement

Not applicable.

Data Availability Statement

This is not applicable to this article since no data sets were generated.

Acknowledgments

The authors would like to express sincere gratitude to all officials, sample respondents, and experts who participated in providing relevant information and data collection.

Conflicts of Interest

The authors declare that they have no conflict of interest.

References

  1. Tafesse, A.; Ayele, G.; Ketema, M.; Geta, E. Food Security and Adaptation Strategies to Climate Change in Eastern Ethiopia. Econ. Res. 2015, 5, 81–88. [Google Scholar] [CrossRef]
  2. Serdeczny, O.; Adams, S.; Baarsch, F.; Coumou, D.; Robinson, A.; Hare, W.; Schaeffer, M.; Perrette, M.; Reinhardt, J. Climate change impacts in Sub-Saharan Africa: From physical changes to their social repercussions. Reg. Environ. Chang. 2017, 17, 1585–1600. [Google Scholar] [CrossRef]
  3. Thornton, P.K.; Jones, P.G.; Ericksen, P.J.; Challinor, A.J. Agriculture and food systems in sub-Saharan Africa in a 4 °C + world, Philos. Trans. R. Soc. A Math. Phys. Eng. Sci. 2011, 369, 117–136. [Google Scholar] [CrossRef] [Green Version]
  4. Deressa, T.T.; Hassan, R.M.; Ringler, C. Perception of and adaptation to climate change by farmers in the Nile basin of Ethiopia. J. Agric. Sci. 2011, 149, 23–31. [Google Scholar] [CrossRef] [Green Version]
  5. You, G.J.Y.; Ringler, C. Hydro-Economic Modeling of Climate Change Impacts in Ethiopia; IFPRI Discussion Paper; International Food Policy Research Institute (IFPRI): Washington, DC, USA, 2010; Volume 960. [Google Scholar]
  6. Muleta, B.G.; Mummed, Y.Y.; Kurtu, M.Y. Assessment of Beef Cattle Production and Marketing Practice in Eastern Oromia, Ethiopia. Effect of Climate Change on Agricultural Production and Community Response in Daro Lebu & Mieso District, West Hararghe Zone, Oromia Region National State, Ethiopia. Researchgate Net. Available online: https://www.researchgate.net/publication/332343390 (accessed on 23 October 2019).
  7. Tesfaye, W.; Seifu, L. Climate change perception and choice of adaptation strategies. Int. J. Clim. Chang. Strateg. Manag. 2016, 8, 253–270. [Google Scholar] [CrossRef]
  8. Aragie, E.A. Climate Change, Growth, and Poverty in Ethiopia; Working Paper No.3; Texas University at Austin: Austin, TX, USA, 2013. [Google Scholar]
  9. Yalew, A.W.; Hirte, G.; Lotze-Campen, H.; Tscharaktschiew, S. EconStor: Economic Effects of Climate Change in Developing Countries: Economy-Wide and Regional Analysis for Ethiopia; CEPIE Working Paper. No. 10; Technische University Dresden, Center of Public and International Economics: Dresden, Germany, 2017. [Google Scholar]
  10. Alemu, T.; Mengistu, A. Impacts of Climate Change on Food Security in Ethiopia: Adaptation and Mitigation Options: A Review. Clim. Chang. Manag. 2019, 2019, 397–412. [Google Scholar] [CrossRef]
  11. Georgis, K. Planning National Adaptation Responses to Climate Change, Climate Change Agriculture and Food Security, No. 1; CGIAR Research Program on Climate Change, Agriculture and Food Security: Copenhagen, Denmark, 2015; Available online: www.ccafs.cgiar.org (accessed on 15 November 2019).
  12. Chala, D.; Belay, S.; Bamlaku, A.; Azadi, H. Agro-ecological based small-holder farmer’s livelihoods vulnerability to climate variability and change in Didesa sub-Basin of Blue Nile River, Ethiopia. J. Agric. Res. 2016, 4, 230–240. Available online: https://www.academiapublishing.org/jo.../ (accessed on 14 October 2020).
  13. Islam, M.M.; Sallu, S.; Hubacek, K.; Paavola, J. Vulnerability of fishery-based livelihoods to the impacts of climate variability and change: Insights from coastal Bangladesh. Reg. Environ. Chang. 2014, 14, 281–294. [Google Scholar] [CrossRef] [Green Version]
  14. Alebachew, A.; Woldeamlak, B. A Climate Change Country Assessment Report for Ethiopia Submitted to Forum for Environment, Ethiopian Civil Society Network on Climate Change (ECSNCC). 2011. Available online: https://www.academia.edu/5357744/ (accessed on 20 October 2020).
  15. Deressa, T.; Hassan, R.M.; Ringler, C. Measuring Ethiopian Farmers’ Vulnerability to Climate Change across Regional States; IFPRI Discussion Paper; International Food Policy Research Institute (IFPRI): Washington, DC, USA, 2008; Volume 806, p. 32. Available online: http://www.ifpri.org/publication/ (accessed on 1 January 2019).
  16. Gebreegziabher, Z.; Mekonnen, A.; Bekele, R.D.; Bane, J.; Zewdie, S.A. Mapping Vulnerability to Climate Change of the Farming Sector in the Nile Basin of Ethiopia. Environment for Development. 2016. Available online: https://media.rff.org/documents/EfD-DP-16-19.pdf (accessed on 1 January 2019).
  17. Gebrehiwot, T.; van der Veen, A. Climate change vulnerability in Ethiopia: Disaggregation of Tigray Region. J. East. Afr. Stud. 2013, 7, 607–629. [Google Scholar] [CrossRef]
  18. Tesso, G.; Emana, B.; Ketema, M. Analysis of vulnerability and resilience to climate change induced shocks in North Shewa, Ethiopia. Agric. Sci. 2012, 3, 871–888. [Google Scholar] [CrossRef] [Green Version]
  19. Tessema, I.; Simane, B. Vulnerability analysis of smallholder farmers to climate variability and change: An agro-ecological system-based approach in the Fincha’a sub-basin of the upper Blue Nile Basin of Ethiopia. Ecol. Process. 2019, 8, 1–18. [Google Scholar] [CrossRef] [Green Version]
  20. Bedeke, S.B.; Vanhove, W.; Wordofa, M.G.; Natarajan, K.; Van Damme, P. Vulnerability to climate change among maize-dependent smallholders in three districts of Ethiopia. Environ. Dev. Sustain. 2020, 22, 693–718. [Google Scholar] [CrossRef]
  21. Tessema, Y.A.; Aweke, C.S.; Endris, G.S. Understanding the process of adaptation to climate change by small-holder farmers: The case of east Hararghe Zone, Ethiopia. Agric. Food Econ. 2013, 1, 1. [Google Scholar] [CrossRef] [Green Version]
  22. Tazeze, A.; Haji, J.; Ketema, M. Climate Change Adaptation Strategies of Smallholder Farmers: The Case of Babilie District, East Harerghe Zone of Oromia Regional State of Ethiopia. J. Econ. Sustain. Dev. 2012, 3, 1–12. Available online: www.iiste.org (accessed on 23 December 2019).
  23. Zarafshani, K.; Sharafi, L.; Azadi, H.; Van Passel, S. Vulnerability Assessment Models to Drought: Toward a Conceptual Framework. Sustainability 2016, 8, 588. [Google Scholar] [CrossRef] [Green Version]
  24. Adger, W.N.; Kelly, P.M. Social vulnerability to climate change and the architecture of entitlements. Mitig. Adapt. Strateg. Glob. Chang. 1999, 4, 253–266. [Google Scholar] [CrossRef]
  25. Adger, W.N. Vulnerability. Glob. Env. Chang. 2006, 16, 268–281. [Google Scholar] [CrossRef]
  26. Proag, V. The Concept of Vulnerability and Resilience. Procedia Econ. Financ. 2014, 18, 369–376. [Google Scholar] [CrossRef] [Green Version]
  27. Bernstein, L.; Bosch, P.; Canziani, O.; Chen, Z.; Christ, R.; Davidson, O.; Hare, W.; Hug, S.; Karoly, D.; Cattsov, V.; et al. An Assessment of the Intergovernmental Panel on Climate Change. In Proceedings of the IPCC, 2007: Climate Change Synthesis Report, Valencia, Spain, 17 November 2007; Volume 446, pp. 12–17. Available online: http://www.ipcc.ch/pdf/assessment-report/ar4/syr/ar4_syr.pdf (accessed on 3 February 2019).
  28. Hoddinott, J.; Quisumbing, A. Methods for Microeconometric Risk and Vulnerability Assessment. In Risk, Shocks, and Human Development; Palgrave Macmillan: London, UK, 2010; pp. 62–100. [Google Scholar]
  29. Chaudhuri, S.; Jalan, J.; Suryahadi, A. Assessing Household Vulnerability to Poverty from Cross-Sectional Data: A Methodology and Estimates from Indonesia; Columbia University: New York, NY, USA, 2002. [Google Scholar]
  30. Kim, N. How much more exposed are the poor to natural disasters? Global and regional measurement. Disasters 2012, 36, 195–211. [Google Scholar] [CrossRef]
  31. Leichenko, R.; Silva, J.A. Climate change and poverty: Vulnerability, impacts, and alleviation strategies. WIREs Clim. Chang. 2014, 5, 539–556. [Google Scholar] [CrossRef]
  32. Agricultiral Office East Hararghe Zone. General Discription of East Hararge Zone, Harar; Agricultiral Office East Hararghe Zone: East Hararghe, Ethiopia, 2018. [Google Scholar]
  33. Kothari, C.R. Research Methodology Methods and Techniques, 2nd ed.; New Age International Publisher: New Delhi, India, 2004. [Google Scholar]
  34. Shewmake, S. Vulnerability and the Impact of Climate Change in South Africa’s Limpopo River Basin. SSRN Electron. J. 2008, 804, 1–34. [Google Scholar] [CrossRef] [Green Version]
  35. Haughton, J.; Khandker, S.R. Poverty + Inequality; World Bank: Washington, DC, USA, 2009. [Google Scholar]
  36. Amemiya, T. The Maximum Likelihood and the Nonlinear Three-Stage Least Squares Estimator in the General Nonlinear Simultaneous Equation Model. Econometrica 1977, 45, 955. [Google Scholar] [CrossRef]
  37. World Bank. 2016: Estimating International Poverty Lines from Comparable National Thresholds; Jolliffe, D., Prydz, E.B., Eds.; The World Bank: Washington, DC, USA, 2016. [Google Scholar] [CrossRef] [Green Version]
  38. Opiyo, F.E.; Wasonga, O.V.; Nyangito, M.M. Measuring household vulnerability to climate-induced stresses in pastoral rangelands of Kenya: Implications for resilience programming. Pastoralism 2014, 4, 1–15. [Google Scholar] [CrossRef] [Green Version]
  39. Antwi-Agyei, P.; Dougill, A.J.; Fraser, E.D.; Stringer, L.C. Characterising the nature of household vulnerability to climate variability: Empirical evidence from two regions of Ghana. Environ. Dev. Sustain. 2013, 15, 903–926. [Google Scholar] [CrossRef]
  40. Saptutyningsih, E.; Diswandi, D.; Jaung, W. Does social capital matter in climate change adaptation? A lesson from the agricultural sector in Yogyakarta, Indonesia. Land Use Policy 2018, 95, 104189. [Google Scholar] [CrossRef]
  41. Welteji, D.; Mohammed, K.; Hussein, K. The contribution of Productive Safety Net Program for food security of the rural households in the case of Bale Zone, Southeast Ethiopia. Agric. Food Secur. 2017, 6, 1–11. [Google Scholar] [CrossRef] [Green Version]
  42. Shiferaw, B.; Tesfaye, K.; Kassie, M.; Abate, T.; Prasanna, B.M.; Menkir, A. Managing vulnerability to drought and enhancing livelihood resilience in sub-Saharan Africa: Technological, institutional and policy options. Weather Clim. Extrem. 2014, 3, 67–79. [Google Scholar] [CrossRef] [Green Version]
  43. Froese, R.; Schilling, J. The Nexus of Climate Change, Land Use, and Conflicts. Curr. Clim. Chang. Rep. 2019, 5, 24–35. [Google Scholar] [CrossRef] [Green Version]
  44. Eriksen, S.H.; O’brien, K. Vulnerability, poverty and the need for sustainable adaptation measures. Clim. Policy 2007, 7, 337–352. [Google Scholar] [CrossRef]
  45. Huong, N.T.L.; Yao, S.; Fahad, S. Assessing household livelihood vulnerability to climate change: The case of Northwest Vietnam. Hum. Ecol. Risk Assess. Int. J. 2018, 25, 1157–1175. [Google Scholar] [CrossRef]
  46. Schaefer, L.; Waters, L. Climate Risk Insurance for the Poor & Vulnerable: How to Effectively Implement the Pro-Poor Focus of Insuresilience. An Analysis of Good Practice, Literature, and Expert Inter Views. Munich Climate Insurance Initiative, 2016 Munich: MCII. Available online: https://i.unu.edu/media/ehs.unu.edu/news/11862/RZ_G7_MCCI_DinA4_6Seiter151201.pdf (accessed on 20 March 2019).
  47. Belay, A.; Recha, J.W.; Woldeamanuel, T.; Morton, J.F. Smallholder farmers’ adaptation to climate change and determinants of their adaptation decisions in the Central Rift Valley of Ethiopia. Agric. Food Secur. 2017, 6, 1–13. [Google Scholar] [CrossRef] [Green Version]
  48. Jamshidi, O.; Asadi, A.; Kalantari, K.; Azadi, H.; Scheffran, J. Vulnerability to climate change of smallholder farmers in the Hamadan province, Iran. Clim. Risk Manag. 2017, 23, 146–159. [Google Scholar] [CrossRef]
  49. Silvestri, S.; Bryan, E.; Ringler, C.; Herrero, M.; Okoba, B. Climate change perception and adaptation of agro-pastoral communities in Kenya. Reg. Environ. Chang. 2012, 12, 791–802. [Google Scholar] [CrossRef]
  50. Rodriguez-Solorzano, C. Unintended Outcomes of Farmers’ Adaptation to Climate Variability: Deforestation and Conservation in Calakmul and Maya Biosphere Reserves. Ecol. Soc. 2014, 19, 121–141. [Google Scholar] [CrossRef] [Green Version]
  51. Jha, C.K.; Gupta, V.; Chattopadhyay, U.; Sreeraman, B.A. Migration as adaptation strategy to cope with climate change: A study of farmers’ migration in rural India. Int. J. Clim. Chang. Strateg. Manag. 2018, 10, 121–141. [Google Scholar] [CrossRef]
  52. Addisu, S.; Selassie, Y.G.; Fissha, G.; Gedif, B. Time series trend analysis of temperature and rainfall in lake Tana Sub-basin, Ethiopia. Environ. Syst. Res. 2015, 4, 25. [Google Scholar] [CrossRef] [Green Version]
  53. Abera, M.; Mummed, Y.Y.; Eshetu, M.; Pilla, F.; Wondifraw, Z. Perception of Fogera Cattle Farmers on Climate Change and Variability in Awi Zone, Ethiopia. Open J. Anim. Sci. 2020, 10, 792–815. [Google Scholar] [CrossRef]
  54. Ademe, D.; Ziatchik, B.F.; Tesfaye, K.; Simane, B. Climate trends and variability at adaptation scale: Patterns and perceptions in an agricultural region of the Ethiopian Highlands. Weather Clim. Extrem. 2020, 29, 100263. [Google Scholar] [CrossRef]
  55. Mera, G.A. Drought and its impacts in Ethiopia. Weather Clim. Extrem. 2018, 22, 24–35. [Google Scholar] [CrossRef]
  56. Senti, E.T.; Tufa, B.W.; Gebrehiwot, K.A. Soil erosion, sediment yield and conservation practices assessment on Lake Haramaya Catchment. World J. Agric. Sci. 2014, 2, 186–193. [Google Scholar]
  57. Mulugeta, M.; Tiruneh, G.; Alemu, Z.A. Magnitude and associated factors of household food insecurity in FedisWoreda East Hararghe zone, Oromia region, Ethiopia. Agric. Food Secur. 2018, 7, 3. [Google Scholar] [CrossRef] [Green Version]
  58. Balikoowa, K.; Nabanoga, G.; Tumusiime, D.M.; Mbogga, M.S. Gender differentiated vulnerability to climate change in Eastern Uganda. Clim. Dev. 2019, 11, 839–849. [Google Scholar] [CrossRef]
  59. Mendoza, M.E.; Naret, H.; Ballaran, V., Jr.; Arias, J.K. Assessing Vulnerability to Climate Change Impacts in Cambodia, the Philippines and Vietnam: An Analysis at the Commune and Household Level. J. Environ. Sci. Manag. 2014, 17, 78–91. [Google Scholar]
  60. Tesso, G. Individual level vulnerability to climate change impact among crop dependent communities of western. J. Agric. Econ. Dev. 2013, 2, 356–370. [Google Scholar]
  61. Herrero, M.; Thornton, P.K.; Notenbaert, A.M.; Wood, S.; Msangi, S.; Freeman, H.A.; Bossio, D.; Dixon, J.; Peters, M.; van de Steeg, J.; et al. Revisiting mixed crop-livestock systems. Science 2010, 327, 822–825. [Google Scholar] [CrossRef] [PubMed] [Green Version]
  62. Masuku, M.B.; Manyatsi, A. Factors Affecting Households Vulnerability to Climate Change in Swaziland: A Case of Mpolonjeni Area Development Programme (ADP). J. Agric. Sci. 2013, 5, 108. [Google Scholar] [CrossRef] [Green Version]
  63. Aldrich, D.P.; Meyer, M.A. Social Capital and Community Resilience. Am. Behav. Sci. 2015, 59, 254–269. [Google Scholar] [CrossRef]
  64. Agarwal, A.; Perrin, N.; Chhatre, A.; Benson, C.S.; Kononen, M. Climate policy processes, local institutions, and adaptation actions: Mechanisms of translation and influence. WIREs Clim. Chang. 2012, 3, 565–579. [Google Scholar] [CrossRef] [Green Version]
  65. Berhane, G.; Gilligan, D.O.; Hoddinott, J.; Kumar, N.; Taffesse, A.S. Can social protection work in Africa? The impact of Ethiopia’s productive safety net programme. Econ. Dev. Cult. Change 2015, 63, 1–26. [Google Scholar] [CrossRef]
  66. Minisrty of Agriculture. Productive Safety Net Programme Phase IV Programme Implementation Manual; Version 1.0; Ministry of Agriculture: Addis Ababa, Ethiopia, 2014.
Figure 1. Vulnerability plotted against the logarithm of income.
Sustainability 13 02162 g001
Figure 2. Types of shocks households experienced.
Sustainability 13 02162 g002
Figure 3. Perceived impact of climate change.
Sustainability 13 02162 g003
Figure 4. Response to shocks.
Sustainability 13 02162 g004
Figure 5. Mean annual temperature trends of the study area (1983–2016). (a) minimum mean annual temperature (b) maximum mean annual temperature.
Sustainability 13 02162 g005
Figure 6. Mean annual rainfall trends of the study area (1983–2016).
Sustainability 13 02162 g006
Table 1. Explanatory variables hypothesized to affect household vulnerability.
VariableMeasurement ExpectedSign Sources
SexDummy variable (1 = male, 0 = female)[1,20]
Farm experienceYearsofinvolvementin farming[12]
EducationNumber of years of schooling[15,38,39]
Dependency ratioThe number of dependent family members+[38]
TLUNumber of livestock in tropical livestock unit (TLU)[15,19]
Agricultural extensionFrequency of extension service in a year[15]
Access to creditDummyvariable(1 = yes,0 = no)[15,20]
Social capitalMembership in social organization (number)[15,40]
Non-farm incomeIncome from non-farm activities in birr in a year[18,20]
Productive safety net (PSNP)Dummy (1 = if member, 0 = otherwise)+[41,42]
Agro-ecology lowlandDummy (1 = lowland, 0 = otherwise)+[12,15,19]
Agro-ecology midlandDummy (1 = midland, 0 = otherwise)+/−[12,15,19]
Agro-ecology highlandDummy (1 = highland, 0 = otherwise)[12,15,19]
Farmland sizeLand owned in a hectare [19,20]
Access to climate informationDummy (1 = yes, 0 = no)[18,42]
Irrigation accessDummy (1 = yes, 0 = no)[39]
Market distanceDistance of the market in walking hours+[15,18]
ConflictIf faced any conflict (yes = 1, 0 = no)+[43]
Source: [12,15,18].
Table 2. Vulnerability status of households using 1.9 USD the international poverty line.
Vulnerability StatusNumberPercentage
Vulnerable27972.66
Not vulnerable10527.34
Total384100
Source: Own computation (2020).
Table 3. Vulnerability status of households at the different poverty line.
Poverty Level
1.5 USD1.9 USD2.25 USD
Vulnerability LevelNumberPercentageNumberPercentageNumberPercentage
Vulnerable20252.627972.6632184
Not vulnerable18247.410527.346316
Total384100384100384100
Source: Own computation (2020).
Table 4. Determinants of households’ vulnerability to climate change.
Variables Coefficients.Std. Err.Marginal Effect Coefficients
SEX−2.4473 ***0.8262−0.1939 ***
DEPRATIO0.08940.23810.0070
FARMEXP−0.1181 ***0.0256−0.009 ***
EDULEVEL−0.01520.0599−0.0012
LANDSIZE−2.6311 ***0.4322−0.2085 ***
TLU−0.5976 ***0.1392−0.0473 ***
EXTENSION−0.13560.1431−0.0107
CREDITACCESS−0.9335 *0.5102−0.0739 *
SOCIALCAPITAL−0.4811 **0.2112−0.0381 **
EARLYWARNIGINFO−1.385 *0.8208−0.1098
PSNP1.6198 ***0.53450.1283 ***
IRRIGATION−0.76630.4552−0.0607
MARKETDIST1.6849 ***0.36830.1335 ***
CLIMATETRAINING−0.35440.4081−0.0280
NONFARMINCOME−0.0002 ***0.0000−0.0000 ***
CONFLICT0.62290.46260.0493
AGROECO midland2.0216 ***0.55500.1602 ***
AGROECO lowland3.1658 ***0.66000.2509
_cons9.57102.4201
Observation384
LRchi2(18)252.99
Log-likelihood−98.778
Pseudo R20.5615
Note: ***, **, * Significant at 1%, 5%, and 10% probability level, respectively. Source: Model results.
Publisher’s Note: MDPI stays neutral with regard to jurisdictional claims in published maps and institutional affiliations.

