Article

Forage Yield and Quality of Winter Canola–Pea Mixed Cropping System

1
USDA-ARS, San Joaquin Valley Agricultural Science Center-Water Management Research Unit, Parlier, CA 93648, USA
2
Agricultural Science Center at Clovis, New Mexico State University, Clovis, NM 88101, USA
3
University of Agricultural Sciences, Raichur, Karnataka 584104, India
4
Department of Agronomy, Kansas State University, Manhattan, KS 66506, USA
*
Author to whom correspondence should be addressed.
Sustainability 2021, 13(4), 2122; https://doi.org/10.3390/su13042122
Submission received: 20 January 2021 / Revised: 9 February 2021 / Accepted: 10 February 2021 / Published: 17 February 2021

Abstract

:
Forage crop–dairy farming is an important agro-industry across the world. This system is intensive with high-input forage crops. In the United States (US) Southern Great Plains, the system is based primarily on high-input annual grass-type crops in monocropping approaches and requires diverse low-input broadleaf crops for strengthening its sustainability. Winter canola (Brassica napus L.) and pea (Pisum sativum L.) have the potential to provide forage crop diversity options with high forage yields of high quality. Winter canola and pea in mono- and mixed-cropping approaches at seeding ratios of canola/pea at 0:100, 25:75, 50:50, 75:25, and 100:0 were studied for yield and quality in 2015 and 2016 in Clovis, New Mexico (NM). Averaged over years, canola–pea at 75:25 and 50:50 seeding ratios produced similar biomass forage yield but higher than mono-pea by 43% and canola–pea at 25:75 and mono-canola cropping by 8%. The land equivalent ratio of all mixed-cropping treatments exceeded 1.0, with canola–pea at the 50:50 seeding ratio recording a land equivalent ratio of 1.15, indicating that mixed-cropping systems are better users of land resources. Total digestible nutrients and relative feed value were higher in canola–pea mixed cropping than in mono-canola and mono-pea cropping. Canola–pea mixed cropping achieved high yields (13.3 to 14.7 Mg·ha−1) with improved forage quality, as well as improved crop and land productivity, with the potential to improve mechanical harvestability of vining pea, and strengthen the diversity and sustainability of forage crop–dairy farming in the Southern Great Plains under limited irrigation input of ~300 mm.

1. Introduction

Dairy is an important agro-industry in many parts of the world including the United States (US) Southern Great Plains (SGP). Dairy farming requires a constant supply of a large quantity of quality forage to maintain milk production. The dairy farming system in developed countries is intensive and heavily dependent on a limited number of high-input forage crops. Biomass forage production in the region is based primarily on high-input annual grass-type crops (corn—Zea mays, winter wheat—Triticum aestivum, and triticale—Triticum secale) and monocropping approaches. However, the depletion of the Ogallala Aquifer in the SGP, which the agricultural industry heavily depends on, the erratic nature of rainfall and frequent drought [1,2], and the lack of crop diversity in the forage production system (low-input broadleaf crops in particular) are threatening the sustainability of forage crop–dairy farming systems in the region. Restrictions on groundwater pumping and increased water demand from urban growth are also the challenges faced by agriculture in the region. These issues indicate the need to examine alternative low-input (water and N in particular) crops/cropping systems with the potential to produce greater yields of high-quality forage. This can be used as a strategy for providing forage crop options, as well as strengthening and diversifying the forage cropping system and, hence, the dairy industry in the region.
Warm- and cool-season annual grass-type crops (e.g., corn, sorghum—Sorghum bicolor, winter wheat, winter triticale, and barley—Hordeum vulgare) are the commonly used forage crops in dairy feed rations in many parts of the world [3,4,5,6,7] including the SGP. Monocropping of annual grass-type crops produces higher forage yield compared with monocrop annual legumes, but forage quality of grass-type crops is lower than that of annual legumes [3,8,9]. Intercropping of cereal and legume crops can address some of the protein requirements of livestock.
Intercropping of annual grass-type crops with legumes is used extensively for forage and grain production around the world, but its current use is more in countries with low inputs than in countries with intensive, high-input agricultural systems [3,10,11]. Nevertheless, in the last couple of decades, interest in intercropping systems has increased in developed countries. An intercropping system strategy has the potential to improve the sustainability of agricultural systems [12]. Multiple/intercropping systems are defined as systems involving the cultivation of two or more varieties or species with spatial and temporal association [13]. Intercropping involving mixture configurations (annual grass and legume broadleaf type crops) has been reported, in general, to improve crop growth conditions, leading to overall (based on total yield and land equivalent ratio (LER)) improvement in grain and forage production, including harvestability of crops compared with monocrops of each crop species, especially legumes [3,14,15]. Land equivalent ratio is the commonly used index to compare systems productivity. Land equivalent ratio is defined as the relative land area required to produce yields with monocrops that are equivalent to yields of intercrops [11]. Intercropping of annual grass- with legume-type crops (in mixture) can be a potential strategy to improve land use and forage production in the SGP with limited irrigation input, necessitating the need for research. Generally, growing annual grass-type crops requires 500 to 800 mm irrigation depending on the growing conditions in the SGP. Conversely, annual broadleaf type crops require 20% to 30% less irrigation compared with the grass-type crops. Most importantly, higher forage quality can be produced by annual broadleaf than grass-type crops. High-quality forage is always in high demand for the dairy industry in the SGP.
Canola is one of the broadleaf-type crops being explored for forage use in the US and Australia. Researchers in Australia and the US have reported comparable winter canola forage yield, but higher forage quality, compared to winter wheat [16,17,18], suggesting its potential use in intercropping/mixed cropping systems. Cereals in intercropping systems are used by legumes (e.g., pea, vetch—Vicia sativa, and lentils—Lens culinaris) as support, leading to the enhancement of light interception, above- and belowground complementary resource usage, ease of mechanical harvest of legumes, and overall improvement of yield and quality of forage and grain of both crops [3,14,19,20]. Annual small grain–legume cropping is a well-documented example of intercropping systems (forage and grain), with oats—Avena sativa, barley, wheat, pea, and vetch as suitable crops [3,14,15]. However, there is very limited research on intercropping of oilseed crops (such as canola) with legumes for forage and grain production. A review article on intercropping involving cereal and legumes (barley with pea or canola) published by Fletcher et al. [21] reported a higher performance of intercropping systems including canola and pea compared to monocrops of each species for grain and forage production. Researchers from this review also indicated that canola–pea intercropping research is limited. Canola–pea or barley–pea intercropping research done by Malhi [22] in Canada and by Andersen et al. [23] in Denmark reported a greater productivity (based on total yield and LER) with mixed cropping compared to monocrops of each crop.
Plants compete for resources in both mono- and intercropping systems. Competition in general reduces forage and grain yields of component crops in mixed-cropping systems when compared with monocrops of each crop species [24], and the level of competition is also determined by seeding ratios of the component crops in the mixture. Conversely, higher yields were reported for crops grown in mixture when competition between the two species in the mixture was lower than competition within the same species [25]. Research on seeding ratios of mixture cropping of cereal with legumes and their effect on forage and seed yield is limited, but not as scarce as for canola–pea mixed cropping. Lithourgidis et al. [15] found that intercropping of annual cereals with vetch at a seeding ratio of 35:65 had greater forage yield and protein than a seeding ratio of 45:55. The benefits of intercropping of cereals and legumes, as well as canola with legumes, in terms of forage and grain (including quality) production and economic returns, are highly dependent on the management and growing conditions. Given the potential of intercropping of canola and pea for forage production and diversifying the forage production system, and the continuous demand for quality forage for dairy industry in the SGP, information on this system is lacking. Thus, the objective of this study was to evaluate winter canola and pea in mixtures and monocrops at different seeding ratios for forage yield, quality, and land equivalent ratio under limited irrigation input.

2. Materials and Methods

2.1. Study Site, Planting, and Experimental Design

Field studies were conducted during the 2014–2015 (hereafter 2015) and 2015–2016 (hereafter 2016) growing seasons at the New Mexico (NM) State University Agricultural Science Center at Clovis, NM (34°35′ north (N), 103°12′ west (W), elevation 1348 m). The soil type was an Olton clay loam (fine, mixed, superactive, thermic Aridic Paleustolls). The soil pH and organic matter content were 7.6 and 1.7% in 2015 and were 8.1 and 1.6% in 2016, respectively. The previous crop in 2015 growing season was fallow, while in 2016 it was wheat. A month before planting, the field was tilled twice using a disc plow in both years. Based on soil test results, recommended fertilizer (N/P/K/S) was pre-plant soil-incorporated at 112/22.4/0/33.6 kg·ha−1 in 2015 and 140/29.2/0/32.1 kg·ha−1 in 2016. To control weeds, trifluralin (α,α,α-trifluoro-2,6-dinitro N,N,-dipropyl-p-toluidine) was soil-incorporated before planting at the rate of 2.4 L·ha−1 in both years.
Winter canola and pea were planted in a conventionally tilled seedbed using a plot drill (Model 3P600, Great Plains Drill, Salina, KS, USA) under center-pivot limited irrigation input. Two commercial winter canola varieties (Safran, a hybrid (Rubisco Seeds LLC, Philpot, KY, USA), and Riley, an open-pollinated variety [26]) and winter pea (Austrian winter pea) were used for the study. Both canola and pea were seeded on 10 September 2014 and on 9 September 2015. Plot size was 9.1 m long by 3.4 m wide. Seeding rates of 3.9 and 84.4 kg·ha−1 were used for canola and pea monocrops as the 100% seeding ratio, respectively. These rates are within the recommended seeding rates for production in the region under irrigation conditions. However, the optimum seeding rate of each crop species in a mixture is not known. Thus, we used varying mixture seeding ratios (based on seed weights) of each species. This resulted in a total of nine cropping treatments: one monocrop treatment each for Safran, Riley, and pea, and six mixed-cropping treatments, three each for Safran–pea and Riley–pea at ratios of 75:25, 50:50, and 25:75 canola–pea.
The experimental design was a randomized complete block design with treatments (cropping treatments) replicated four times. The two canola varieties selected for the trial differed in plant vigor but were similar in maturity (medium maturity). Both varieties are high-seed-yielding with a potential for forage use as well. Growing season weather data were collected from a National Weather Service station located at the Agricultural Science Center at Clovis, New Mexico. The trials were irrigated with a center-pivot irrigation system with targeted limited irrigation input of about 300 mm (310 mm and 279 mm in 2015 and 2016, respectively).

2.2. Plant Sampling, Processing, Yield, and Quality Determination

A sickle bar mower was used to harvest aboveground biomass of canola and pea from 1.07 m2 of each plot on 4 June 2015 and 26 May 2016. Canola was at the beginning of pod filling while pea was at the pod formation stage at harvest. After total fresh weight was recorded, pea was separated from canola (in canola–pea mixed treatments) and weighed separately. Then, a subsample of known weight from each treatment of each crop was dried to a constant weight at 65 °C. Dry and fresh weights were used to estimate forage biomass production per hectare. Dry subsamples were ground to pass through a 1 mm screen using a Wiley Mill (Thomas Scientific, Swedesboro, NJ, USA) and submitted to a certified laboratory (Ward Laboratories, Kearney, NE, USA) to estimate forage quality using near-infrared reflectance spectroscopy (NIRS).The NIRS prediction accuracy degree had R2 values ranging from 0.85 to 0.98. Forage quality parameters analyzed were crude protein (CP), acid detergent fiber (ADF), neutral detergent fiber (NDF), and lignin, while total digestible nutrients (TDN) and relative feed value (RFV) were estimated from the measured parameters. Relative feed value is an index which combines estimates of digestibility (digestible dry matter, DDM) and intake (dry matter intake, DMI). It is calculated as RFV = DDM × DMI/1.29, where DDM = 88.9 − (0.779 × %ADF) and DMI = 120/%NDF. TDN (100% DM) was calculated as TDN = 82.38 − (0.7515 × %ADF).
Land equivalent ratio (LER): Land equivalent ratio was calculated using the formula developed by Szumigalski and van Acker [27], LER = (intercrop 1/monocrop 1) + (intercrop 2/monocrop 2). The resulting number is a ratio that indicates the amount of land needed to grow both crops together compared to the amount of land needed to grow monocrop of each.

2.3. Data Analysis

Analysis of variance was performed using PROC general linear model (GLM) procedures (SAS 9.3, SAS Institute Inc.). The analysis of variance for yield and quality indicated no cropping treatment × year interaction. Thus, values are reported as means of the years. Means were separated using the least significant difference (LSD) test, and significance was considered at p < 0.05.

3. Results and Discussion

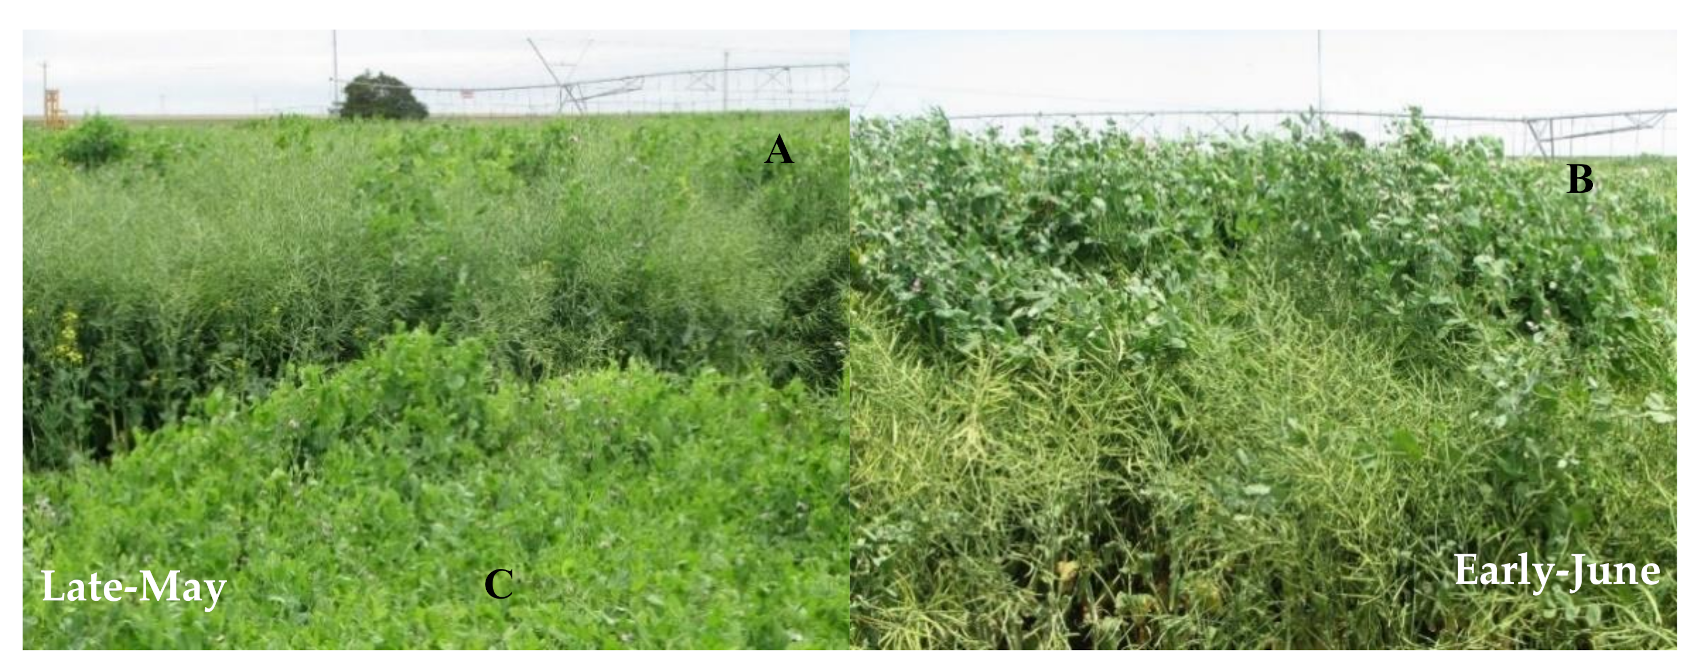
3.1. Crop and Growing Conditions

Canola was quicker in emergence, establishment, and vigor than pea in both 2015 and 2016 (visual observation). Nevertheless, both crop species at early and later growth stages were vigorous in 2015 and in 2016, resulting in part from the comparable growing conditions occurring in both years (Table 1). Precipitation received at the study site during the growing season in 2015 (394 mm) and in 2016 (462 mm) (Table 1) was greater than the long-term average (from 1981 to 2010) precipitation of 331 mm. The average temperatures during the growing seasons were 10.4 °C and 11.5 °C in 2015 and 2016, respectively, values that were comparable to the long-term average of 12.3 °C. Nevertheless, irrigation was supplemented in both 2015 and 2016 to offset the precipitation imbalance (310 mm and 279 mm for 2015 and 2016, respectively), although limited irrigation (~300 mm) was the target in the study.

3.2. Forage Yields and Pea Contribution to Yields

Growing season and cropping system had significant effects on the forage production and quality indices of canola, pea, and their mixtures (Table 2). Forage yields, averaged over years, were significantly different between cropping treatments (ranging from 8.2 to 14.6 Mg·ha−1). The highest forage yield was produced by the canola–pea cropping treatments (at 75:25 and 50:50 seeding ratios). The lowest forage yield was produced by the monocrop pea treatment (Figure 1).
Forage yield of the highest-yielding cropping treatments (canola–pea at 75:25 and 50:50 seeding ratios) was 43% more than the lowest-yielding cropping treatment (monocrop pea) and 8% more than canola–pea mixed at 25:75 seeding ratios and monocrop canola cropping (Figure 1). Canola–pea mixed-cropping treatments (75:25 and 50:50 seeding ratios) produced more forage yield than not only monocrop pea but also the monocrop canola and canola–pea mixed cropping (25:75 seeding ratio). However, the difference between the high-yielding canola–pea mixed-cropping treatments and the monocrop canola and canola–pea mixed treatments (25:75 seeding ratio) was to a much smaller degree (9%) than monocrop pea (Figure 1). Forage yield of canola–pea mixture cropping was affected modestly by an increase in seeding ratios of pea in the mixture (up to 50:50 seeding ratio) and then declined with canola–pea seeding ratio of 25:75, although the pea contribution to total forage yields increased (Figure 1). A greater contribution, however, to total forage yield in the mixture came from canola regardless of canola’s seeding ratio, suggesting in part that canola is not only more competitive than pea but also a better user of environmental resources than pea. This could be due in part to canola’s quicker emergence and establishment (visual observation), which may allow it to develop vigorous below- and aboveground growth and better utilize resources (nutrients, light, and water) compared with pea. Early emergence and initial quicker growth in the first stages of plant growth were found to increase the dominance of one species over the other in terms of competitiveness and resource acquisition, leading to greater biomass growth and yield [28,29]. In addition, pea has been reported to be shallow-rooted [30], perhaps leading to pea not being as aggressive as canola in belowground resource acquisition.
Similarly, a higher forage yield from mixed cropping involving cereals (oat, triticale) and vetch compared with mono-vetch cropping was reported by Lithourgidis et al. [15]. It has been reported, in general, that annual legumes mixed with cereals and legumes mixed with canola can produce higher forage/grain yield than monocrop legumes [9,14,15,19,22]. Our results are in agreement with the findings of these researchers who found higher yield with mixed cropping than monocrop (monocrop pea in particular). In contrast, it has been reported that the forage yield of cereal–legume mixed cropping is not affected by the seeding ratios of the two crops in the mixture [15,31]. The contribution of pea averaged over the 2 years in the mixture increased from 3.0% to 20.8% with a decrease in the seeding ratio of canola (Figure 1). However, the pea contribution to total forage yield was lower than canola’s contribution. This, perhaps, resulted from the advantages canola had during plant growth for the reasons mentioned above, including its ability to develop a deep root system and branch well and use resources efficiently and, hence, produce comparable forage yield compared with the other canola–pea and canola monocrops treatments even at lower seeding ratios of 25:75 (canola–pea). Greater biomass production by intercrops compared with monocrop canola and legumes could be attributed to enhanced environmental resource use (light interception and nutrient and water use) in favor of nonlegumes over legumes [23,25,32]. The lower contribution by pea to total forage yield could also be explained in part by pea’s poor performance with a high supply of inorganic nitrogen fertilizer. The uptake of nitrogen from the soil by pea in mixture with cereals is often weakened by nonlegumes [32]. Ofori and Stern [33] reported that intercropped cereal yields increased progressively with N application, while yields of the legume either decreased or showed less response.

3.3. Land Equivalent Ratio (LER)
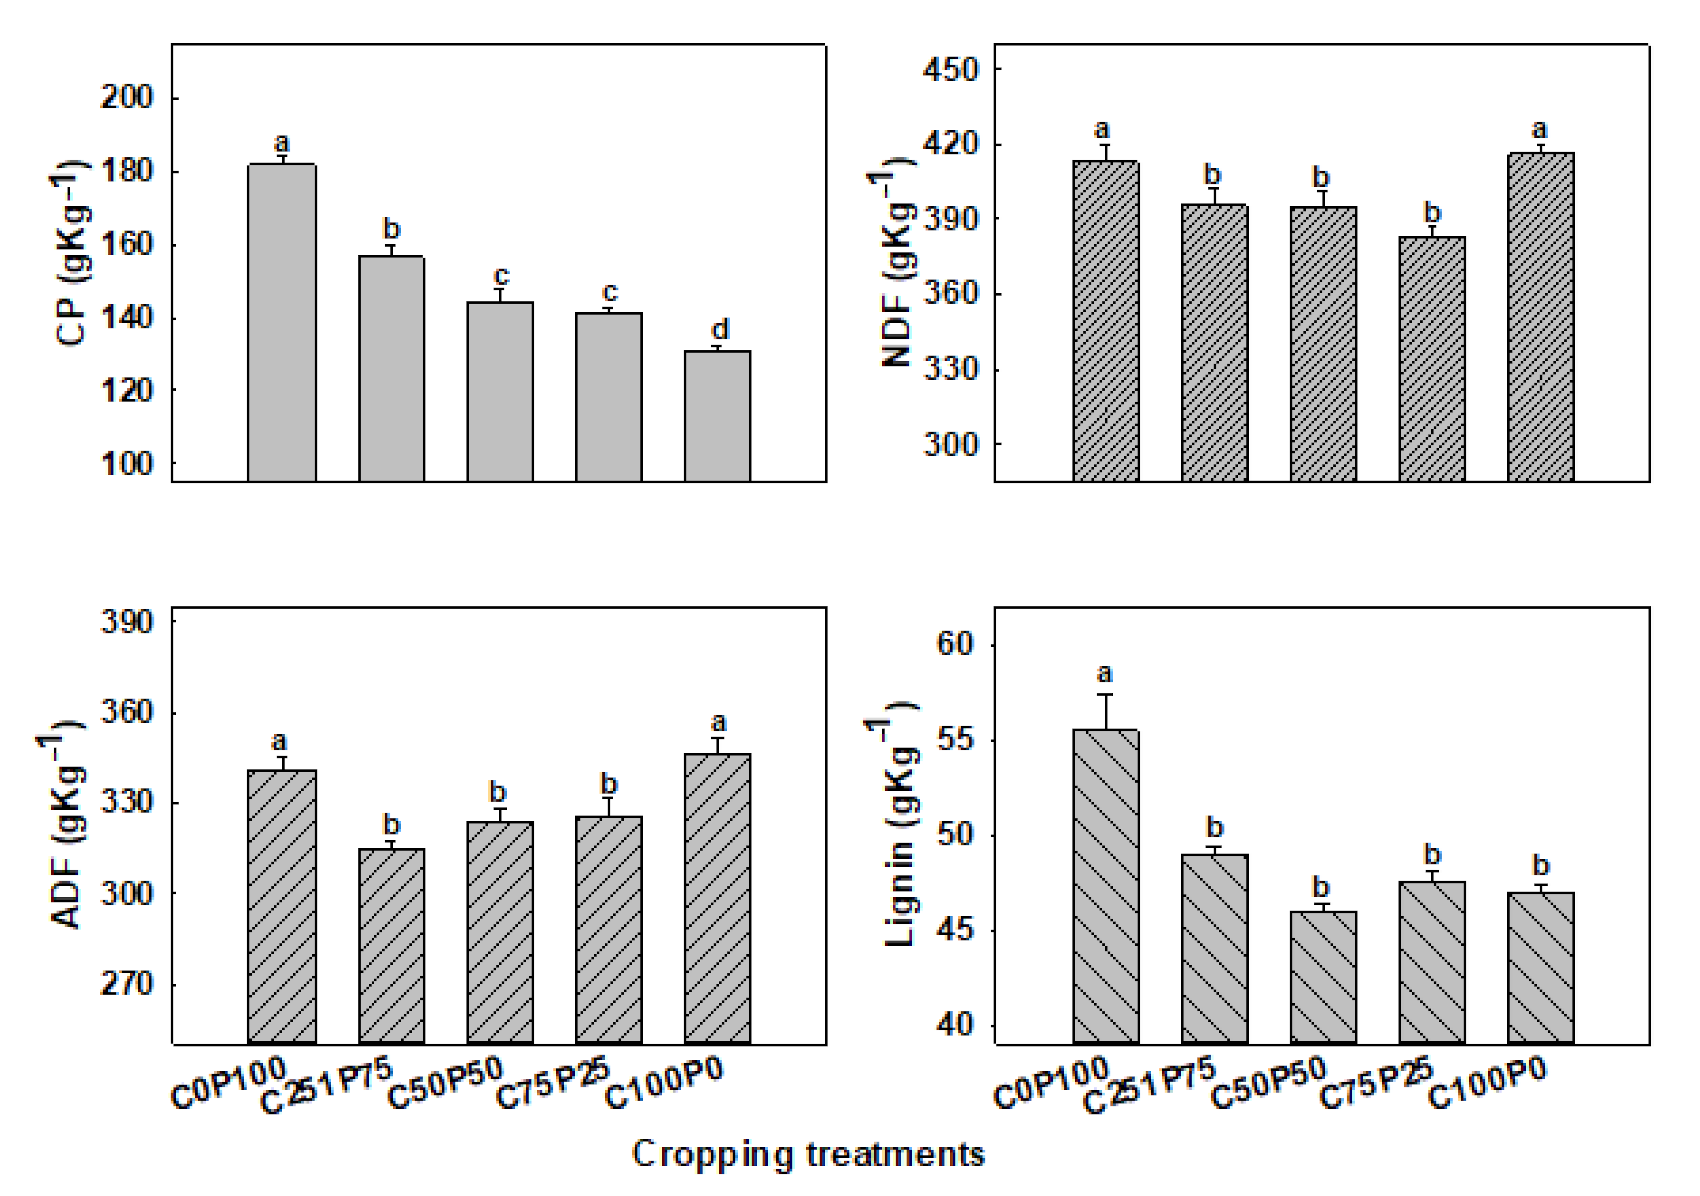
Land equivalent ratio was significantly affected by cropping treatments. LER, averaged over years, ranged from 1.0 (monocrop species) to 1.15 (canola–pea mixed cropping treatment at 50:50 seeding ratio) (Figure 2). However, the highest LER value recorded with canola–pea mixed treatment at a seeding ratio of 50:50 was not significantly different from that of the other seeding ratios of canola–pea mixed-cropping treatments. Nevertheless, LER values greater than 1.0 indicate greater productivity of land for crops with mixed cropping (canola–pea) compared with monocrop systems. A higher yield (seed and straw) was reported for pea mixed with canola or barley cropping with LER values ranging from 1.31 to 1.56 for canola–pea and from 1.07 to 1.54 for barley–pea mixed-cropping treatments [22]. The difference between this and our findings could be related to the difference in growing conditions. The higher LER implies an overall improvement in crop and land productivity and environmental resource use compared with monocrops of each species.

3.4. Forage Quality

Forage quality parameters measured in the study were affected significantly by cropping treatments. The highest crude protein (CP) was recorded by monocrop pea while the lowest value was recorded by monocrop canola (Figure 3). Monocrop pea was greater than monocrop canola in CP by 28%. There was a trend for CP to increase with an increase in seeding ratio of pea in mixture treatments. The second-highest CP (16%) value following monocrop pea was recorded in canola–pea (25:75) mixed treatments, reflecting the pea influence in improving CP compared with monocrop canola and the other cropping treatments. Moreover, the CP of canola–pea mixed cropping treatments at seeding ratios of 75:25 (7%) and 50:50 (9%) was greater than monocrop canola although the difference was not as high as that with canola–pea mixed cropping at the 25:75 seeding ratio. Similar results were reported in cereals (oat, triticale, barley) mixed with legumes (vetch, pea) where both monocrop legumes and cereal–legumes in mixture produced higher CP compared with monocrop cereals [9,15,16,24].
Monocrop pea and canola treatments had the highest values of ADF and NDF. However, there was no significant difference between these two crop species for ADF and NDF values (Figure 3). On the other hand, canola–pea mixed-cropping treatments had lower ADF and NDF (by 6%, averaged over canola–pea mixed treatments) values compared with monocrop treatments. Regardless of seeding ratios of the two crop species, canola–pea mixed-cropping treatments were not significantly different in ADF and NDF values (Figure 3). In general, the values found in this study and the lack of significant differences among mixed-cropping treatment involving cereals (oat, barley, and triticale) and legumes (pea and vetch) are in agreement with the findings of previous studies [15,24]. Lignin content was the highest in monocrop pea, while the lowest lignin content was recorded in canola mixed with pea at a seeding ratio of 50:50. However, lignin content concentrations of monocrop canola and canola–pea mixed-cropping treatments were not significantly different (Figure 3). A higher lignin content in legumes such as vetch and pea compared with cereals (oat and triticale), as well as an increase in lignin content with an increase in pea seeding ratio in cereal–pea mixed-cropping systems, was reported in previous studies [15]. This can be linked to cell walls of dicots containing more lignin than monocots [34]. This, perhaps, in part explains the lack of significant differences among the canola–pea mixed-cropping treatments with both canola and pea being dicots and contributing similarly to lignin concentration.
TDN was higher for canola–pea mixed-cropping treatment compared with both monocrop pea and monocrop canola treatments (Figure 4). The lowest TDN value was recorded for monocrop pea treatment. TDN of monocrop pea and canola treatments was lower than canola–pea mixed-cropping treatment by 4% (Figure 4), suggesting that mixing these two crop species has the potential to improve TDN. The TDN forage parameter indicates nutrients in the forage available to livestock and is related to ADF concentration of the forage. Both monocrop canola and monocrop pea treatments had higher ADF and NDF values, resulting in lower TDN than canola–pea mixed-cropping treatments. In previous intercropping studies involving cereals (triticale, oat, and barely) and legumes (pea and vetch), [15,35] found that monocrops of cereals had higher TDN than monocrop legumes, and the differences were more pronounced in these previous studies than in our study. In the previous studies, it was found that an increase in the seeding proportion of legumes in cereal–legume mixtures resulted in a decrease in TDN, which was linked to higher ADF and lignin in legumes compared with cereals [15]. In our study, however, we did not observe a similar trend, although there was higher ADF and lignin in monocrop pea compared with monocrop canola and canola–pea mixed-cropping treatments. However, the difference found in our study between canola and pea in lignin content (8.5 g·kg DM−1) was much smaller compared with the difference between cereals (oat and triticale) and legumes (vetch) (25 g·kg DM−1) found in previous studies, thus leading to a larger difference in TDN [15].
Cropping treatments were significantly different for RFV (Figure 4). The highest RFV value was recorded with canola–pea mixed treatment at a 75:25 seeding ratio, while the lowest RFV value was recorded with monocrop pea. Most of the forage quality parameters measured were generally separated into two distinct groups (i.e., monocrop treatment vs. mixed-cropping treatments). There was a decreasing trend in RFV value with an increase in pea in the mixture seeding ratios of the mixed-cropping treatments, perhaps related to higher lignin content coming from the pea portion. However, values were not high enough to make a significant difference among the canola–pea mixed-cropping treatments. Nevertheless, RFV was consistently higher for canola–pea mixed-cropping treatments (8%) than monocrop canola and pea treatments. This and other forage quality parameters values are within the range reported before by several researchers [15,16,17,36,37] who studied cool- and warm-season crops harvested at different plant development stages. In our study, canola–pea mixed-cropping treatments generally yielded superior quality forage compared with monocrop canola and pea treatments. As a result, canola–pea mixtures could meet the nutrient requirements for dairy and may provide alternative forage for livestock in the SGP with limited irrigation input.

4. Conclusions

The results of this study indicated that mixed cropping of canola and pea at different seeding ratios affects the forage dry matter yield and quality of each crop species in the mixture. Biomass forage yield was higher in canola–pea mixed-cropping treatment than monocrop pea and monocrop canola at seeding ratios of 75:25 and 50:50. The land equivalent ratio (LER) of canola–pea mixed cropping exceeded 1.0, ranging from 1.11 (75:25 canola–pea) to 1.15 (50:50), indicating the advantage of mixed cropping in better usage of environmental resources, translating into a 11% to 15% increase in crop and land-use productivity. It is also clear from this study that high forage yield with quality (as seen in RFV and TDN) for animal nutrition can be achieved from the mixed cropping of canola and pea at 50:50 and 75:25 seeding ratios. This can be an important additional component to the forage cropping systems of the region where high-input annual grass-type crops (high irrigation input), the primary source of forage, may not be possible to grow all the time under the rapidly declining aquifer resources. Most importantly, canola and pea are suitable and compatible for growing in mixtures with canola, providing potential physical support to pea for improving forage harvestability (Figure 5), which is not feasible with pea if grown in a monocropping system. Rotational benefits coming from these broadleaf crops can be an additional benefit to strengthen and diversify the forage production systems, which are currently lacking in the intensive forage crop–dairy farming system of the SGP and other parts of the world with similar agroecosystems. However, more research on canola–pea mixed-cropping systems under a range of nutrient availability (nitrogen in particular) would be needed to find out if there will indeed be a nitrogen rate at which pea can be forced to rely more on its nitrogen-fixing ability than the inorganic nitrogen provided.

Author Contributions

S.B., S.A. and M.R.U. conceptualized and designed experiments; S.B. and M.R.U. performed the experiments and collected data; S.B. analyzed data and wrote the draft paper; S.B., S.A., A.M., M.R.U. and M.S. reviewed and edited, S.A., A.M. and M.S. funding acquisition. All authors have read and agreed to the published version of the manuscript.

Funding

This project was funded in part by the USDA National Institute of Food and Agriculture Supplemental and Alternative Crops program (2013-38624-21525 and 2015-38624-24333) and by the New Mexico State University (NMSU) Agricultural Experimental Station.

Institutional Review Board Statement

Not applicable.

Informed Consent Statement

Not applicable.

Acknowledgments

The authors thank Aaron Scott, David Rodriguez, Miguel Nunez, Daniel Rush, Joleen Szaloy, and Eldon Hays of NMSU for technical support. The authors also thank Frank Sholedice of NMSU for reviewing the draft manuscript.

Conflicts of Interest

The authors declare no conflict of interest.

References

  1. McGuire, V.L. (Ed.) Water-Level and Storage Changes in the High Plains Aquifer, Predevelopment to 2011 and 2009–11; Scientific Investigations Report 2012-5291; U.S. Geological Survey: Menlo Park, CA, USA, 2012.
  2. Steward, D.R.; Allen, A.J. Peak groundwater depletion in the High Plains Aquifer, projections from 1930 to 2110. Agric. Water Manag. 2016, 170, 36–48. [Google Scholar] [CrossRef] [Green Version]
  3. Anil, L.; Park, J.; Phipps, R.; Miller, F. Temperate intercropping of cereals for forage: A review of the potential for growth and utilization with particular reference to the UK. Grass Forage Sci. 1998, 53, 301–317. [Google Scholar] [CrossRef]
  4. Mustafa, A.; Christensen, D.; McKinnon, J. Effects of pea, barley, and alfalfa silage on ruminal nutrient degradability and performance of dairy cows. J. Dairy Sci. 2000, 83, 2859–2865. [Google Scholar] [CrossRef]
  5. Uzun, P.; Masucci, F.; Serrapica, F.; Napolitano, F.; Braghieri, A.; Romano, R.; Manzo, N.; Esposito, G.; Di Francia, A. The inclusion of fresh forage in the lactating buffalo diet affects fatty acid and sensory profile of mozzarella cheese. J. Dairy Sci. 2018, 101, 6752–6761. [Google Scholar] [CrossRef] [PubMed]
  6. Uzun, P.; Masucci, F.; Serrapica, F.; Varricchio, M.L.; Pacelli, C.; Claps, S.; Di Francia, A. Use of arbuscular inoculum under low fertilizer application: Effects on forage yield, milk production, and energetic and economic efficiency. J. Agric. Sci. 2018, 156, 127–135. [Google Scholar] [CrossRef]
  7. Ali, W.; Nadeem, M.; Ashiq, W.; Zaeem, M.; Thomas, R.; Kavanagh, V.; Cheema, M. Forage yield and quality indices of silage-corn following organic and inorganic phosphorus amendments in Podzol soil under Boreal Climate. Agronomy 2019, 9, 489. [Google Scholar] [CrossRef] [Green Version]
  8. Begna, S.; Fielding, D.; Tsegaye, T.; Van Veldhuizen, R.; Angadi, S.; Smith, D. Intercropping of oat and field pea in Alaska: An alternative approach to quality forage production and weed control. Soil Plant Sci. 2011, 61, 235–244. [Google Scholar] [CrossRef]
  9. Lauriault, L.M.; Kirksey, R.E. Yield and nutritive value of irrigated winter cereal forage grass-legume intercrops in the Southern High Plains, USA. Agron. J. 2004, 96, 352–358. [Google Scholar] [CrossRef]
  10. Matson, P.A.; Parton, W.J.; Power, A.; Swift, M. Agricultural intensification and ecosystem properties. Science 1997, 277, 504–509. [Google Scholar] [CrossRef] [PubMed] [Green Version]
  11. Wiley, R. Intercropping-its importance and research needs. Part 1: Competition and yield advantages. Field Crop Abstr. 1979, 32, 1–10. [Google Scholar]
  12. Lithourgidis, A.; Dordas, C.; Damalas, C.; Vlachostergios, D. Annual intercrops: An alternative pathway for sustainable agriculture. Aust. J. Crop Sci. 2011, 5, 396. [Google Scholar]
  13. Gaba, S.; Lescourret, F.; Boudsocq, S.; Enjalbert, J.; Hinsinger, P.; Journet, E.-P. Multiple cropping systems as drivers for providing multiple ecosystem services: From concepts to design. Agron. Sustain. Dev. 2015, 35, 607–623. [Google Scholar] [CrossRef] [Green Version]
  14. Hauggaard-Nielsen, H.; Gooding, M.; Ambus, P.; Corre-Hellou, G.; Crozat, Y.; Dahlmann, C. Pea–barley intercropping and short-term subsequent crop effects across European organic cropping conditions. Nutr. Cycl. Agroecosyst. 2009, 85, 141–155. [Google Scholar] [CrossRef]
  15. Lithourgidis, A.; Vasilakoglou, I.; Dhima, K.; Dordas, C.; Yiakoulaki, M. Forage yield and quality of common vetch mixtures with oat and triticale in two seeding ratios. Field Crops Res. 2006, 99, 106–113. [Google Scholar] [CrossRef]
  16. Begna, S.; Angadi, S.; Stamm, M.; Mesbah, A. Winter canola: A potential dual-purpose crop for the United States Southern Great Plains. Agron. J. 2017, 109, 2508–2520. [Google Scholar] [CrossRef]
  17. Neely, C.B.; Walsh, C.; Davis, J.B.; Hunt, C.; Brown, J. Investigation of early planted winter canola as a dual-purpose crop for silage and seed production. Agron. J. 2015, 107, 1905–1914. [Google Scholar] [CrossRef]
  18. Sprague, S.J.; Kirkegaard, J.A.; Graham, J.M.; Dove, H.; Kelman, W.M. Crop and livestock production for dual-purpose winter canola (Brassica napus) in the high-rainfall zone of south-eastern Australia. Field Crops Res. 2014, 156, 30–39. [Google Scholar] [CrossRef]
  19. Bedoussac, L.; Justes, E. Dynamic analysis of competition and complementarity for light and N use to understand the yield and the protein content of a durum wheat–winter pea intercrop. Plant Soil 2010, 330, 37–54. [Google Scholar] [CrossRef] [Green Version]
  20. Hauggaard-Nielsen, H.; Gooding, M.; Ambus, P.; Corre-Hellou, G.; Crozat, Y.; Dahlmann, C.; Dibet, A.; Von Fragstein, P.; Pristeri, A.; Monti, M.; et al. Pea–barley intercropping for efficient symbiotic N 2-fixation, soil N acquisition and use of other nutrients in European organic cropping systems. Field Crops Res. 2009, 113, 64–71. [Google Scholar] [CrossRef]
  21. Fletcher, A.L.; Kirkegaard, J.A.; Peoples, M.B.; Robertson, M.J.; Whish, J.; Swan, A.D. Prospects to utilise intercrops and crop variety mixtures in mechanised, rain-fed, temperate cropping systems. Crop Pasture Sci. 2016, 67, 1252–1267. [Google Scholar] [CrossRef]
  22. Malhi, S.S. Improving crop yield, N uptake and economic returns by intercropping barley or canola with pea. Agric. Sci. 2012, 3, 1023–1033. [Google Scholar] [CrossRef] [Green Version]
  23. Andersen, M.K.; Hauggaard-Nielsen, H.; Ambus, P.; Jensen, E.S. Biomass production, symbiotic nitrogen fixation and inorganic N use in dual and tri-component annual intercrops. Plant Soil 2005, 266, 273–287. [Google Scholar] [CrossRef] [Green Version]
  24. Caballero, R.; Goicoechea, E.L.; Hernaiz, P.J. Forage yields and quality of common vetch and oat sown at varying seeding ratios and seeding rates of vetch. Field Crops Res. 1995, 41, 135–140. [Google Scholar] [CrossRef]
  25. Vandemeer, J.H. Intercropping. In Agroecology; McGraw-Hill: New York, NY, USA, 1990; pp. 481–516. [Google Scholar]
  26. Szumigalski, A.R.; van Acker, R.C. Land equivalent ratios, light interception, and water use in inter- crops in the presence or absence of in-crop herbicides. Agron. J. 2008, 100, 1145–1154. [Google Scholar] [CrossRef]
  27. Stamm, M.; Berrada, A.; Buck, J.; Cabot, P.; Claassen, M.; Cramer, G.; Dooley, S.J.; Godsey, C.; Heer, W.; Holman, J.; et al. Registration of ‘Riley’ winter canola. J. PlantReg. 2012, 6, 243–245. [Google Scholar] [CrossRef]
  28. Fukai, S.; Trenbath, B. Processes determining intercrop productivity and yields of component crops. Field Crops Res. 1993, 34, 247–271. [Google Scholar] [CrossRef]
  29. Radosevich, S.; Roush, M. The Role of Competition in Agriculture. In Perspectives on Competition; Grace, J., Tilman, D., Eds.; Academic Press: New York, NY, USA, 1990; pp. 341–363. [Google Scholar]
  30. Cutforth, H.W.; Angadi, S.V.; McConkey, B.G.; Miller, P.R.; Ulrich, D.; Gulden, R.; Volkmar, K.M.; Entz, M.H.; Brandt, S.A. Comparing rooting characteristics and soil water withdrawal patterns of wheat with alternative oilseed and pulse crops grown in the semiarid Canadian prairie. Can. J. Soil Sci. 2013, 93, 147–160. [Google Scholar] [CrossRef]
  31. Robinson, R. Annual Legume-Grass Mixtures for Forage and Seed. Agron. J. 1969, 61, 759–761. [Google Scholar] [CrossRef]
  32. Waterer, J.G.; Vessey, J.K.; Stobbe, E.H.; Soper, R.J. Yield and symbiotic nitrogen-fixation in a pea mustard intercrop as influenced by N fertilizer addition. Soil Biol. Biochem. 1994, 26, 447–453. [Google Scholar] [CrossRef]
  33. Ofori, F.; Stern, W. Cereal–legume intercropping systems. Adv. Agron. 1987, 41–90. [Google Scholar] [CrossRef]
  34. Carpita, N.; McCann, M. The Cell Wall. In Biochemistry & Molecular Biology of Plants; Buchanan, B., Gruissem, W., Jones, R., Eds.; American Society Plant Biologists: Rockville, MD, USA, 2000; pp. 52–108. [Google Scholar]
  35. Carr, P.M.; Horsley, R.D.; Poland, W.W. Barley, oat, and cereal–pea mixtures as dryland forages in the northern Great Plains. Agron. J. 2004, 96, 677–684. [Google Scholar] [CrossRef] [Green Version]
  36. Aasen, A.; Baron, V.S.; Clayton, G.W.; Dick, A.C.; McCartney, D.H. Swath grazing potential of spring cereals, field pea and mixtures with other species. Can. J. Plant Sci. 2004, 84, 1051–1058. [Google Scholar]
  37. May, W.E.; Klein, L.H.; Lafond, G.P.; McConnell, J.T.; Phelps, S.M. The suitability of cool-and warm-season annual cereal species for winter grazing in Saskatchewan. Can. J. Plant Sci. 2007, 87, 739–752. [Google Scholar] [CrossRef]
Figure 1. Total forage dry matter yield and pea contribution to yield of winter canola (C) and pea (P) in mono- and mixed cropping at different seeding ratios in Clovis, New Mexico: C:P at 0:100, 25:75; 50:50, 75:25, and 100:0 seeding ratios, respectively. Means are averaged over 2 years and four replicates. Vertical bars represent the standard error. Different letters indicate a significant difference among cropping treatments at p < 0.05.
Sustainability 13 02122 g001
Figure 2. Land equivalent ratio as affected by winter canola (C) and pea (P) in mono- and mixed cropping at different seeding ratios in Clovis, New Mexico: C:P at 0:100, 25:75; 50:50, 75:25, and 100:0 seeding ratios, respectively. Means are averaged over 2 years and four replicates. Vertical bars represent the standard error. Different letters indicate significant a difference among cropping treatments at p < 0.05. Values above the dotted line (1.0) indicate greater crop and land-use productivity of mixed- over monocropping system.
Sustainability 13 02122 g002
Figure 3. Crude protein (CP), acid detergent fiber (ADF), neutral detergent fiber (NDF), and lignin as affected by winter canola (C) and pea (P) in mono- and mixed cropping at different seeding ratios in Clovis, New Mexico: C:P at 0:100, 25:75; 50:50, 75:25, and 100:0 seeding ratios, respectively. Means are averaged over 2 years and four replicates. Vertical bars represent the standard error. Different letters indicate significant differences among cropping treatments at p < 0.05.
Sustainability 13 02122 g003
Figure 4. Relative feed value (RFV) and total digestible nutrients (TDN) as affected by winter canola (C) and pea (P) in mono- and mixed cropping at different seeding ratios in Clovis, New Mexico: C:P at 0:100, 25:75; 50:50, 75:25, and 100:0 seeding ratios, respectively. Means are averaged over 2 years and four replicates. Vertical bars represent the standard error. Different letters indicate significant differences among cropping treatments at p < 0.05.
Sustainability 13 02122 g004
Figure 5. Growth and development of winter canola and pea in mono- (C) and mixed cropping (A,B) in time and space, along with suitability and harvestability for forage production. A potential improvement in resource use efficiency can be expected from a cropping system of this nature.
Sustainability 13 02122 g005
Table 1. Monthly and long-term mean temperature and total precipitation in Clovis, New Mexico.
Monthly Mean Temperature (°C)Monthly Precipitation
(mm)
2015 2016Long-Term ††20152016Long-Term
September19.422.620.7676555
October15.614.614.8920850
November4.87.08.662219
December3.03.83.611520
January−0.52.13.531214
February3.76.05.616411
March7.89.69.215024
April12.312.013.8151223
May15.215.519.01893947
June22.322.023.7459567
2015 (2014–2015) and 2016 (2015–2016); †† long-term (1981–2010).
Table 2. Analysis of variance (ANOVA) for forage yield and quality indices of canola and pea grown under mono- and mixed-cropping treatments.
Forage Quality and Yield IndicesYear (Y)Cropping Treatment (CT)Y × CT
Total canola and pea yield (Mg·ha−1)NS*NS
Pea contribution (%)**NS
Land equivalent ratioNS*NS
Crude protein (g·kg−1 DM)NS*NS
Acid detergent fiber (g·kg−1 DM)**NS
Neutral detergent fiber (g·kg−1 DM)**NS
Lignin (g·kg−1 DM)**NS
Total digestible nutrients (g·kg−1 DM)**NS
Relative feed value**NS
* Significant at p < 0.05; NS = not significant; DM = dry matter.
Publisher’s Note: MDPI stays neutral with regard to jurisdictional claims in published maps and institutional affiliations.

