Abstract
The growth of electronic word-of-mouth (eWOM) on digital platforms has heightened the need to distinguish authentic user-generated content from covert promotional material. This study proposes an integrated framework combining Natural Language Processing (NLP), machine learning, and Latent Dirichlet Allocation (LDA) to classify sentiment and detect advertising features in online game reviews. Reviews from the Steam platform were analyzed using Support Vector Machine (SVM), Decision Tree, and Naïve Bayes classifiers, with class imbalance addressed through SMOTE and SMOTE–Tomek techniques. The SMOTE-augmented SVM achieved the highest performance, with 98.18% overall accuracy and 97.52% negative sentiment detection. LDA and Quality Function Deployment (QFD) further uncovered latent promotional themes, providing insights into how advertising elements manifest in positive reviews and how negative feedback reflects genuine user concerns. The framework assists platform managers in enhancing eWOM credibility and supports marketers in designing data-driven advertising strategies. By bridging sentiment analysis with covert marketing detection, this research contributes a novel methodological approach for assessing review trustworthiness, improving transparency, and fostering consumer trust in digital information environments.
1. Introduction
The global games market will generate $187.7 billion in 2024, representing +2.1% year-on-year growth, underscoring its economic and cultural significance [1]. The rapid rise in digital services, including online gaming, video games, and social media, has fundamentally transformed how users interact with content, brands, and communities. For instance, the U.S. over-the-top online game market was forecasted to grow from $5.84 billion in 2017 to $14.08 billion by 2023 [2]. These developments illustrate not only the expansion of digital consumption but also the growing availability of user behavior data, which is increasingly valuable for information managers and marketers. In particular, user-generated content (UGC) provides rich insights into consumer decisions and preferences.
Advancements in internet infrastructure and gaming hardware have further fueled the growth of global game players. In 2022 alone, the Steam platform released 12,939 new games [3]. Modern online games now operate as complex digital ecosystems, generating revenue through advertising, subscriptions, and in-game purchases [4]. In this competitive environment, understanding players’ perceptions, experiences, and loyalty has become crucial for sustaining market share and brand relevance [5]. Consequently, online games have emerged as a fertile domain for empirical and theoretical research within information science, digital marketing, and user behavior studies.
The gaming experience is inherently multidimensional, involving diverse genres, emotional responses, and social interactions [6]. Despite extensive research on online gaming, subjective player feedback remains underexplored in information studies [4]. Previous studies have addressed game flow [7], in-game promotions [8], and player satisfaction [9], yet often lack a unified conceptual framework or standardized lexicon for interpreting player commentary [10]. As a result, systematic methods for analyzing or classifying game-related UGC remain limited [11].
Within UGC, electronic word-of-mouth (eWOM) has become especially influential in the gaming domain. Players regularly share opinions during gameplay, making social media and review platforms valuable repositories of sentiment and experiential data [12]. For marketers and product teams, such comments serve both as promotional tools and as indicators of user sentiment. However, studies reveal that some organizations manipulate eWOM by purchasing fake reviews to influence brand perception [10,13]. These practices raise critical concerns about credibility and authenticity, potentially undermining consumer trust. He et al. [10], for example, showed that strategically inserted promotional reviews can shape brand impressions.
The analysis of online game reviews has therefore attracted increasing scholarly attention, particularly in sentiment analysis. Player comments can reveal both performance issues and evolving expectations [14,15]. Chang et al. [16] demonstrated that service delivery imbalances can lead to significant dissatisfaction and financial loss. Nevertheless, much online advertising research still relies on questionnaires, which suffer from sample bias and lack real-time insight [17,18], limiting the ability to capture the dynamic nature of advertising effectiveness on digital platforms.
Recent studies on online game review analysis have explored multiple perspectives, including player satisfaction, gameplay experience, in-game advertising, and emotional engagement. For example, Guzsvinecz and Szűcs [19] applied text mining and sentiment analysis to Steam reviews to examine the relationship between review length and sentiment polarity across different game genres. Similarly, Busurkina et al. [20] used topic modeling to evaluate players’ experiential feedback, identifying key factors influencing game enjoyment and retention. Other research has integrated deep learning approaches, such as convolutional and recurrent neural networks, to enhance sentiment detection accuracy [21]. In addition, hybrid models combining Natural Language Processing (NLP) and Latent Dirichlet Allocation (LDA) have been employed to uncover hidden themes within large-scale player comment datasets [22]. Collectively, these studies highlight that user-generated reviews provide valuable insights for understanding player behavior, assessing game quality, and identifying embedded promotional content, thus establishing online game reviews as a significant research domain within digital marketing and information systems.
To address these gaps, this study analyzes real-time user comments from the Steam gaming platform to perform both sentiment classification and advertising element extraction. We apply NLP alongside machine learning classifiers, Support Vector Machine (SVM), Decision Tree (DT), and Naïve Bayes (NB), with SMOTE and SMOTE–Tomek resampling to address class imbalance. LDA is used to identify latent topics, which are then mapped to advertising elements via Quality Function Deployment (QFD).
By integrating computational linguistics, resampling, and classification models, the proposed framework aims to distinguish negative reviews, more likely to reflect genuine consumer dissatisfaction, from covert promotional content. These findings can support platform managers, developers, and social media users in enhancing eWOM trustworthiness and making better-informed decisions.
The remainder of this paper is organized as follows. Section 2 reviews the relevant literature on text mining, sentiment classification, topic modeling, class imbalance, and theoretical foundations. Section 3 describes the research methodology, including data collection, pre-processing, model construction, and topic extraction processes. Section 4 presents the experimental results and analysis, highlighting classification performance and advertising element extraction. Section 5 discusses the conclusions, theoretical and practical implications, limitations, and directions for future research.
2. Literature Review
2.1. Text Mining
Text mining refers to organizing and analyzing large volumes of textual data to extract relevant information for decision-making. Numerous studies have examined its application to online comments. For instance, Dinesh et al. [23] used text mining to analyze online shopping feedback, while Alzate et al. [24] proposed a text-based review analysis method for exploring brand positioning and image. Biswas et al. [25] applied text exploration to develop predictors linking review age, variance, and reviewer credibility.
In online gaming advertising research, most prior studies have relied on interviews and questionnaires, which require significant time and resources and cannot capture rapid feedback from gamers [18]. To overcome these limitations, the present study applies text mining to extract key insights from large volumes of player comments in real time.
2.2. Sentiment Classification
NLP enables automated analysis of human language and is widely used in text classification. Sentiment classification of user comments helps organizations understand player perceptions, address issues, and enhance products [15]. Accordingly, NLP combined with machine learning is frequently applied to categorize online feedback [11].
However, many real-world datasets exhibit class imbalance, where the majority class achieves high classification accuracy while the minority class, often the more critical, performs poorly [16,26,27]. To address this, resampling methods such as the Synthetic Minority Oversampling Technique (SMOTE) [28] and SMOTE–Tomek [29] are widely adopted for balancing datasets [30]. Previous studies also show that SVM and DT perform well on balanced datasets and outperform many models when handling imbalanced data [31]. NB, based on Bayes’ theorem, remains a simple yet effective method for tasks such as text and spam classification. Given these strengths, this study employs SVM, DT, and NB for player comment classification.
Moreover, in recent years, Transformer-based sentiment analysis techniques have achieved remarkable progress. Models such as BERT, RoBERTa, and GPT leverage self-attention mechanisms to effectively capture long-range dependencies and complex contextual relationships in text, thereby improving accuracy in multilingual and fine-grained sentiment classification tasks. For instance, RoBERTa-large achieved approximately 96% classification accuracy on the IMDb review dataset, demonstrating its superior performance [32]. Furthermore, Transformer models integrate pre-training and fine-tuning architectures, allowing them to adapt to a wide range of natural language processing tasks with outstanding results [33]. However, these models typically require large-scale training data and substantial computational resources, leading to increased training and deployment costs.
In contrast, several studies have reported that traditional machine learning algorithms combined with TF-IDF feature representations, such as SVM, DT, and NB, can achieve comparable or even superior classification performance in certain contexts [34]. TF-IDF effectively captures key lexical features, while machine learning models offer faster training and lower computational requirements, making them practical for studies with limited data or constrained computing environments. Considering these factors, this study adopts the TF-IDF feature representation in combination with machine learning classifiers for sentiment classification. This approach not only reduces training time and hardware demands but also maintains high classification accuracy, achieving an optimal balance between performance and computational efficiency for the present research context.
2.3. Topic Model for Text Comments
LDA, introduced by Han [35], is a widely used probabilistic model for discovering latent topics in large text corpora. Applications include identifying themes in restaurant reviews [36], analyzing corporate press release topics and their effect on stock returns [37], and comparing amateur and expert video game comments [38]. LDA has also been applied to Amazon product reviews [36], travel evaluations [39], and TripAdvisor comments [40].
LDA assumes that each document is a mixture of multiple topics, with topic distributions sampled from a Dirichlet prior [41]. At the word level, each topic has its own word distribution, also drawn from a Dirichlet prior [42,43]. Each word in a document is generated by sampling a topic from the document’s distribution, then sampling a word from that topic’s distribution. While NLP results can be difficult to interpret [43], LDA improves interpretability by revealing coherent thematic structures. This study adopts LDA to enhance the depth and clarity of extracted insights.
2.4. Class Imbalance Problems
Class imbalance, where majority classes dominate classification accuracy, remains a key challenge across domains such as fraud detection and rare disease prediction [16,26,27,30]. When minority classes are misclassified, model utility diminishes significantly. To address this, researchers have developed oversampling, undersampling, and hybrid techniques. Among them, SMOTE [28] and SMOTE–Tomek [29] are effective for improving minority class detection. In this study, both methods are applied to enhance classification performance on imbalanced review datasets.
2.5. Theoretical Foundation
To reinforce the theoretical grounding of this study, the analysis of online game reviews is framed through established consumer behavior theories, particularly the Theory of Planned Behavior (TPB) [44] and the Elaboration Likelihood Model (ELM) [45]. The TPB suggests that behavioral intentions are determined by attitudes, subjective norms, and perceived behavioral control, which collectively explain consumers’ decision-making processes. Within the context of online gaming, players’ attitudes toward games and their perceived control over engagement and purchasing behaviors shape their willingness to share or evaluate reviews [46].
Meanwhile, the ELM explains how individuals process persuasive information through either the central or peripheral route. Online reviews and promotional cues embedded within game comments can function as persuasive stimuli—players with higher involvement are likely to engage in analytical evaluation (central route), whereas those with lower involvement may rely on heuristic cues such as star ratings, linguistic tone, or brand names (peripheral route) [47].
By integrating these theories, the present study provides a conceptual foundation for understanding how players’ attitudes, cognitive processing, and perceived trust influence (eWOM) behavior. This theoretical integration links sentiment classification outcomes and advertising element extraction to underlying psychological mechanisms of consumer perception and trust formation in digital platforms.
3. Methodology
This study employs two methods to analyze players comments and gathers pertinent online comments from actual instances of game websites. Figure 1 illustrates the process of this study. The classifier is utilized to distinguish between positive and negative comments. NLP is employed to classify the text comments that influence advertising. Each step is described as follows.
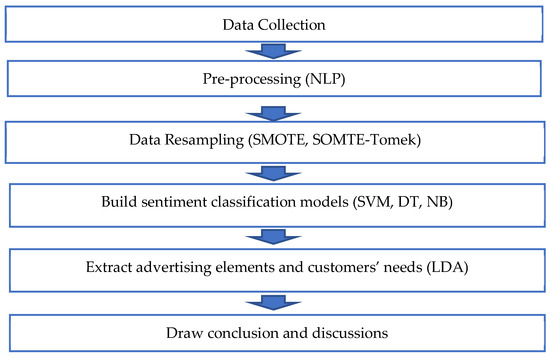
Figure 1.
The workflow for this study.
Step 1: Data Collection and Pre-processing
This study utilizes Python 3.10. to develop a web crawler for data collection. We gathered data from the Steam website, specifically selecting the top 30 highest-rated games under the “top rated” category of “early access titles.” The collection period for game reviews spanned from October 2023 to June 2024, ensuring that both newly released and continuously updated “early access” titles were included. This time frame allowed the study to capture player feedback across different stages of game development, reflecting both initial promotional sentiment and subsequent user experiences. Since this study focuses on English text comments, only English-language reviews were included. The collected data was then labeled as either positive (0) or negative (1). Additionally, irrelevant entries, such as null values, were removed. To enhance data quality, comments containing fewer than 10 words were also filtered out.
Step 2: Data Re-sampling
To address the issue of class imbalance, this study employed two resampling techniques, SMOTE and the SMOTE–Tomek hybrid sampling method, to balance the dataset.
Step 2.1: SMOTE
SMOTE (Synthetic Minority Oversampling Technique) is an oversampling approach that generates synthetic samples from minority class examples. The process of sample generation using SMOTE is illustrated in Figure 2. This technique balances the training dataset by synthesizing new minority class instances based on their nearest neighbors [26], as described by Equation (1).
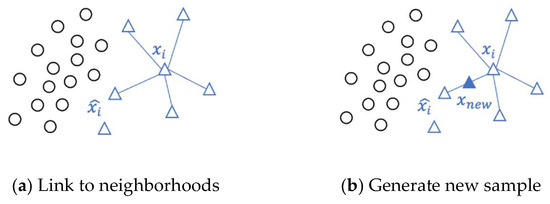
Figure 2.
Schematic diagram of SMOTE generation.
is the synthetic minority sample, is the original minority sample, and is the selected K neighborhood sample.
The steps of the SMOTE algorithm are as follows:
- (1)
- Choose a sample from the minority class as the starting point ().
- (2)
- Randomly select one of its neighboring samples (), which can be found by calculating the Euclidean distance or other distance measures.
- (3)
- Calculate the distance between the starting point and the neighboring sample and generate a random number between 0 and 1.
- (4)
- Use the random number from the previous step to multiply the feature differences between the neighboring sample and the starting point. Add this result to the starting point, creating a new synthetic sample.
- (5)
- Repeat the above steps until the predefined re-sampling target is achieved or the stopping condition is met.
Step 2.2 SMOTE–Tomek
SMOTE–Tomek is a hybrid resampling technique that integrates the SMOTE oversampling method with the Tomek Link undersampling approach. The process of generating samples using SMOTE–Tomek is illustrated in Figure 3. The Tomek Link method works by identifying and removing instances from either the majority or minority class when they share similar characteristics.
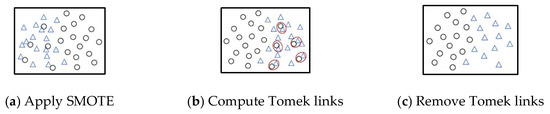
Figure 3.
Schematic diagram of SMOTE–Tomek generation method.
In SMOTE–Tomek, SMOTE is applied first to generate synthetic minority class samples until the desired class ratio is achieved. Subsequently, random samples are selected from the majority class, and if their nearest neighbors belong to the minority class, those majority instances are removed [29].
The steps of the SMOTE–Tomek algorithm are as follows:
- (1)
- Apply SMOTE
- (2)
- Compute Tomek links:
For each sample , find its k nearest neighbors.
If sample and its nearest neighbors belong to different classes, they form a Tomek link.
- (3)
- Remove all samples forming Tomek links from the dataset.
- (4)
- After applying SMOTE and removing Tomek links, you will obtain a more balanced dataset with increased samples in the minority class and reduced samples in the majority class.
Step 3 Natural Language Processing (NLP)
Unprocessed online comments often contain empty values, garbled text, special characters, and other elements that can hinder machine analysis. These data issues can impact the performance of analysis. Therefore, NLP techniques can help extract valuable information from such comments and enable analysis. This study uses the Natural Language Tool Kit (NLTK) toolbox in the Python language to process NLP.
Step 3.1 Tokenization
In this step, we use the N-gram method for textual tokenization. For example, the sentence “this is the first document” will become “this”, “is”, “the”, “first”, “document” after tokenization.
Step 3.2 Delete the Stop Word and Non-relevant Text
Stop words are usually some common articles (such as “a” and “the”), pronouns (such as “he” and “they”), conjunctions (such as “and” and “but”), and auxiliary verbs (such as “is” and “has”). These words have a high frequency of occurrence in most texts but typically contribute little to the understanding of the text’s meaning. Therefore, they are often removed during analysis. This study refers to the list of stop words in NLTK and removes it. Additionally, special characters and garbled text that are unrelated are also deleted.
Step 3.3 Lemmatization
Lemmatization is the process of reducing words to their base form. The goal is to induce a common base form for diverse word forms, thereby reducing the influence of lexical variations. For examples, “eaten” and “ate” will be transformed into “eat”.
Step 3.4 Calculate the Word Frequency
After calculating the word frequency, we identified the occurrence frequency of each word in the dataset. Subsequently, in order to refine the dataset and focus on more meaningful and significant terms, any words with a frequency count less than 30 were carefully excluded or removed from further consideration.
Step 3.5 Build Term-Document Matrix (TDM)
The TF-IDF (Term Frequency-Inverse Document Frequency) weights are the multiplication of the TF and IDF values for each word in each document. The TF-IDF shown in Equation (2) is constructed into a Term-Document Matrix (TDM).
is the ith term and is the jth document. N () indicates the total number of documents with occurrences of terms, where a document represents a comment.
Step 4 Build the Classifier
In this study, two classification algorithms, SVM and DT, were employed to construct classifiers for the analysis. The two models used the Grid Search method to find the optimal combination of parameters. For each parameter combination, train the model on the training data using five-fold cross-validation (CV).
Step 4.1 SVM
In SVM, the C parameter controls the penalty for misclassifications, while the r parameter governs the influence of data points on the mapping. When searching for the optimal parameters C and r using the Grid Search method, a scale based on powers of 2 is employed. The parameter range spans from 2 to 8. Five-fold CV is utilized to compute the average accuracy for each parameter combination. The best parameter combination is determined from the highest achieved accuracy.
The implemental steps of SVM are as follows:
- (1)
- Importing TDM.
- (2)
- Dividing the data into 80% training set and 20% test set.
- (3)
- Choosing the RBF kernel function as in Equation (3):
The meaning of the variables in the radial basis function (RBF) kernel function is as follows:
x represents the feature vector of the input data point. y is the feature vector of a support vector. r is to control the effect of each data point on the mapping.
- (4)
- Using five-fold CV to obtain optimal parameters C and γ.
- (5)
- Using the optimal parameters to build the SVM classifier.
- (6)
- Testing SVM classifiers
- (7)
- Evaluating the performance of the constructed SVM classifiers.
Step 4.2 Decision Tree
In DT, the parameter “max_depth” controls the maximum depth of the DT. The parameter “min_samples_leaf” specifies the minimum number of samples that each leaf node must contain. The parameter “min_samples_split” specifies the minimum number of samples that a node must have before a split is attempted. When searching for the optimal parameter combination for DT, “max_depth” varies within the range of 10 to multiples of 10 within 100, while “min_samples_leaf” and “min_samples_split” are varied from 2 to 10. A five-fold CV is performed to compute the average accuracy for each parameter combination, and the best parameter combination is determined based on the highest achieved accuracy.
The implemental steps of DT are as follows:
- (1)
- Importing TDM;
- (2)
- Dividing the data into 80% training set and 20% test set;
- (3)
- Using Gini impurity for DT pruning.
- (4)
- Using five-fold CV, the optimal parameters max_depth, min_samples_leaf and min_samples_split are found;
- (5)
- Using the optimal parameters to build the DT classifier;
- (6)
- Testing DT classifiers;
- (7)
- Evaluating the performance of the built DT classifiers.
Step 4.3 Naive Bayes
In the context of utilizing the NB classifier, the parameters of Laplace Smoothing are usually denoted by . The purpose of this parameter is to effectively address the problem of zero probability estimates due to the fact that certain features never occur under a particular category, thus preventing the impact on subsequent posterior probability calculations. The setting of determines the strength of the smoothing; the larger the smoothing effect, the more significant. However, an excessively large value may result in over-smoothing, which blurs the differences between different features.
In this study, we employed a grid search approach to establish the optimal range of values, including 0.00001, 0.0001, 0.001, 0.1, 1, 10, 100, and 1000. For each value, we conducted five-fold CV to compute the average accuracy. By finding the value of that achieves the highest average accuracy, we determine the optimal smoothing parameters.
The implemental steps of NB are as follows:
- (1)
- Importing TDM;
- (2)
- Dividing the data into 80% training set and 20% test set;
- (3)
- Building a NB Classifier;
- (4)
- Using five-fold CV to find the optimal parameter ;
- (5)
- Using the optimal parameter to build the NB classifiers;
- (6)
- Testing the NB classifiers;
- (7)
- Evaluating the performance of the built NB classifiers.
Step 4.4 Performance evaluation
In this study, to effectively evaluate the classification performance, the following indexes, which are defined in Equations (4)–(8), have been used.
where
True Positive (TP): The predicted is positive and the actual is positive.
False Positive (FP): The predicted is positive and the actual is negative.
False Negative (FN): The predicted is negative and the actual is positive.
True Negative (TN): The predicted is negative and the actual is negative.
Moreover, for the class imbalance problem, The Area Under the ROC Curve (AUC-ROC) has been utilized.
Step 5 LDA
First, a series of basic text pre-processing steps were performed using the NLTK Toolbox, including tokenization of words, elimination of stop words, and lemmatization. Subsequently, utilizing the corpora. Dictionary function from Python’s genism library, a dictionary including all encountered terms was constructed. Further, through the employment of the doc2bow method, each document was transformed into a bag-of-words representation, thereby establishing a mapping between documents and their constituent words. This bag-of-words representation takes the form of a list containing tuples, where each tuple comprises a term’s index and its frequency within the respective document. Then, we constructed the LDA topic model as shown in Figure 4 [48].
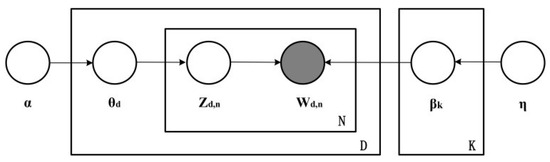
Figure 4.
Schematic diagram of the LDA model [48].
D is a collection of texts, N is a document, Wd,n is the nth word in the dth document, Zd,n is the topic to which the word n corresponds in the dth document, d is the occurrence rate of each topic in the document d, is the initial value of the setting of the topic, is the initial value of the setting of the word, and k is the occurrence rate of each word in topic k.
LDA topic modeling generates the following steps:
- (1)
- The probability of occurrence of each topic d in the file d is obtained from the Dirichlet computation of the parameter;
- (2)
- The topic Zd,n corresponding to the word n in the dth document is obtained from the topic distribution d of the whole document;
- (3)
- The subject Zd,n word probability distribution k is obtained from the Dirichlet calculation of parameter values;
- (4)
- After sampling the words from k, the specific word Wd,n is finally obtained.
Employing the LDA model from the gensim library, we conducted topic modeling to comprehend on the latent topic structure within the textual data. This involved the presentation of the word distribution for each identified topic, facilitating a deeper comprehension of the data’s underlying topic composition. The following explains the parameter settings of the LDA model for this study:
- (1)
- corpus: This parameter refers to the previously constructed document-term bag-of-words representation.
- (2)
- num_topics: In order to compare the results with the results of NLP, this study adopted similar configuration by specifying five topics.
- (3)
- id2word: Referring to the previously established dictionary, this parameter ensures a consistent vocabulary mapping.
- (4)
- passes: This parameter determines the number of iterations. In this study, a value of 20 was designated, denoting the frequency of iterations.
- (5)
- num_words: This parameter stipulates the quantity of words displayed per topic. In this study we have set 10 words to be displayed in each topic.
Step 6 Conclusion and Discussion
Finally, based on the results of the classifiers and concept naming, we can make some suggestions for the reference of players and advertisers. Potential direction of future works also could be provided.
4. Results
4.1. Collected Data
This study utilizes online comments from the Steam game platform (https://store.steampowered.com/ (accessed on 1 February 2024). Since newly launched products are more likely to receive promotional content in their early stages [10], we focused on the top 30 game brands within the “top rated” category of “early access titles.” Using a Python-based web crawler, a total of 9926 comments were collected.
To ensure data validity, comments with fewer than 10 words were removed. After filtering, the final dataset comprised 4995 comments, of which 4236 were labeled as positive and 759 as negative. The distribution of positive and negative comments is illustrated in Figure 5.
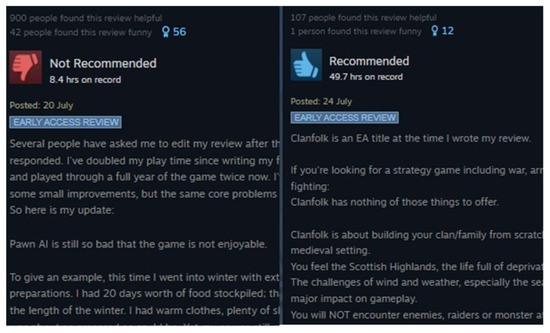
Figure 5.
Examples of positive and negative comments.
Next, we utilized Python to preprocess the data, which involved several steps: tokenization, removal of stop words, lemmatization, word frequency calculation, and eliminating words that appeared fewer than 30 times. Finally, we applied TF-IDF weighting to construct a term-document matrix (TDM), as shown in Table 1, with dimensions of 4995 × 814 (4995 comments × 814 terms).

Table 1.
An example of TDM with TF-IDF weights.
4.2. Model Parameter Setting
In this study, SVM, DT, and NB models are employed for training and prediction. The accuracy of each parameter combination is evaluated using the cross-validation (CV) method within the GridSearchCV function in Python, and the optimal parameter combination is selected based on the results. In the SVM classifier (Table 2), the best accuracy is 0.87838, so the best combination of parameters is as follows: C is 2, γ is 0.5.
Table 2.
SVM model parameter settings.
In the DT classifier (Table 3), the best accuracy is 0.85060, so the best combination of parameters is as follows: max_depth is 10, min_samples_leaf is 2, and min_samples_split is 9. In the NB classifier (Table 4), the best accuracy is 0.86086, so the best parameter is as follows: is 0.00001.
Table 3.
DT model parameter settings.
Table 4.
NB model parameter settings.
4.3. Results of Original Data
With the optimal parameter settings, we build SVM, DT, and NB classifiers. In order to avoid sampling errors, this study repeated the experiment five times. The mean and standard deviation of the experiments were calculated. All experimental data were rounded to the second decimal place. Table 5 presents a summary of the classification performances. From the table, it is evident that the accuracy for predicting positive samples is high, while the accuracy for negative samples (NA) is lower. This reflects the class imbalance issue, where the classifier shows a strong ability to identify majority class examples but has an unacceptably low accuracy for classifying minority class examples. In this study, the minority class consists of negative comments. If the classifiers fail to accurately classify negative comments, the constructed models lose their effectiveness. To address this, the study employs SMOTE and SMOTE–Tomek algorithms to handle the imbalanced data.
Table 5.
Results of classifiers.
4.4. Results of SMOTE–Tomek and SMOTE
In this study, the data was balanced using two resampling techniques, SMOTE and SMOTE–Tomek. The results for SMOTE and SMOTE–Tomek are shown in Table 6. In the original dataset, there were 4236 positive comments and 759 negative comments, with a distribution of 84.80% positive and 15.20% negative comments. After applying the SMOTE technique, both positive and negative comments were increased to 4236 each, resulting in a balanced ratio of 50% for both classes. Similarly, after using the SMOTE–Tomek technique, the number of positive and negative comments was 4236, with a balanced ratio of 50% for both categories.
Table 6.
Data size and distribution of positive and negative comments.
Table 7 presents the results for the SVM classifier. From the table, it is evident that both the SMOTE and SMOTE–Tomek algorithms significantly improved the NA index, which reflects the classifier’s ability to detect negative comments. The NA score increased from 33.93% to 97.52% for SMOTE and 96.33% for SMOTE–Tomek. Regarding the overall evaluation metrics, GM, OA, and F1, both SMOTE and SMOTE–Tomek showed notable improvements compared to the original data. In conclusion, the SMOTE algorithm provided the best classification performance when applied to the SVM classifier.
Table 7.
Evaluation results with SVM.
Table 8 presents the results for the DT classifier. As shown in the table, both SMOTE and SMOTE–Tomek improve the ability to detect negative comments (NA), but they also lead to a decrease in the ability to detect positive comments (PA). From the table, it is clear that there is little difference between the performance indicators of SMOTE and SMOTE–Tomek. However, in terms of the OA and F1 indicators, the DT classifier with the SMOTE algorithm achieves the best classification results.
Table 8.
Evaluation results with DT.
Table 9 shows the results of the NB classifier, which does not outperform SVM. Unlike SVM and DT, the PA and F1 indicators of SMOTE–Tomek are higher than SMOTE, while the standard deviations of PA, GM, OA, and F1 indicators are lower than SMOTE. To sum up, SVM with SMOTE has the best performances, including OA, GM, and F1, compared to SVM with SMOTE–Tomek. And no matter whether it is combined with SMOTE or SMOTE–Tomek, SVM outperforms the DT and NB classifiers.
Table 9.
Evaluation results with NB.
The AUC-ROC was also reported in Table 7, Table 8 and Table 9. The SVM model achieved the highest discriminative performance, with AUCs of approximately 0.58 for the original data, 0.98 for SMOTE, and 0.98 for SMOTE–Tomek. The Decision Tree and Naïve Bayes models showed moderate improvement after resampling, reaching AUCs of about 0.85 and 0.84, respectively, under both SMOTE and SMOTE–Tomek conditions. These results confirm that resampling effectively alleviated class imbalance and significantly enhanced classification robustness, particularly for negative review detection.
4.5. Topic Extraction
This study employed LDA for topic extraction. Using a coherence test, this study extracted Steam online game comments into five positive topics and four negative topics through the LDA model.
Table 10 shows the results for positive topics, with the following naming convention for topics:
Table 10.
LDA positive topic naming results.
Topic #1: Positive experience and value
[i]. Game, Play: Describes the entertainment value of the game, the fun of playing the game in which the player is engaged.
[ii] Son, Bring, Spend: Depicting emotional experiences and moments, where “son” could represent in-game characters, and the game brings forth rich experiences that make the time spent in the game meaningful and valuable.
[iii] Time, Spend: Describe the value of time in gaming, where gaming is recognized as an activity worth spending time on.
[iv] Since: Describe the game’s continuous attractiveness, showing that the game continues to provide a positive experience over a period of time.
These words might focus on the positive aspects of the game, highlighting the enjoyment, interactivity, emotional experiences, and time value that the game brings.
Topic #2. Positive features and attractiveness
[i] Game, Like, Thing, One: Describing the entertainment value of the game, where elements within the game provide a sense of entertainment worth to players.
[ii] Make, Get: Describe the creativity and interactivity of the game.
[iii] Will: Describe the future prospects and value of the game.
Comments may feel appealing, and these words may emphasize the entertainment, creativity, interactivity, and value of the game.
Topic #3 Benefits and Expectations
[i] Yes, Game, Good: Describing the quality and positive attributes of the game, indicating that the game likely possesses high quality and positive features.
[ii] Make, Thing: Describe game creativity and production, which may refer to the design, content, and functionality of the game development team.
[iii] Will, See: Describe the experience of the game and what to expect in the future.
Comments give the impression that gaming is a worthwhile entertainment option, and these words may emphasize the quality, creativity, experience, and future potential of gaming, as well as positive expectations for gaming.
Topic #4 Entertainment value and positive experiences
[i] Game, Fun, Play: Describe the entertainment and fun of the game.
[ii] Good, Like: Describe the high quality and characteristics of the game, bringing forth a sense of satisfaction and enjoyment for players.
[iii] Friend, Love: Describes feeling love with friends.
These words may indicate the entertainment value of the game as well as bring positive emotions and experiences.
Topic #5 Positive features and experiences of early access games
[i] Game, Early Access, Like: Comments may emphasize the appeal of the game in the Early
Access phase, even if the game already had engaging features during development.
[ii] One, Animal: Describe the characteristics of the animal elements.
These words may refer to the unique experience and features of early access games, as well as the growth and value of the game during its development process.
Table 11 shows the results for negative topics, with the following naming convention for topics:
Table 11.
LDA Negative Topic Naming Results.
Topic #1 Negative Gaming Experience and Discontent
[i] Game, Play, Time: Describes the quality of the game and the experience, and may describe the player’s dissatisfaction with the time spent in the game.
[ii] Card, Even, Get: Comments may describe deficiencies in the card game system, or may imply difficulty in obtaining game content (perhaps cards, items, etc.).
[iii] Like, Even: The game might be described as unable to garner player favor or enjoyment even during gameplay.
These words may emphasize the negative experience, dissatisfaction, and frustration that the game brings. Such comments may give the impression that the game has some flaws or shortcomings.
Topic #2 Game Deficiencies and Shortcomings
[i] Game, Graphic, Character: Comments may point out that the game’s graphic quality and character designs are not as good as expected.
[ii] Lot, Everything: This could describe the lack of content within the game.
[iii] Time, Worth: Maybe the description of the game experience is not satisfying enough.
This kind of review may give the impression that there are problems with the game’s graphics, content, characters, etc., leading to a negative view of the game.
Topic #3 Game Disappointments and Shortcomings
[i] Game, Like: Comments may point out that the game does not align with players’ preferences.
[ii] Thing, Get, Even: The game might be described as lacking in content.
[iii] AI, Could: The commentary might point out poor performance of artificial intelligence (AI) within the game.
These comments emphasize that players’ expectations were not met by the game, leading to a negative perception of its quality, content, AI, and other aspects.
Topic #4 Game Issues and Frustrations
[i] Door, Issue: Comments may point out problems or flaws in the game’s design.
[ii] Mission, Point, Get: Comments may discuss in-game missions or objectives achieved.
[iii] Team, Like: Describing teamwork issues and the game’s lack of appeal or popularity.
These comments may point out deficiencies in the game’s design, objective completion, teamwork, and other aspects.
4.6. Transforming Extracted Topics into Advertising Elements
We can gain insights into the elements related to advertising and their definitions. Nalluri et al. [49] conducted a comprehensive analysis of the elements encompassed in mobile advertising. Therefore, this study also adopts the advertising elements as defined in Table 12.
Table 12.
Ad elements and their definitions [49].
To illustrate the relationship between “extracted topics” and “advertising elements”, we employ a matrix diagram using three degrees of relationship: strong, moderate, and weak. These indicators are assigned scores of 9, 3, and 1, respectively. Figure 6 and Figure 7 display the positive and negative advertising element results, which are transformed from extracted topics using LDA. To have a good performance, a group of three domain experts have been built to do this transformation task. The attribute agreement analysis was conducted using Minitab 17, yielding an overall Cohen’s Kappa statistic of 0.885621. Since this value surpasses the 0.75 threshold, it indicates a strong level of consistency and agreement among the evaluations provided by the three experts.
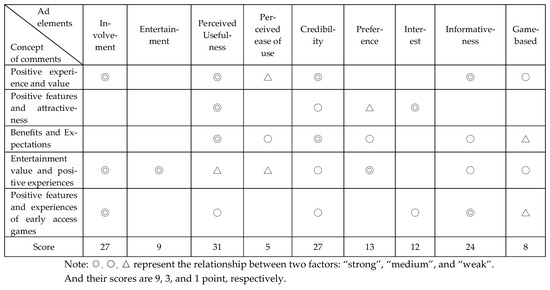
Figure 6.
QFD example of positive comments.
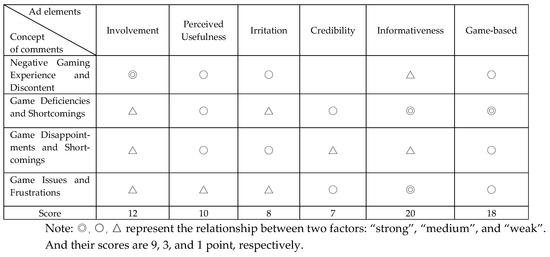
Figure 7.
QFD example of negative comments.
The advertising element results of LDA for positive comments has been summarized in Figure 6. Ranked by scores, the top six advertising elements are “Perceived usefulness”, “Credibility”, “Involvement”, “Informativeness”, “Preference”, and “Interest”. The negative advertising element results of LDA are shown in Figure 7. This table reveals that the top three elements in the ranking are “Informativeness”, “Game-based”, and “Engagement”.
From the observations in this study, as well as the results from Figure 6 and Figure 7, it is evident that positive comments contain more advertising elements. In real-world observations, employing Key Opinion Leaders (KOLs) to write commercial reviews does indeed involve a more positive approach to promoting games. Therefore, the advertising elements extracted from positive reviews can serve as a reference for advertisers when composing commercial promotional reviews.
On the other hand, negative comments have a weaker association with advertising and yield fewer advertising elements. Based on real-world review observations, negative comments resemble more of the genuine experiences and feedback of game players. As a result, the topics extracted from negative comments can be provided to game design companies to help improve product design and enhance player satisfaction. Consequently, the advertising elements extracted from textual reviews will primarily be derived from positive reviews.
5. Conclusions
5.1. Discussion and Conclusions
This study proposes a hybrid sentiment classification and topic modeling framework to enhance the credibility of eWOM in digital platforms. By integrating NLP, SMOTE-based resampling, and machine learning classifiers (SVM, DT, NB), the framework effectively improves the detection of negative reviews, which are often more indicative of genuine user dissatisfaction. Through LDA-driven topic modeling, the framework also identifies latent advertising elements embedded in reviews, enabling a clearer distinction between authentic consumer feedback and covert promotional content.
The findings highlight that digital platforms, particularly review-driven ecosystems such as Steam’s early-access games, face growing challenges in balancing authentic user voices with hidden marketing efforts, including Key Opinion Leader (KOL) promotions and incentivized reviews. By bridging computational methods with consumer behavior insights, this research contributes a novel approach to supporting advertising transparency, safeguarding platform credibility, and ensuring that consumer feedback continues to serve as a trustworthy signal of product quality and gaming experience.
5.2. Practical Implications
For digital platforms, the proposed framework offers a scalable tool to automatically filter manipulative or sponsored reviews, reinforcing review ecosystem transparency and mitigating the negative impact of fake or biased content. On platforms like Steam, this capability is critical for helping players make informed purchase decisions in markets where early-access titles are frequently promoted through aggressive marketing campaigns.
For the gaming industry, the extracted advertising elements reveal how promotional cues are embedded in positive reviews (often reflecting KOL-driven endorsements) and how negative reviews capture authentic frustrations about gameplay, technical stability, or fairness. Developers can use these insights to improve game design and service delivery, while marketers can leverage them to design advertising strategies that align with genuine player expectations, thereby avoiding consumer backlash against misleading promotional tactics.
From a broader e-commerce perspective, this framework provides a data-driven mechanism for enhancing advertising transparency and accountability. By separating authentic sentiment from covert marketing signals, businesses can foster ethical advertising practices, strengthen long-term brand trust, and establish more sustainable digital marketplaces across both gaming and non-gaming domains.
5.3. Theoretical Implications
This research contributes to the theoretical discourse on eWOM, consumer trust in digital environments, and the application of AI in marketing analytics. It advances prior work by proposing a hybrid analytical approach that not only classifies sentiment but also interprets the promotional intent behind review content, an area that remains underexplored in the existing literature.
By bridging machine learning methodologies with consumer behavior theory, the study establishes a conceptual lens through which online reviews can be viewed as dual-purpose artifacts: vehicles of authentic experience and potential marketing tools. This opens new research directions in algorithmic trust assessment, the authenticity of UGC, and the broader dynamics of digital influence in e-commerce ecosystems.
5.4. Limitations and Future Works
While the current study has demonstrated the effectiveness of our proposed framework using online game reviews, several limitations warrant attention. First, the dataset was primarily sourced from early-access game titles, which may not fully represent the broader spectrum of e-commerce products and consumer behavior. Future research should incorporate data from diverse product categories to validate generalizability.
Second, although the study employed three widely used machine learning classifiers (SVM, DT, NB), exploring more advanced models, such as deep learning architectures like Long Short-Term Memory (LSTM) networks or transformer-based models, could further enhance classification accuracy and model interpretability.
Lastly, expanding the model’s capability to support multilingual analysis and cross-platform review integration would provide more holistic insights, allowing e-commerce platforms to operate effectively in diverse global markets. Addressing these directions in future work will enrich the applicability and robustness of this framework in real-world digital commerce environments.
This study has one notable limitation: the dataset was restricted to “early access” games on the Steam platform. Such titles often receive strong promotional attention during their launch phase, which may bias the results toward more positive or marketing-driven content. To enhance the generalizability and robustness of the findings, future research is encouraged to validate the proposed framework using a broader range of datasets, such as mobile application stores or review platforms like Metacritic.
Author Contributions
Conceptualization, Y.-Y.W. and L.-S.C.; methodology, Y.-Y.W., V.N. and L.-S.C.; software, Y.-Y.W.; validation, V.N., W.-D.J. and L.-S.C.; formal analysis, V.N. and Y.-Y.W.; investigation, Y.-Y.W. and W.-D.J.; resources, L.-S.C.; data curation, Y.-Y.W. and W.-D.J.; writing—original draft preparation, Y.-Y.W. and V.N.; writing—review and editing, L.-S.C.; visualization, Y.-Y.W. and V.N.; supervision, L.-S.C.; project administration, L.-S.C.; funding acquisition, L.-S.C. All authors have read and agreed to the published version of the manuscript.
Funding
This research was funded partially by the National Science and Technology Council (Taiwan), grant number NSTC 114-2221-E-027-085-MY2.
Institutional Review Board Statement
Not applicable.
Informed Consent Statement
Not applicable.
Data Availability Statement
The raw data supporting the conclusions of this article will be made available by the authors on request.
Acknowledgments
This study was supported in part by the National Science and Technology Council, Taiwan (Grant No. 114-2221-E-027-085-MY2). The authors would like to express their deep appreciation.
Conflicts of Interest
The authors declare no conflicts of interest.
References
- Newzoo. 2024 Global Games Market Report. 2024. Available online: https://best-of-gaming.be/wp-content/uploads/2024/09/2024_Newzoo_Global_Games_Market_Report.pdf (accessed on 1 October 2024).
- Yu, S.; Zhao, X. The negative impact of bullying victimization on academic literacy and social integration: Evidence from 51 countries in PISA. Soc. Sci. Humanit. Open 2021, 4, 100151. [Google Scholar] [CrossRef]
- SteamDB. Steam Game Release Summary. 2022. Available online: https://steamdb.info/stats/releases (accessed on 1 October 2025).
- Huang, H.-C.; Cheng, T.; Huang, W.-F.; Teng, C.-I. Impact of online gamers’ personality traits on interdependence, network convergence, and continuance intention: Perspective of social exchange theory. Int. J. Inf. Manag. 2018, 38, 232–242. [Google Scholar] [CrossRef]
- Tseng, F.-C.; Huang, T.-L.; Pham, T.T.L.; Cheng, T.; Teng, C.-I. How does media richness foster online gamer loyalty? Int. J. Inf. Manag. 2022, 62, 102439. [Google Scholar] [CrossRef]
- Melodia, F.; Canale, N.; Griffiths, M.D. The role of avoidance coping and escape motives in problematic online gaming: A systematic literature review. Int. J. Ment. Health Addict. 2020, 20, 996–1022. [Google Scholar] [CrossRef]
- But, J.; Armitage, G.; Stewart, L. Outsourcing automated QoS control of home routers for a better online game experience. IEEE Commun. Mag. 2008, 46, 64–70. [Google Scholar] [CrossRef]
- Abbasi, A.Z.; Rehman, U.; Hussain, A.; Ting, D.H.; Islam, J.U. The impact of advertising value of in-game pop-up ads in online gaming on gamers’ inspiration: An empirical investigation. Telemat. Inform. 2021, 62, 101630. [Google Scholar] [CrossRef]
- Ewell, P.J.; Quist, M.C.; Øverup, C.S.; Watkins, H.; Guadagno, R.E. Catching more than pocket monsters: Pokémon Go’s social and psychological effects on players. J. Soc. Psychol. 2020, 160, 131–136. [Google Scholar] [CrossRef]
- He, S.; Hollenbeck, B.; Proserpio, D. The Market for Fake Comments. Mark. Sci. 2022, 41, 896–921. [Google Scholar] [CrossRef]
- Al-Natour, S.; Turetken, O. A comparative assessment of sentiment analysis and star ratings for consumer comments. Int. J. Inf. Manag. 2020, 54, 102132. [Google Scholar]
- Mishra, A.; Satish, S.M. eWOM: Extant Research Review and Future Research Avenues. Vikalpa 2016, 41, 222–233. [Google Scholar] [CrossRef]
- Martens, D.; Maalej, W. Towards understanding and detecting fake comments in app stores. Empir. Softw. Eng. 2019, 24, 3316–3355. [Google Scholar] [CrossRef]
- Li, H.; Yu, B.X.; Li, G.; Gao, H. Restaurant survival prediction using customer-generated content: An aspect-based sentiment analysis of online comments. Tour. Manag. 2023, 96, 104707. [Google Scholar] [CrossRef]
- Nawaz, Z.; Zhao, C.; Nawaz, F.; Safeer, A.A.; Irshad, W. Role of Artificial Neural Networks Techniques in Development of Market Intelligence: A Study of Sentiment Analysis of eWOM of a Women’s Clothing Company. J. Theor. Appl. Electron. Commer. Res. 2021, 16, 1862–1876. [Google Scholar] [CrossRef]
- Chang, J.-R.; Liang, H.-Y.; Chen, L.-S.; Chang, C.-W. Novel feature selection approaches for improving the performance of sentiment classification. J. Ambient. Intell. Humaniz. Comput. 2020. [Google Scholar] [CrossRef]
- Maseeh, H.I.; Jebarajakirthy, C.; Pentecost, R.; Ashaduzzaman, M.; Arli, D.; Weaven, S. A meta-analytic review of mobile advertising research. J. Bus. Res. 2021, 136, 33–51. [Google Scholar] [CrossRef]
- Chang, J.-R.; Chen, M.-Y.; Chen, L.-S.; Tseng, S.-C. Why Customers Don’t Revisit in Tourism and Hospitality Industry? IEEE Access 2019, 7, 146588–146606. [Google Scholar] [CrossRef]
- Guzsvinecz, T.; Szűcs, J. Length and sentiment analysis of reviews about top-level video game genres on the Steam platform. Comput. Hum. Behav. 2023, 149, 107955. [Google Scholar] [CrossRef]
- Busurkina, I.; Karpenko, V.; Tulubenskaya, E.; Bulygin, D. Game Experience Evaluation. A Study of Game Reviews on the Steam Platform. In Digital Transformation and Global Society; Alexandrov, D.A., Boukhanovsky, A.V., Chugunov, A.V., Kabanov, Y., Koltsova, O., Musabirov, I., Eds.; DTGS 2020; Communications in Computer and Information Science; Springer: Cham, Switzerland, 2020; Volume 1242. [Google Scholar] [CrossRef]
- Wahana, A.; Zulfikar, W.B.; Wildiansyah, W.N.; Atmadja, A.R.; Ramdania, D.R.; Subaeki, B. A Deep Learning Approach to Analyze The Sentiment of Online Game Users. In Proceedings of the 2021 7th International Conference on Wireless and Telematics (ICWT), Bandung, Indonesia, 19–20 August 2021; pp. 1–5. [Google Scholar]
- Yu, Y.; Dinh, D.-T.; Nguyen, B.-H.; Yu, F.; Huynh, V.N. Mining Insights from Esports Game Reviews with an Aspect-Based Sentiment Analysis Framework. IEEE Access 2023, 11, 61161–61172. [Google Scholar] [CrossRef]
- Dinesh, L.; Kaviya, G.; Kavya, N.C.; Kousalya, A.; Lavanya, N. Product Comments on Opinion Mining using NLP Techniques. In Proceedings of the 2022 7th International Conference on Communication and Electronics Systems, Coimbatore, India, 22–24 June 2022; pp. 952–957. [Google Scholar] [CrossRef]
- Alzate, M.; Arce-Urriza, M.; Cebollada, J. Mining the text of online consumer comments to analyze brand image and brand positioning. J. Retail. Consum. Serv. 2022, 67, 102989. [Google Scholar] [CrossRef]
- Biswas, B.; Sengupta, P.; Kumar, A.; Delen, D.; Gupta, S. A critical assessment of consumer comments: A hybrid NLP-based methodology. Decis. Support Syst. 2022, 159, 113799. [Google Scholar] [CrossRef]
- Chang, J.-R.; Chen, L.-S.; Lin, L.-W. A Novel Cluster based Oversampling Approach for Classifying Imbalanced Sentiment Data. IAENG Int. J. Comput. Sci. 2021, 48, 1118–1128. [Google Scholar]
- Alghamdi, M.; Al-Mallah, M.; Keteyian, S.; Brawner, C.; Ehrman, J.; Sakr, S. Predicting diabetes mellitus using SMOTE and ensemble machine learning approach: The Henry Ford ExercIse Testing (FIT) project. PLoS ONE 2017, 12, e0179805. [Google Scholar] [CrossRef] [PubMed]
- Blagus, R.; Lusa, L. SMOTE for high-dimensional class-imbalanced data. BMC Bioinform. 2013, 14, 106. [Google Scholar] [CrossRef]
- Jonathan, B.; Putra, P.H.; Ruldeviyani, Y. Observation Imbalanced Data Text to Predict Users Selling Products on Female Daily with SMOTE, Tomek, and SMOTE-Tomek. In Proceedings of the 2020 IEEE International Conference on Industry 4.0, Artificial Intelligence, and Communications Technology (IAICT), Bali, Indonesia, 7–8 July 2020. [Google Scholar] [CrossRef]
- Guo, H.; Li, Y.; Shang, J.; Gu, M.; Huang, Y.; Gong, B. Learning from class-imbalanced data: Review of methods and applications. Expert Syst. Appl. 2017, 73, 220–239. [Google Scholar] [CrossRef]
- López, V.; Fernández, A.; García, S.; Palade, V.; Herrera, F. An insight into classification with imbalanced data: Empirical results and current trends on using data intrinsic characteristics. Inf. Sci. 2013, 250, 113–141. [Google Scholar] [CrossRef]
- Kale, T.V.; Mendhe, S. A Review on Advances in Sentiment Analysis: A Deep Learning Approach Using Transformer Based Models. In Proceedings of the 2025 4th International Conference on Sentiment Analysis and Deep Learning (ICSADL), Bhimdatta, Nepal, 18–20 February 2025; pp. 235–239. [Google Scholar] [CrossRef]
- Sokolová, Z.; Harahus, M.; Sokol, M.; Kupcová, E.; Pleva, M. Sentiment analysis using transformer models: BERT, T5, and GPT. In Proceedings of the 2025 35th International Conference Radioelektronika (RADIOELEKTRONIKA), Hnanice, Czech Republic, 12–14 May 2025. [Google Scholar] [CrossRef]
- Mahmud, S.; Payel, S.R.; Hossain, J.; Progga, N.T.; Mariam, A. Identifying Bangla Political Hate Speech using Transformer-based Approach. In Proceedings of the 2025 2nd International Conference on Next-Generation Computing, IoT and Machine Learning (NCIM), Gazipur, Bangladesh, 27–28 June 2025; pp. 1–6. [Google Scholar] [CrossRef]
- Han, X. Evolution of research topics in LIS between 1996 and 2019: An analysis based on latent Dirichlet allocation topic model. Scientometrics 2020, 125, 2561–2595. [Google Scholar] [CrossRef]
- Hammad, M.; AbuEnnab, N.; Al-Refai, M. An aspect-based sentiment analysis model for Arabic game reviews based on hybrid transformers models. Neural Comput. Appl. 2025, 37, 10309–10331. [Google Scholar] [CrossRef]
- Lei, S.; Zhang, Y. The role of the media in socially responsible investing. Int. J. Bank Mark. 2020, 38, 823–841. [Google Scholar] [CrossRef]
- Lin, D.; Bezemer, C.P.; Zou, Y.; Hassan, A.E. An Empirical Study of Fame Reviews on the Steam Platform. Empir. Softw. Eng. 2019, 24, 170–207. [Google Scholar] [CrossRef]
- Park, S.T.; Liu, C. A study on topic models using LDA and Word2Vec in travel route recommendation: Focus on convergence travel and tours comments. Pers. Ubiquitous Comput. 2022, 26, 429–445. [Google Scholar] [CrossRef]
- Arenas-Márquez, F.J.; Martinez-Torres, R.; Toral, S. Convolutional neural encoding of online comments for the identification of travel group type topics on TripAdvisor. Inf. Process. Manag. 2021, 58, 102645. [Google Scholar] [CrossRef]
- Rahmadan, M.C.; Hidayanto, A.N.; Ekasari, D.S.; Purwandari, B.; Theresiawati. Sentiment Analysis and Topic Modelling Using the LDA Method related to the Flood Disaster in Jakarta on Twitter. In Proceedings of the 2020 International Conference on Informatics, Multimedia, Cyber and Information System (ICIMCIS), Jakarta, Indonesia, 19–20 November 2020; pp. 126–130. [Google Scholar]
- Logan, A.P.; LaCasse, P.M.; Lunday, B.J. Social network analysis of Twitter interactions: A directed multilayer network approach. Soc. Netw. Anal. Min. 2023, 13, 65. [Google Scholar] [CrossRef]
- Yu, D.; Xiang, B. Discovering topics and trends in the field of Artificial Intelligence: Using LDA topic modeling. Expert Syst. Appl. 2023, 225, 120114. [Google Scholar] [CrossRef]
- Ajzen, I. The theory of planned behavior. Organ. Behav. Hum. Decis. Process. 1991, 50, 179–211. [Google Scholar] [CrossRef]
- Petty, R.E.; Cacioppo, J.T. The elaboration likelihood model of persuasion. Adv. Exp. Soc. Psychol. 1986, 19, 123–205. [Google Scholar]
- Hamari, J.; Keronen, L. Why do people play games? A meta-analysis. Int. J. Inf. Manag. 2017, 37, 125–141. [Google Scholar] [CrossRef]
- Cheung, C.M.; Thadani, D.R. The impact of electronic word-of-mouth communication: A literature analysis and integrative model. Decis. Support Syst. 2012, 54, 461–470. [Google Scholar] [CrossRef]
- Gan, J.; Qi, Y. Selection of the optimal number of topics for LDA topic model—Taking patent policy analysis as an example. Entropy 2021, 23, 1301. [Google Scholar] [CrossRef] [PubMed]
- Nalluri, V.; Mayopu, R.G.; Chen, L.-S. Modelling the key attributes for improving customer repurchase rates through Mobile Advertisements using a Fuzzy mixed approach. J. Model. Manag. 2023, 19, 145–168. [Google Scholar] [CrossRef]


Disclaimer/Publisher’s Note: The statements, opinions and data contained in all publications are solely those of the individual author(s) and contributor(s) and not of MDPI and/or the editor(s). MDPI and/or the editor(s) disclaim responsibility for any injury to people or property resulting from any ideas, methods, instructions or products referred to in the content. |
© 2025 by the authors. Licensee MDPI, Basel, Switzerland. This article is an open access article distributed under the terms and conditions of the Creative Commons Attribution (CC BY) license (https://creativecommons.org/licenses/by/4.0/).