1. Introduction
The rapid evolution of digital platforms has fundamentally reshaped how businesses engage with customers and has revolutionized how firms sense and respond to customer behavior, especially in high-frequency, time-sensitive service settings such as quick-service restaurants (QSRs). Among these platforms, social media, particularly X (formerly Twitter), has emerged as a critical channel for brand communication, enabling real-time access to customer opinions, preferences, and expectations. In the fast-paced and highly competitive fast food industry, where brand perception and customer loyalty are vital to commercial success, customer sentiment analysis through social media feedback has become increasingly indispensable.
Large volumes of user-generated content on digital platforms are increasingly analyzed to inform brand management, service recovery, and data-driven decision-making. In the context of Web 3.0, the emphasis extends from storage and sharing to the semantic understanding of content by linking entities, context, and meaning. Within this paradigm, sentiment constitutes a core semantic layer of user discourse, making rigorous text analytics essential—what is not measured cannot be effectively managed. In line with this perspective, a bilingual (English–Turkish) sentiment analysis of user-generated text is conducted, and both traditional machine learning models and a transformer-based deep learning model are evaluated to capture nuanced meaning. In this context, public reviews and feedback shared on social media serve as rich, real-time indicators of customer experience, satisfaction, and brand perception. A growing body of research emphasizes that sentiment analysis of such feedback, powered by machine learning (ML) and deep learning (DL) techniques, is essential for extracting actionable insights from massive unstructured datasets.
Digital commerce increasingly depends on timely, data-driven sense-making from public conversations. Twitter now functions as a real-time, public feedback channel among social platforms where customers report experiences, negotiate expectations, and co-create brand narratives. In QSRs, a high-frequency, time-sensitive setting, these signals are not merely descriptive; they map directly onto operational levers such as delivery timeliness and order accuracy, product or taste quality, price and promotions, hygiene and store environment, and staff interaction. The implication for e-commerce managers charged with protecting conversion and loyalty is clear: social listening must provide brand-specific, action-ready guidance rather than platform-wide averages or abstract model scores. In QSR contexts, event sensitivity, including campaign launches, stock-outs, and service outages, and the mitigating effects of service-recovery cues (such as apologies, refunds, and vouchers) are central to digital operations. However, they are rarely quantified outside English-dominant markets. Studies focusing on fast food brands have documented heterogeneous sentiment baselines across chains and highlighted the influence of promotions, service incidents, and brand violations on public discourse [
1,
2,
3,
4,
5,
6]. However, event-based study designs that quantify the extent to which sentiment fluctuates around operational disruptions or campaigns—and demonstrate how recovery messages suppress negativity—remain relatively underexplored in multilingual contexts.
Studies have shown that sentiment-driven models can predict market behaviors more accurately than traditional approaches by capturing consumers’ emotional and cognitive signals embedded in textual feedback [
7,
8]. In e-commerce environments, integrating sentiment analysis with decision-making frameworks has proven effective in ranking products and prioritizing service improvements based on customer sentiment and engagement [
9]. Moreover, social media platforms have emerged as critical e-trade enablers by influencing consumers’ trust and purchase intentions through peer-generated content, thereby shaping demand patterns [
10,
11]. This convergence of social transparency, e-trade adoption, and AI-driven sentiment analytics represents a transformative paradigm, enabling firms to translate multilingual consumer feedback into brand-level diagnostics and operational strategies [
12,
13].
Although traditional machine learning (ML) algorithms such as Naïve Bayes (NB), Support Vector Machines (SVMs), Logistic Regression (LR), and Random Forests (RFs) have been widely employed in sentiment analysis, recent advances in DL, particularly transformer-based models such as Bidirectional Encoder Representations from Transformers (BERT), have demonstrated substantial improvements in context-sensitive sentiment prediction. Numerous studies have comparatively evaluated ML and DL approaches for classifying consumer sentiment in online reviews and social media streams, consistently reporting the superior performance of contextualized transformers over bag-of-words or static embeddings [
14,
15,
16,
17,
18]. Although deep and ensemble models frequently outperform lexicon-based baselines in the domains of QSRs and food delivery, challenges related to interpretability and the managerial translation of model outputs persist [
1,
15,
19]. Prior research shows that transformer-based models (e.g., BERT) typically outperform classical ML approaches on short, noisy texts, including online reviews and social streams [
14,
15,
16,
17,
18,
20]. Interpretability and translation to action remain uneven; many studies report global accuracy without tying sentiment signals to concrete decision domains (e.g., whether a sentiment swing is driven by delivery delays or perceived product quality) [
1,
15,
19].
Linguistic diversity, cultural idioms, and regional expression patterns can substantially influence how sentiment is expressed, complicating accurate interpretation. Consequently, the effectiveness of sentiment classification models is directly linked to their capacity to capture contextual and linguistic nuances. Language-specific morphology, code-mixing, and culturally bound expressions affect sentiment detection and aspect extraction. While comparative and translation-enhanced approaches have reported mixed results, evidence suggests that transformer models trained or fine-tuned on large English corpora can be effectively transferred to Turkish following careful pre-processing or translation pipelines. Nevertheless, the risk of semantic drift persists [
21,
22,
23,
24,
25,
26]. Therefore, error-sensitive multilingual pipelines remain an unmet need for analyzing feedback on quick-service restaurants in non-English markets.
This study employed artificial intelligence (AI)-based sentiment analysis techniques to examine consumer sentiment in the fast food sector by analyzing Turkish and English tweets. By focusing on user feedback related to three major global fast food brands—McDonald’s, Burger King, and KFC—this study seeks to advance understanding multilingual and parallel-cultural sentiment dynamics. Specifically, the study pursued the following objectives:
To compare sentiment variation in Turkish and English tweets related to the fast food industry.
To investigate the impact of language-specific features and linguistic variation on sentiment classification accuracy.
To evaluate and compare the performance of traditional ML algorithms (NB, SVM, RF, LR) with an advanced DL model (BERT) in multilingual sentiment analysis tasks.
Empirically, the analysis covered Turkish and English tweets referencing McDonald’s, Burger King, and KFC. We compared the performance of traditional ML models with BERT while explicitly linking textual aspects to managerial levers. We applied conservative data augmentation strategies for the lower-resource Turkish subset to stabilize training while preventing potential leakage. Subsequently, sentiment outputs were mapped to topic-level indicators to quantify which issues were predominant at the brand level and how they varied around specific events.
Understanding customer sentiment on digital platforms is not only an analytical exercise but also directly tied to the logic of e-commerce. Customer expressions on social media act as real-time market signals that firms can transform into actionable insights for campaign design, reputation management, and service recovery. By capturing multilingual and parallel-cultural sentiment dynamics, this study lays the groundwork for integrating social feedback into digital commerce decision-making. While the present work focuses on sentiment measurement and model benchmarking, future studies can extend these insights into predictive systems that inform personalization, conversion optimization, and cross-market strategy development in e-commerce contexts.
This study addresses a gap in the literature by analyzing customer sentiment toward global fast food brands in Turkish and English tweets. It integrates multilingual sentiment modeling with aspect-level diagnostics that are directly applicable to digital commerce. Providing brand-resolved insights instead of platform-wide averages enables targeted managerial interventions. Moreover, it offers transparent error analyses that highlight model limitations in handling sarcasm, code-mixing, and culturally specific idioms—an essential requirement for reliable use in managerial contexts.
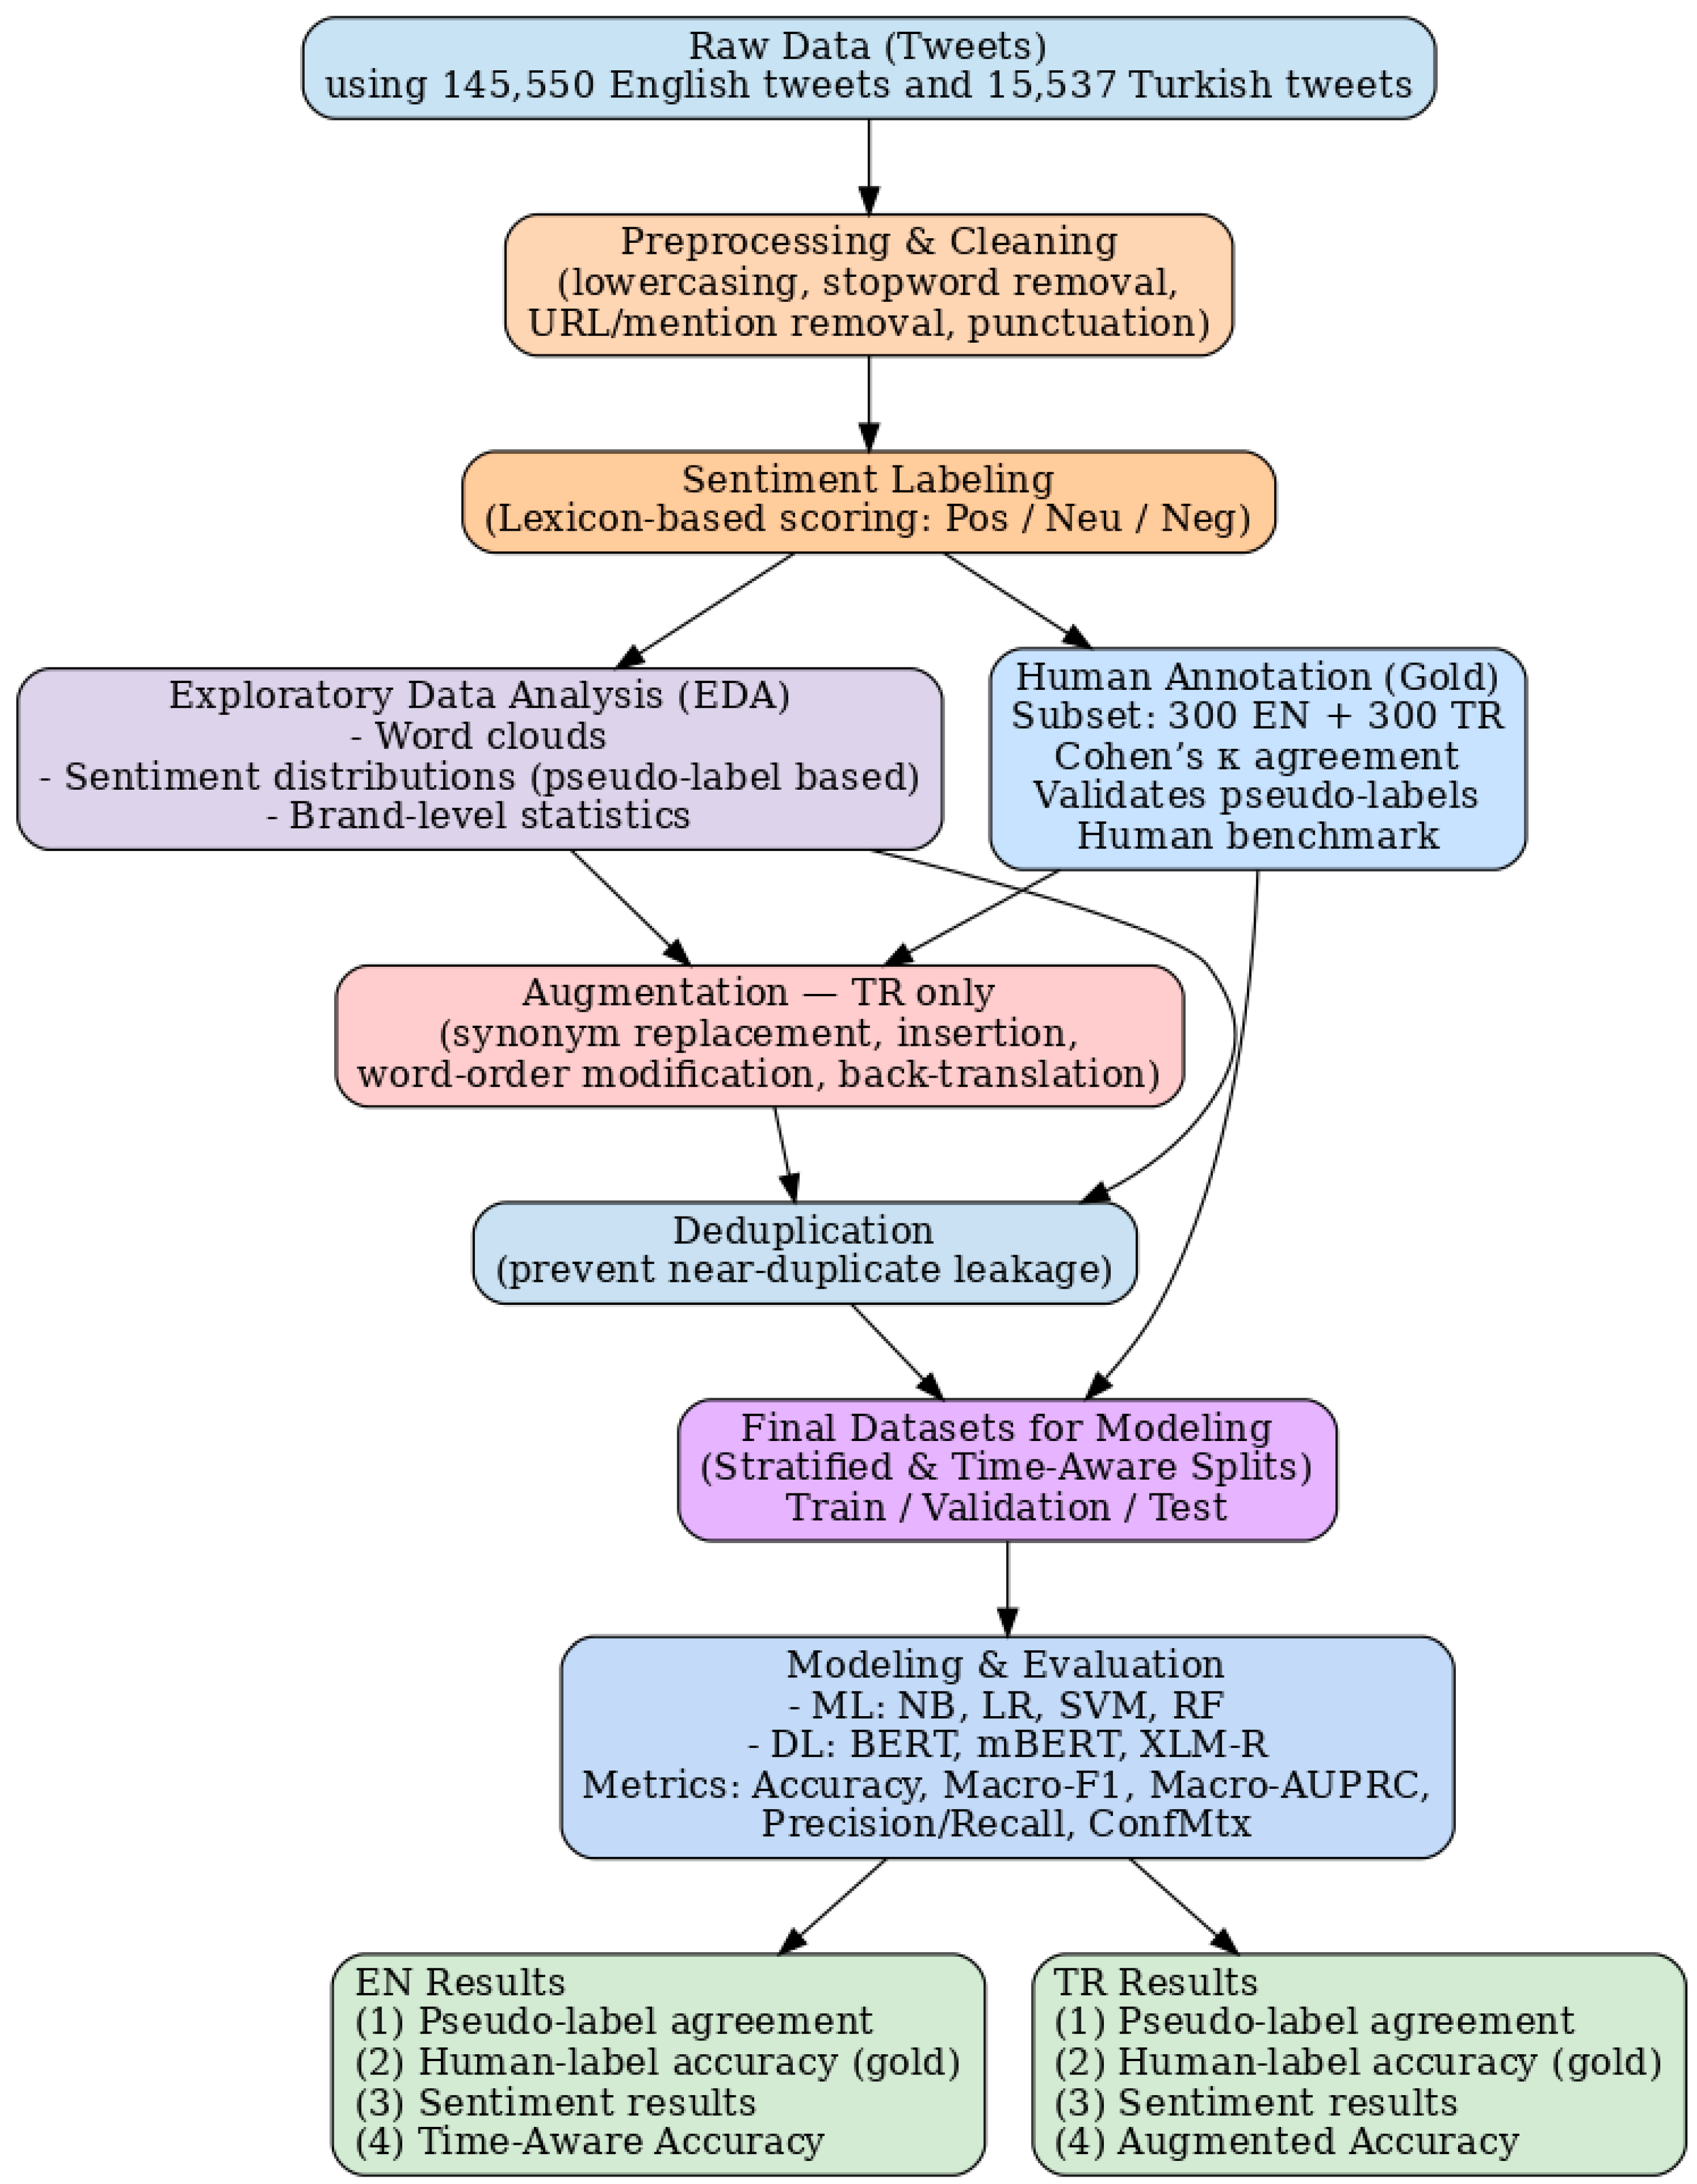
The study explores customer sentiment toward global fast food brands, including McDonald’s, Burger King, and KFC, through sentiment analysis of Turkish and English tweets. The data flow of the study is presented in
Figure 1. The dataset comprises 145,550 English tweets collected over one month and 15,537 Turkish tweets collected over five months. Data augmentation techniques such as synonym replacement and back-translation were applied to enhance model performance on the Turkish dataset. Natural language processing (NLP), sentiment analysis, ML, and BERT were implemented using Python 3.10.12.
In the study, ML and BERT models, recognized in the literature for achieving the high accuracy values in sentiment analysis, were applied to the datasets. While Scikit-learn and TensorFlow were used to build ML models, Keras (running on TensorFlow) was employed for DL models. The Transformers library, which contains pre-trained models for various NLP tasks, was used to fine-tune these models. Pseudo-labels were complemented with a human-annotated gold standard, and a transparent error audit was conducted, focusing on known failure modes in social media data including code-mixing, sarcasm or irony, and culturally anchored idioms. For the lower-resource Turkish subset, conservative data augmentation strictly for training (with leakage safeguards) was adopted to stabilize learning without artificially inflating test performance.
The remainder of this paper is organized as follows.
Section 2 reviews the relevant literature.
Section 3 describes the dataset, outlines the pre-processing methodology, and details the modeling approach.
Section 4 presents the classification models and their results, including performance metrics and a comparative analysis of ROC curves and AUC values across classes for each model.
Section 5 discusses the findings in detail.
Section 6 concludes the study by synthesizing the key findings and outlining implications for future research and practice.
2. Literature
In the rapidly evolving digital landscape, businesses compete in local markets and on a global scale. The rise of online platforms has transformed the collection and analysis of customer feedback, providing essential insights into behaviors across cultures. This transformation is crucial for developing effective global marketing strategies. Customer feedback is increasingly shared via social media and has become indispensable for brands to identify strengths and weaknesses and improve service quality. Moreover, this feedback influences potential customers, making sentiment analysis an essential tool for categorizing feedback into positive, negative, or neutral sentiments. This categorization reveals the general customer attitude towards a brand.
Additionally, online reviews benefit brands and significantly impact customers’ purchasing decisions and behaviors by presenting a consensus on public opinion. The literature contributes significantly to understanding customer feedback dynamics and sentiment analysis, aiding in enhancing business services and sustainable growth, including studies [
27,
28]. In recent years, sentiment analysis has emerged as a vital tool for understanding consumer behavior in the digital marketplace, particularly within the fast-paced and highly competitive fast food industry. Rafiq et al. [
20] compared traditional ML methods (SVM, LR) and advanced DL models (CNN–LSTM, GloVe-CNN-LSTM (Convolutional Neural Network—Long Short-Term Memory), Electra Transformer) for the analysis of customer feedback collected from online platforms. The dataset analyzed in the study was obtained from Trustpilot, a well-known online customer review platform. Zhang et al. [
14] conducted a comprehensive review of sentiment analysis applications in e-commerce, highlighting the effectiveness of transformer-based models in capturing context-dependent sentiment. Adak et al. [
15] conducted a systematic review investigating the application of ML, DL, and explainable AI (XAI) techniques in sentiment analysis of customer reviews within the food delivery services (FDS) domain. In response to the growing reliance on FDS platforms following the COVID-19 pandemic, the study highlights the growing interest in A/I-driven approaches to enhance customer satisfaction through sentiment analysis. The review examined 95 peer-reviewed articles published between 2001 and 2022, revealing that approximately 77% of the employed models were black-box, lacking interpretability. Although DL models—particularly CNN, LSTM, and Bi-LSTM—demonstrated high accuracy in sentiment classification tasks, they suffered from limited explainability. Adak et al. [
15] emphasized the need for future research to improve the interpretability of DL models through XAI methods, such as LIME and SHAP, to ensure both predictive performance and model transparency in practical applications. Chen et al. [
9] investigated whether the content of customer reviews shared on social media changed during COVID-19 and proposed a novel data collection method that reduces interpersonal contact.
To identify key determinants of customer satisfaction from unstructured online reviews, the authors employ text mining techniques, including the Least Absolute Shrinkage and Selection Operator (LASSO) and Decision Trees. Mujahid et al. [
1] investigated public perceptions of fast food restaurants through sentiment analysis and topic modeling of unstructured Twitter data. The study employed several deep ensemble learning models, such as BiLSTM (Bidirectional LSTM) + GRU (Gated Recurrent Unit), LSTM + GRU, GRU + RNN (Recurrent Neural Network), and BiLSTM + RNN, on tweets collected for five major fast food chains: KFC, Pizza Hut, McDonald’s, Burger King, and Subway. The models were compared with lexicon-based methods for sentiment classification, and the BiLSTM + GRU model achieved the highest accuracy (95.31%) for three-class sentiment classification. Additionally, Latent Dirichlet Allocation (LDA) was used to identify major discussion topics and sentiment intensities, revealing that Subway received the highest negative sentiment. Overall, 49% of tweets expressed neutral views, 31% were positive, and 20% were negative. The findings highlight the superiority of deep ensemble models over traditional lexicon-based approaches in sentiment analysis of social media data.
In the literature, AI models have also been applied to domains beyond the food sector using social media data, demonstrating their versatility in marketing, finance, healthcare, and startup performance prediction. Jung and Jeong [
29] developed an ML-based analytical approach using Twitter data to predict startup firms’ social media marketing performance. By analyzing data from 8434 startups—including tweet counts, retweets, and likes—they engineered key social media features. Various ML algorithms (e.g., decision tree, RF, LR) and a DL model were tested, with the DL model achieving the highest prediction accuracy (~73.4%). DL models have also gained increasing prominence in the literature in recent years, particularly for their effectiveness in processing and analyzing unstructured social media data across various domains. Cao and Fard [
30] evaluated automatic response models for user feedback, highlighting the comparative performance of the BERT and RoBERTa models. Similarly, recent research has also addressed consumer perspectives in the context of the pandemic using ML approaches. Meena and Kumar [
21] utilized social media data and ML techniques to investigate the performance of online food delivery companies and evolving consumer expectations during the COVID-19 pandemic. The study identified key topics of concern in both developed and developing countries, revealing that Indian consumers prioritized social responsibility, whereas financial considerations were more prominent among U.S. consumers. The findings suggested that Indian customers reported higher service satisfaction than their U.S. counterparts. Abdalla and Özyurt [
22] underscored the superior performance of Bi-LSTM in sentiment analysis of tweets related to fast food brands. In line with this, Açıkalın et al. [
23] found that the BERT model excels in the sentiment analysis of translated Turkish user reviews.
Zhang et al. [
31] implemented a four-stage research model employing Latent Dirichlet Allocation (LDA) for topic modeling and extracting five subjects (price, time, food, service, and location). They also performed sentiment analysis on a Yelp restaurant reviews dataset using Python’s TextBlob to gather customer sentiments for each topic. The authors suggested that integrating automatic topic extraction and sentiment analysis could streamline the design of recommender systems for online customer reviews or business decision-making systems, making more efficient, streamlined, and effective.
Nilashi et al. [
32] analyzed customer satisfaction levels and preferences by employing effective learning techniques, including text mining, Latent Dirichlet Allocation (LDA), Self-Organizing Maps (SOM), and Classification and Regression Trees (CART) in the context of vegetarian-friendly restaurants. Experimental analyses were conducted using data collected from vegetarian-friendly restaurants in Bangkok. A related study conducted in Bangkok also highlights similar findings. Boonta and Hinthaw [
33] investigated the key factors influencing the business performance of restaurants on social commerce platforms in Bangkok. Using NLP and ML techniques, the authors analyze customer reviews to develop predictive customer satisfaction models in different restaurant price categories. The findings reveal that population density and seating capacity impact low- and mid-range restaurants, while pricing is critical in mid- and high-end segments. Goularas and Kamis [
34] compared DL methods for sentiment analysis on Twitter data, focusing on convolutional neural networks (CNNs) and long short-term memory (LSTM) networks. It evaluated these models’ combinations and different word embedding techniques, such as Word2Vec and GloVe. Using the SemEval dataset for benchmarking, the study assesses performance under a unified framework, highlighting the strengths and limitations of each approach in sentiment classification tasks. Sigalo et al. [
2] discovered relationships between tweet sentiments and the distinction between healthy and unhealthy foods to identify food deserts (areas with insufficient food access) in the USA, incorporating the analysis of geographical data. Legocki et al. [
3] gathered tweets about brand transgressions in the retail, fast food, and technology sectors, coding them for message intention and conducting further analysis. Yalcinkaya et al. [
4] performed text analysis on a sample of 80,728 online customer reviews from quick-service restaurants to examine the different dining experiences between the two types of restaurants. Highlighting that technological innovations are becoming increasingly dominant in the food industry, Recuero-Virto et al. [
5] emphasized that innovations are crucial for economic and social progress and that understanding customers’ stance on this matter is critical. They collected 7030 tweets organized into 14 food-related topics and analyzed them using natural language processing and sentiment analysis.
In the literature, studies in the food sector involve ML and DL in analyzing online consumer feedback. Zhang, Wang, and Liu [
18] present a systematic survey of DL approaches for sentiment analysis, highlighting the evolution and effectiveness of methods such as CNNs, RNNs, LSTMs, and attention-based transformers. Their analysis confirms that transformer-based architectures, particularly BERT, outperform older models by better capturing contextual nuances in sentiment classification. Bitto et al. [
19] conducted sentiment analysis on user reviews from the Facebook pages of Bangladeshi food delivery startups, such as Food Panda, HungryNaki, Pathao Food, and Shohoz Food. The analysis involved extensive data pre-processing, including adding contractions, removing stop words, and tokenizing. They employed four supervised ML techniques: extreme gradient boosting (XGB), RF classifier, decision tree classifier (DTC), and multinomial NB; and three DL models: convolutional neural network (CNN), long short-term memory (LSTM), and recurrent neural network (RNN). Among the ML models, XGB achieved the highest accuracy at 89.64%, whereas LSTM outperformed the other DL models with an accuracy of 91.07%, making it the best predictor of sentiment. Zhongmin [
6] explored the global perception of major American fast food brands by analyzing 10,002 tweets to provide digital strategies to improve the public opinion of negatively perceived brands. The methodology involved a data-driven process with sentiment, textual, and content analysis for each brand. The data collected from Twitter were used to classify the sentiment of each tweet using a custom-developed algorithm. The results, measured using Krippendorff’s alpha value, indicated tentative reliability, revealing that McDonald’s and Starbucks had the highest percentage of negative tweets. To improve their online perception, it is recommended that they diversify the content shared on their digital platforms.
Whereas traditional ML methods can become inadequate as data grows and become more complex, DL algorithms and models can achieve results by performing complex tasks on large datasets. The BERT algorithm, developed by Google in 2018, has gained significant interest in natural language processing in recent years. BERT is a pretrained model demonstrating exceptional performance in numerous natural language processing tasks. Unlike other algorithms, BERT is trained not only to consider words in one direction but also to better predict the meaning of a word by considering both the preceding and following words in the text. Pre-trained models with extensive content, such as BERT, are advantageous for objectives such as text classification and natural language processing because they eliminate the need to build a model from scratch [
35].
Using various methods, Ramzi et al. [
24] conducted comparative analyses of Twitter feedback on food consumption in Malaysia during the COVID-19 pandemic. They combined unigram and bigram ranges with two lexicon-based techniques, TextBlob and VADER, and three DL classifiers, namely LSTM, CNN, and their hybrid. Word2Vector and GloVe were the word embedding approaches employed by LSTM-CNN, with the GloVe on TextBlob approach using a combination of unigram + bigram [
1,
2] range yielding the best outcomes. According to these results, LSTM exhibits superior performance over the other classifiers. Al-Jarrah et al. [
25] conducted aspect-based sentiment analysis for Arabic food delivery reviews using several DL approaches. Specifically, they recommended transformer-based models (GigaBERT and AraBERT), Bi-LSTM-CRF, LSTM, and a traditional ML algorithm, SVM. The experiments indicated that GigaBERT and AraBERT outperformed the other models in all the tasks. Transformer-based models achieved F1-scores of 77% for aspect term detection, 82% for aspect category detection, and 81% for aspect polarity detection, surpassing Bi-LSTM-CRF and LSTM by 2%, 4%, and 4%, respectively.
Kamal et al. [
26] developed a model to detect better negative comments from a Twitter content dataset. The dataset was divided into 100 k, 200 k, 500 k, 800 k, and 1,000,000 comments and analyzed for all datasets and subsets containing negative comments. As the amount of data increases, the accuracy improves for all models. The analysis revealed that the model encompassing the entire dataset with 1,000,000 comments achieved the highest accuracy of 77.57% and 76.51% on the subset containing only negative comments. Severyn and Moschitti [
17] proposed an end-to-end deep convolutional neural network architecture for sentiment analysis on Twitter data, eliminating the need for extensive feature engineering. Their model demonstrated superior performance compared to traditional ML approaches, confirming the effectiveness of CNNs in short-text sentiment classification. Hayatin et al. [
36] conducted sentiment analysis with a dataset divided into four groups, previously used in sentiment analysis studies with a small amount of user feedback in the Indonesian language within the fashion field. This study investigated the effects of different pre-processing techniques on small datasets, and POS tagging was not recommended for small datasets because it reduces the data size. Variants of the NB algorithm, such as the Gaussian, Multinomial, Complement, and Bernoulli models, were compared, with the complement model achieving higher success than the others. Sentiment analysis was applied to a dataset consisting of feedback about airlines written on Twitter. Using NB and SVM methods, accuracy values of 82.48% with SVM and 76.56% with NB were obtained [
36]. Rahat et al. [
37] conducted sentiment analysis on airline reviews from Twitter and reported that SVM 82.48% accuracy) outperformed Multinomial NB (76.56% accuracy) in overall classification performance. Bamgboye et al. [
38] conducted a sentiment analysis study with user feedback using an SVM algorithm and achieved an accuracy of 86.67%. Dhola and Saradva [
39] conducted sentiment analysis with 1,600,000 tweets collected from Twitter, employing ML methods, such as SVM and NB, and DL algorithms, such as BERT and LSTM. The DL algorithms provided better results than the ML algorithms, with the BERT algorithm achieving the highest classification success rate of 85.4%.
Many DL methods have been used for unstructured data, including LSTM [
40], CNN [
41], and BiLSTM (Bidirectional Long Short-Term Memory) [
42]. BERT [
40,
41] is a deep-learning method used in recent years. This research involved comparative applications of ML and DL methods. Mujahid et al. [
1] applied DL methods to Twitter feedback on fast food brands. They utilized DL models including a Recurrent Neural Network (RNN), Long Short-Term Memory (LSTM), Bidirectional LSTM (BiLSTM), and Gated Recurrent Unit (GRU), as well as customized deep ensemble models such as BiLSTM + GRU, LSTM + GRU, GRU + RNN, and BiLSTM + RNN. They also employed topic modeling to identify the most frequently discussed topics and words using the Latent Dirichlet Allocation (LDA) model. The experimental results indicated that the deep ensemble models produced better results than lexicon-based approaches, particularly the BiLSTM + GRU model, which achieved the highest accuracy of 95.31% for three-class problems. Literature shows that the NB algorithm works well on datasets with small and large amounts of data [
17,
26]. The SVM algorithm has been frequently used in sentiment analysis problems and has been found to achieve high classification success in the literature [
37,
38,
39]. The BERT model, which was developed in 2018, has emerged with high success. As seen in the study by Açıkalın et al. [
23], when the model successes were compared by applying BERT models linguistically, better results were obtained with Turkish data translated into English compared with sentiment analysis directly with Turkish data.
3. Data Pre-Processing
This study collected customer feedback from Twitter to analyze sentiment trends in the fast food industry and evaluate their impact on customer feedback and data-driven decision-making. The study investigated variations in consumer sentiment across two languages, offering insights into brand reputation and customer preferences.
The dataset [
43] was collected from three major brands, McDonald’s, Burger King, and KFC, which are ranked among the top 25 most valuable restaurant brands in the food sector according to Brand Finance Turkey’s 2022 Report. The English dataset was collected over one month, from 9 September 2022 to 9 October 2022, yielding 145,550 English tweets. The Turkish dataset was gathered over a more extended period, from 6 August 2022 to 1 January 2023, resulting in 15,537 Turkish tweets.
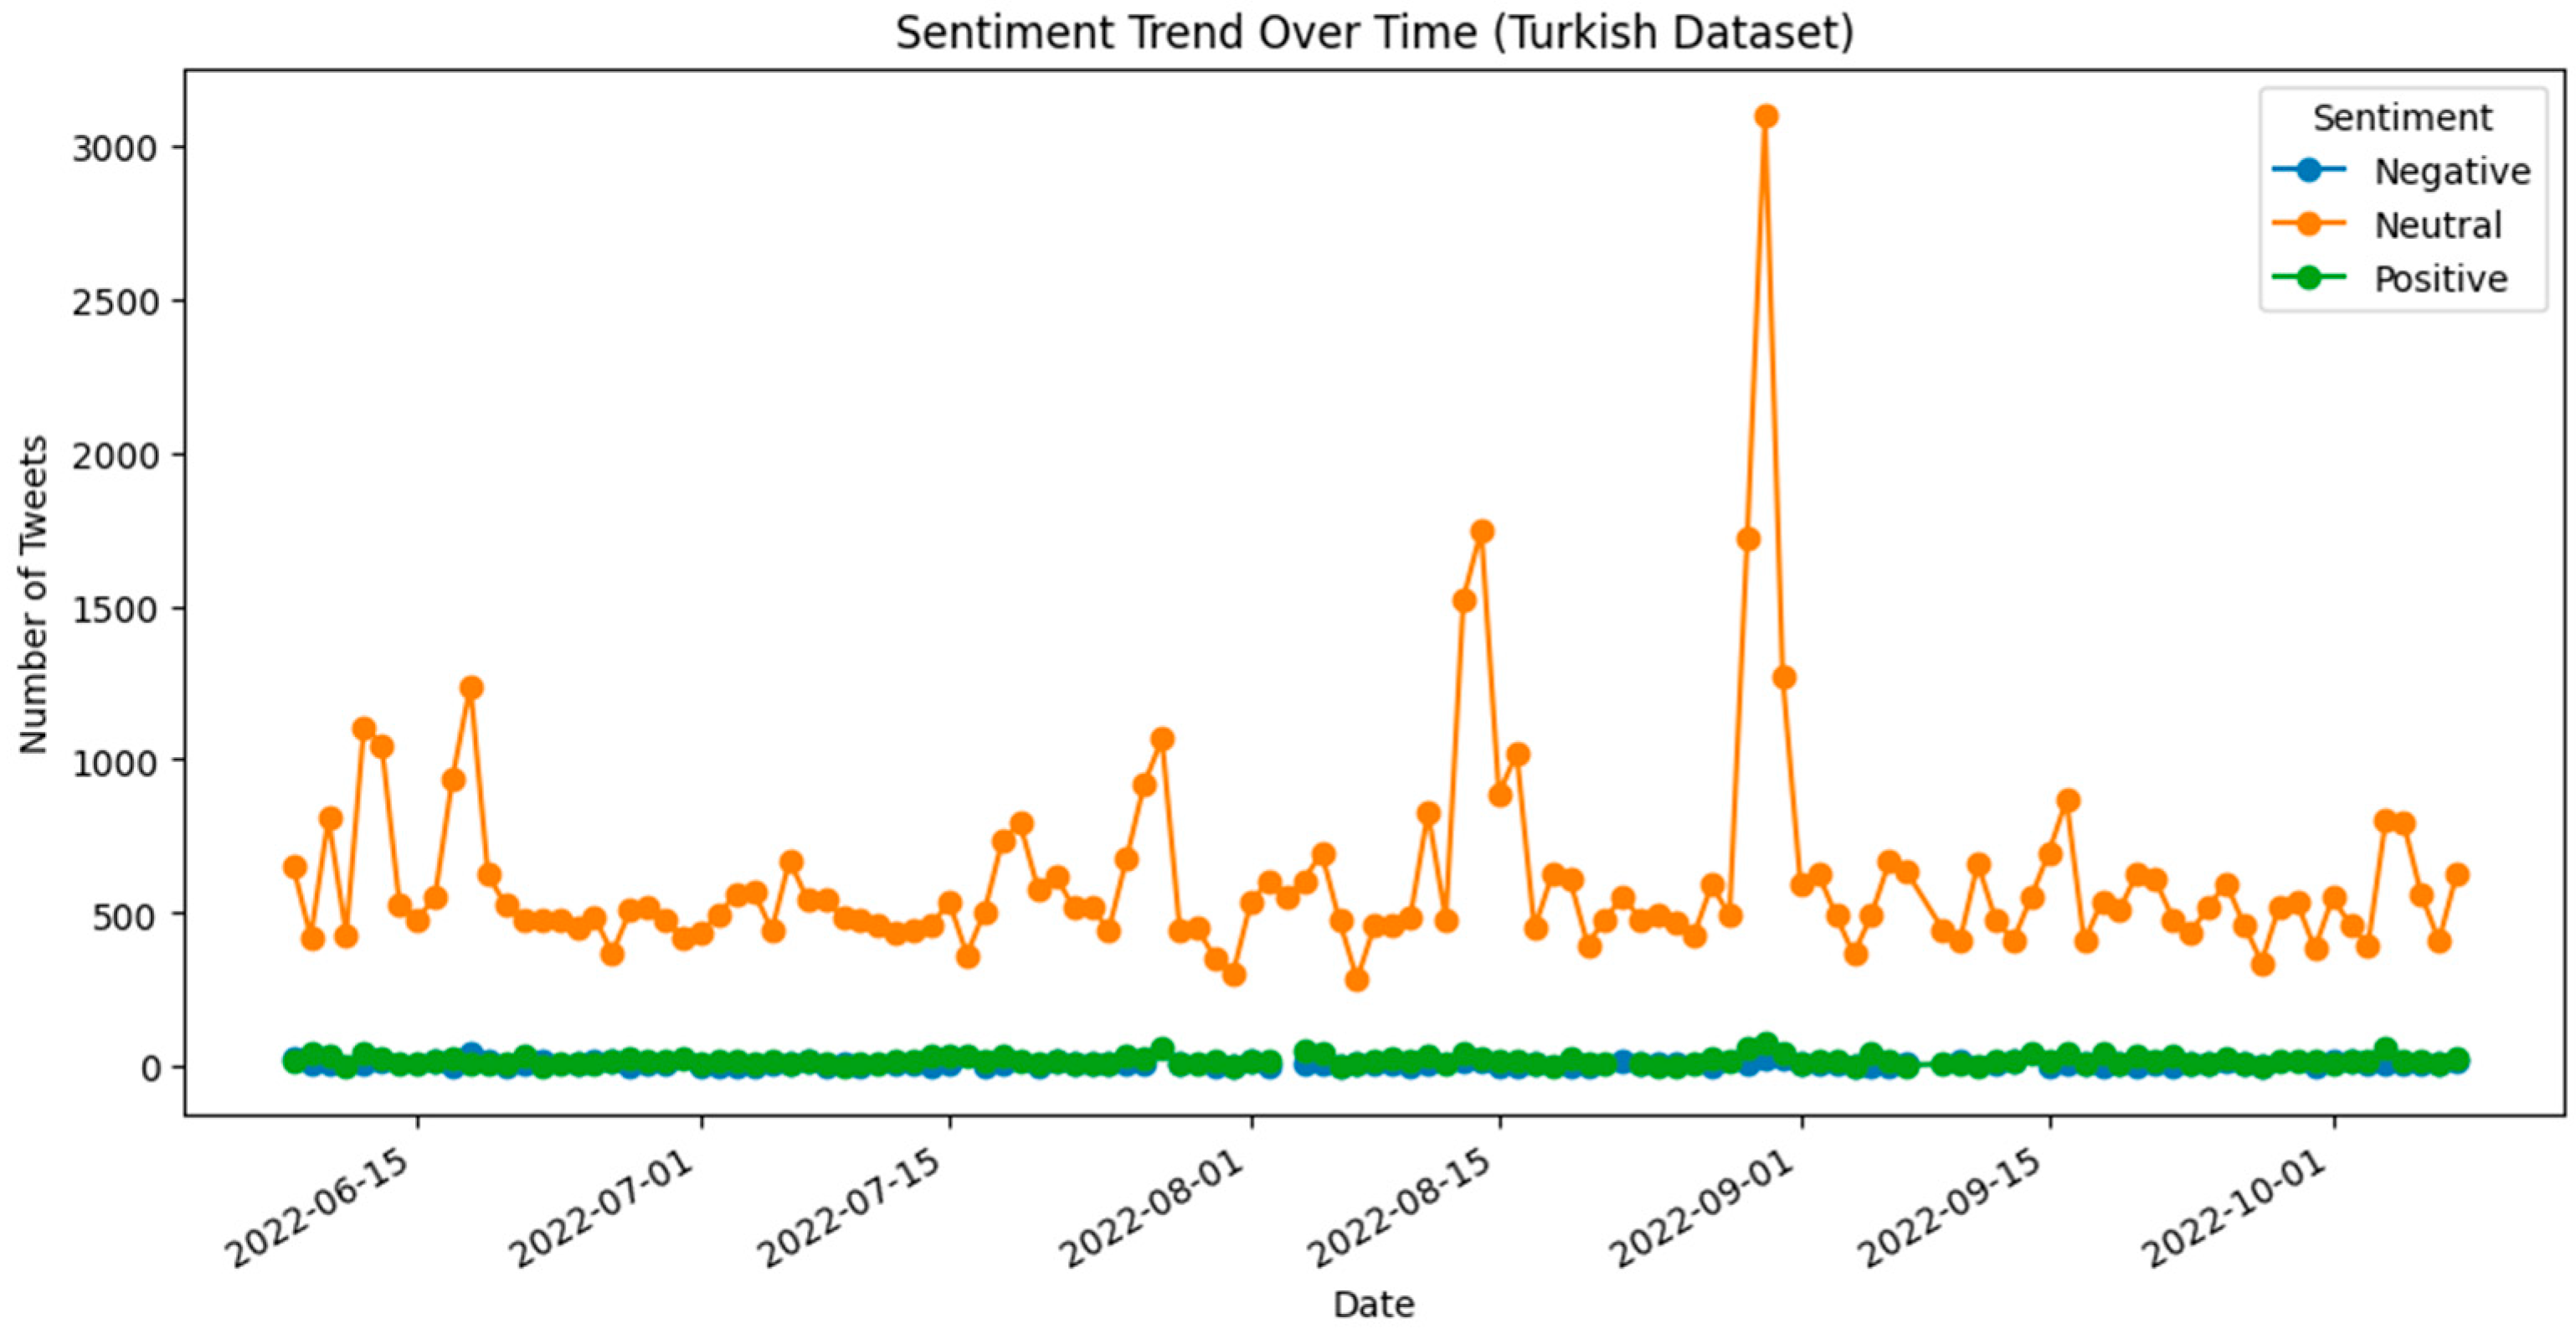
To enhance model performance on the Turkish dataset, we applied data augmentation—synonym substitution and back-translation for the Turkish dataset, which included timestamp information—and a time-series sentiment analysis was conducted. Tweets were resampled on a daily basis to capture temporal trends and fluctuations in sentiment, which may be linked to specific events or marketing campaigns.
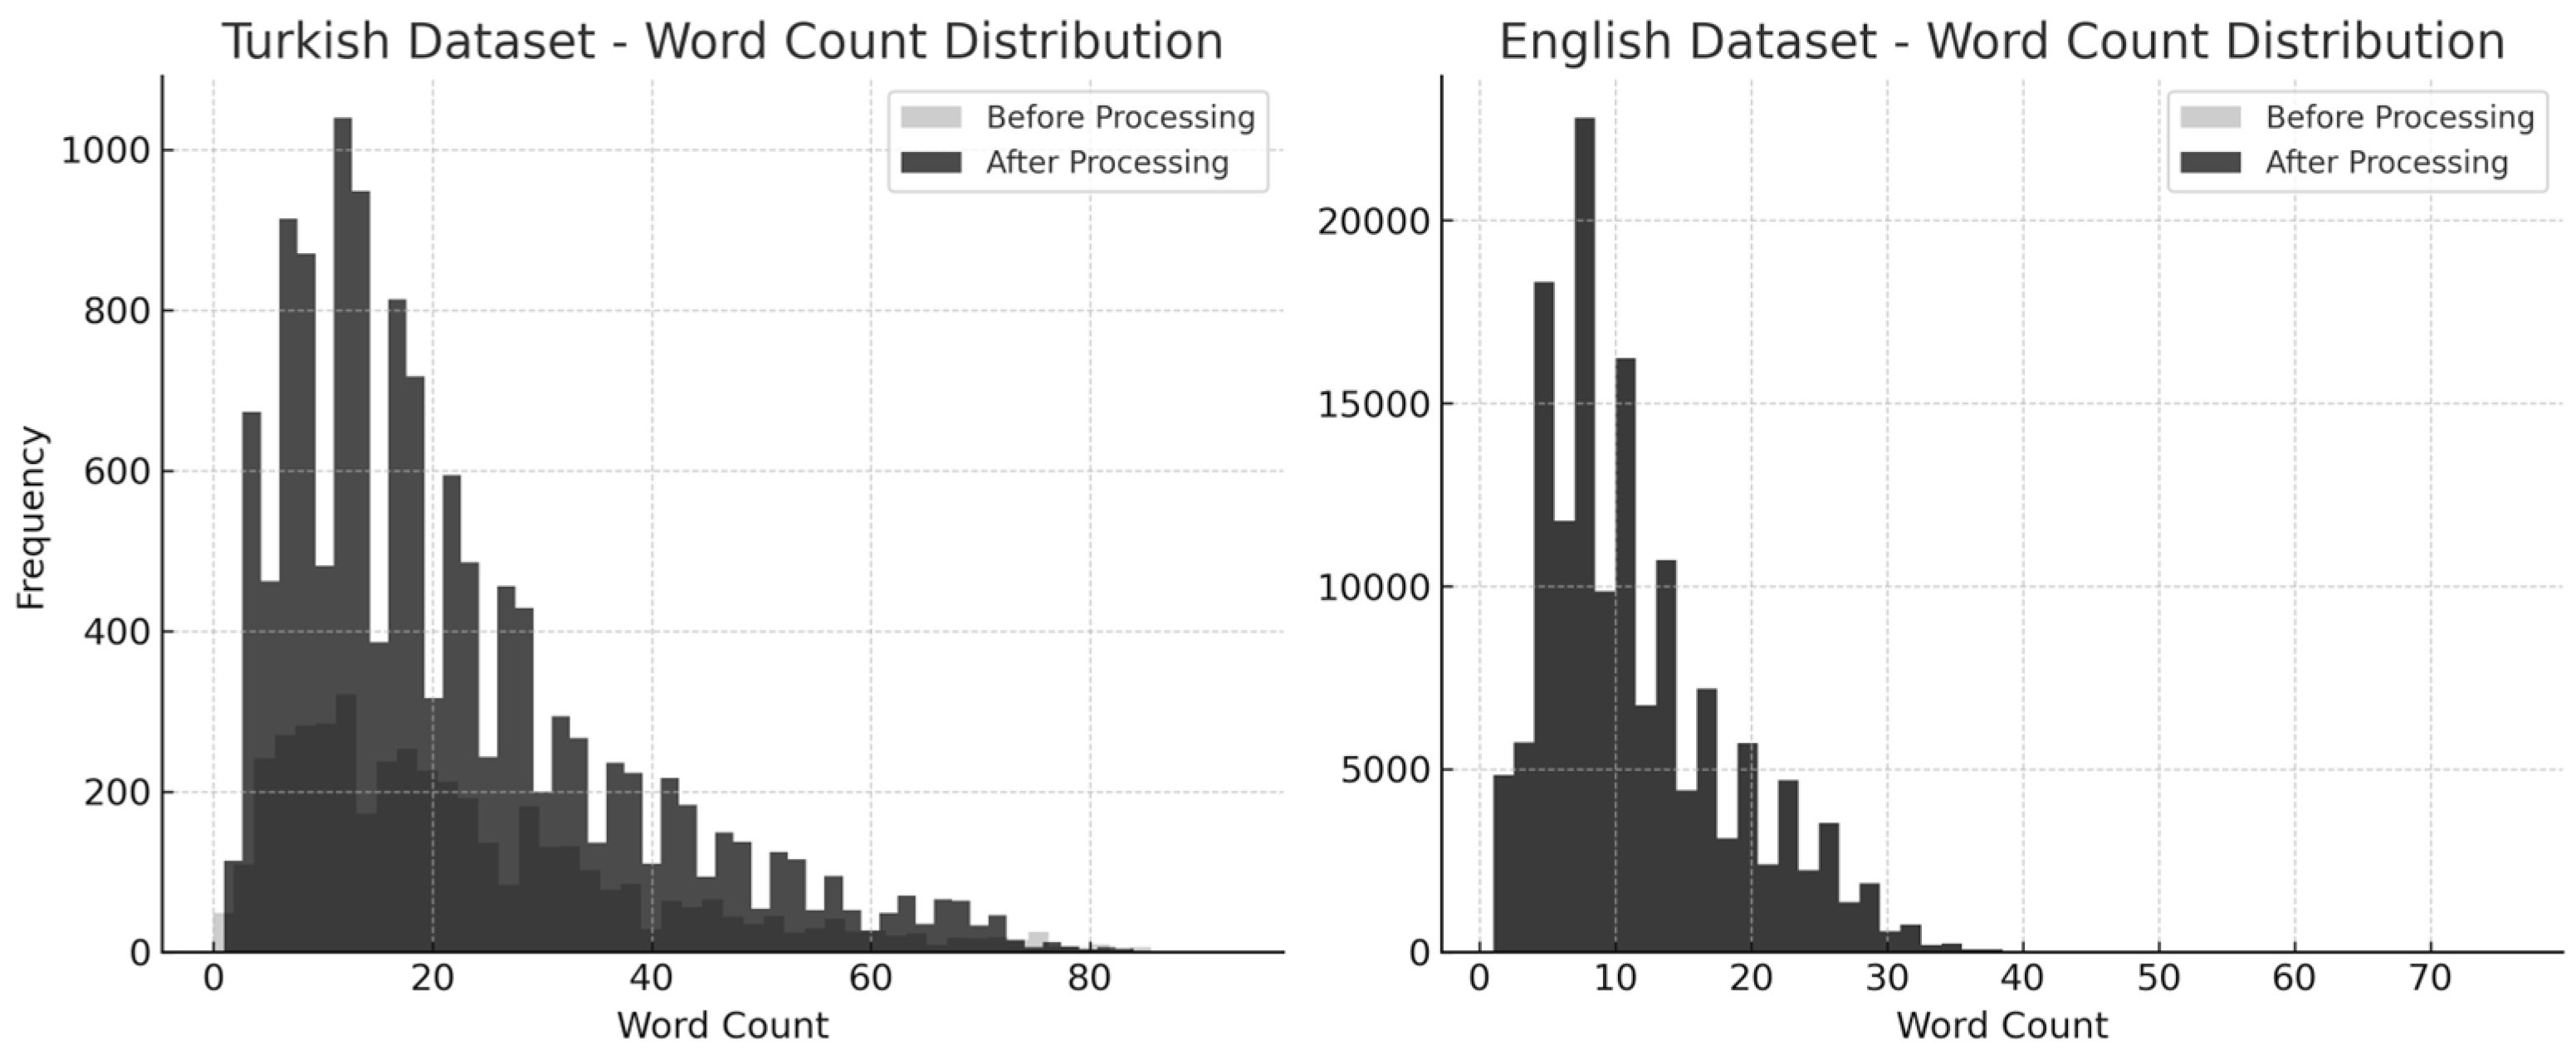
The pre-processing phase included systematic text normalization, noise reduction, and data structuring to enhance textual interpretability and model input quality. The pre-processing workflow began with converting all text to lower-case to maintain consistency. Noise reduction techniques were then applied to eliminate URLs, user mentions, punctuation marks, and special characters that could introduce bias into the models. Additionally, stop word removal was performed using the NLTK library, allowing for the retention of semantically meaningful content.
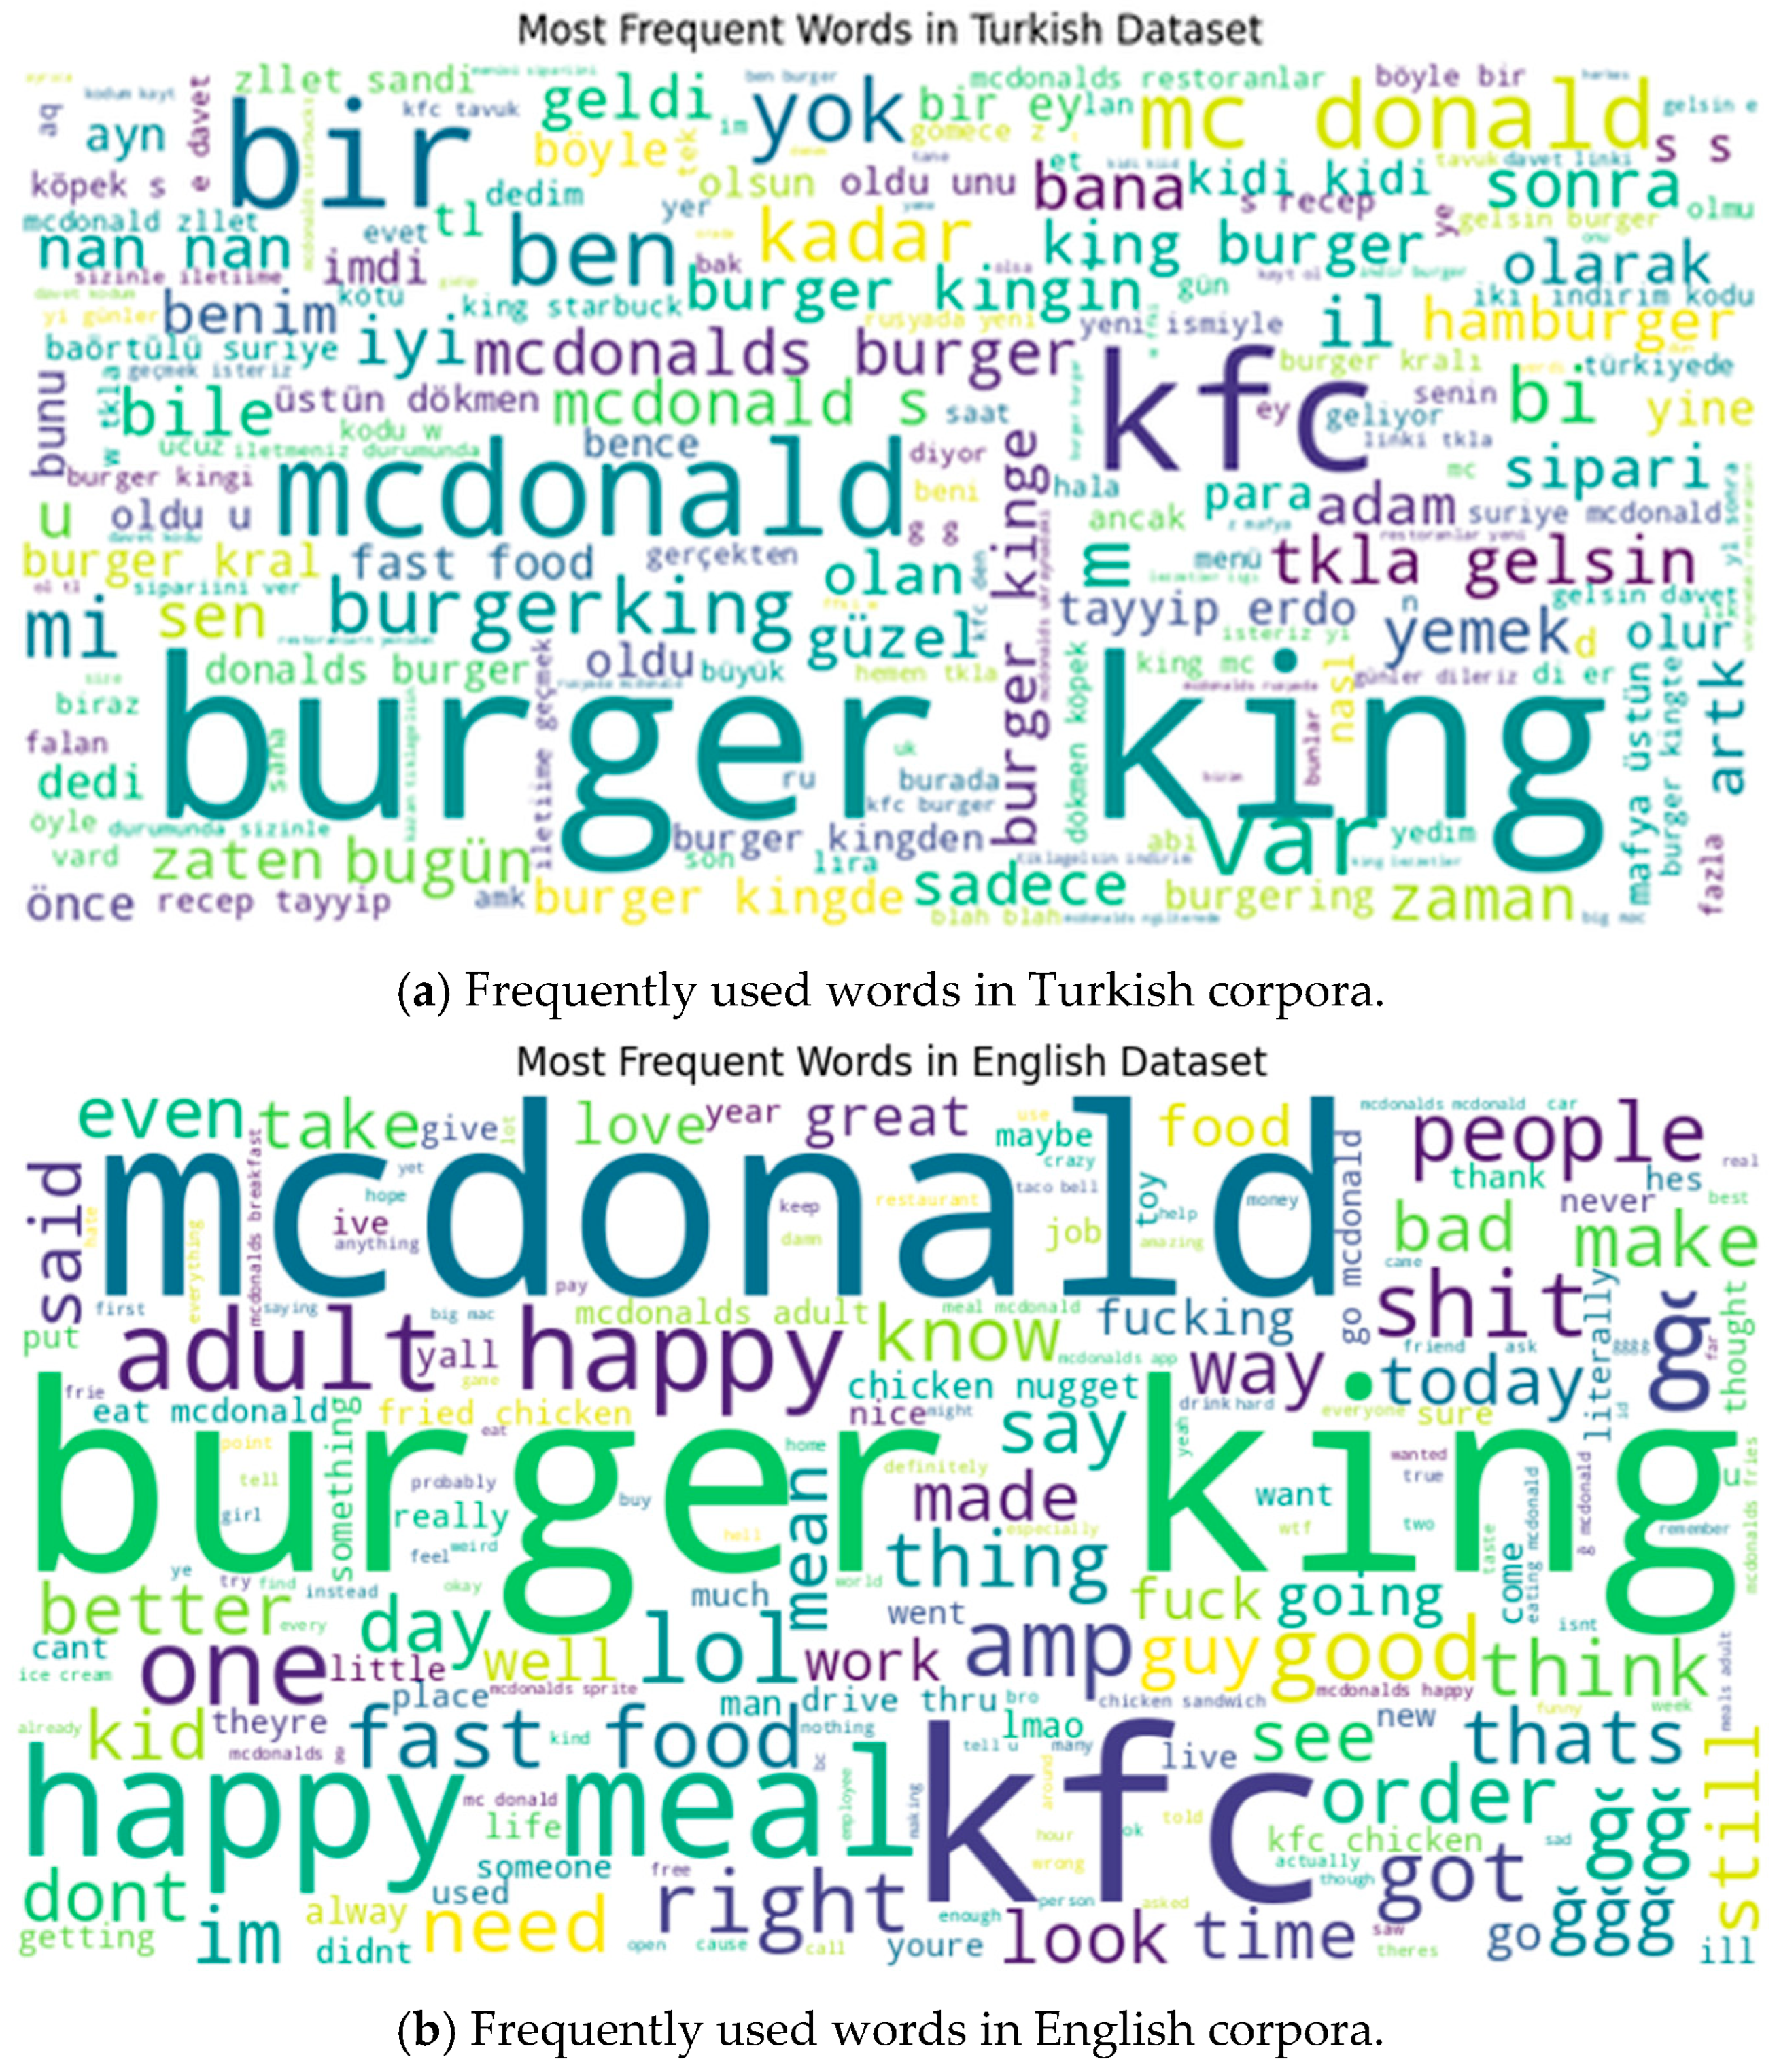
The pre-processing and exploratory data analysis (EDA) phases were conducted to refine and structure the datasets, ensuring data quality and optimizing sentiment classification; key corpus statistics and class frequencies were examined; and visualizations were produced to summarize category proportions and salient terms. Key metrics such as dataset size and the frequency of sentiment classes were evaluated. Visualization tools were used to illustrate the proportion of sentiment categories, enabling an intuitive understanding of overall sentiment trends. Word clouds were also generated to highlight frequently occurring words, offering insight into dominant linguistic features within the dataset.
The pre-processing and EDA processes were implemented using various Python-based NLP and data analysis libraries. The pandas library was used for data manipulation; NumPy was used for numerical computations; and regular expressions (re) were used for text cleaning. Visualization was achieved with matplotlib and seaborn, while a word cloud was employed to generate visual representations of frequent terms. The NLTK library facilitated stop word removal and tokenization, and lexicon-based automatic scoring (rule-based for both languages) supported sentiment scoring.
3.1. Sentiment Labeling
To investigate the affective tendencies embedded in the datasets, sentiment polarity scores were computed using a lexicon-based automatic scoring approach (rule-based for both English and Turkish). This method assigns polarity scores to each tweet by matching words against pre-defined sentiment dictionaries, considering valence and intensity. Based on numerical thresholds (positive > 0, negative < 0, and precisely 0 for neutral), Polarity values were then categorized into three discrete sentiment classes—positive, negative, and neutral. This structured categorization facilitated a more robust modeling process and enabled a comprehensive understanding of sentiment distribution in the datasets. Although this rule-based lexicon method ensures full coverage without requiring training data, it also carries the inherent limitation of potentially overlooking context-dependent sentiment cues, especially in morphologically rich languages such as Turkish.
3.2. Geospatial Methodology
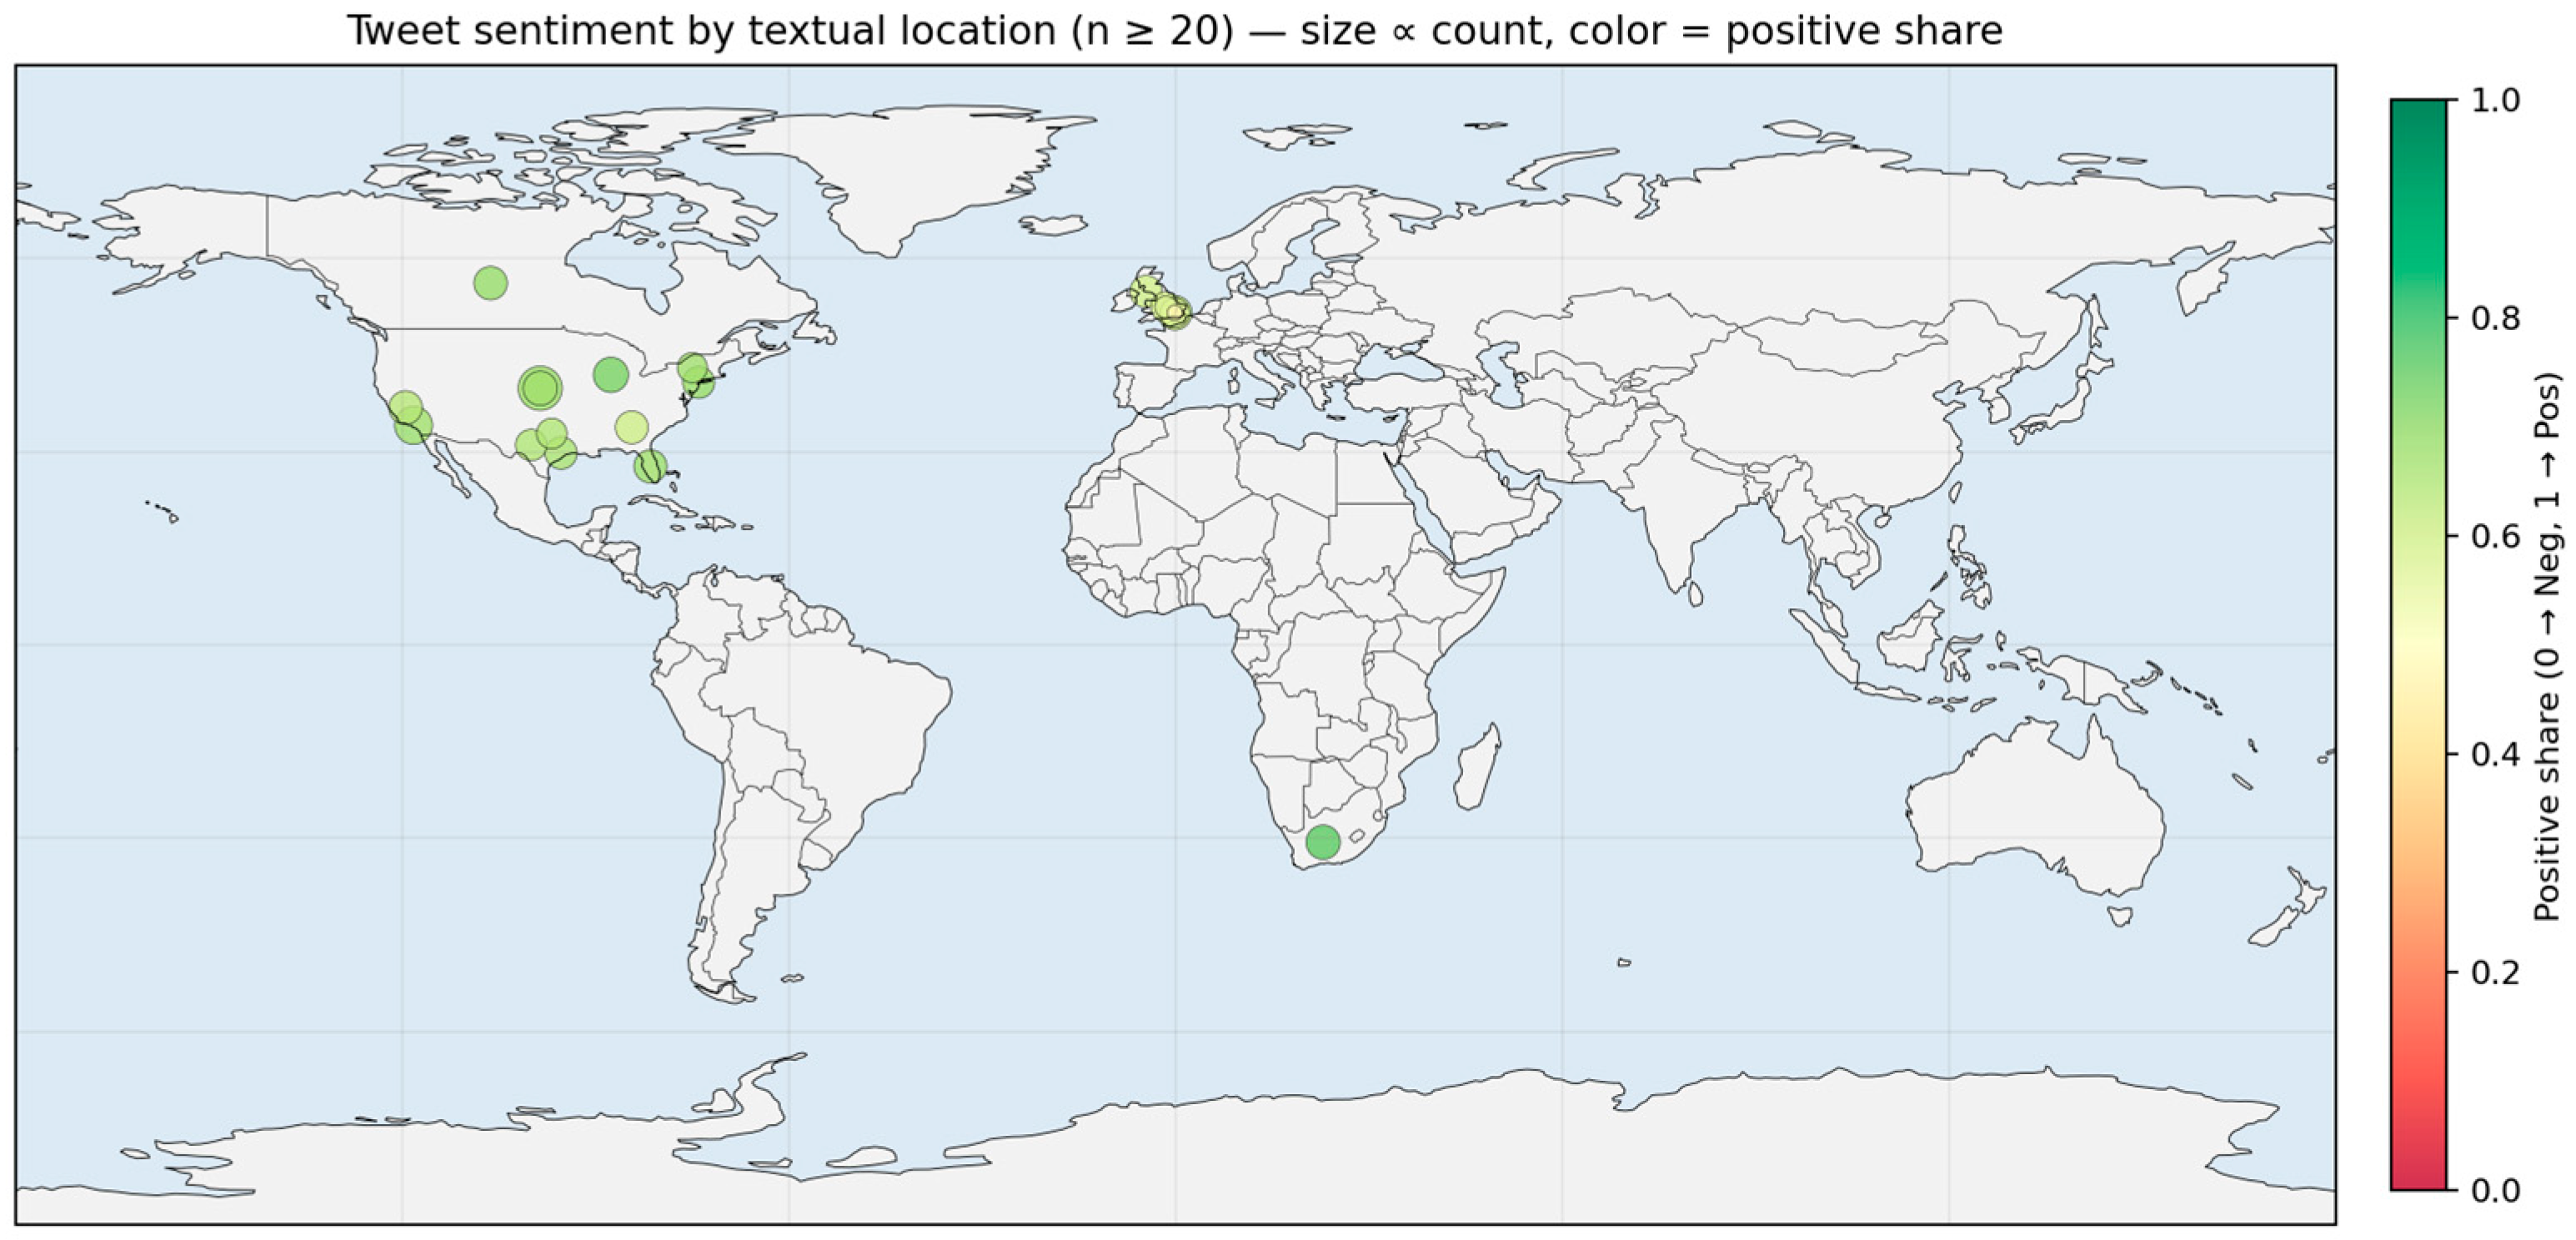
Geospatial analyses were conducted exclusively on tweets with usable location indicators—either numeric coordinates (latitude/longitude) or user-provided textual locations (e.g., city, state/province, country). Records lacking such information were excluded. All sentiment labels were harmonized to a three-class scheme (Negative = 0, Neutral = 1, Positive = 2) using a deterministic mapping for string labels and sign-based discretization for numeric polarity values. For coordinate-bearing records, privacy-preserving binning was applied on a regular 0.5° grid, and cell mid-points were shown in visualizations; for textual locations, grouping was performed verbatim after whitespace trimming, and no reverse-geocoding was released. To protect privacy and enhance statistical stability, only groups with n ≥ 20 observations were retained; very small cells were suppressed. Where a brand field was available, statistics were additionally produced at the location × brand level. Coordinate-based summaries were visualized as bubble scatter plots, whereas textual-location aggregates were presented in tabular form. Reproducibility was supported by fixing the random seed (42), the grid size (0.5°), and the inclusion threshold (n ≥ 20), together with standardized label-mapping and processing rules. No point-level maps or reverse-geocoding outputs were released.
3.3. Ground-Truth Validation Through Human Annotation
Rosenthal et al. [
44] provided human-annotated tweet corpora and common evaluation protocols for overall and topic-based polarity, setting a widely adopted precedent for Twitter sentiment evaluation. Pontiki et al. [
45] remains a canonical human-annotated resource at sentence and phrase levels, underscoring the field’s reliance on expert labels when measuring true sentiment understanding. To strengthen the validity of sentiment ground truth, we constructed a human-annotated gold-standard dataset in addition to the lexicon-based automatic labels used in pre-processing for both English and Turkish datasets. Relying solely on these pseudo-labels would mainly measure agreement with the underlying lexicon rather than human perception.
To ensure validity beyond agreement with lexicon-derived pseudo-labels, we additionally conducted an evaluation on a human-annotated gold subset. This practice followed established benchmarks in sentiment analysis, where manually labeled data serve as the reference standard for model assessment. We constructed stratified and balanced subsets of tweets for both datasets. Specifically, we randomly sampled an equal number of instances per sentiment class (positive, neutral, and negative) to ensure representativeness and prevent class imbalance. For each language, we extracted 300 tweets (100 per class), which were subsequently annotated independently by two human coders. The annotation protocol required coders to assign each tweet to one of three sentiment categories: positive, neutral, or negative. We calculated Cohen’s κ coefficient to evaluate inter-annotator reliability, which quantifies agreement beyond chance. For English, κ reached 0.61, indicating substantial agreement across annotators. For Turkish, κ was even higher at 0.82, indicating strong consistency across annotators and confirming the reliability of the gold standard.
An adjudication procedure was applied for instances of disagreement: tweets on which annotators disagreed were either resolved by consensus or defaulted to the annotator’s label in cases where no final decision was reached. This ensured that every tweet in the gold-standard subset had a final sentiment label for subsequent evaluation.
Finally, we re-evaluated all ML and DL models using this human-annotated subset. In line with best practices, we reported two separate sets of results:
This dual evaluation framework clarifies the distinction between merely reproducing automatic polarity assignments and genuinely capturing human sentiment, thereby enhancing the validity of the reported evaluation results. To this end, human annotation was initially conducted to validate the pseudo-labels, and the model performance was subsequently evaluated and reported with respect to both pseudo-labels and human-provided labels.
3.4. Expanding the Turkish Dataset Using Data Augmentation Techniques
NLP models require large and diverse datasets to achieve high performance in sentiment analysis tasks. However, low-resource languages like Turkish often suffer from data scarcity, negatively affecting model accuracy and generalizability. While the abundance of large-scale labeled datasets in English facilitates the development of robust sentiment models, Turkish presents substantial challenges due to its limited availability of annotated resources. To address this limitation, a controlled and leakage-safe data augmentation pipeline was applied to the Turkish dataset to increase linguistic diversity, improve model generalization, and enhance syntactic flexibility.
Data augmentation is a widely adopted approach in NLP for mitigating class imbalance, linguistic bias, and the constraints posed by limited training examples—particularly in underrepresented languages. By artificially expanding the dataset through lexical, syntactic, and semantic variations, data augmentation exposes models to a broader range of sentence structures, thereby reducing overfitting and improving robustness.
In this study, the following augmentation methods were systematically implemented on the training set only, following a strict de-duplication and content-hashing procedure to ensure that augmented variants of each sentence appeared exclusively in a single split (preventing data leakage to validation or test sets):
Synonym Replacement for Lexical Diversity: A manually curated synonym dictionary was developed to replace frequently occurring sentiment-bearing Turkish words with semantically equivalent alternatives, enriching lexical variation while preserving meaning. For example, words like iyi (good), kötü (bad), hızlı (fast), yavaş (slow), mutlu (happy), and üzgün (sad) were systematically substituted using randomized selection.
Word Removal and Insertion for Structural Variability: Random word removal and insertion were applied to introduce syntactic variation. In removal, a randomly selected token was deleted from a sentence. In insertion, neutral words such as çok (very) were inserted randomly, producing alternative sentence constructions.
Word Order Modification for Syntactic Flexibility: Word order was randomly altered without changing semantic content, enabling the model to learn from varied sentence structures and reduce over-reliance on fixed word sequences.
Back-Translation for Semantic Variation: To generate semantically diverse yet contextually consistent variants, back-translation was performed using the deep_translator library. Turkish sentences were translated into English and back into Turkish, producing natural paraphrases.
Before applying these methods, all training samples were de-duplicated using content hashing to prevent near-duplicate sentences from appearing in different data splits. This leakage-safe augmentation increased the number of training samples while preserving the integrity of the evaluation process. The validation and test sets remained untouched, ensuring a consistent benchmark for performance comparison. This augmentation process, integrating lexical, syntactic, and semantic variability, demonstrates the effectiveness of data enrichment for improving sentiment classification in low-resource language settings. Moreover, it provides a replicable framework for future multilingual NLP applications seeking to overcome similar data limitations.
5. Modeling
This study adopts a hybrid approach integrating traditional machine-learning (ML) algorithms and transformer-based models to classify sentiment in Turkish and English tweets. The pipeline comprises: (i) pre-processing; (ii) feature extraction; (iii) model selection and training; and (iv) evaluation. For ML baselines (NB, SVM, LR, RF), features were derived with TF–IDF over unigrams (maximum 4000 terms). In parallel, BERT models were fine-tuned separately for each language (dbmdz/bert-base-turkish-cased for Turkish; bert-base-uncased for English). To minimize temporal and cross-domain leakage, English experiments used time-aware splits (early→late; ≈70/10/20), while Turkish experiments respected the provided splits with duplicate removal and cross-split leakage checks; where timestamps existed, the constraint max (train date) ≤ min (test date) was verified. Because the Turkish set is severely imbalanced, macro-level metrics and per-class reports were prioritized, and a majority-class baseline was included. Hyperparameters for the traditional ML models were tuned using GridSearchCV, whereas BERT was fine-tuned with fixed training arguments. All analyses were implemented in Python using both machine learning and transformer-based methods (see
Supplementary Materials) [
46].
Deep learning-based sentiment analysis methods [
47] were used in the literature. This comparative setup enabled language-aware robustness assessment and highlighted the advantages of deep contextual representations, particularly in a lower-resource setting such as Turkish. Combining classical and transformer-based models enhances the generalizability of sentiment classification and provides a comprehensive framework for analyzing multilingual consumer feedback.
5.1. Data Pre-Processing for Modeling
All texts were lower-cased; URLs, user mentions, punctuation, and non-alphanumeric symbols were removed; and stop words were filtered using the NLTK library (Turkish or English). Sentiment labels were harmonized to Negative = 0, Neutral = 1, Positive = 2 via deterministic mapping of string categories and sign-based discretization for numeric polarities.
For ML models, documents were vectorized with TF–IDF (unigram, max_features = 4000). For BERT, the corresponding Hugging Face tokenizer was used; sequences were padded/truncated to a fixed maximum length prior to fine-tuning.
Both the non-augmented and augmented Turkish corpora were re-evaluated under a time-aware protocol (early→late, ~70/10/20) whenever a usable timestamp column existed; otherwise, the pre-defined splits were retained. All headline metrics (macro-F1, macro-AUPRC) were computed on the held-out test portion, alongside accuracy, weighted precision/recall/F1, per-class precision/recall, confusion matrices, and ROC/PR curves.
5.2. Model Configuration and Hyperparameter Optimization
Model selection for ML baselines used GridSearchCV with stratified k-fold internal validation (TR: k = 3; EN: k = 3 for computational feasibility). The best configuration per model was refit on train + validation and evaluated once on the independent, leakage-free test set. For English, the train/validation/test split was time-aware (earlier weeks → later weeks). BERT models were fine-tuned with fixed training arguments; for stability checks, k-fold validation was applied only to the training split (TR: k = 5; EN: k = 3), after which the model was retrained on the combined train + validation data and evaluated once on the time-aware test set. Primary metrics were macro-F1 and macro-AUPRC (macro-averaged one-vs-rest AP), reported alongside accuracy, weighted precision/recall/F1, per-class precision/recall, confusion matrices, and ROC/PR curves.
5.2.1. Machine Learning Models and Hyperparameter Settings
Four classifiers were implemented: LR, RF, SVM, and NB. Hyperparameter tuning was conducted with GridSearchCV.
Table 6 presents the search spaces.
Compute-aware SVM (English). The pre-defined SVM grid was retained; however, to avoid the overhead of Platt scaling on the large English corpus, probability = False was set, and PR/ROC curves were computed from min-max-normalized decision_function scores. In addition, cache_size = 2000 and max_iter = 2000 were used. When the training set exceeded ≈50 k instances, the search was restricted to the linear kernel; for smaller sets, both linear and RBF were evaluated. These adjustments reduced computation without altering the methodological search space.
5.2.2. Transformer-Based Sentiment Classification with Bidirectional Encoder Representations from Transformers (BERT)
Language-specific BERT models were used—dbmdz/bert-base-turkish-cased for Turkish and bert-base-uncased for English. Tweets were tokenized with the appropriate tokenizer and padded/truncated to a fixed maximum length. Fine-tuning employed fixed hyperparameters (
Table 7): learning rate 3 × 10
−5, batch size 16, epochs 4, weight decay 0.01. Fine-tuning used fixed hyperparameters; early stopping was triggered by a lack of improvement in validation loss (patience = 1) evaluated on the training/validation folds, and the final model was refit on train + validation and evaluated once on the held-out, time-aware test set. Consistent with the ML baselines, we reported macro-F1, macro-AUPRC, accuracy, weighted precision/recall/F1, per-class precision/recall, confusion matrices, and ROC/PR curves on the held-out test set.
The strong performance of transformer-based models has been reported in studies conducted across various domains [
48,
49]. In the research, training stability was assessed via k-fold validation only on the training portion (TR: k = 5; EN: k = 3); final models were then refit on train + validation and evaluated once on the time-aware test set.
5.3. Label Sources and Evaluation Design
Two complementary targets were used:
Pseudo-label agreement: model performance against lexicon-derived automatic labels (used to create large-scale supervision).
Human-label accuracy: model performance against a human-annotated gold subset, with inter-annotator reliability summarized by Cohen’s κ (EN and TR).
This dual design separates alignment with lexicon heuristics from generalization to human judgments. To mitigate imbalance and prevent leakage, language-specific hygiene measures were adopted: time-aware splits for English and pre-defined leakage-safe splits for Turkish with duplicate removal; where timestamps were present, max (train date) ≤ min (test date) was enforced. A majority-class baseline was included. Reproducibility was ensured through fixed random seeds, documented library versions, label harmonization (Neg = 0, Neu = 1, Pos = 2), and standardized pre-processing (lowercasing; URL/@ removal; punctuation/symbol stripping).
6. Modeling Results
6.1. Modeling Results of Turkish Dataset Without Data Augmentation
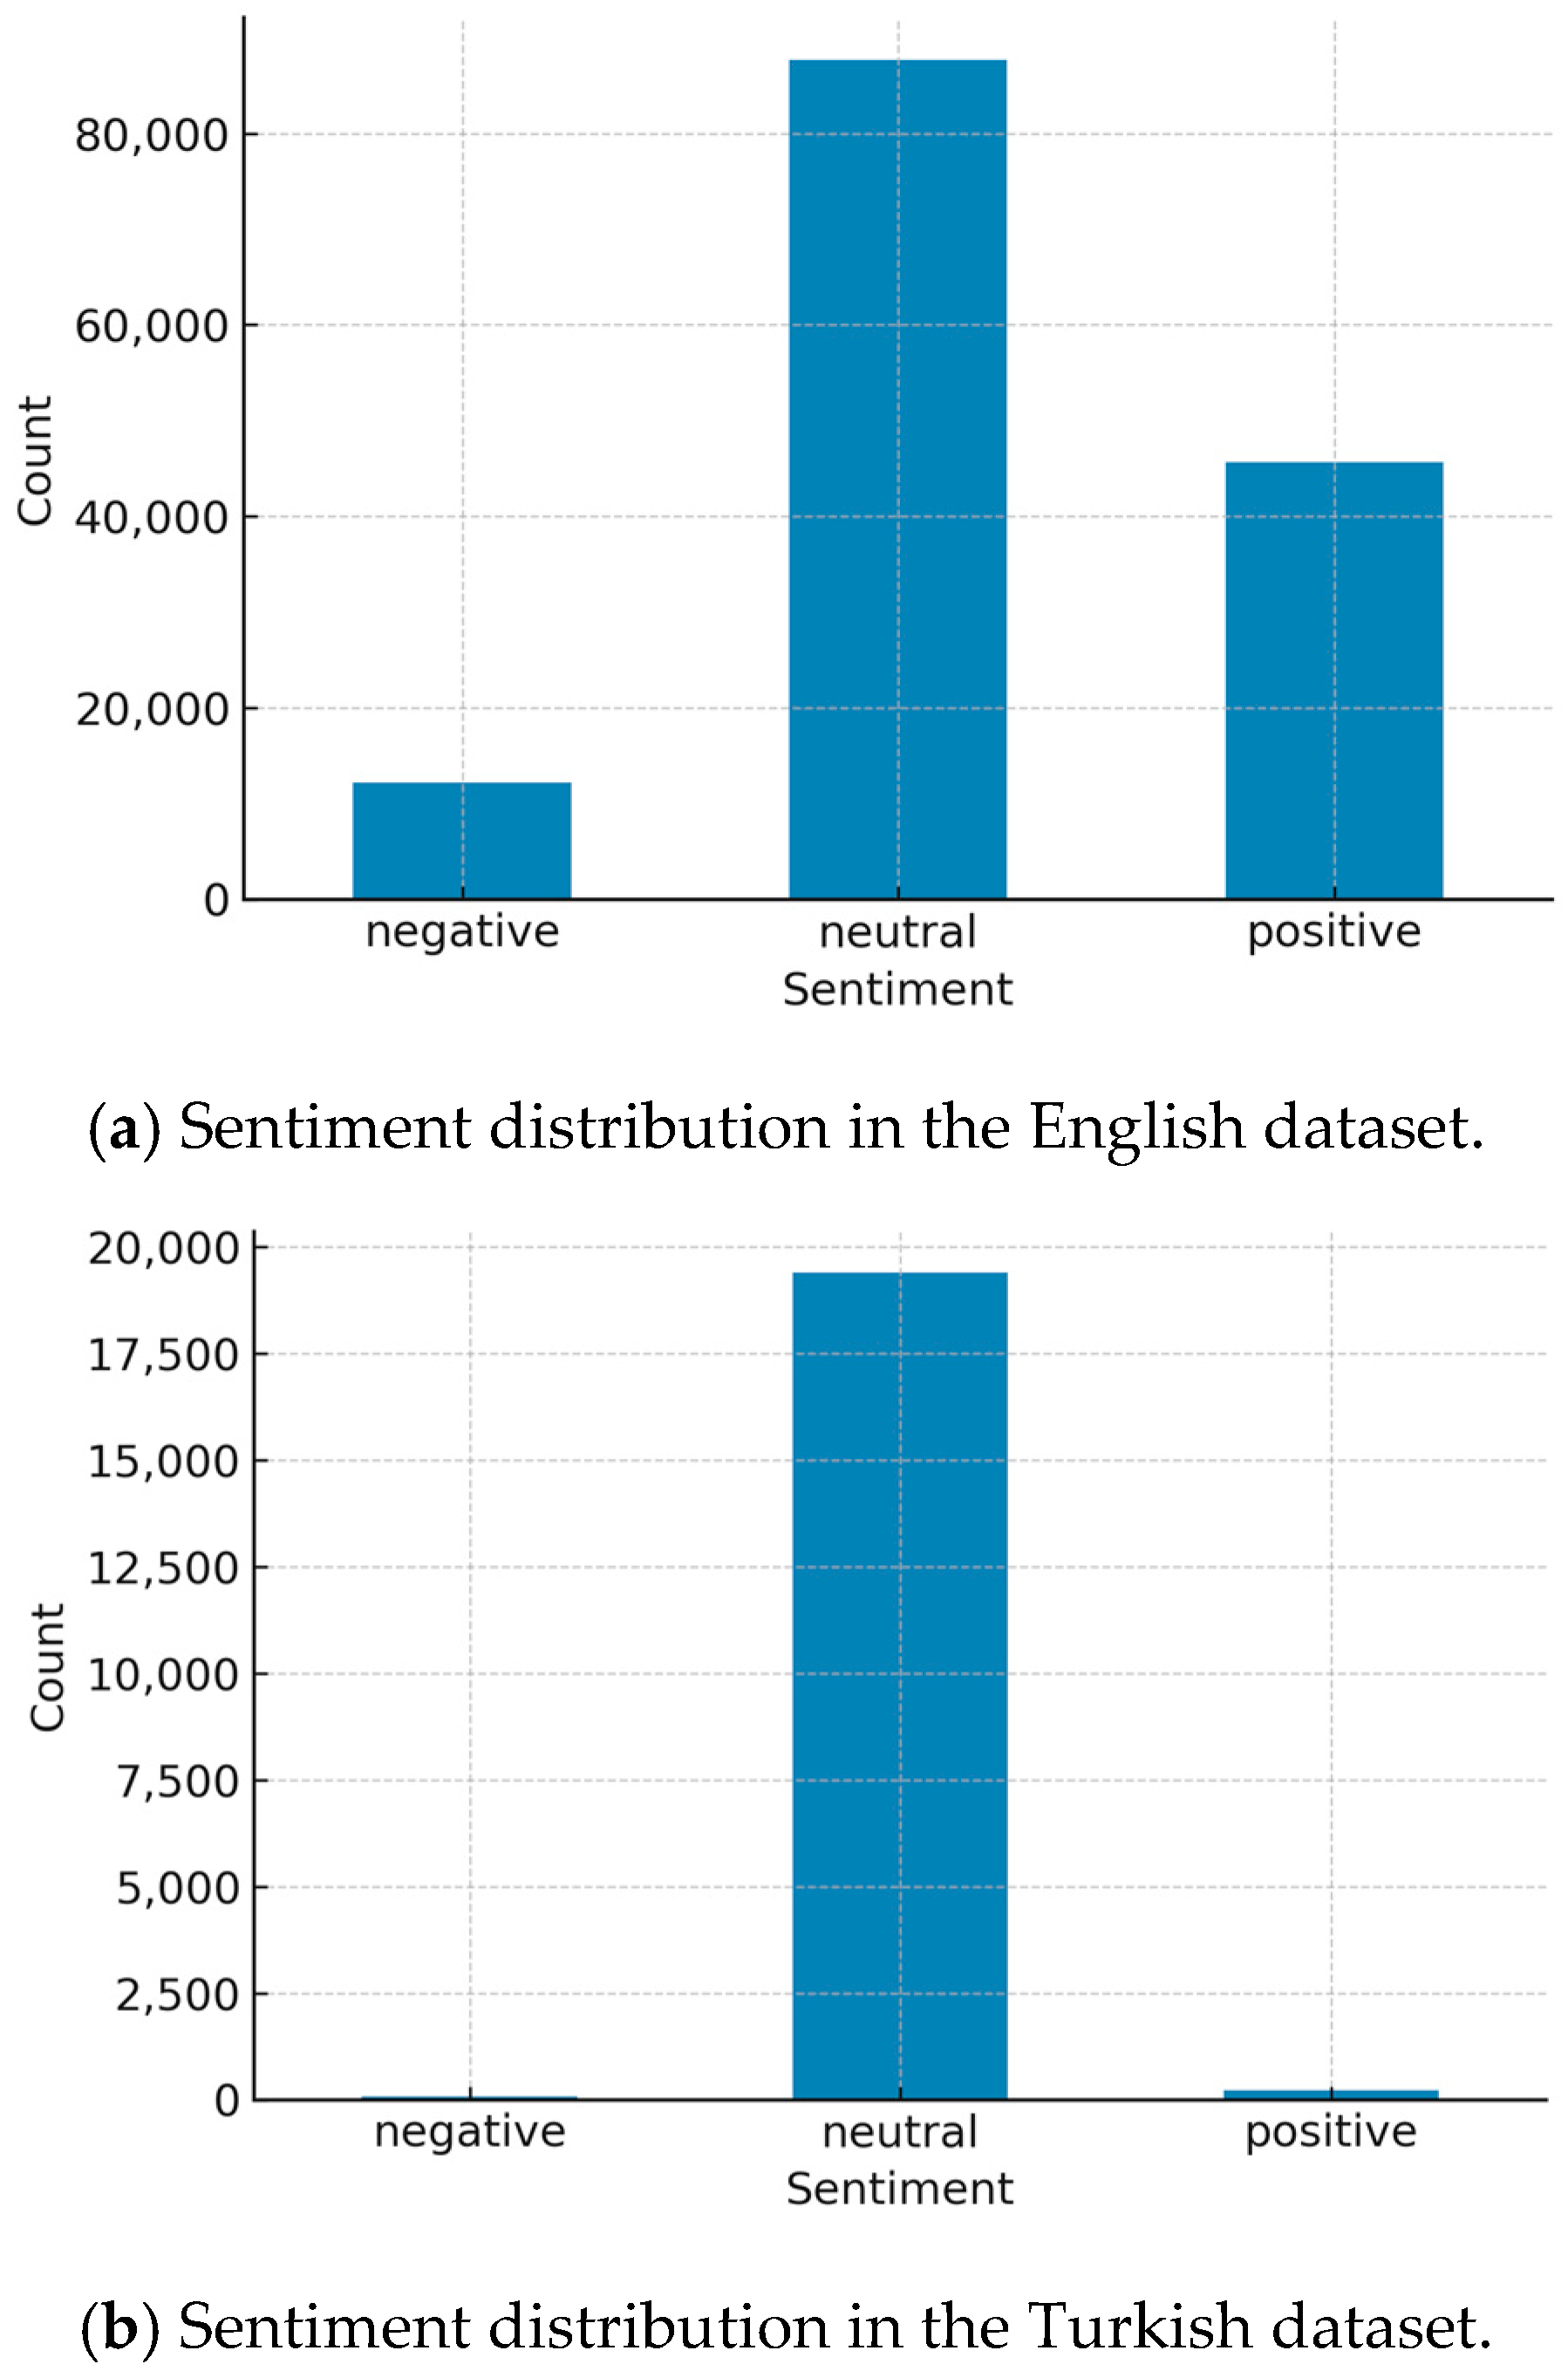
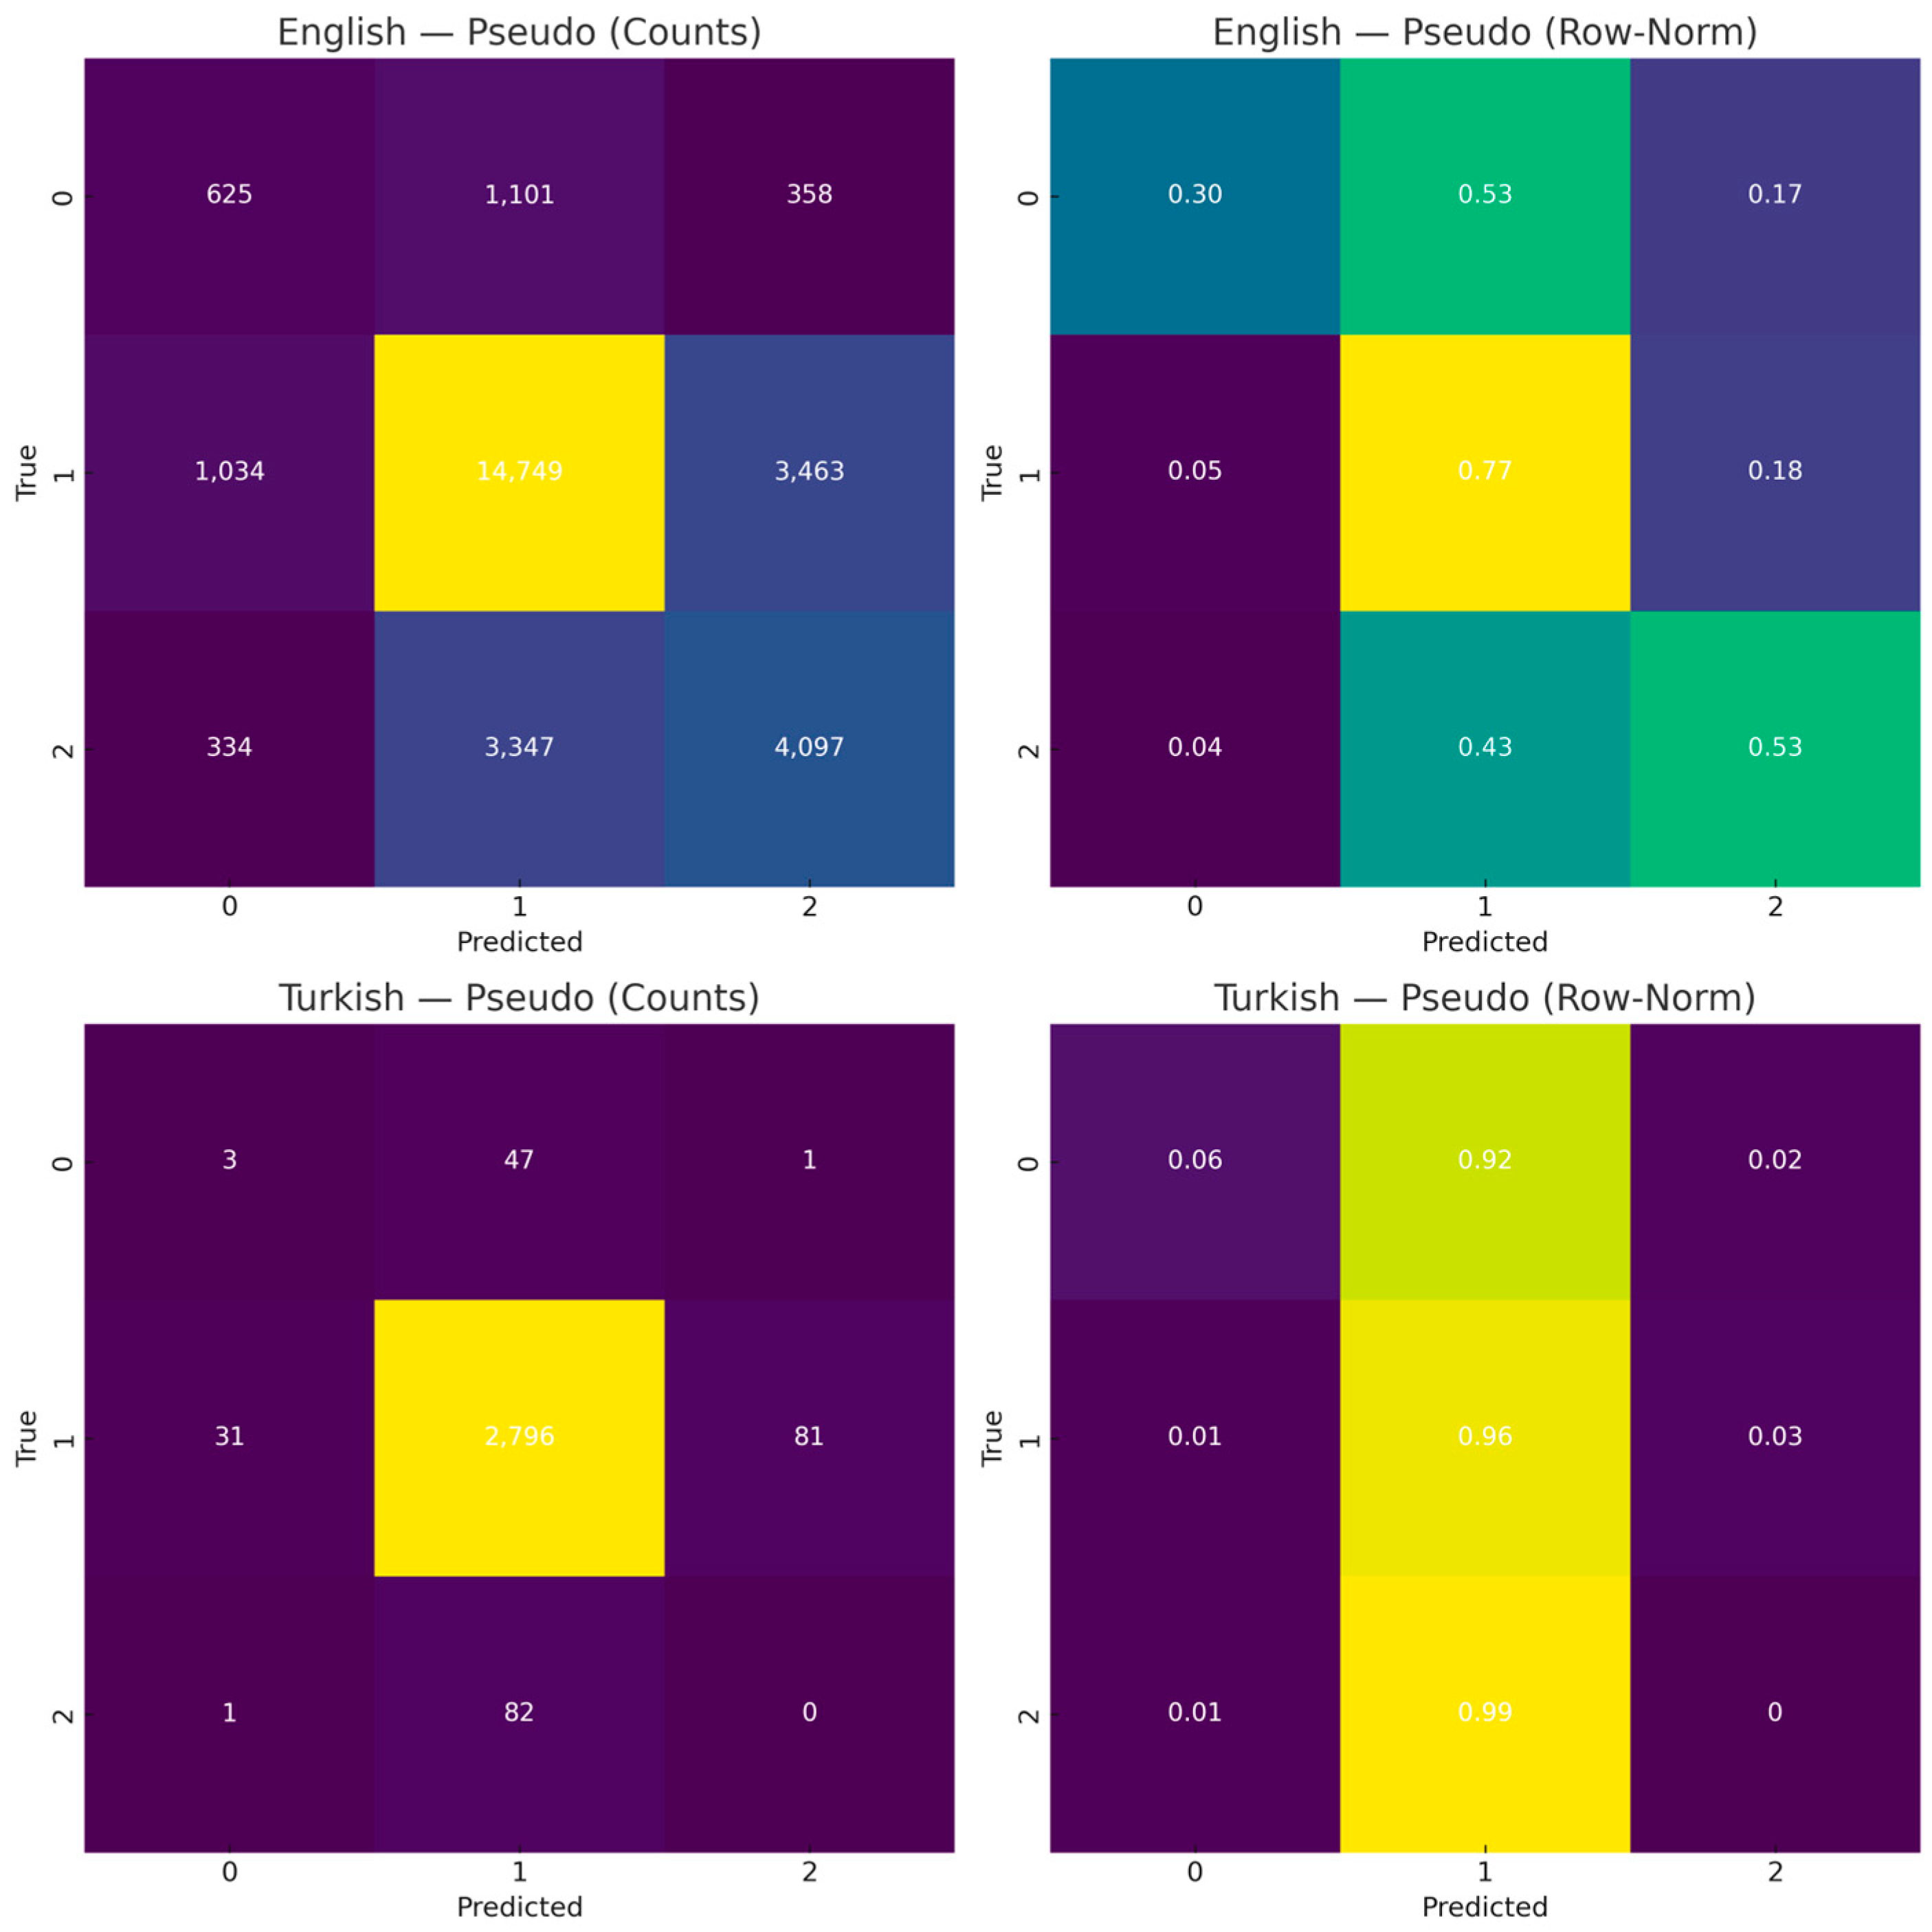
Multiple evaluation metrics were employed beyond simple accuracy to evaluate the sentiment classification performance on the Turkish dataset without data augmentation, including weighted and macro-averaged precision, recall, F1-score, and AUPRC, along with confusion matrices and ROC curves for each classifier. This comprehensive evaluation strategy addresses the class imbalance challenge in the dataset, where approximately 95% of the samples belong to the Neutral class. In contrast, the Positive and Negative classes are severely underrepresented. Relying solely on accuracy would risk inflating performance estimates due to this imbalance; hence, macro-level and per-class metrics were prioritized.
Both traditional ML models (LR, SVM, RF, NB) and a BERT-based model (dbmdz/bert-base-turkish-cased) were trained; model selection relied on stratified k-fold validation, and final performance was reported on the held-out test set. Early stopping and class-stratified folds were used to mitigate overfitting and to ensure reliable generalization to unseen samples.
Among traditional classifiers, RF attained the strongest overall test performance, followed by SVM and LR; NB lagged, particularly on minority classes. The BERT (dbmdz/bert-base-turkish-cased) model achieved the highest weighted F1 and Accuracy while also delivering competitive macro-F1 and macro-AUPRC, indicating improved capture of minority (Positive/Negative) tweets despite the imbalance.
Table 8 summarizes the performance metrics obtained on the non-augmented Turkish dataset. Among the traditional classifiers, RF achieved the highest accuracy and macro-F1, closely followed by SVM, whereas NB lagged, particularly in modeling minority classes. BERT yielded the highest overall weighted F1 (0.986) and accuracy (98.6%); notably, it also performed the strongest (or among the strongest) on macro-F1 (0.885) and macro-AUPRC (0.872), indicating superior sensitivity to minority classes. The per-class results highlight the core challenge: Neutral precision/recall exceeded 0.99 across all models; recall for the Negative and Positive classes was markedly lower (Negative ≈ 0.10–0.60; Positive ≈ 0.19–0.98). Consequently, the high overall accuracy primarily reflects the correct classification of Neutral tweets. This pattern is consistent with the observed class imbalance (see
Figure 9) and underscores the necessity of macro-level metrics for fair evaluation.
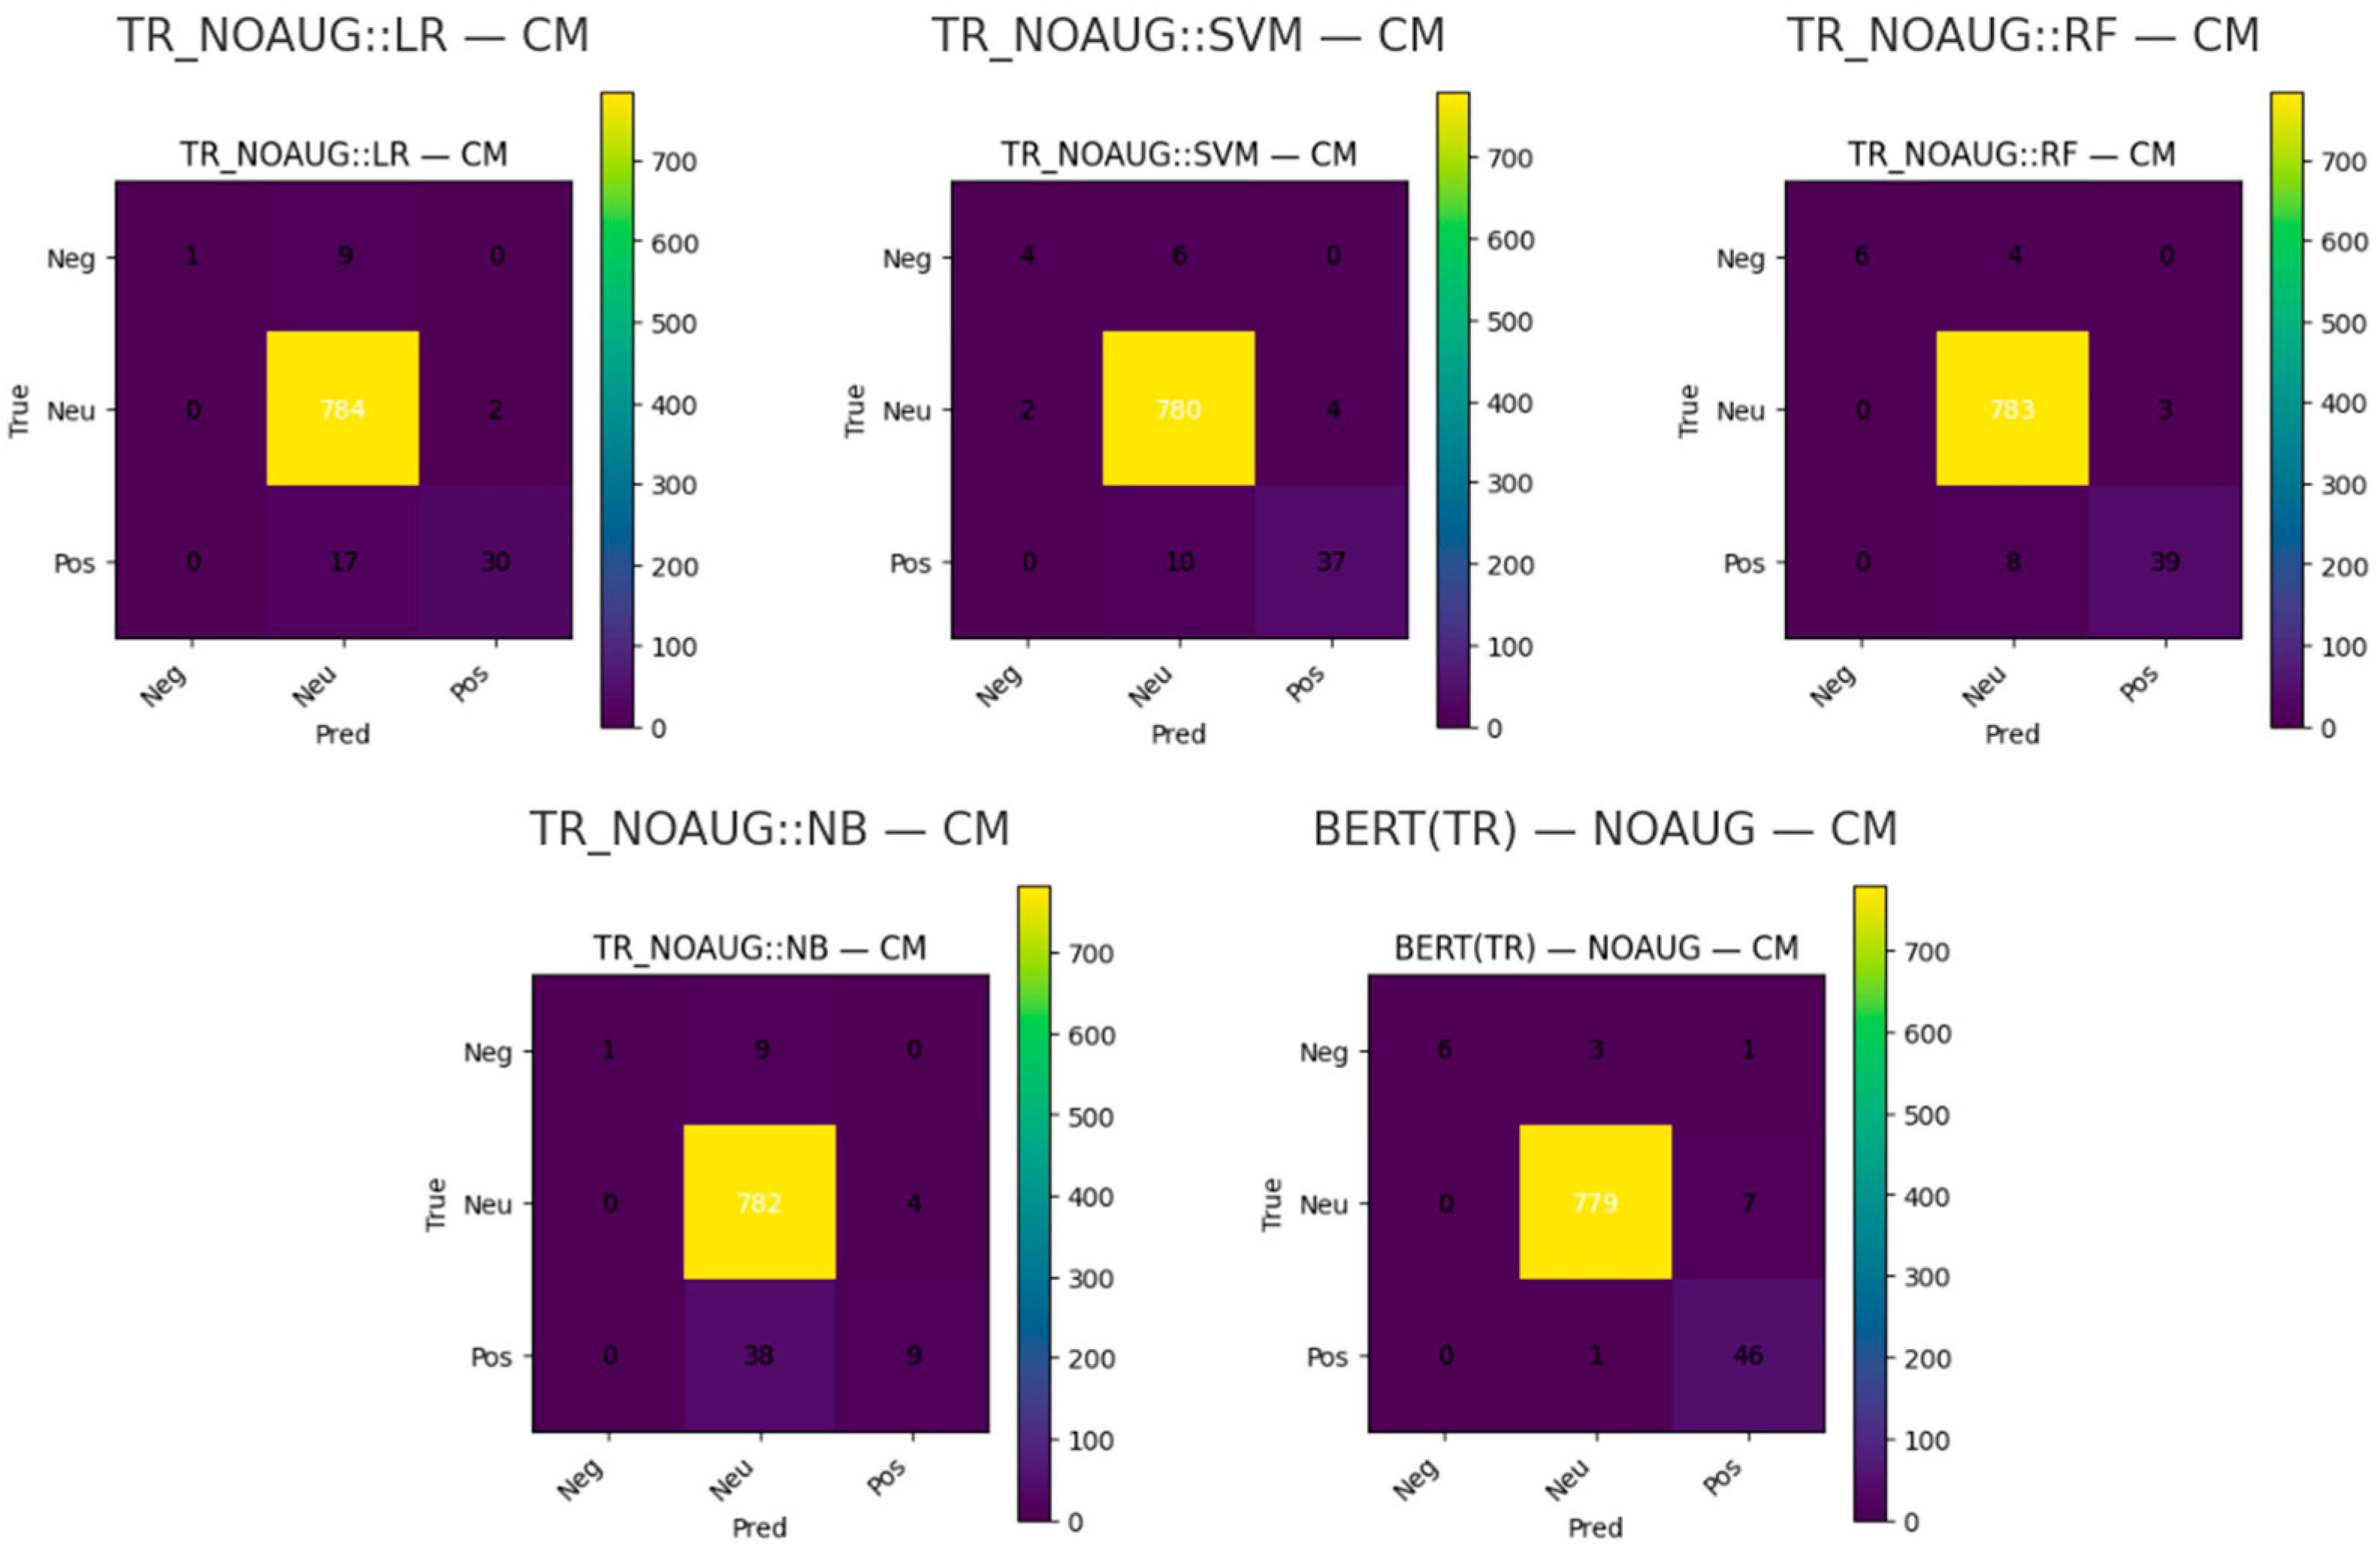
Figure 11 presents the confusion matrices for BERT and the traditional ML models on the Turkish non-augmented test set. The dominant neutral class is classified with near-perfect accuracy across models, whereas the Positive—and to a lesser extent the Negative—class remains challenging. RF exhibits the most balanced error distribution among the classical baselines, while NB most frequently collapses minority instances into Neutral. The BERT model reduces false negatives for the Positive class relative to the ML baselines; however, residual Positive–Neutral confusion persists, underscoring the impact of class imbalance on minority recall.
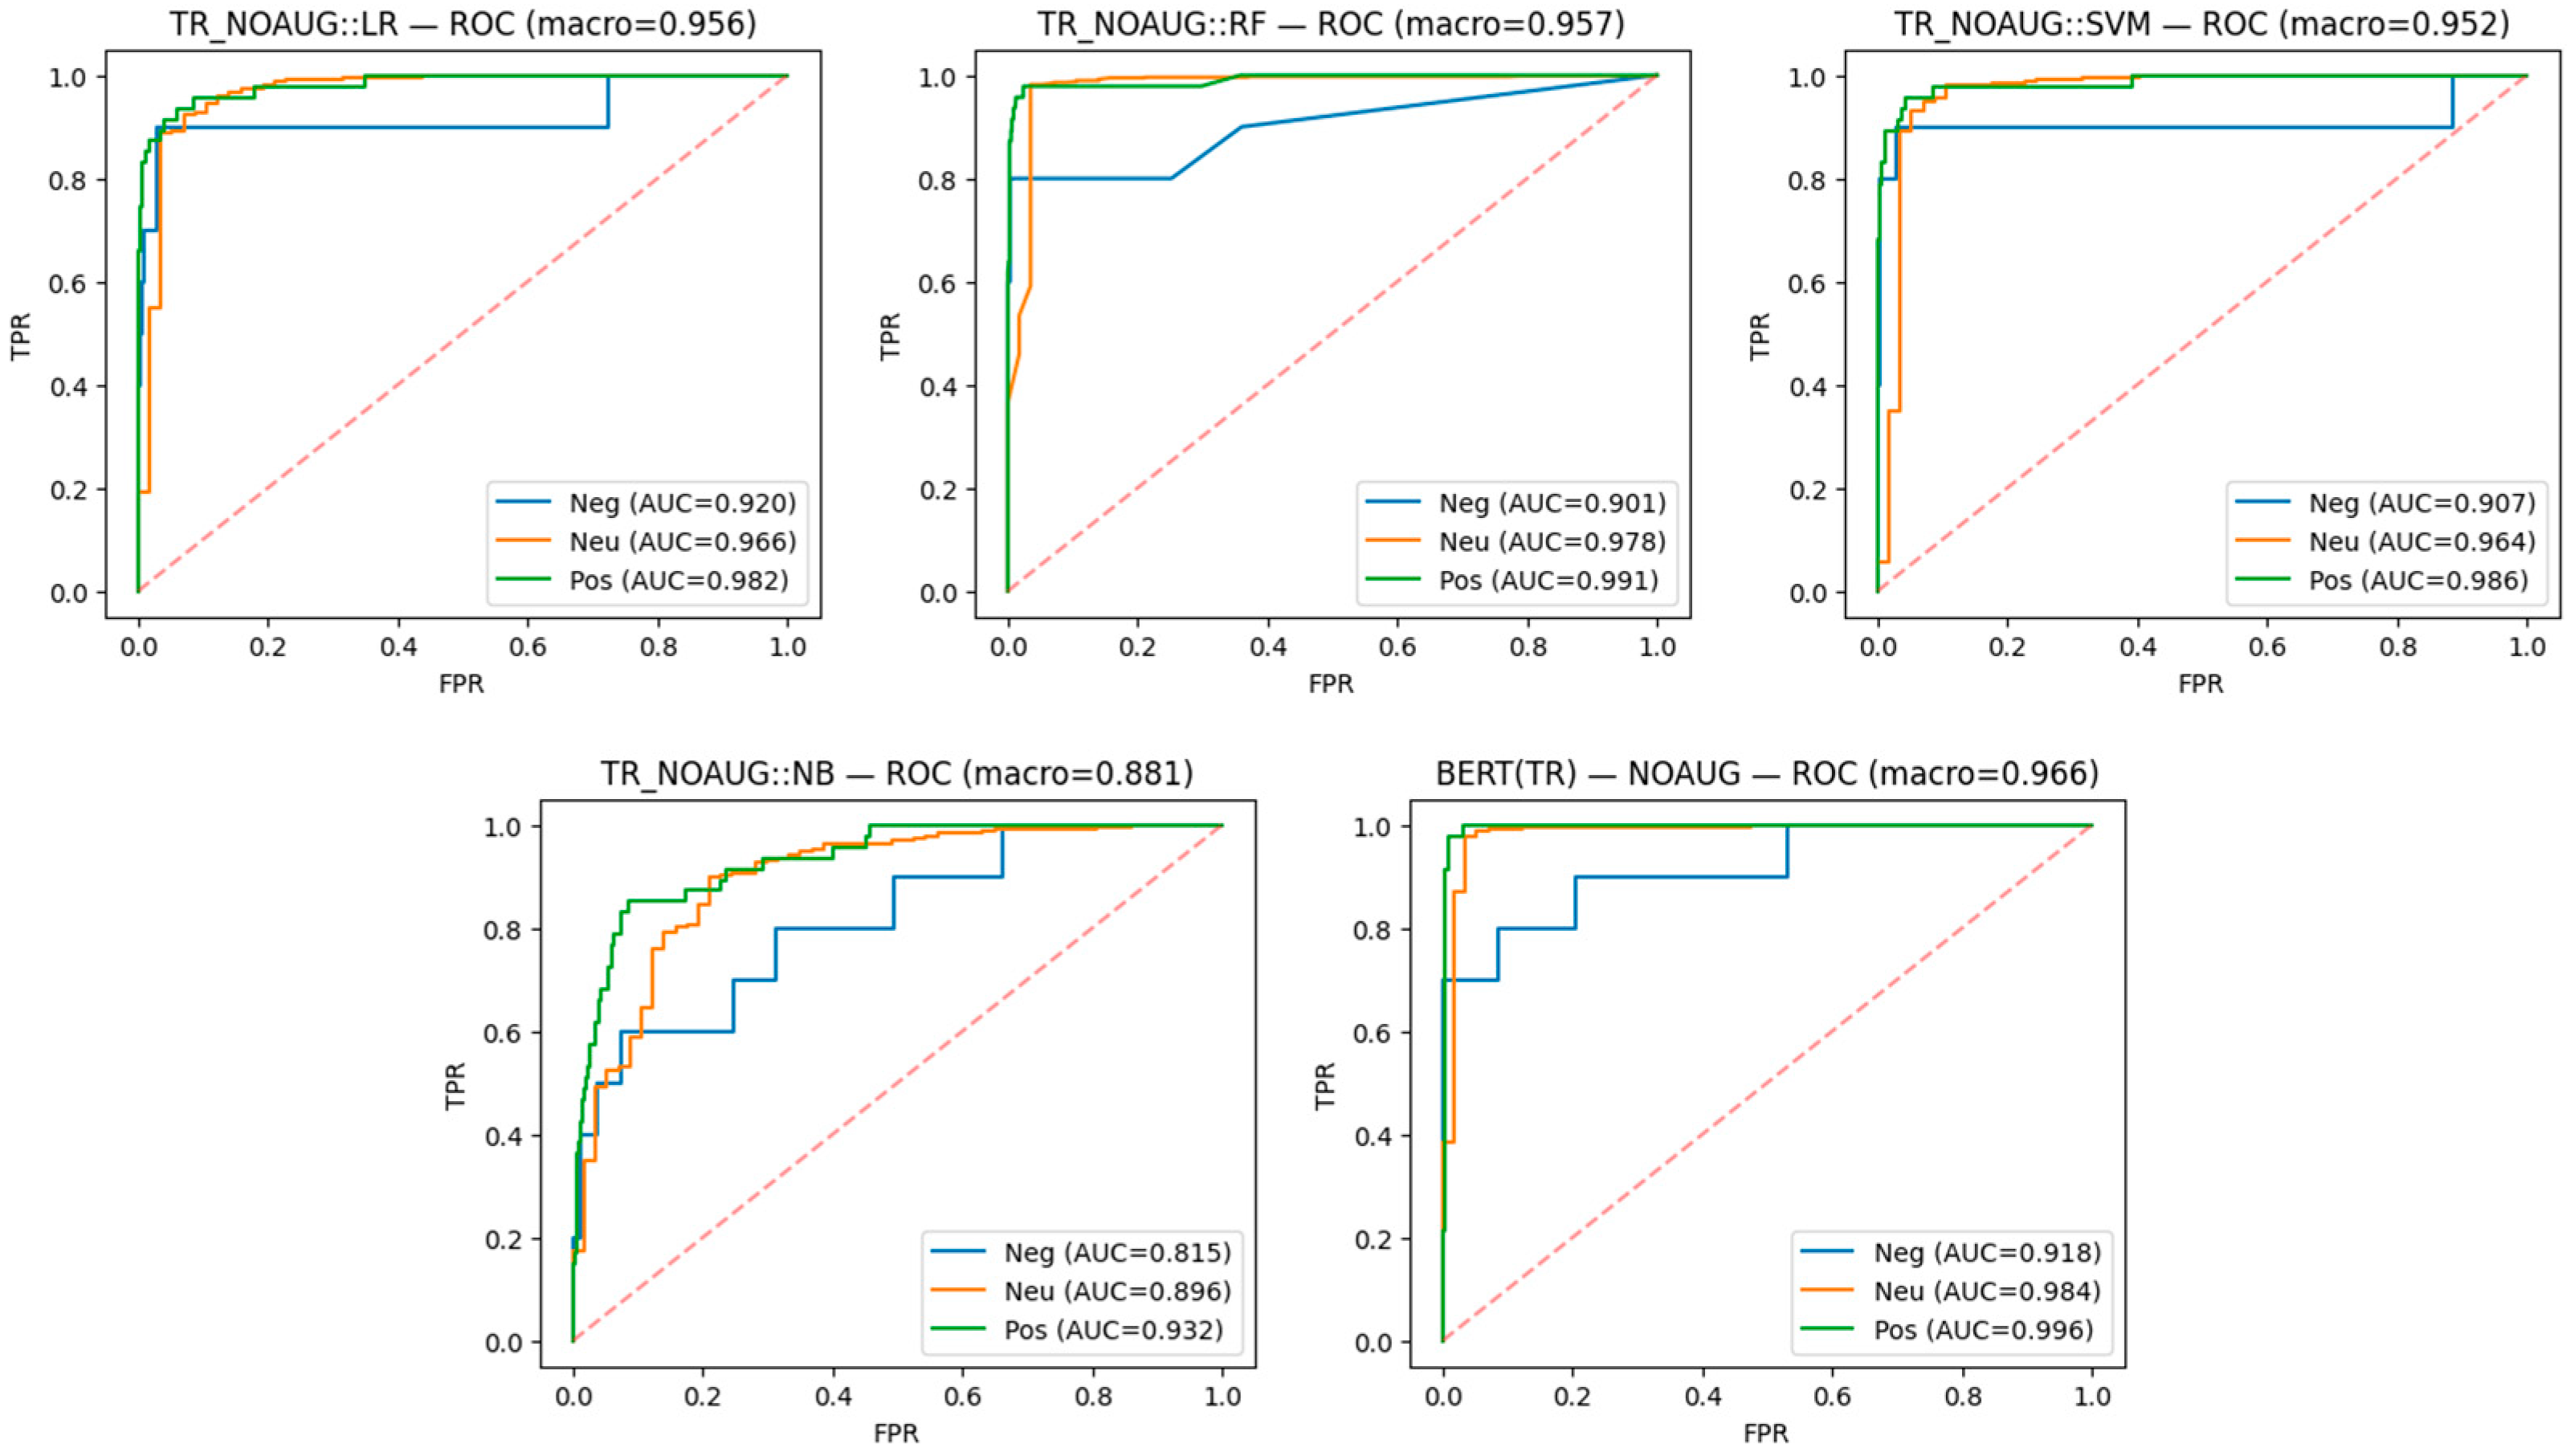
Figure 12 presents the ROC curves for BERT and the traditional ML models under the same non-augmented setting. Macro-averaged AUCs are the highest for BERT (≈0.966) and RF (≈0.957), followed closely by Logistic Regression (≈0.956) and SVM (≈0.952), with NB trailing (≈0.881). While very high separability is achieved for the Neutral class, lower curves for the Positive/Negative classes indicate that minority recall remains the principal bottleneck. Overall, BERT and RF deliver the strongest discrimination in this setting, whereas linear and generative baselines are more affected by the severe class imbalance.
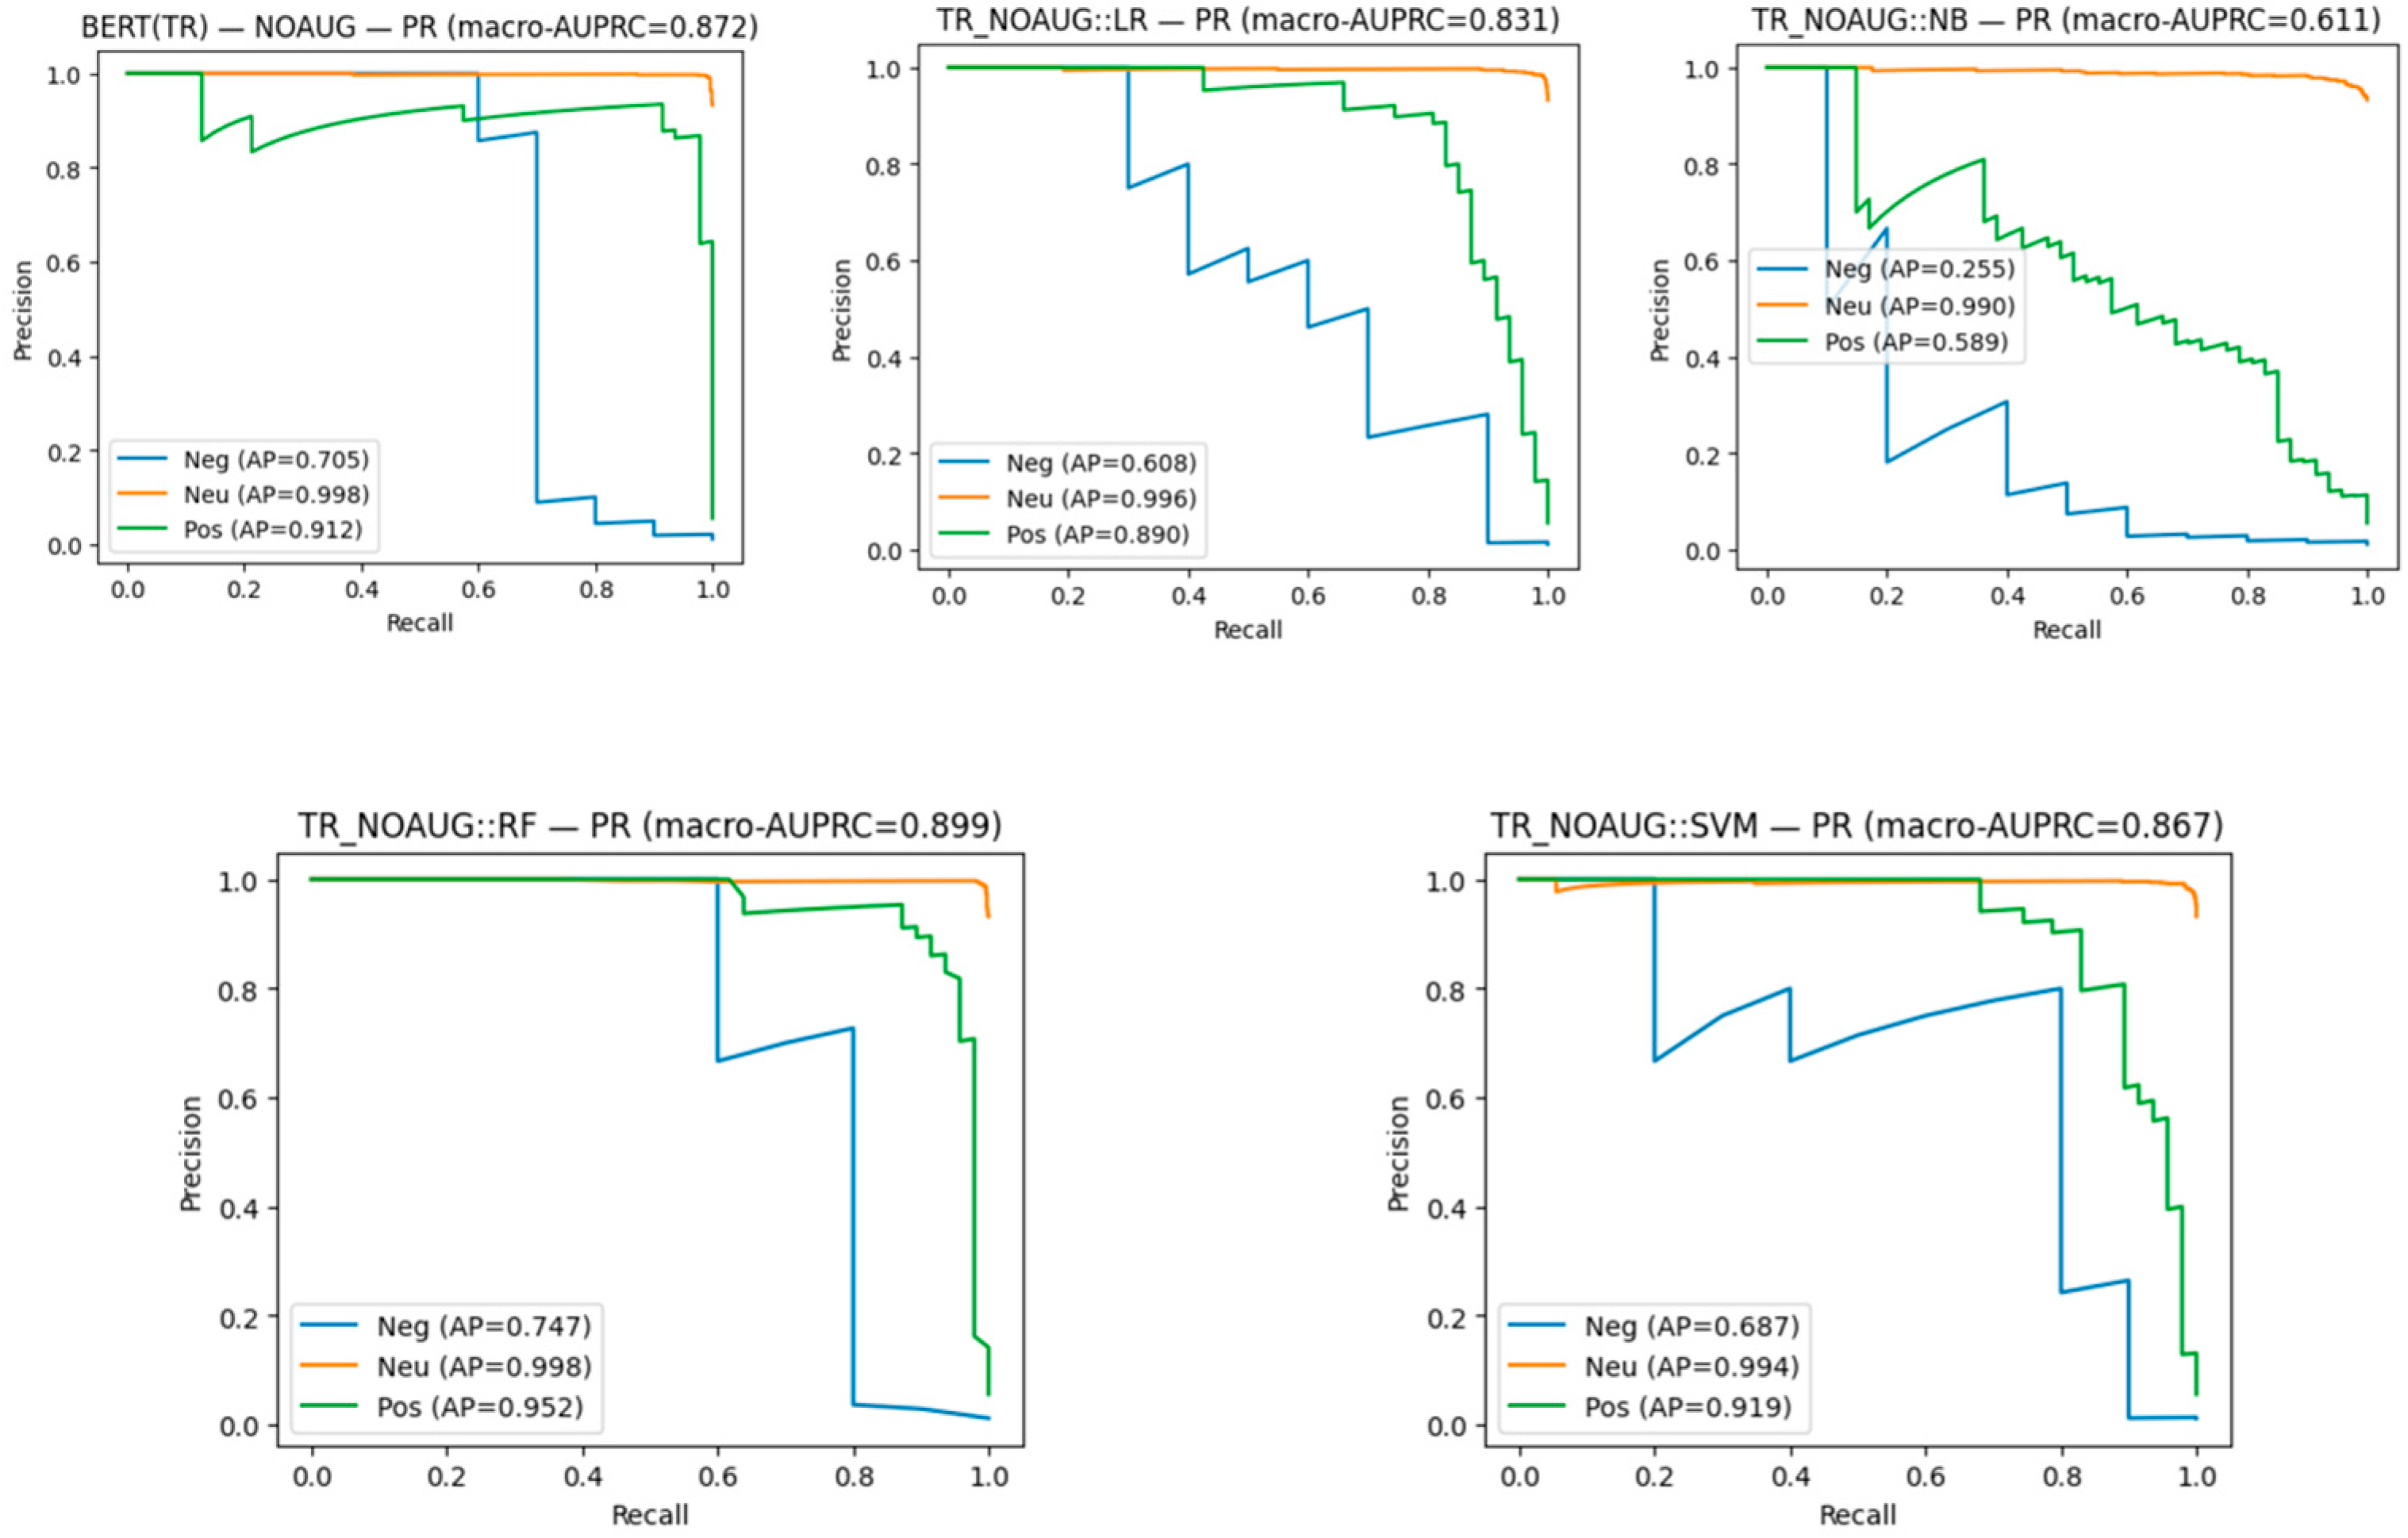
Figure 13 presents the class-wise precision–recall (PR) curves and macro-AUPRC scores on the time-aware test set. Multiclass (negative–neutral–positive) performance was computed under a one-vs-rest scheme and summarized by macro-AUPRC. In the Turkish, non-augmented setting, RF achieved the highest macro-AUPRC (0.899), followed by BERT (0.872) and SVM (0.867); LR and NB reached 0.831 and 0.611, respectively. Class-wise average precision (AP) indicated that the neutral class was separated almost perfectly across models (BERT 0.998; LR 0.996; NB 0.990; RF 0.998; SVM 0.994). AP values for the positive class were also high (BERT 0.912; LR 0.890; NB 0.589; RF 0.952; SVM 0.919), whereas the negative class emerged as the most challenging (BERT 0.705; LR 0.608; NB 0.255; RF 0.747; SVM 0.687). These results show that PR curves provide a sensitive summary under class imbalance and that overall discrimination is the strongest for the RF/BERT/SVM models.
6.2. Modeling Results of Turkish Dataset with Data Augmentation
To evaluate sentiment classification on the augmented Turkish dataset, a comprehensive battery of metrics was reported beyond simple accuracy, including weighted and macro-averaged precision, recall, F1-score, AUPRC, and confusion matrices and ROC curves for each classifier. This design addresses the severe class imbalance (≈95% Neutral), for which accuracy alone would be inflated; accordingly, macro-level and per-class metrics were prioritized.
Both traditional ML models, LR, SVM, RF, NB, and a BERT-based model (dbmdz/bert-base-turkish-cased) were trained and evaluated with stratified k-fold cross-validation for model selection and a held-out test set for final reporting. Early stopping and class-stratified folds were used to limit overfitting.
Table 9 summarizes the results. Among ML baselines, RF and LR are the strongest; NB lags on minority classes. BERT attains the highest weighted F1 (0.987) and accuracy (98.7%) and—critically—the best macro-F1 (0.886) and macro-AUPRC (0.904), indicating superior sensitivity to minority sentiments. Per-class outcomes show near-perfect Neutral performance but substantially lower recalls for Negative and Positive, reinforcing the need for macro-averaged metrics.
Figure 14 presents the confusion matrices for BERT and the four traditional ML classifiers on the augmented Turkish, time-aware test set. A consistent pattern is observed across models: near-perfect recognition is achieved for the majority Neutral class, whereas Positive and Negative remain comparatively difficult. Among the ML baselines, RF exhibits the most balanced error distribution across minority classes, while NB most frequently collapses predictions into Neutral. BERT reduces false negatives for Positive relative to the ML baselines, yet a residual Positive–Neutral confusion persists. These outcomes indicate that the dominance of Neutral instances largely drives the apparent high accuracies and that minority-class recall remains the limiting factor.
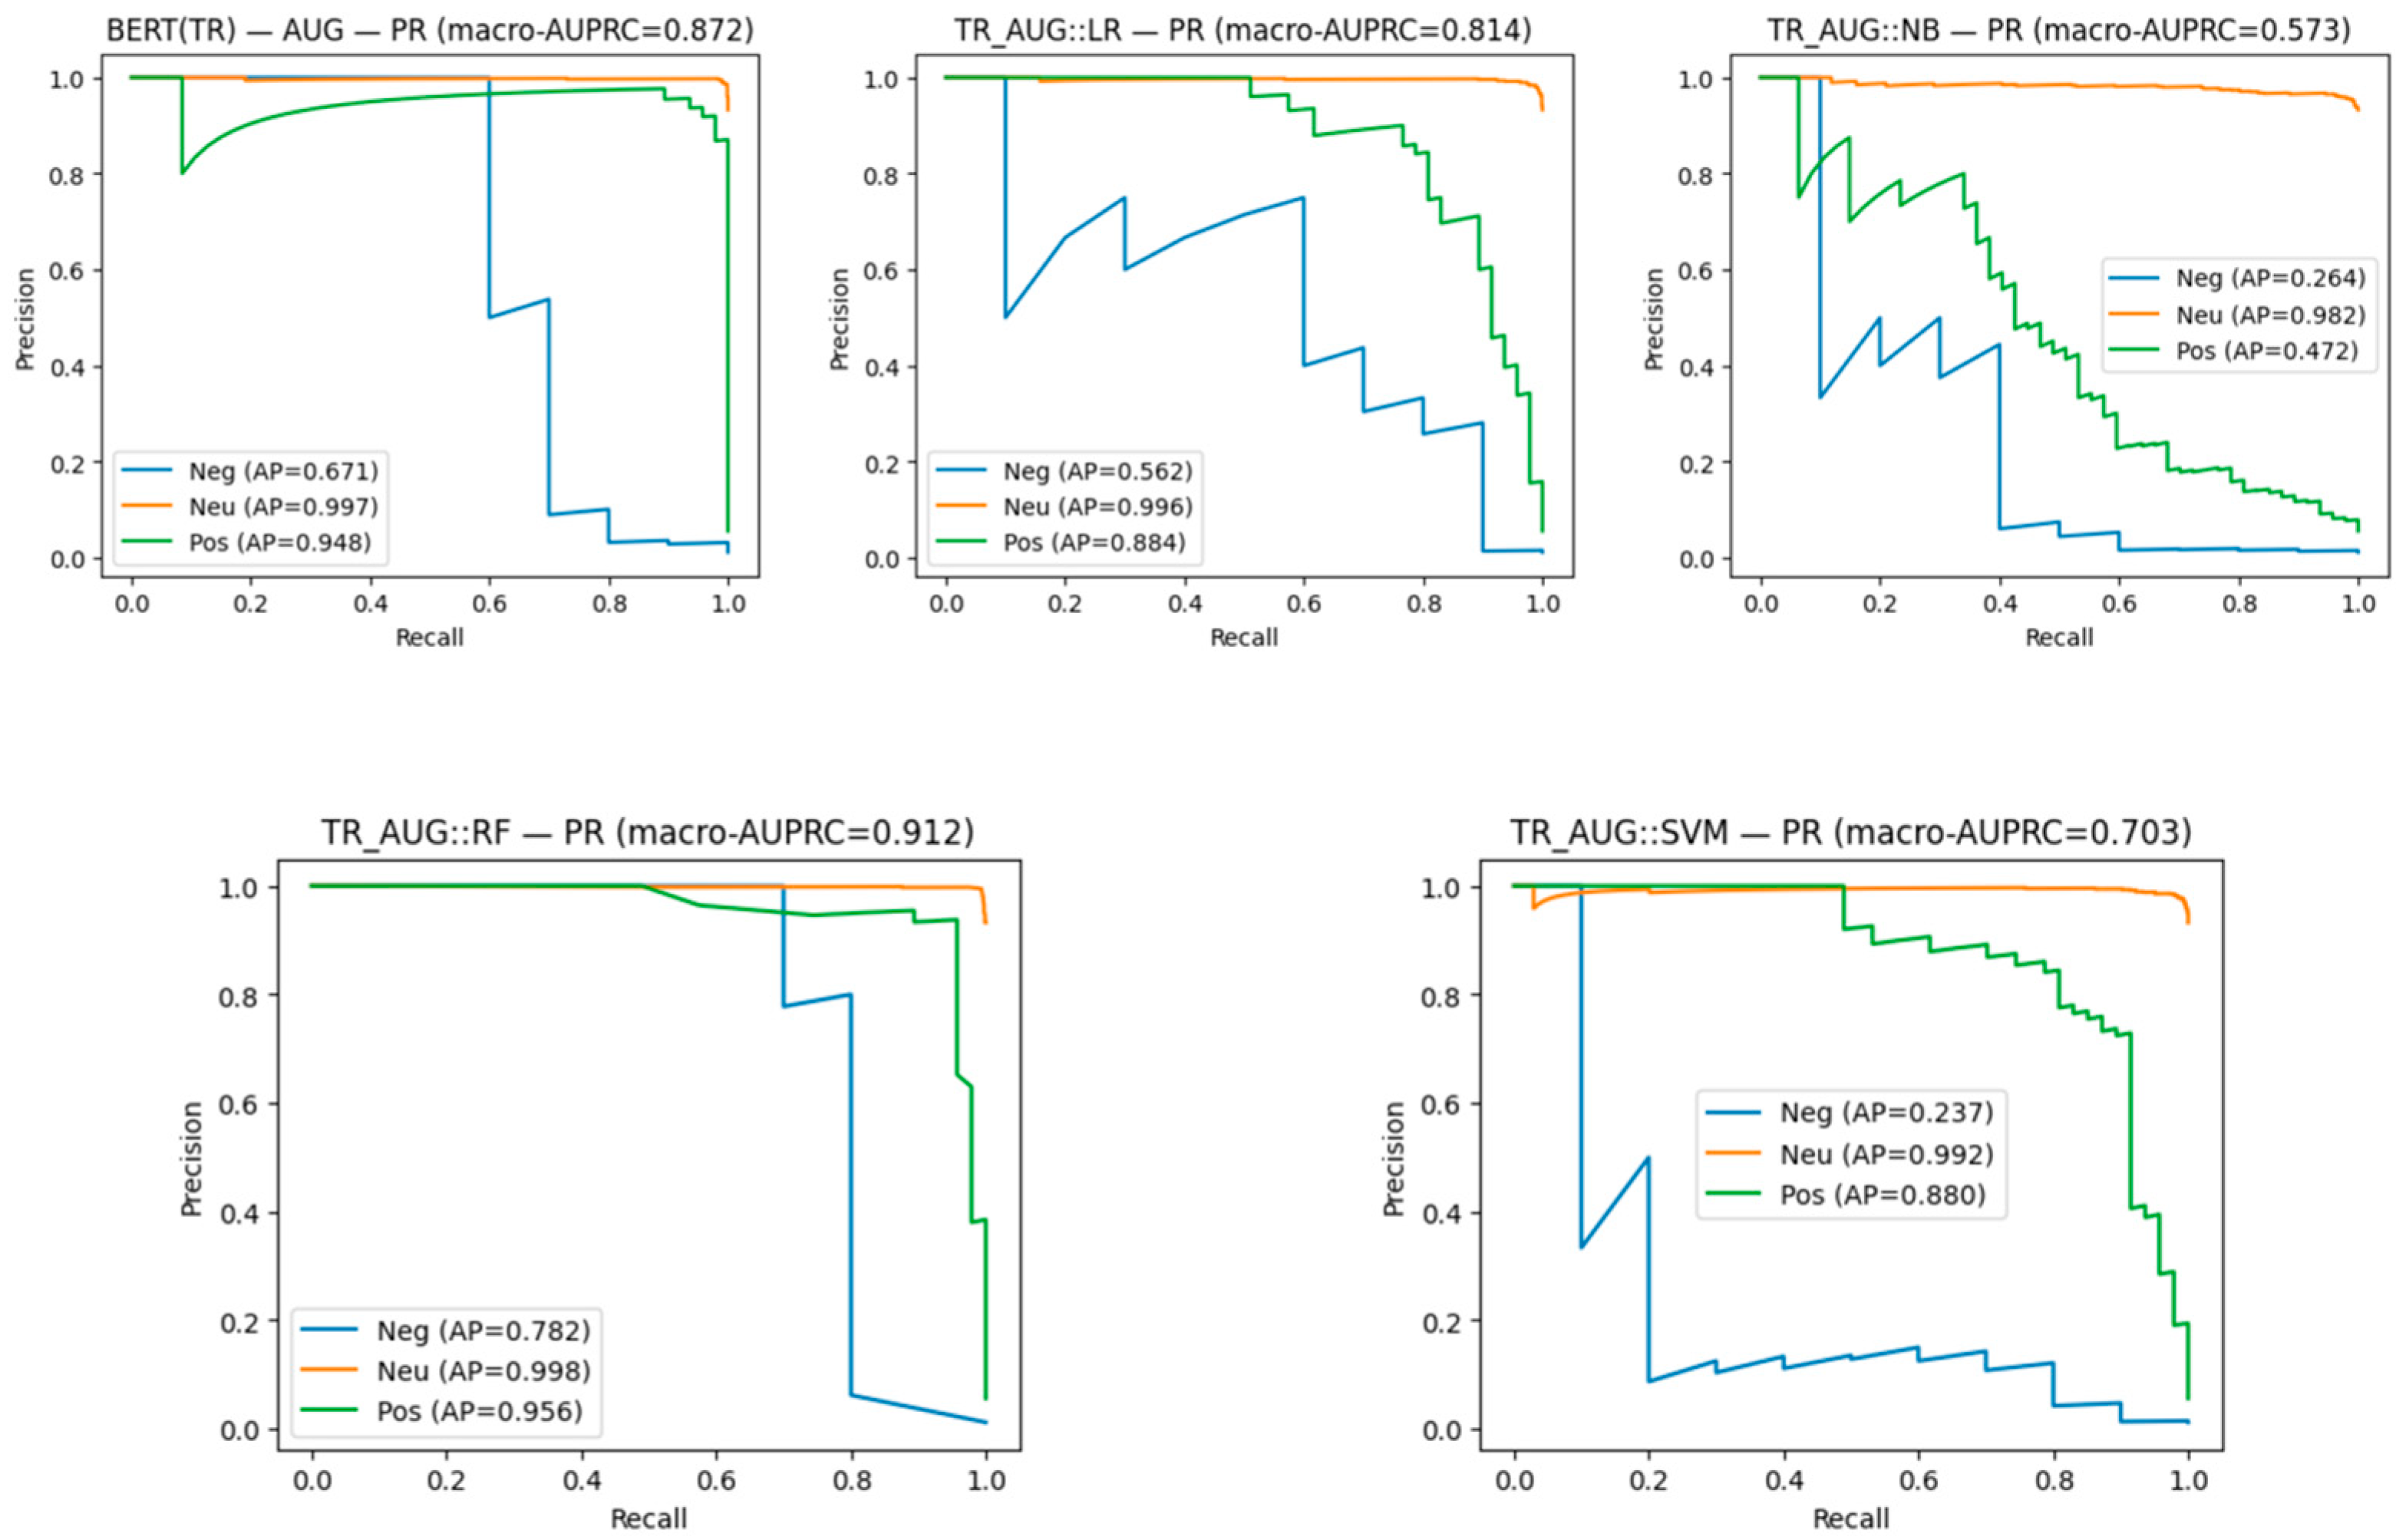
Figure 15 reports class-wise PR curves together with macro-AUPRC. In macro terms, BERT (≈0.87) and RF (≈0.91) occupy the top tier, followed by LR (≈0.81) and SVM (≈0.70), with NB trailing (≈0.57). Per-class curves show that the Positive class attains the largest areas under PR for BERT and RF, whereas the Negative class remains the most challenging across models. Because PR emphasizes performance at low prevalence, these results provide a more faithful assessment under severe imbalance than accuracy alone and corroborate the confusion-matrix patterns.
Figure 16 displays ROC curves for all models. High discriminative ability is maintained overall, with macro-AUC approximately 0.97 for BERT, 0.96 for LR, 0.95 for RF, 0.94 for SVM, and 0.82 for NB. While LR and SVM appear competitive by ROC, their minority-class behavior remains weaker when judged by PR and confusion matrices—underscoring that ROC can overstate performance under extreme class skew. BERT’s advantage is plausibly attributable to its contextual representations, which better capture nuanced sentiment expressions; nevertheless, the remaining gap in minority-class recall indicates an intrinsic effect of imbalance rather than overfitting.
6.3. Modeling Results of English Dataset (Time-Aware Split)
Under the time-aware, leakage-free split (early → late), all models exhibited modest out-of-time generalization with clear effects of class imbalance. BERT achieved 64.07% accuracy on the held-out test set but collapsed to the majority (Positive) class (Recall_Pos = 1.00, Recall_Neg = 0.00), yielding macro-F1 ≈ 0.39 and macro-AUPRC ≈ 0.51. Among the classical baselines, LR, RF, NB, and SVM reached broadly similar accuracies—63.56%, 62.96%, 63.44%, and 61.86%, respectively—with macro-F1 ≈ 0.45–0.46 and macro-AUPRC ≈ 0.50–0.54. The temporal test slice did not contain Neutral instances, which explains the uniformly zero Neutral recall and motivates an emphasis on macro-level metrics rather than accuracy alone.
To ensure comparability and computational feasibility, all English models were trained under a leakage-controlled protocol (early→late split; GridSearchCV with 3-fold stratification for ML). As detailed in Methods, SVM retained the pre-defined grid (C∈{0.1,1,10}, kernel∈{linear, rbf}) but disabled probability estimation; PR/ROC curves were derived from min-max-normalized decision_function scores, with cache_size = 2000 and max_iter = 2000. The search was restricted to the linear kernel for very large training sizes.
Internal cross-validation. Three-fold CV on train + validation confirmed the stability of these findings: k-fold accuracy ≈ 0.61–0.63 for the ML models (LR 0.6330; SVM 0.6094; RF 0.6284; NB 0.6343) and, for BERT, validation accuracy ≈ 0.64 with macro-F1 ≈ 0.39. Consistency across folds indicates that the principal limits arise from label skew and temporal/domain shift, not overfitting to a particular split.
Table 10 reports Accuracy, weighted Precision/Recall/F1, macro-F1, macro-AUPRC, per-class Precision/Recall, and k-fold accuracy (train + val).
Figure 17 (confusion matrices) shows a strong bias toward the Positive class across methods; BERT predicts every instance as Positive, and Negative recall remains low for all ML baselines.
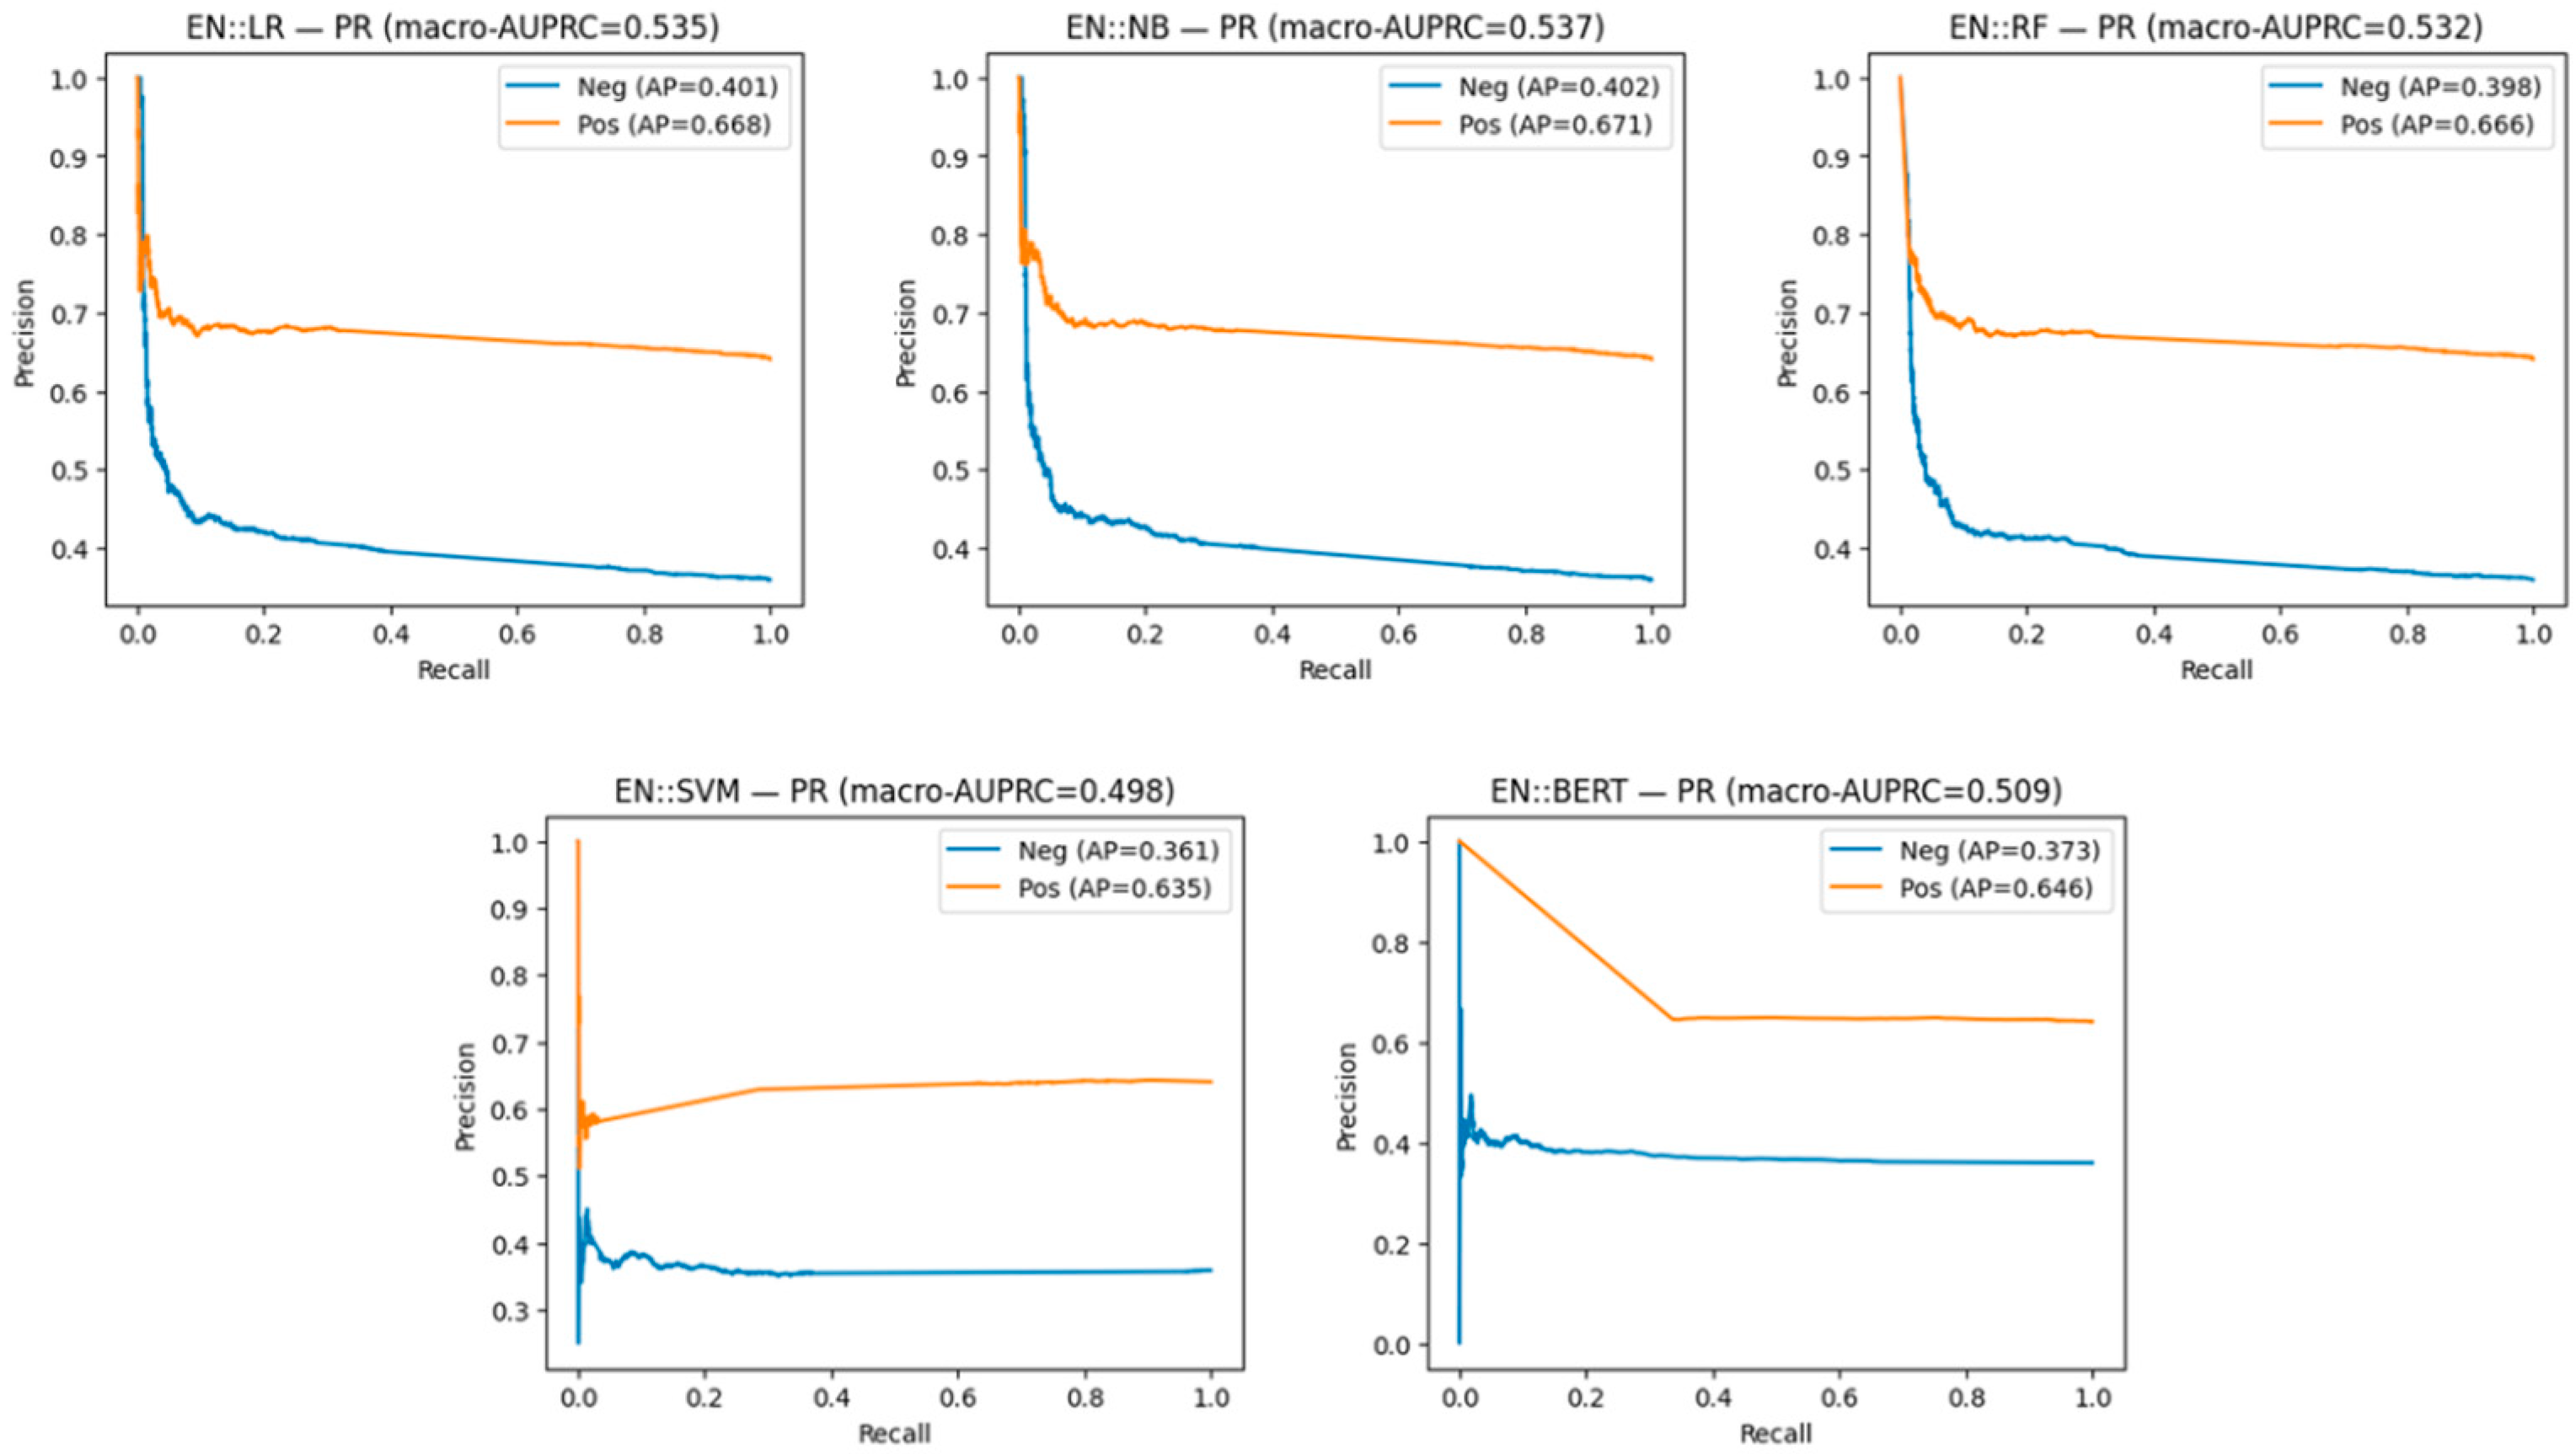
Figure 18 (class-wise PR) indicates macro-AUPRC near chance for all models (~0.50–0.54); average precision is consistently higher for Positive (≈0.64–0.67) than for Negative (≈0.36–0.40).
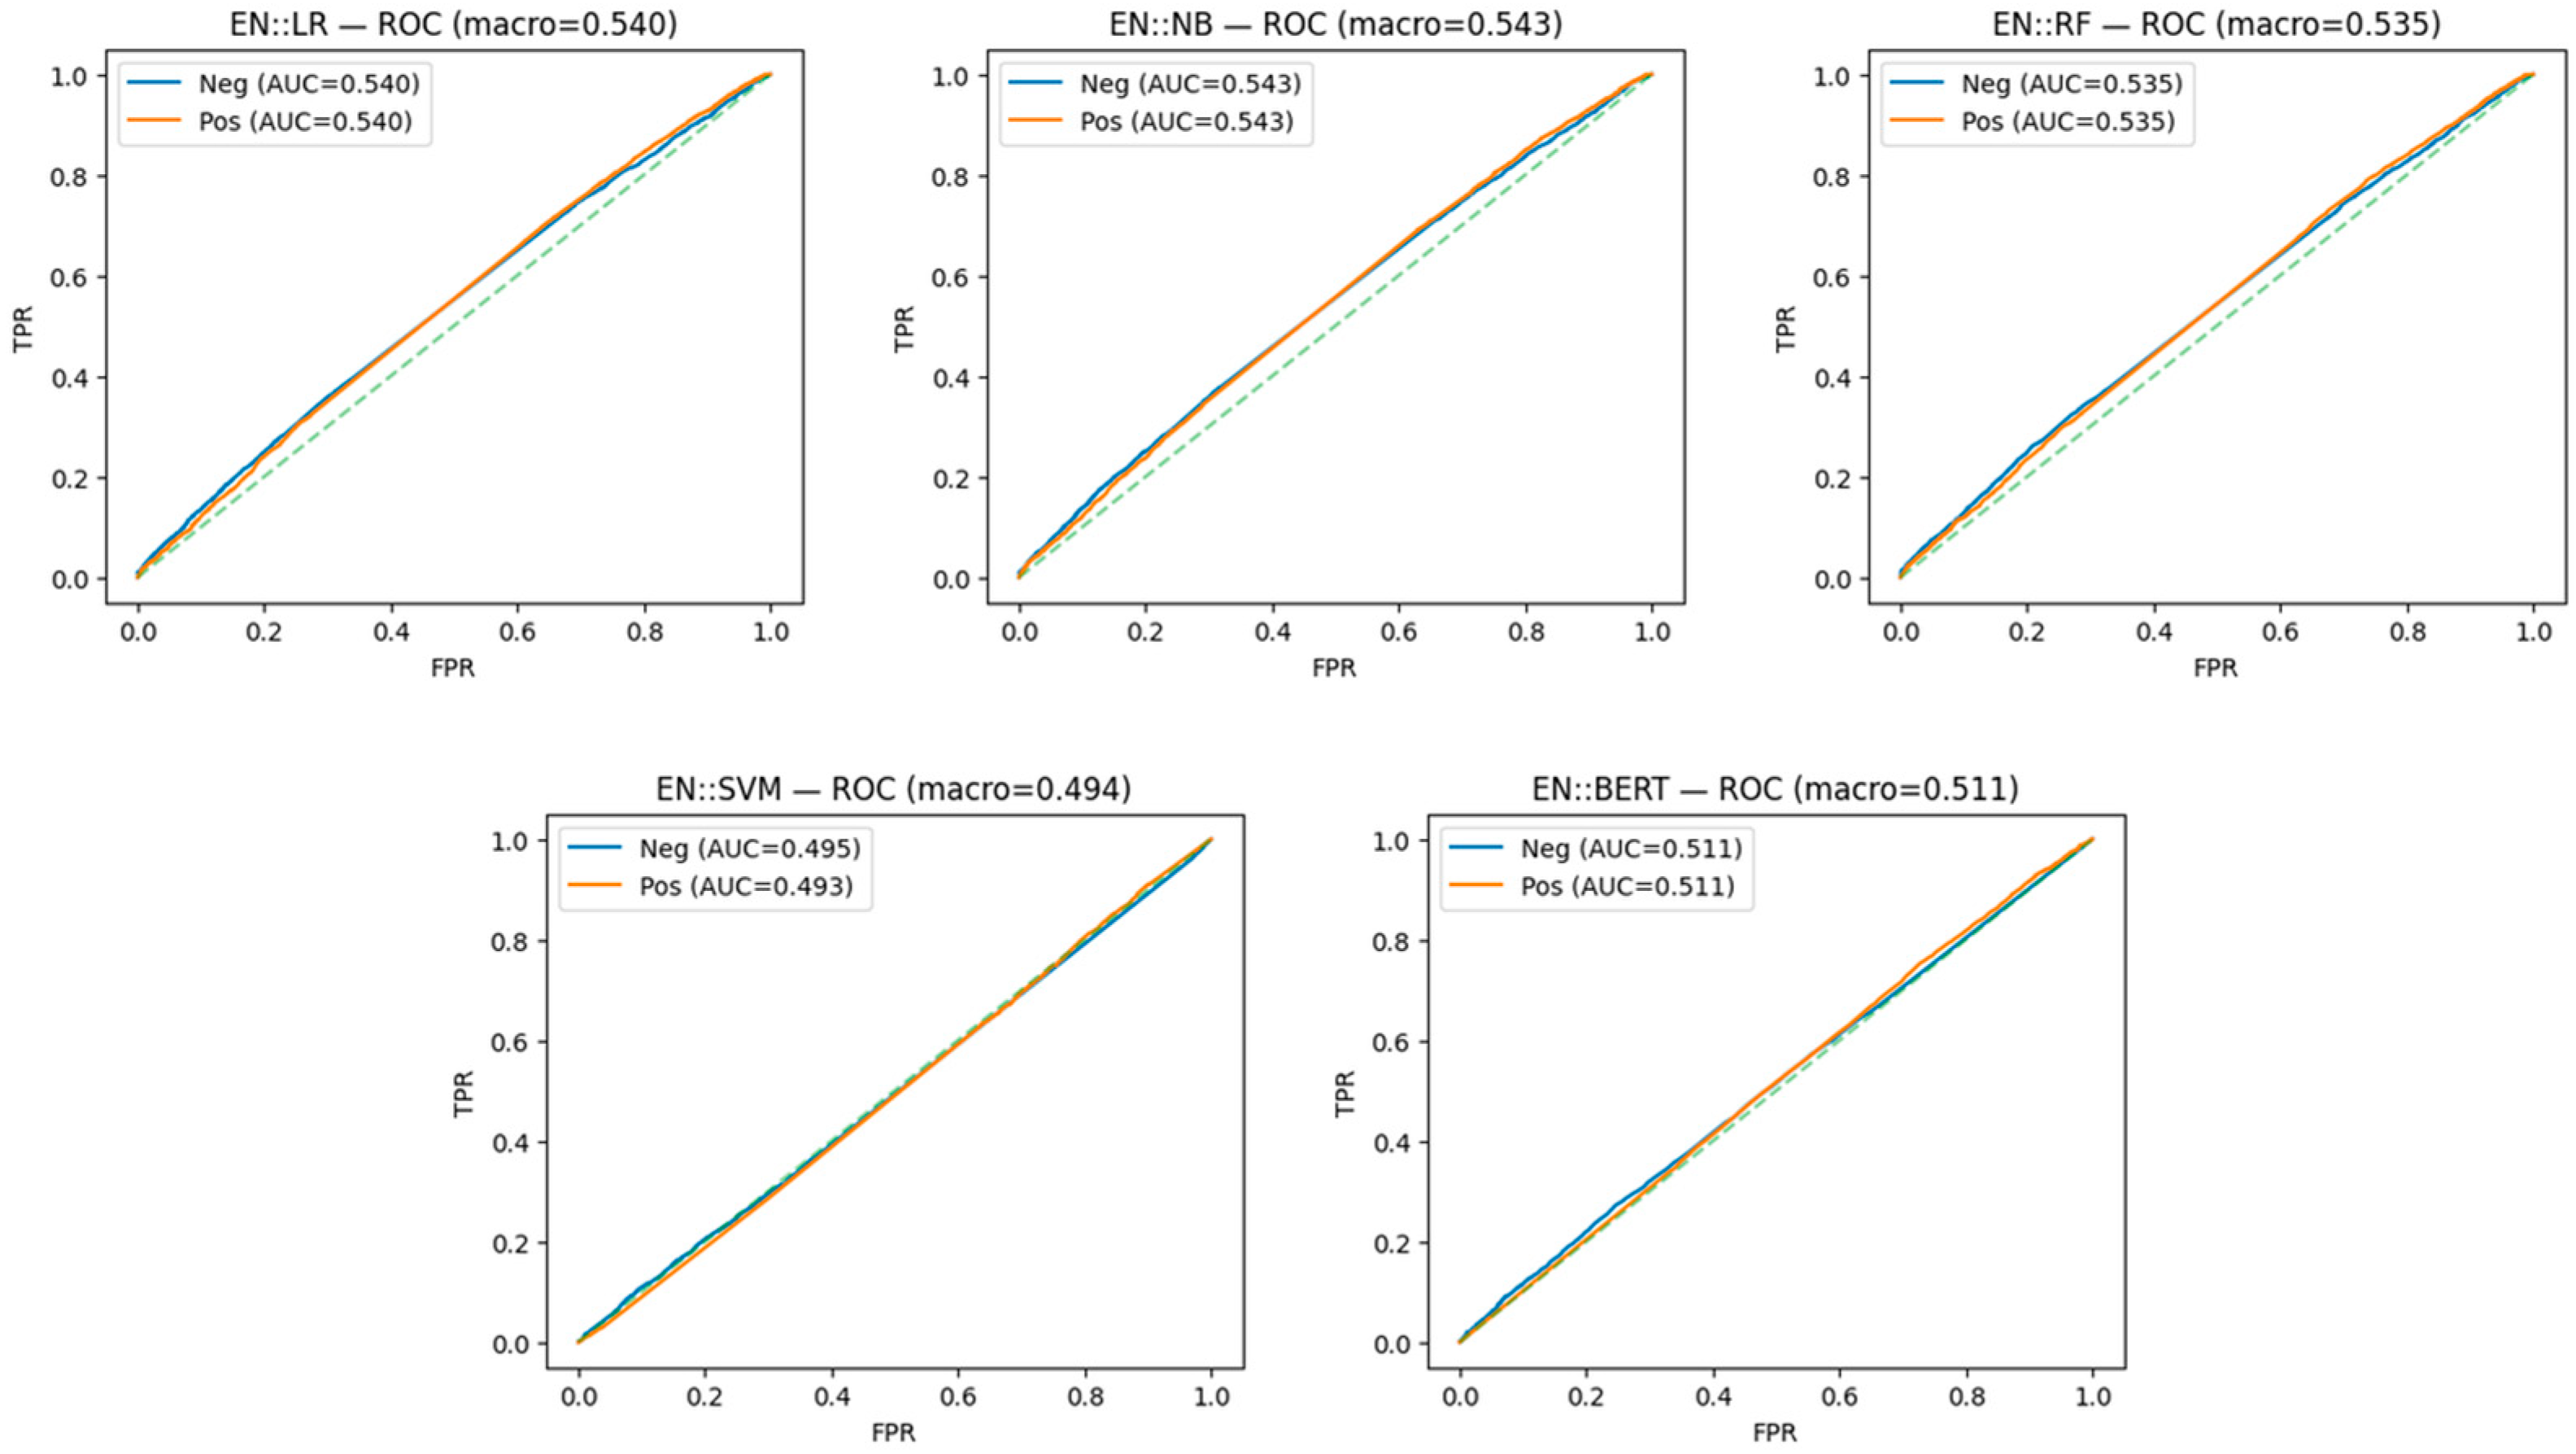
Figure 19 (ROC) shows macro-AUC values around 0.50 (LR 0.540; NB 0.543; RF 0.535; SVM 0.494; BERT 0.511), confirming limited separability under a realistic temporal holdout. The figure compares ROC curves for five models (LR, NB, RF, SVM, and BERT), with macro-AUC values ranging from 0.494 to 0.543. The green dashed line represents the random classifier baseline (AUC = 0.5) and is now explicitly included in the legend for clarity. Each subplot shows the ROC performance for the negative and positive sentiment classes under the time-aware evaluation setting.
In conclusion, the time-aware evaluation demonstrates that the high accuracy obtained with lexicon-derived labels does not generalize to real-world temporal holdouts. Accordingly, macro-F1/macro-AUPRC and class-wise diagnostics should accompany accuracy, and results on human-annotated gold data (when available) should be reported separately from pseudo-label agreement.
A human-annotated gold subset was analyzed with the same ML baselines and BERT to assess true ground-truth performance. Metrics on the gold set are reported separately from those based on the lexicon-scored file, distinguishing human-label accuracy from pseudo-label agreement and providing a more reliable estimate of practical utility.
7. Discussion
The dual evaluation strategy adopted in this study, comparing pseudo-label agreement with human-label accuracy, highlights critical insights for multilingual sentiment analysis in e-commerce contexts. While all models demonstrated strong capacity to replicate lexicon-derived labels, their generalization to human-annotated gold standards revealed substantial divergences, particularly for Turkish. This discrepancy underscores the limitations of lexicon-based approaches in morphologically rich and context-dependent languages, where implicit sentiment cues and cultural nuances challenge automated labeling.
From a methodological perspective, transformer-based deep learning models (BERT) consistently outperformed classical machine learning baselines on macro-level metrics, especially in the Turkish dataset. In the Turkish experiments, conservative, leakage-safe data augmentation improved class balance and linguistic diversity, yet minority-class recall remained the limiting factor despite high overall accuracy. These findings align with prior evidence that contextualized models excel at capturing nuanced expressions but confirm that extreme class imbalance in real-world corpora continues to pose challenges.
In contrast, the English dataset demonstrated closer alignment between lexicon and human-labeled evaluations, albeit with temporal drift reducing out-of-time generalization. The time-aware splits revealed that models often collapsed toward the majority (positive) class, producing inflated accuracy but weaker macro-F1. This suggests that multilingual and temporal robustness requires complementary validation strategies that move beyond aggregate performance reporting.
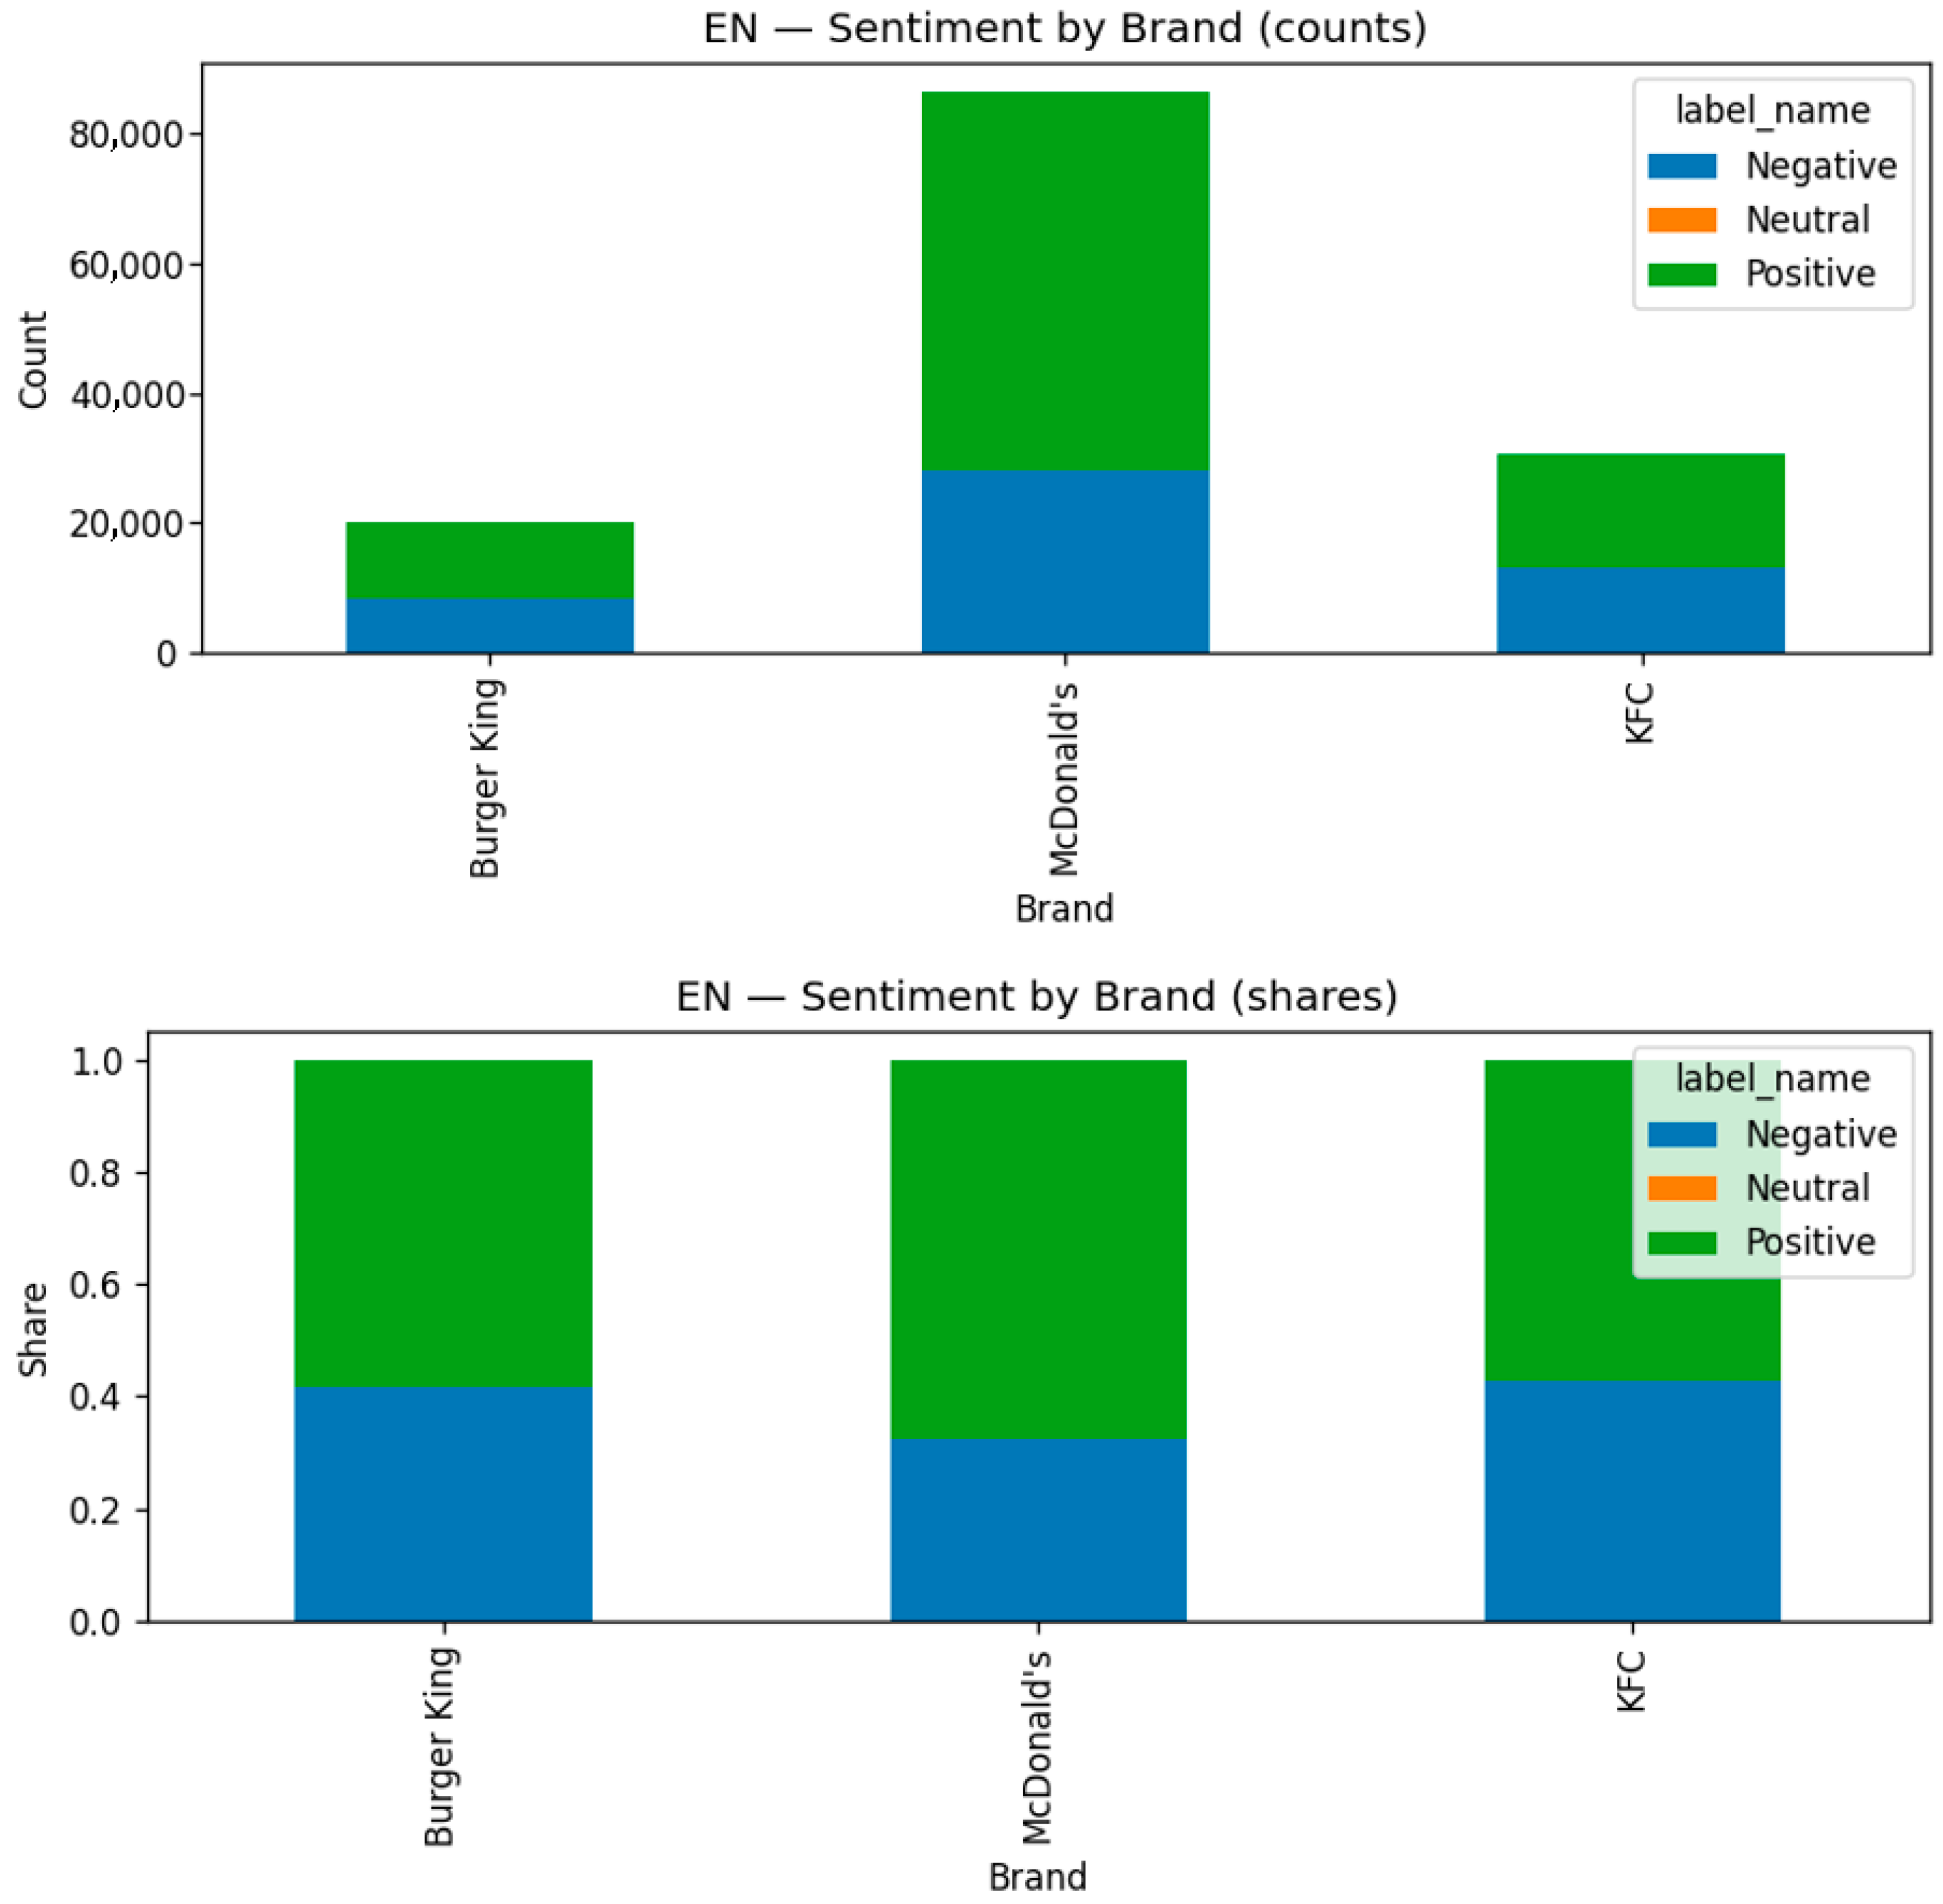
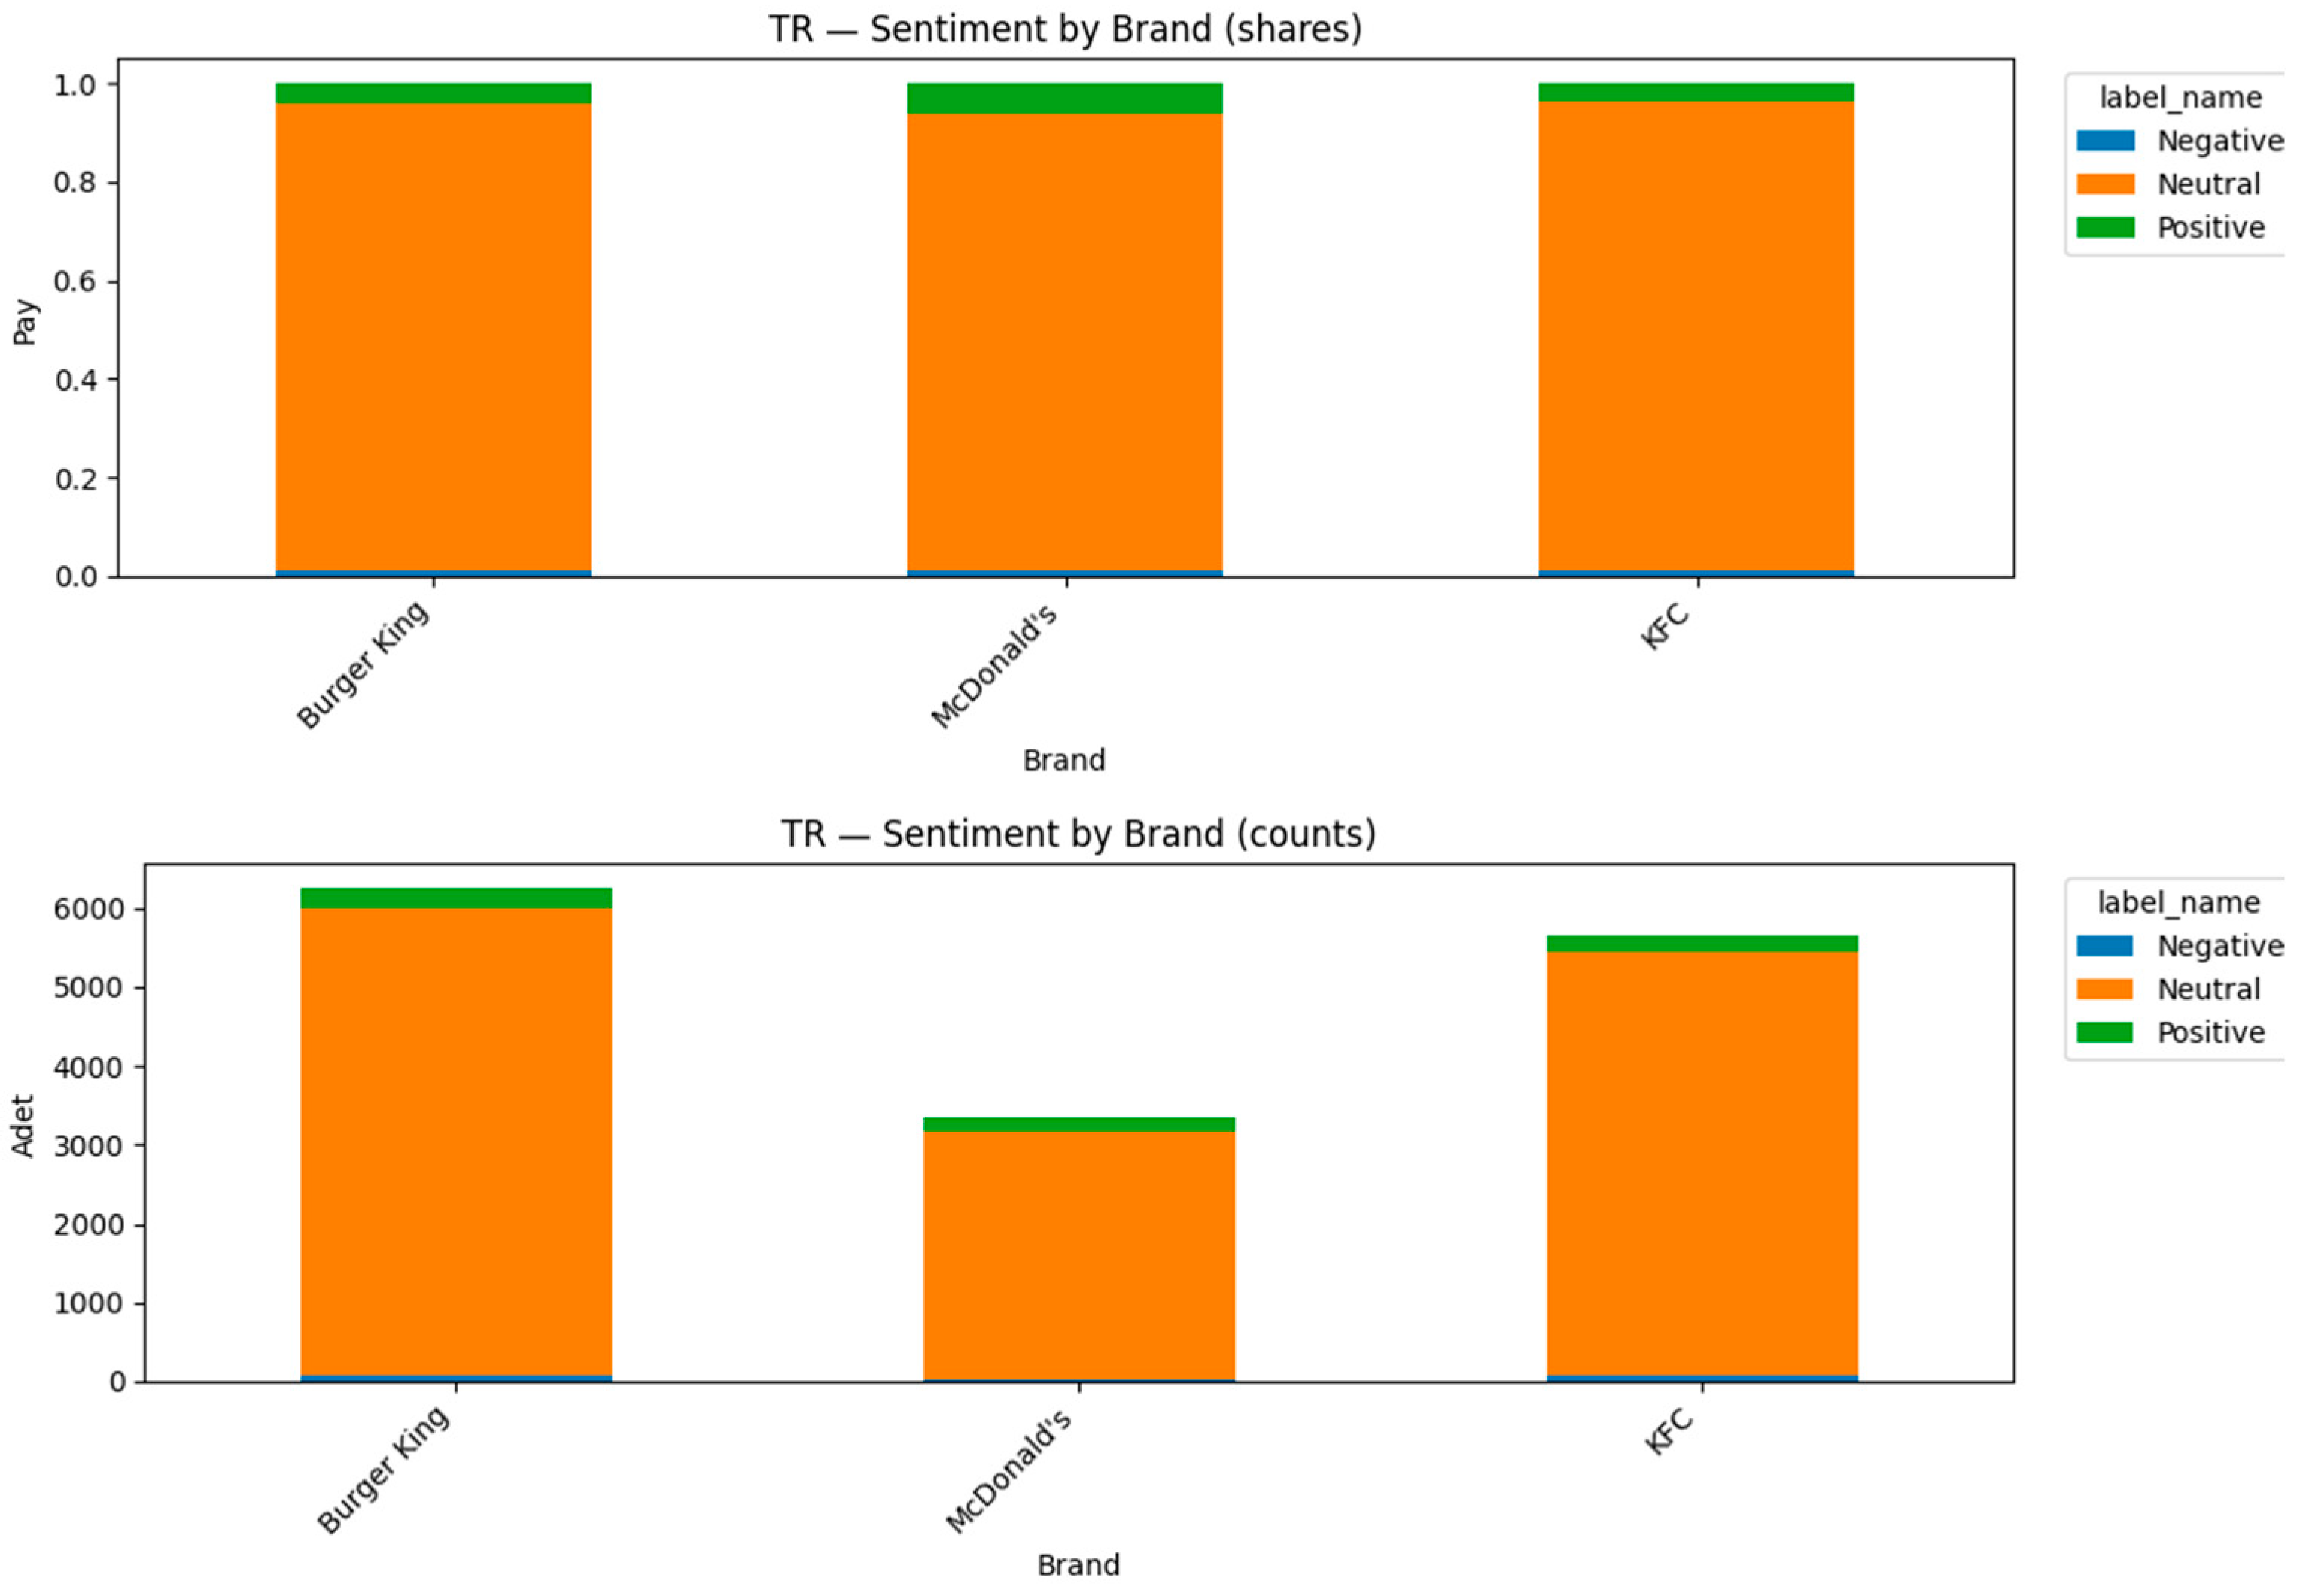
The cross-linguistic comparison yielded valuable insights into consumer expression patterns. English-speaking users more frequently articulated overtly positive or polarized sentiments, whereas Turkish users exhibited overwhelmingly neutral tones, suggesting cultural or linguistic differences in digital self-expression. For e-commerce managers, this divergence indicates that brand reputation monitoring strategies cannot rely on uniform sentiment baselines across markets. Instead, they must account for cultural moderation of emotional expression and language-specific biases in automated tools.
Managerially, the findings provide brand-resolved diagnostics that can directly inform digital commerce operations. For instance, the predominance of positive sentiment for McDonald’s in English tweets reflects comparatively stronger brand equity. In contrast, the dominance of neutral sentiment across Turkish brands suggests latent consumer ambivalence or reluctance to express strong opinions. Additionally, the time-series analysis for Turkish revealed event-sensitive spikes in neutral mentions, likely tied to campaigns or service issues, underscoring the importance of monitoring polarity distributions and temporal fluctuations. These insights can support campaign timing, rapid service recovery, and tailored communication strategies across different markets.
Finally, this work emphasizes the need for transparent error audits and multi-source evaluation. This study offers a replicable framework for other low-resource and multilingual sentiment analysis contexts by explicitly distinguishing between pseudo-label replication and human sentiment capture. Future work could expand this framework toward explainable AI, aspect-based sentiment extraction, and predictive applications in e-commerce, where integrating linguistic diversity with business intelligence remains an unmet challenge.
8. Conclusions
This study contributes to the literature on e-commerce analytics by presenting a bilingual, brand-resolved sentiment analysis of fast food customer feedback on X (formerly Twitter), leveraging both machine learning and deep learning models. The comparative approach across English and Turkish datasets highlighted three central contributions.
The study demonstrates that transformer-based deep learning models, particularly BERT, outperform classical machine learning baselines in capturing nuanced sentiment, even in low-resource language contexts. However, the discrepancy between pseudo-label agreement and human-label accuracy, especially for Turkish, underscores the necessity of human validation and language-specific adaptation.
The analysis revealed important cross-linguistic differences in consumer sentiment expression: English-language tweets exhibit more explicit and polarized sentiment, whereas Turkish-language tweets are predominantly neutral. These findings suggest that cultural and linguistic factors fundamentally shape digital discourse and that uniform analytical models risk overlooking such variation.
Brand-specific sentiment diagnostics, event sensitivity detection, and temporal monitoring can provide actionable insights for campaign design, issue management, and reputation protection in the fast food industry. By moving beyond global averages to brand- and market-level sentiment profiles, firms can achieve more targeted and culturally informed strategic decision-making.
The research reinforces the value of multilingual sentiment analysis in digital commerce while also cautioning against overreliance on lexicon-based pseudo-labels and single aggregate accuracy metrics. Future research should integrate explainable AI techniques, aspect-based diagnostics, and broader cross-cultural datasets to enhance robustness and managerial relevance. By combining methodological rigor with practical insights, this study provides both a scientific contribution to the field of sentiment analysis and a pragmatic framework for leveraging consumer feedback in dynamic e-commerce environments.
