Abstract
E-commerce indicators are very complex and have a wide range of levels of complexity and applications. The digital economies that we are oriented towards also have complex features in terms of consumers and businesses. The research objectives are focused on determining the impact of e-commerce on the digital economy within countries with different stages of economic development, digitalization techniques, and e-commerce usage. This study evaluates how AI-based clustering reveals patterns in the e-commerce indicators influencing the digital economy. The research methods used are focused on AI techniques in order to evaluate and assess the usage of e-commerce in the digital economy. In this sense, the methods used in this research are clustering techniques in order to determine the stage of implementation of the digital economy. The research implications have a worldwide impact and soundness in establishing the evolution of the e-economy in different types of countries with different stages and levels of digitalization and different e-commerce development paths. The empirical results show there are significant differences between countries due to cultural, economic, social, and judicial differences. The conclusions of this study highlight that using AI techniques can be a solution for enhancing future digital economy development and labor market consolidation, especially by strengthening e-commerce indicator usage and application.
1. Introduction
The selection and importance of the research theme, which is the process of digitalization, are derived from the need for e-commerce indicator development in the context of a complex and globalized economy and also in the context of the integration of the worldwide labor market. In this sense, this theme is needed to establish whether the digital economy has registered some actual expansion trends, especially in the context of e-commerce indicators and the business development of companies.
The importance of Artificial Intelligence (AI) from consumers’ and businesses’ perspectives is revealed, using both quantitative and qualitative techniques, by its competitiveness and customer experience achieved through its proper usage [1]. However, one of the main interesting aspects debated in the economic literature is represented by the products chosen by the customers in e-commerce, which is an essential factor in determining their behavior [2]. An interesting study that deals with the usage of AI techniques gathers together two important but distinct domains, e-commerce and fashion design, by using some AI image generation systems in order to create a mixture between the e-commerce domain and fashion design. The Midjourney case study offers an interesting idea of how AI techniques can increase the quality of the fashion process by assisting in ideation and optimization of the design features; moreover, within this approach, although there are some potential limitations, a fundamental quality shift can be achieved in the designer’s domain through the increasing the digitalization of the process of fashion design [3].
The IoT environment will be opened for e-commerce in the future using different specific algorithms and techniques on the road from Industry 4.0 to Industry 5.0, with the key concept of economic sustainability [4]. The European Union (EU), in the context of the post-pandemic period, must take into account e-commerce future developments by considering some features, such as people’s and businesses’ access to the internet, poverty risks, and the education level of the people [5].
The connections between the employment rate and electronic commerce at the European Union level are analyzed through panel data techniques, and it is concluded that there is a positive connection between these two aspects; however, there are also other variables that explain this relationship, such as Gross Domestic Product (GDP), expenditures, enterprises, and Information and Communication Technology (ICT) specialists [6]. More interesting insights are provided by ChatGPT 5.0 version to determine the influence of AI on the labor market; the reason behind this research is to have the room to maneuver content that AI generates to determine the dynamics of the labor market and employment patterns [7].
The scope of this research involves determining the impact of several types of e-commerce indicators on the digital economy by using cluster applications within different types of countries in order to determine if there are any patterns regarding the e-economy.
The research objectives of this paper are to apply AI techniques, especially comparative analysis, and advances and computational solutions to analyze the impact of e-commerce on the digital economy.
The main added value of this paper is the linkage between e-commerce indicators, the digital economy, and AI techniques in order to determine if there are some similar patterns in developed and developing countries regarding the e-economy’s development and evolution.
The methodological approach advances our current understanding by showing which distributions and structures of missing values can (a) already in themselves point to a meaningful grouping of countries described by data representing the respective digital economies and (b) may then lead via multiple imputations to data updates, upon which arbitrary clustering methods can be applied.
Clustering approaches are valuable in our context of “unordered” potential influence indicators, which together describe the state of digital economies from a list of countries, and where there is no predefined measure of performance. In order to support decisions in management and policy, the clustering methods use analogy and similarity in many different ways, do not need a distinction between dependent and independent economic variables, and output cluster membership labels. A given label may indicate a development stage, potential for cooperation, conflict imminence, etc., at the levels (country, region, company) supported by the available data. As countries can be grouped according to indicators, the converse label is also useful for understanding which influences are grouped for which country cluster with correlated effects. These are objective results based solely on the data. To what extent they are useful for actual decisions depends on the domain knowledge of the model user, who understands the wider context.
New insights are gained about the digital economy from the twofold clustering results. First, a semi-confirmatory result. The totally unsupervised clustering of the digital economy data over all countries reproduces the two-group clustering: the divide between economically developed and economically less developed countries, when measured by more traditional economic variables like GDP per capita, HDI, etc. To a certain degree, this is already obtained by setting all non-missing entries to uniformly distributed random values, which indicates that a binary matrix with permutation-invariant rows (i.e., the order of the countries does not matter) determines the rough grouping of the countries into two development levels. This means there is not much divergence between general economic and digital development, as some interest groups or the press might suggest. The force of these data distributions is such that even countries with highly competent and intense IT activity, like India, are part of the country cluster with less development. As the missing value concentration in this cluster is very high, it is reasonable not to overstress this extremely diverse cluster by fragile sub-clustering. Instead, we sub-cluster the more developed country group, which results in a relatively stable four-cluster grouping. Interestingly, with some notable exceptions, these clusters tend to contain countries that are actually cooperating through various joint ventures and other alliances. Furthermore, the value distributions of the four sub-clusters can be read off for each indicator variable, which allows the easy identification of redundant indicators. For instance, the United Nations Conference for Trade and Development (UNCTAD) Business-to-Consumer (B2C) E-Commerce Index Rank group variables have important roles in cluster separation. Hence, these clusters are largely determined by premier digital economy data, but also reproduce other economic country grouping criteria.
The implications of the results for policymakers and businesses primarily involve using these country groupings (or still more involved groupings) in order to consider with whom to cooperate and to foster alliances. Important business creation is often influenced by the reciprocating actions of successful regional and national development. Eventually, business and research environments are created. Almost as a rule, they do not spread evenly across countries, and are often located within or near attractive cities with many younger-aged innovators. Such environments, by necessity, call for the following:
- (1)
- Many types of conditional cooperation in order to grow non-marginal businesses, which are driven by visionary entrepreneurs (and not by short-term gain seekers).
- (2)
- Sustaining advanced and responsive digital economies, enabling timely systems of conditional cooperation, including crowd- and venture-financing, as well as trusted international tech-alliance formation of any size.
The country groupings obtained help in thinking in terms of the economic cultures and preferences. As an example of such an exercise, one may consider instances of attraction by similarity (USA and GB, say, which are both in C23) or attraction by complementarity: India and Japan, say, are in C1 and in C23, respectively; most of the C23 cluster members would cooperate with India. One may also consider repulsion by dissimilarity: India and China, say, are in C1 and C22; most of the C22 members would rather prefer to cooperate within C2. The less developed countries present in C1 tend to form a highly diverse group. Missing value occurrence is more concentrated in C1 than in C2 and, hence, accounts for a much higher percentage than that for all countries, potentially reducing the value of further sub-clustering, even if using multiple imputations as we are herein. Judging from the available digital economy data on countries from C1 (and abstracting from political goals which may override everything), it may be best to search for economic partners from some sub-clusters of C2 (the more developed countries), which are least exploitative.
The structure of this paper is as follows: The first section represents a quid pro quo regarding the antecedents and consequences of AI upon e-commerce and its necessity for future improvement and further development. The second section analyzes the current state-of-the-art by highlighting the most important studies in the economic literature with a special focus on hypothesis development and rationale. The third section presents the research model and the technical methodology of the study by revealing the most important quantitative and qualitative aspects of the study. The fourth section discloses the empirical results of the study, focusing on the main econometric characteristics and economic implications. The fifth section discusses and analyzes the empirical results obtained in the previous part with the previous studies and compares the results in light of future studies’ agenda development. The final section presents the main final remarks and conclusions, containing some policy recommendations.
2. Literature Review and Research Questions
The connections between e-commerce, the digital economy, and AI can also be seen in light of the labor market developments and evolutions. From an economic point of view, the labor market is influenced by e-commerce indicators and usage; the structure and actual status of the digital economy; and also by AI techniques, applications, and developments, which are nowadays changing rapidly.
2.1. AI Impact on the Labor Market
AI’s impact on the labor market represents a debated issue in the economic literature. As a consequence, it is shown that AI generates structural optimization and has both practical and theoretical significance by using the spatial heterogeneity model [8], and also has a large variety of positive effects on income distribution, income inequality, and increasing wages and salaries [9], and with a macro-level analysis, the significant outcomes on commuting zones and distributed effects can be determined [10]. Moreover, e-commerce can increase employment in the labor force, which is directly linked to continuous courses and the education system in order to improve the skills and competitiveness of the labor force [11].
The important role of AI in the labor market is shown by using panel data to determine the patterns of the increasing the number of jobs throughout virtual agglomeration, which has a positive effect on the labor market [12]; meanwhile, several connections can be manifested between AI techniques, digital economies, and employment numbers [13]. Big tech firms use AI applications to create new jobs and enhance the level of competition and accessibility of different types of positions in the labor market [14], while the development of international e-commerce enterprises using emerging technologies and AI techniques has led to an improvement in worldwide e-commerce [15].
The connection between AI techniques and the labor market reveals that the productivity of companies in terms of the labor market is facilitated by using AI patent application procedures, which have a positive effect on the small- and medium-sized enterprise (SME) industry [16], and that using semantic similarities to determine the contracts between transformative digitalization and destructive digitalization for occupations and workers in specific countries, taking into account the risk of being displaced, represents a good technique [17].
The automatic prediction mechanism using statistical skills is a powerful tool in the analysis of labor market developments and evolutions [18]. Consequently, employment policy is improved by increased job competition using AI techniques in terms of augmented inflows of labor [19]. In the aftermath, it can be observed that business and management skills are those most exposed to AI, especially administration, finance, clerical, and project management positions [20]; meanwhile, investigating the connections between e-commerce and digital technologies in the COVID-19 era, it can be seen that consumer behavior has changed, and e-commerce and web activities have gained an increasingly quick trend of usage by customers [21].
Analyzing the economic literature regarding the connections between the labor market and AI techniques, it can be seen that at first, theoretical implications can be identified. The new business models that are applied nowadays to the labor market use AI techniques as a standard approach in order to restructure businesses and strengthen the labor market. In this sense, both developed and developing countries have encountered several important steps in business models using AI in their backgrounds.
Second, the trend of using AI techniques can be identified in the vast majority of industries around the globe, which may start from goods, services, and different types of businesses to important industry branches and strategic economic sectors.
Third, the empirical trends of using AI techniques in the labor market reveal the need for digitalization and transformation of the labor market in order to adapt to the new challenges of the globalized economy and labor market, especially the increasing number of jobs and the future development of the market structure. Regarding these aspects, it can be identified that several developed countries have successfully implemented AI techniques and increased the labor market’s digitalization and transformation. However, there are many developing countries where the process of using AI techniques in the labor market is ongoing, but it can be seen that important steps have been made by several developing countries in this direction.
The research gap identified in this subsection highlights the differences between the theoretical part of the connections between AI and the labor market, in which there are significant debates and divergencies among several important scholars in terms of conceptualization, methodology, and structure, and also the empirical part, due to the sensitivity of the process of measuring the impact of AI on the labor market, especially due to three important country categories: developed countries, developing countries, and less developed countries. The reason for tackling this problem in this study is in order to establish an empirical connection between the labor market and AI, with direct implications for both the theoretical and empirical parts.
The connections of the current state-of-the-art to the research question below are represented by the need to enhance the soundness of e-commerce indicators by using AI technologies and techniques. This aspect is very important due to the differences manifested in the digitalization process of the economies in the three country groups mentioned above.
Overall, the impact of AI on the labor market is visible around the world in the vast majority of countries. The AI techniques, tactics, and developments applied and used on the labor market will increase the digitalization of the economy and create a new labor market environment in the context of the free movement of people and the flexible structure of the market.
Research question Q1.
Can labor market digitalization have a significant impact on countries with different stages of development by using AI methods in e-commerce indicators?
2.2. AI in E-Commerce
The application of AI techniques in trade relationships encounters different challenges and must comply with ethical and deontological standards and practices [22]. In terms of the labor market and work performances, collective bargaining has a central role in the relationship between new technologies and demographic decline by using different algorithms with redistributive and fiscal policies [23].
The usage of AI in e-commerce has been analyzed in the economic literature from the perspective of quantitative approaches to the labor force oriented towards analytic models, e-marketing, and natural language processing [24]; meanwhile, other studies deal with bibliometric analysis and descriptive networks for the connections between AI technologies and e-commerce [25]. An interesting approach to web-based business advancements represents the usage of AI in genuine business models [26]. The release of ChatGPT in 2022 has generated good economic policy outcomes in terms of increasing the productivity level and employment rate [27]; meanwhile, the public policies and central banks’ actions need to adopt AI technologies to improve the macroeconomic outcomes [28].
In the context of AI usage, labor relationships and different types of employees are more affected than other types [29], but investigating the customer service and operations of e-commerce business-to-consumer (B2C) giants needs to be undertaken by several types of analysis and comparisons [30]. As a result, using AI techniques for organizational change must be undertaken with a mix of elements such as employee education, content, job level, and the appropriate salary [31]. Taking this one step further, the time allocation solution was found for solving the labor force demographics disparities [32].
The connections between AI techniques and e-commerce are revealed at first by the role of the new technologies, algorithms, and practices used in the e-commerce domain. These practices and techniques must comply with the ethical practices and standards, as they have a direct impact on e-marketing. The usage of techniques and tactics such as descriptive networks, bibliometric analysis, analytical models, and natural language processing will enhance and increase the soundness of e-marketing around the globe.
Another very important aspect is represented by the adoption of ChatGPT 5.0 version in e-commerce and business for developing a new trend of policy outcomes in terms of soundness and positive economic effects. E-commerce using AI applications is often used by small and large companies in order to increase their business success and to increase the need to expand the digital economy.
Finally, the connections between AI techniques and e-commerce must also be seen in the context of intensifying international trade transactions in all types and areas of businesses, from start-up companies to multinational companies. The future challenges here are robotics and the usage of machines, algorithms, and other engineering developments that can be used successfully in strengthening e-commerce appliances around the globe.
The research gap identified in this subsection regards the new e-marketing technologies that are currently being engaged in the digital economy, which are constructed to increase e-commerce internationalization, with a direct impact on strengthening the indicators of e-commerce. As can be seen, a wide range of these e-commerce indicators do not have complete databases, with many missing values of data and not available (NA) data, which currently indicates that the international databases must be reorganized and reshaped for more accurate data processing availability and resilience.
The connections of the current state-of-the-art to the research question below are that moving forward with the adoption and application of the MI cluster can be a quid pro quo for enhancing the digitalization process of economies, in which the similarities and differences manifested in the structure of the economies can be a solid background for the integration process.
Research question Q2.
Can the degree of e-economy integration be increased by the application of cluster MI on the e-commerce indicators in countries with a similar economic structure?
2.3. Clustering Methods in Economics
The clustering methods in economics have been debated in the economic literature by several important studies that deal with these aspects. While some of the studies measure the usage of the AI techniques in the emerging markets, focusing on the worldwide intelligence of e-commerce [33], other studies highlight the updating of businesses for AI technology model usage and creation models [34]. Taking this one step further, it is necessary to enhance the regulation of the activities within e-commerce [35], and to connect the labor market more locally with e-commerce through equilibrium models [36].
Taking into account the correlations manifested between the labor market and e-commerce through clustering techniques, it is important to recalibrate the personal and financial status of the employees by e-commerce in the digital economy [37]. Moreover, e-commerce implementation will have benefits for employment and international trade for developed and developing countries in the long and short run [38]. Adopting clustering techniques of e-commerce with a two-phase model will generate a positive impact on industries [39].
The usage of AI techniques in clustering analysis can be observed in the economic literature regarding e-commerce, the labor market, and AI developments. Although the empirical studies reveal different types of approaches, starting with the creation models and different matrices of specific business models, all approaches identify the need for these methods in the economic sciences.
Other approaches identify gaps in the digital economy, which are determined by the lack of connectivity between the labor market and e-commerce, with the solution of creating several models to generate equilibrium sequences. These models are constructed with different stages and phases, and also not only encompass appliances for e-commerce and businesses, but may also be applied in different economic fields such as finance, accountancy, communication, and marketing.
Globally, clustering techniques are used to conduct SWOT analysis for enterprises, and large datasets are used for forecasting and prediction, determining different patterns and shapes of businesses and enterprises, but also to group several types of countries with similarities in order to increase the digitalization of economies.
The research gap identified in this subsection regards several different clustering methods in economics used by different authors and research groups, which encounter very interesting performances and results in terms of objectives, methodologies, and clustering techniques. This process is also bound to the data availability, the soundness of datasets, the accuracy of the models, and the prediction strategies.
The connections of the current state-of-the-art to the research question below are bound directly to the qualitative shift in the clustering techniques and methodologies, which, through the high degree of soundness of the e-commerce indicator database, can lead to an increase in the degree of digitalization of the economies.
Research question Q3.
Can the degree of digital transformation be increased through the usage of clustering analysis for the e-commerce indicators?
3. Research Model and Methodology
3.1. Data
The overall goal of the technical section is to analyze if and in what way a tabular information structure obtained by fusing some publicly available data indicates successful e-commerce, and, eventually, the advent of successful digital economies.
The fused data set is a matrix containing N = 152 countries (cases) represented by m = 47 indicators.
The types of structures of the single matrix column entries (henceforth named “indicators”) are as follows:
- -
- Metrics, with some of them being ordinal (amounts, scores, etc.);
- -
- Four categorical variables (existence and implementation stage of regulations, etc.);
- -
- Five consecutive years for an indicator per country are transformed into five different input variables in order to avoid a partial longitudinal dimension to the present analysis.
Overall, out of all Nm = 7144 matrix entries, there are almost 30% NAs (missing values), with their frequency of occurrence being somewhat biased towards countries known to be economically less developed.
Table 1 emphasizes different groups of potential indicators to assign countries to e-economy success classes. These indicator groups are headed by the respective capital letter titles. The assumption is that there are no reliable “given” success class assignments (labels) for countries, as such label assignments may change over time. However, we also assume that such assignments are “hidden” inside a sufficiently diverse data set, covering a broad range of potential influences (as may well be the present one). Consequently, it is then of interest to find out which countries are situated at the margin between cluster pairs, and, hence, are expected to be candidates for future migration between different success clusters.

Table 1.
All m indicators (features) with code names u1–u47 and database sources.
In Table 2, we show the summary statistics of the m indicator variables. Only 5 out of all 47 indicators have no missing values (NAs). Variables with a small set of unique values and few missing value entries (for example, categorical variables u24–u27, etc.) may lead to situations of zero in-group variance after forming country groups (clusters).

Table 2.
Summary statistics of all m indicators (features) over all N countries.
3.2. Research Methods
As can be expected, much of the compiled economic research data, which at the conceptual level invites interesting and relevant socio-economic research, unfortunately come with considerable limitations. These include (1) low data volumes, (2) a high percentage of missing values, and (3) low time resolutions. Data connected to direct commercial goals of certain economic agents, such as high-frequency financial data (used for trading) and marketing-related data (i.e., used for sales and recommender systems, etc.) may suffer to a lesser extent from sparseness, heavy missing value infiltration, and low time resolution. The number of cases (observations, ) is often compared unfavorably with the number of features (indicators, ), in the sense that “traditional” statistical models would need to avoid overtraining, and hence, there are trivial solutions of forecasting models.
In this study, the observations are countries without temporal resolution, and the indicators span a wide range of potentially relevant aspects of mapping how (and if) e-commerce indicators influence the development (status) of the digital economy within these countries. At this point, one may also acknowledge that countries are more diverse and heterogeneous and, in some ways, less directly comparable than more obviously linked objects or subjects of statistical observations, like, for instance, clients, markets, or competitors.
Furthermore, our goal is to understand the relationship between country groups and indicators.
Hence, there is no clear-cut, hard, single-objective optimization problem as one can find behind many “classical” AI/machine learning (ML) approaches; be they supervised or semi-supervised situations, we call them many-views filtration.
Here, the difficulty lies in filtering out useful views from a huge combinatorial search space of options, which in fact goes beyond the widely used big data filter approach of conventional AI or ML. Today’s successful AI applications rely to a large extent on super-huge databases (text, images, formalized knowledge, etc.), which can only be managed by very large IT firms. Such apps learn to produce “useful” output by continuously adapting to the hundreds of billions of consumer reactions—which, measured by the colossal effort involved, may not come as a complete surprise. The general outline of analyzing the data available for this study is depicted in the diagram in Figure 1.
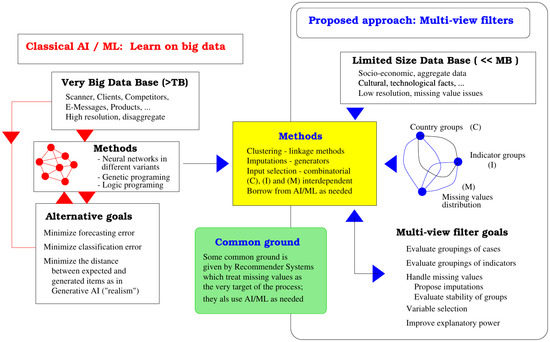
Figure 1.
The general outline of the multi-view filter analysis of restricted and incomplete socio-economic data. This stands in contrast to the more straightforward use of AI/ML applications (left column) for huge and highly focused data sets (as routinely available to commerce, the natural sciences, and to engineering). Source: own production using xfig under Linux.
The present study does not command the necessary computational resources for realizing the loops of the most general search and filter process outlined in Figure 1. We restrict ourselves to describing certain important aspects thereof, which, even if branched out of the general procedure, illustrate the path of the analysis and the step-wise contribution of the data for explanatory purposes.
With economic and commercial data, it seems very important to distinguish between data volume and information content or redundancy. Economic or commercial data may be regarded as “big data” by volume but much less so by information content—an aspect which part of the AI community seems to neglect. Hence, one should not disregard small data sets, but multiple views on these data should be mandatory.
The following steps describe our analysis, which is an illustrative branch-out from the general procedure depicted in Figure 1:
Step 1—Some information may be obtained solely from looking at the (country, indicator) entry distribution of missing values, for instance, by replacing NA entries with zeros and the empirical numeric values with random numbers drawn from a uniform distribution. Such a filter may already alone result in interpretable or confirmatory country clustering.
Step 2—Many economic data (including ours) contain up to 30% of missing value entries (NAs). The outcome of statistical analyses using such data is biased or skewed if disregarding them or replacing NAs with “naive” numeric values like means or zeros. Hence, generating a sufficiently large number of imputations, that is, proposing matrices with different missing value replacements, is called for. There are some refined approaches available, which generate imputations by taking the follow-up modeling intention into account. As in our case, if the follow-up modeling happens to be clustering, the generated set of imputations would enable preferably stable clusters. In qualitative terms, this can be thought of as favoring such imputations which do not radically change cluster compositions by making relatively small changes in the data. Such characteristics are enforced by procedures which fall under the label of Bayesian probabilistic programming (a prominent example being STAN—Substance Flow Analysis v2.37.0-rc3. Substance Flow Analysis—STAN is a very powerful system for Bayesian probabilistic programming used for data-intensive modeling. It may be used as a stand-alone application, but it more often serves as a (hidden) back-end in many software tools or languages popular with researchers from many scientific domains, as are, e.g., Python, Matlab, R, Stata, etc.), which is part of the modern AI/ML toolbox.
Step 3—Upon obtaining a sufficiently large and stable set of imputations as described in step [2], one may proceed with the intended data modeling. For our data, we view looping over a series of clusterings resulting in country- respective indicator-grouping to be an adequate modeling procedure. The motivation for preferring clustering over supervised approaches like classification or regression is manyfold: People, in general, and decision makers, in particular, are inclined to think in terms of grouping of items, markets, persons, technologies, competitors, and rating classes, etc., and they often decide upon considering the group memberships of subjects and on group reputation. Such decisions may include highly strategic matters, which include whether a country should enjoy partnerships or preferential treatment of any kind; receive investments and contracts; or be included in development programs, to name a few. From a technical standpoint, using supervised models hinges on having important reasons to assume which of the variables are dependent, which is not the case with our data.
Recent reviews of clustering methods [40,41,42] (the latter discusses the intimate relation of clustering and machine learning) suggest a bewildering diversity of approaches, which take statistical and topological properties of data points into account and which are also tailored to the dimensionality and volume of data. The modeling process outlined in Figure nine may, in principle, loop over all known clustering approaches. For simplicity, we restrict ourselves in this study to using two important and technically sufficiently distinct approaches, namely (1) hierarchical clustering and (2) centroid-based clustering. Many of the other potentially interesting approaches, such as the families of model-based clustering or constrained clustering, do require assumptions and/or domain knowledge, which for our data are not available for now.
In this study, we use clustering in consecutive steps, namely, the following:
The entire set of N = 152 countries is clustered into two similarly sized clusters C1 and C2, which roughly contain less developed countries in the bigger cluster C1 and more developed countries in C2 after qualitatively characterizing these clusters in terms of their relationship to groups of indicators by using k-means clusters and correlation-based hierarchical clustering.
In the next step, we sub-cluster C2 into four different differently sized clusters C21, C22, C23, and C24. Although a two-partition would here also yield the most stable clustering, we choose a four-part clustering, which we expect to provide more informative results. In this step, we repeat the generation of imputations as the data background has been modified (fewer countries and some eliminated indicators resulting from the shortened country list) and cluster the remaining data.
We finally show how all four clusters act on drawing out a data value range separately for each indicator. This allows us to judge the value overlap (and separability) that this clustering achieves for the different indicators for each of the four country groups.
3.3. On the Role of Missing Values in Economic Data
Missing values are ubiquitous in empirical data, and especially in economic data from different national origins. As detailed before, missing data can pose serious problems for data analysis. For some statistical methods, one even lacks algorithms that adapt to this situation. However, within certain limits, this problem can be overcome by generating imputations to replace missing values with numerical ones. In the last few decades, a variety of approaches were developed for generating imputations which take the nature of the intended data analysis into account, with some appealing directly to AI/ML methods [43].
Comparative analyses: To what degree do the obtained clusters agree with clusters for the same countries (cases) obtained by more standard macroeconomic indicators (e.g., GDP per capita, research and development (R&D) expenditure, financial country scores, etc.)?
This allows us to characterize the surplus (added value) information obtained from using the specialized data set compared to the use of more standard economic indicator data.
Limitations of standard methods:
- -
- Standard k-means do not work for data with NAs (as with the situation in R).
- -
- Standard hclust works due to a dissimilarity matrix, which simply “ignores” NAs by computing pair similarities, which take only the contribution of regular or non-NA vector entries into account. This means that entries with non-NA values in both vectors solely contribute to the distance. Thus, by counting just the non-NA entries at least, standardization over all vector pairs is consistent. However, ignoring NAs is expected to distort the pragmatic and computationally less-intensive solution:
We repeatedly use standard hierarchical clustering hclust by deploying different similarity methods (for example “euclidian”, “city-block”, etc.), which provide the similarity matrices needed by hclust (outer computational loop) and do this for different agglomeration methods (for example “single link”, “complete”, “average”, and others) in the inner loop.
Furthermore, we first compare their partition plausibility.
Advanced and computationally more-intensive solution (using the clusterMI R-library):
After a systematic search concerning statistical and AI-/ML-related methods, we identified the recently published R software [44], which has the required functionality for both clustering and also for implicit analysis of our data. We also determined that these computational methods were indeed working, at least for some sensible parameter choices.
This ensemble of computational methods is collected in the clusterMI R-library and in the subordinate methods. It can produce a set of imputations for the NA entries in the data matrix and thereby create a population of such imputed matrices.
- -
- We cluster the imputed matrices by k-means, with k ≥ 2;
- -
- We identify a “consensus clustering”;
- -
- We report the stability of the clustering obtained.
A byproduct of such a procedure is that it provides a reasonable number 2 ≤ k < min (m, N) of clusters, which should hence be well below both the number of countries N and indicators m.
We continue to sub-cluster the members of (reasonable) clusters, which pose further interest, and post-analyze them as stated above.
Summing up, our analysis pipeline contains two consecutive, forward-pointing, exploratory steps, namely, the following:
- (1)
- Generating imputations for missing values and computing an instability measure, which indicates the most stable variant of centroid-type clustering for varying numbers k = 2, 3,… of clusters. This proposes the cluster number that leads to the fewest membership changes if data are perturbed (i.e., if other imputations are used). Note, there is no stringent mathematical reason for actually using this instability-informed proposal. It may be overridden if solid domain knowledge suggests otherwise.
- (2)
- Using the proposed cluster number, actual clustering is performed, following consensus clustering based on the population of imputations inherited from step (1). Roughly, this can be thought of as a majority vote for a country to be a member of a cluster with given members, although technical details may be more involved. The resulting clustering informs the empirical analysis and its interpretation. For each cluster generated, the contribution of the different digital economy indicators can be read off. This may be performed by comparing the cluster-specific means or other statistical measures of indicators. Furthermore, co-clustering countries and indicators may also inform us about the similarities between countries based on the correlation of indicators.
For each cluster, this process may be repeated, generating sub-clusters. This may be interesting, for instance, if the mother-cluster is too coarse and does not (yet) represent a subdivision of countries that is recognizable/interpretable according to other domain criteria, which are not directly present in the data.
Additionally, after each clustering step, in order to continue with further sub-clustering of a selected cluster, there is a feedback loop (i.e., backward pointing), which restarts the (in-)stability-determining (first) step of potential clustering after recomputing the imputations. This recomputation is based on the actual missing data remaining in the locations of the previously selected cluster.
Next, we determine the rationale for using the methods offered by clusterMI [45] in our data analysis. First, we emphasize that the technique of generating values for imputations can be chosen from a broad spectrum of techniques that take values “adjacent” to observable data into account [46]. However, in our context, the most significant intervention is based on the assumption that the data points can be meaningfully assigned to clusters. Hence, one may, for instance, generate a large number of random imputations as long as they are “within” the data, or, geometrically, generate interpolations rather than extrapolations. The crucial point is to associate the selection of an imputation with a clusterization. In simple geometrical terms, this implies that imputations for missing values should be located inside clusters and not in between them. This further means that there are clusterizations with regard to given imputations, which are more stable than others. Note that a clusterization includes both the number of clusters and the respective cluster membership list (i.e., which data point belongs to which cluster). Conversely, imputations are then selected with regard to given clusterizations. This process of generation and selection will eventually return a recommendation k* for the number of clusters (for using medoid clustering, like k-means) and an associated set of imputations. This ends the first phase of the clusterMI analysis.
A second phase of the clusterMI analysis will then return a concrete consensus k*-clustering, which is the object of interest for the interpretation of the empirical data analysis.
The basic problem of the cluster-anticipating generation of imputations (phase one) is represented in Figure 2. The figure depicts, by means of a two-dimensional data example, (a) the potential imputation if no clustering is assumed and (b) if a k-means-like clustering with k = 2 is attempted, and in Figure 3, we move on to k = 4. These examples pretend that there is a “natural” or “true” cluster structure of the data, which is the four clusters (labeled by the alternating color shades of the data points). Further, we assume this true labeling reflects information that cannot be entirely known by a modeler. Hence, in technical terms, this means that the labels cannot be guessed completely by using distance-based clustering.
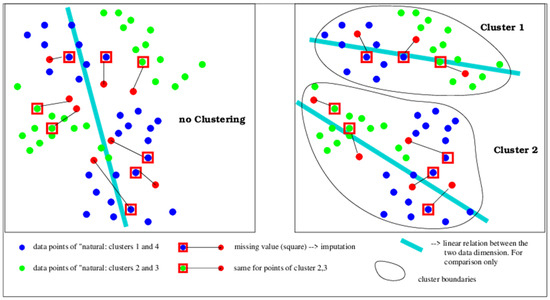
Figure 2.
A stylized two-dimensional example of the difference between imputations when all data are subjected to an imputation generator (left panel) and when the aim of clustering is enforcing alternative imputations (right panel, the case for two-cluster clustering). Note that, in general, besides the imputation coordinate values, the resulting relation between the (cluster-wise) data also changes, sometimes dramatically so. This is hinted at with the shape of the linear regression curve (with many more data points, non-linear relations may also be reliably detectable).
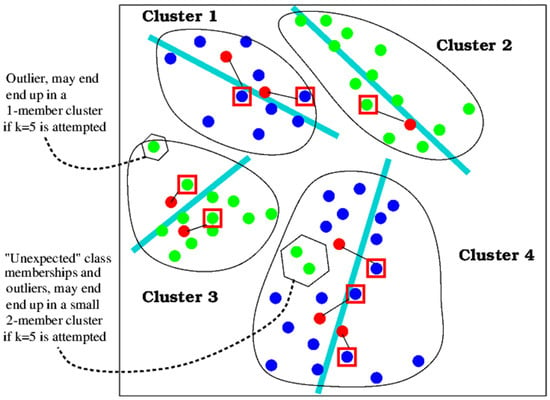
Figure 3.
The same data point example as in Figure 2, now with four clusters, which would at least by cluster number match the assumed “true” cluster structure. Continued sub-clustering may produce more information but may also induce some more difficulties: (1) relative outliers with regard to the new cluster boundaries may appear, and (2) “unexpected” class memberships may show up.
The final result of the cluster-anticipating generation of imputations by clusterMI is a clustering which hopefully approaches the “true” cluster structure. The extent to which this is achieved depends also on the share and distributions of missing values in the data and on whether the true groups can be recovered by distance-based methods. These conditions are “external” and cannot be influenced by the modeling process. It is worth noting that here, AI may possibly help in a less than spectacular way, namely by extending the database and by using extensive computational resources: bringing in more indicators poses additional problems as data sparsity further increases. Therefore, using a very large number of partial models (on subsets of indicators) becomes necessary, especially when faced with multiple missing values ([47] for a related context).
Figure 3 explains, through four-cluster clustering, what may be gained in terms of information and which new challenges may surface. Potential information gains are highlighted (in a stylized manner) by the different linear relationships within the cluster-wise data. The challenges result in part from the limited cluster shape reconstruction ability of k-means, but also of that of other distance-based clustering techniques. In theory, “linkages”—as can be chosen for hierarchical clustering—could help. However, there is no data-intrinsic hint as to which linkage may be adequate. In our extensive tests using different linkages, the linkages that implied a significant departure from distance-based, centroid-like clustering did result, for our data, in highly unrealistic, degenerate cluster structures. Henceforth, we centered our attention on using k-means clustering.
In order to sum up and clarify the use of clusterMI, we display in Figure 4 the main information flow and the overall analysis pipeline as is used further down in the Section 4. The mandatory steps within the clusterMI method are outlined, but useful extensions and complementary analyses such as sub-clustering and hierarchical co-clustering are also highlighted. Note that besides the formal logic of information flow and algorithm choice, there is a lot of scope for (modeler’s) intervention into analysis configuration. To this end, available economic data almost never contain the tacit (human) domain knowledge needed.
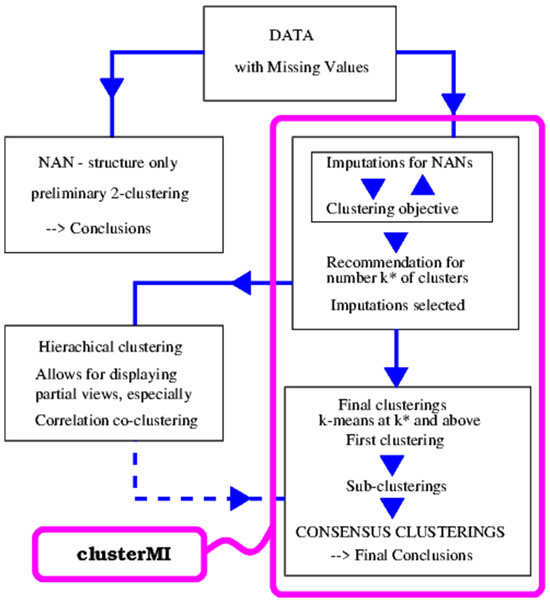
Figure 4.
Information flow and analysis steps as described in this section, and as are realized using our empirical data, are realized in the follow-up sections. Hierarchical clustering and sub-clustering may be introduced by the modeler as extensions to the principal analysis with clusterMI.
4. Empirical Results
Following the research plan outlined in the previous section (Methods), in order to first assess the functionality of the advanced methods from the clusterMI library (henceforth referred to as clusterMI), we replace all non-NA entries of the data matrix with positive random (uniformly distributed) numbers and let clusterMI generate imputations (numerical proposals for the NA entries). The number of alternative imputations is set to n_imp = 25. Thereafter, we run standard k-means for k = 2,3,4 clusters and return the most stable respective clusterings. Obviously, the numerical values of the entries are “meaningless” here (as they are effectively noise), but the question to be answered first is whether the structure of the positioning of NAs within the vectors viewed country-wise can determine some (weak) interpretable results. The result at this stage is (somewhat surprisingly) that the most stable group (k = 2) returns two clusters which roughly contain the cohort of less developed countries in one cluster and the more developed ones in the other.
We refrain from showing a table with the detailed country assignments to the respective clusters. However, in Figure 5, we depict the sorted instability measures of the clusterings associated with the number of clusters. Naturally, during the effective evaluation, the individual instability values do occur in the sorted order as shown in the figure. Visual inspection alone indicates that, for k = 3,4, there is less concentrated variance on a slightly broader value range, which leads the method to return k = 2 as the winner.

Figure 5.
Instability range for 50 imputation matrices where the non-NA entries are replaced by (0,1) random uniform numbers. The ranges are computed using k-means, for k = 2,3,4, which are shown by the panels in that order from left to right.
A suitable interpretation for this coarse-grained finding is that missing information on the available indicators alone indicates a potentially reduced level of competence concerning the implementation of a digital economy.
4.1. Hierarchical Clustering on Distance Matrices That Neglect Missing Values
The next step outlined in the research methods in the previous section is to find hierarchical clusterings with “given” distance matrices between countries and between indicators. This re-ordered double clustering is displayed in an N \times m matrix with associated dendrograms for both groupings simultaneously. In order to search for acceptable and interpretable groupings of countries and indicators, we evaluate parametrizations concerning a series of available methods for distance evaluations between pairs of vectors and agglomeration methods, which guide the way to connect such vectors into clusters.
From a larger set of such re-ordered double clusterings, we select the ones that allow for suitable interpretations of our economic data. This calls for more automated procedures for how to rule out unsuitable candidates.
For the time being, we rule out or downgrade groupings with a highly asymmetrical number of cluster sizes; such choices may be refined in later clusterings, which are sub-clusters of the former ones.
For the distance method we use (1) “euclidean”, (2) “maximum”, (3) “manhattan” (or city-block), (4) “canberra” (especially suitable for “counting” data), (5) “binary” (asymmetric binary, a Jaccard-coefficient-like measure), and (6) “minkowski”. As the data columns are of mixed type, the suitability of none of the distance methods can be ruled out a priori.
For the cluster agglomeration method, we use (1) “ward.D”, (2) “ward.D2”, (3) “single”, (4) “complete”, (5) “average”, (6) “mcquitty”, (7) “median”, and (8) “centroid”, which may have vastly different effects on cluster formation. While, in principle, the same a priori suitability argument applies as for distance methods, it is expected that more “geometry”-sensitive methods like “single” are less likely to return clusterings which reflect economic principles or interpretability.
In total, we compute 48 clusters using the standard hclust R package(version: 4.4.3 from 2025 february).
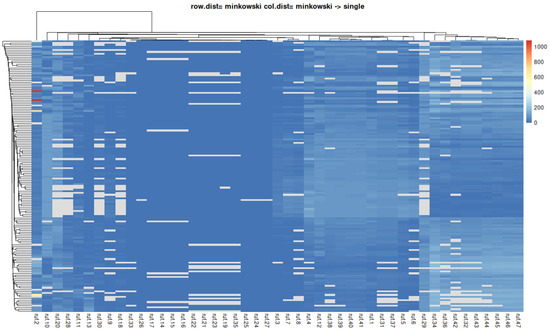
Figure 6.
Double clustering by using the distances between countries and between indicators, respectively. The cluster agglomeration method uses “single,” and the clustering is highly asymmetric. Similar results are obtained for different distance methods (countries are rows).
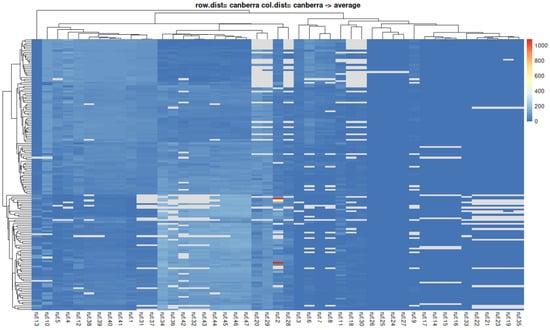
Figure 7.
Double clustering by using the distances between countries and between indicators, respectively. The cluster agglomeration method uses “average,” and the clustering is equilibrated. Similar results are obtained for some different distance methods and for agglomeration methods which have effects similar to “average” (countries are rows).
Note that such double-clustering matrices cannot be compared directly, as, for instance, cluster naming is arbitrary. Hence, one may resume the comparison of submatrices that contain countries and indicators of interest that appear adjacent in the images in the figures.
A completely stringent and exhaustive comparison over all submatrices can be a hard task, even computationally. However, visual inspection and a priori selected countries and indicators of interest can ease such comparisons.
4.2. K-Means Clustering on Data with 50 Alternative Imputation Matrices (The Clustermi Methods)
In order to use the view of hierarchical clusterings over both the countries and the indicators, two distance matrices are computed, namely N\times N and m\times m, respectively. The distribution of the values of these matrices is depicted in Figure 8.
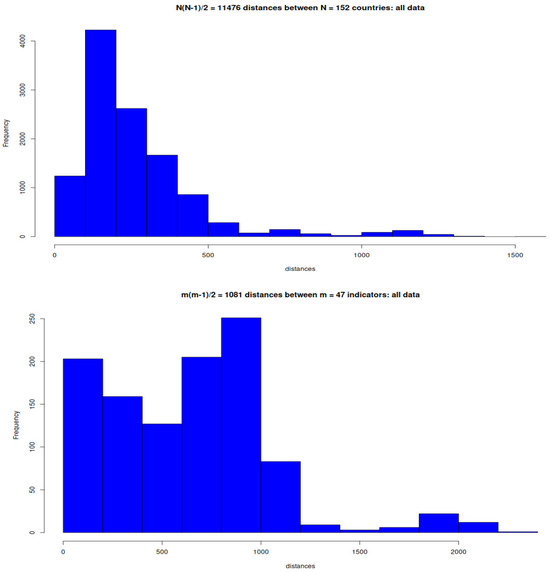
Figure 8.
Histograms for the distance matrix entries of the entire data set. Left panel: Distances between countries computed over the indicators. Right panel: Distances between indicators computed over the countries.
After a first run over the imputed data attempting k = 2 clustering, the most stable two-clustering is obtained, dividing the 152 countries into two groups, which, again, roughly reflect development status. Group 1 contains “third world” countries, and Group 2 contains OECD countries and some others.
From the perspective of absolute technological capabilities, this grouping may not be completely satisfactory, as countries like India and Indonesia, and some others, are members of Group 1, although they command substantial competencies in IT and related sectors.
The corresponding histograms for the distances between the countries and the indicators in the first group (the less developed countries) are depicted in Figure 9.
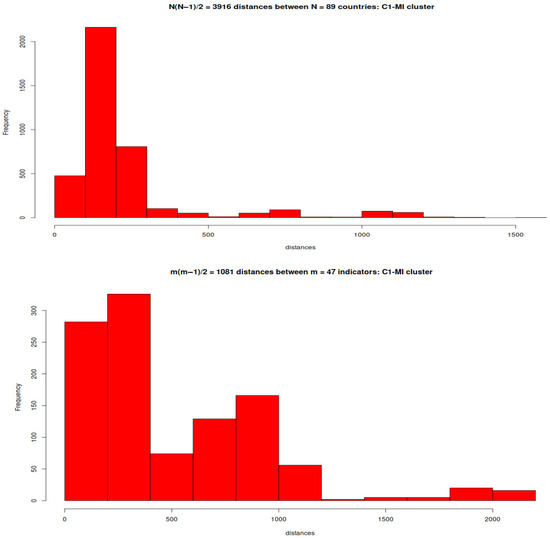
Figure 9.
Histograms for the distance matrix entries for the Group 1 data. Left panel: Distances between countries computed over the indicators. Right panel: Distances between indicators computed over the countries.
Figure 9 and Figure 10 suggest that the multimodal and almost disconnected occupancy of the density of distance values (of both countries and indicators) are, to a large extent, generated by countries of cluster 1, that is, by the group of less developed economies. This is not too surprising, as there should be vastly more cultural, behavioral, and institutional diversity within these countries as they converge much less in terms of having a more similar view on economic and developmental matters than the countries from Group 2.
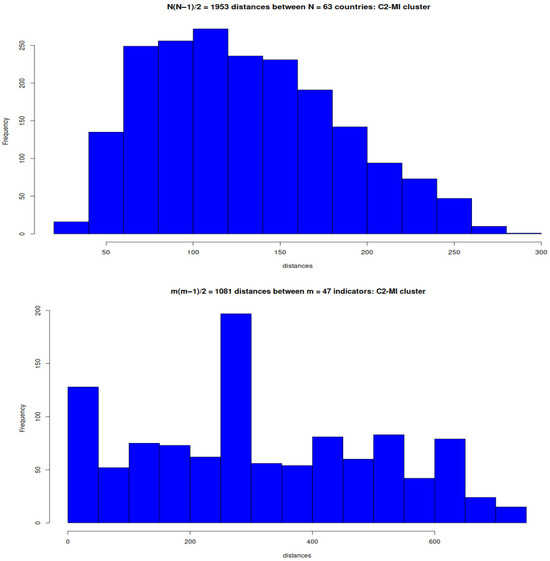
Figure 10.
Histograms for the distance matrix entries for the Group 2 data. Left panel: Distances between countries computed over the indicators. Right panel: Distances between indicators computed over the countries.
The next step in our data analysis is to double cluster countries and indicators on all countries and on countries determined by the clusterIM (using multiple imputations).
At this level (Figure 11), a clear partition into two distinct country–indicator blocks is visible. This refers to the two rectangular submatrices, predominantly colored in reddish tones, which reflect blocks of positive correlations.
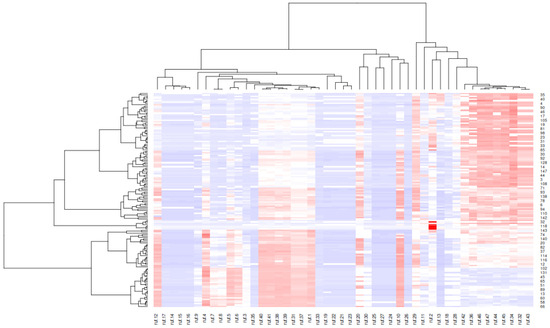
Figure 11.
Pairwise correlation of all countries and all indicators (related to the histogram in Figure 4). The red-leaning colors indicate positive correlations, and the blue-leaning ones show negative correlations between country pairs. Countries and indicators are rearranged in order to form hierarchical clusters with non-overlapping tree branches.
The upper-right block builds upon indicators 32, 34, 36, 42, 43, 44, 45, 46, and 47, and on the single contributions of indicators 2, 10, 20, and 29. According to Table 1, the 47 indicators can be subdivided into nine variable groups. Hence, {32, 34, 36} are from group E-commerce readiness, while {42–47} are from group E-commerce index rank/years.
The single contributions of indicators are from groups ICT infrastructure & services {2}; Trade, logistics & facilitation {10}; E-commerce skills {20}; and Access to financing {29}.
The lower-left block builds upon indicators 1, 31, 37, 38, 39, 40, and 41, and on the single contributions of indicators 4, 5, 10, and 12. This corresponds to indicators from groups ICT infrastructure & services {1}, E-commerce readiness {31}, and E-commerce index/years {37–41}.
The single contributions of indicators are from groups ICT infrastructure & services {4}; Payment solutions {5}; and Trade, logistics & facilitation {10,12}.
These indicator influences will next be compared to clusterMI-generated country groups.
Figure 12 and Figure 13 are computed using the same final procedure as Figure 11 but for pairwise correlations on the cluster data resulting from applying clusterMI, that is, on the countries from the two clusters C1 and C2 produced by k-means, with k = 2, using 50 different imputations for the NAs in the original data. As stated above, the most stable (consensus) clustering {C1, C2} is returned.
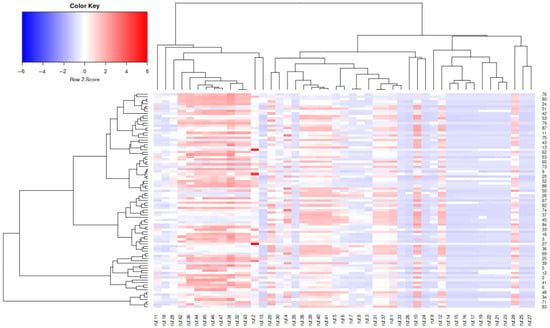
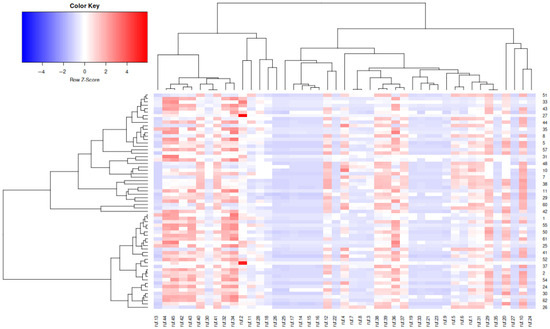
Figure 13.
Pairwise correlation of all countries from cluster 1 (related to the histogram in Figure 10). A categorical variable (indicator) is eliminated due to a variance of zero issued at that column with a reduced number of countries. The same interpretation applies to the matrix images from Figure 11 and Figure 12.
In analogy to the explanations given for Figure 8, we report on influential indicators by means of the blocks of positive correlations, as well as on single important indicator contributions.
The country cluster C1’s leftmost predominantly positive block builds upon indicators 34, 36, 42, 44, 45, 46, and 47, and on the single contributions of indicators 10, 20, 29, and 41. These correspond, respectively, to the indicator group E-commerce readiness {34, 36}, while {42, 44–47} are from group E-commerce index rank/years, which is very similar to the influences found in Figure 8 for the first country group. The single contributions of indicators are from groups ICT infrastructure & services {2}; Trade, logistics & facilitation {10}; E-commerce skills {20}; Access to financing {29}; and E-commerce index/year {41}—again similar to the positive influences found in Figure 11 for the first country group.
The country cluster C2’s leftmost predominantly positive block builds upon indicators 30, 32, 34, 40, 41, 42, 43, 45, and 46, and on the single contributions of indicators 4, 10, 12, 20, 29, 36, 37, 38, and 39. The positive block builds on indicator groups Access to financing {30}, E-commerce readiness {32, 34}, and on both E-commerce index/year {40, 41} and E-commerce index rank/year {42,43,45,46}.
The single contributions of indicators build on indicator groups ICT infrastructure & services {4}, Trade, logistics & facilitation {10,12}, E-commerce skills {20}, Access to financing {29}, E-commerce readiness {36}, and E-commerce index/years {37–39}.
The C2 positive correlation indicators are different for both the group and single influences from those found in the second country group of Figure 11, which reflects the main effect of the imputed clustering computed by the clusterMI procedure.
Low fixed broadband Internet tariffs, in Purchasing Power Parity (PPP) USD/month (Figure 11), may signal intense IT-related, economically relevant activity. For C1 countries, low tariffs are to be found in all selected countries that have e-economy potential by virtue of overall technological capabilities, even if that potential is not fully realized as of yet. Note also the very large discrepancies in tariffs within C1. For the selected countries from the C2 group (highlighted in Table 3), the low-tariff countries are, respectively, Brazil, Japan, Romania, the Russian Federation, and the USA. These either reflect successful e-economies or countries with qualified work, enabling a decisive move in that direction, according to Figure 14.

Table 3.
The countries assigned to clusters C1 and C2 were produced by clusterIM.
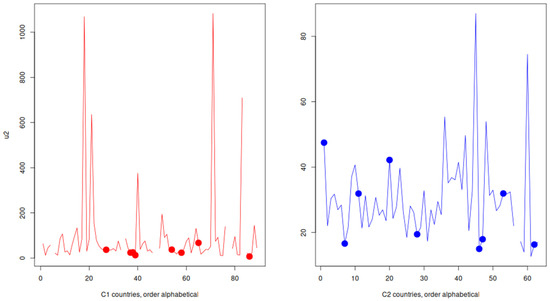
Figure 14.
Variation in Internet tariffs. Left panel: Extreme variation for C1 countries with very high maxima. Right panel: A much narrower variation for the C2 countries (compare the y-axis values for both panels). The fat points correspond to the countries highlighted for both clusters in Table 3; for instance, the three points below position 40 in the left panel are for India, Indonesia, and Iran, respectively. Gaps in the graphs denote missing values.
B2C internet use (Figure 15) may also signal intense IT-related, economically relevant activity. The fat points corresponding to the countries highlighted for both clusters in Table 3 indicate that there is an overlap between the high performers of C1 countries and the lower performers of the C2 countries. The USA and the nearby UK (the peak nearby) stand out—presumably owing to the language advantage. Similar situations are encountered in range overlap for other indicators from the variable groups E-commerce skills and E-commerce readiness, however, with somewhat less advantage for the native English-speaking countries.
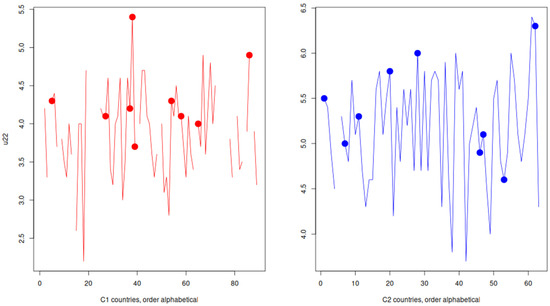
Figure 15.
Variation in B2C internet use (indicator u22). Left panel: Many missing values in C1 countries. Right panel: The variation corridor around the mean for the C2 countries is similar to that of the C1 countries (compare the y-axis values for both panels).
4.3. Sub-Clustering Cluster C2
In order to exemplify a more refined data analysis, we continue by sub-clustering the previously obtained cluster C2, which contains the economically more advanced countries. The same procedure may well be applied to the countries from cluster C1. First, we note (see also remarks from Section 3.2) that by leaving out countries from the total population, the relative data context has changed, in that generating new imputations is in order.
After having generated 100 such new imputations and checking for expected clustering instability, the suggestion is still that further k = 2 (k-means) sub-clustering would still deliver the most stable results. At this point, we willingly, and out of curiosity, override this recommendation and choose to use a k = 4 sub-clustering, which is still reasonably stable but may offer more interesting results.
Owing to the smaller number of 63 countries in C2, some indicator columns degenerated into missing values and were eliminated, leaving a total of 38 active indicators.
Figure 16 depicts all numerical data of a randomly chosen imputation (i.e., that of no. 15) just in the order the data matrix was read out row-wise for each consecutive column. It shows that the imputations (dark circles), which are now proportionally lower than for the entire data, are all well within the numerical value clouds (light circles) of the original non-missing data, which improves confidence in their reliability. The curve of all sorted values of the imputation is also shown. It indicates that the overall data are skewed and (hence) non-Gaussian.
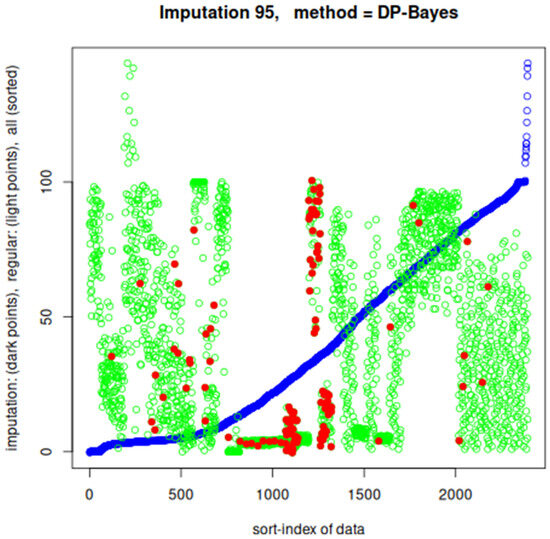
Figure 16.
The data of imputation no.15 for data set C2 chosen at random. Non-missing values are light circles, the imputations for NAs are depicted by dark circles, and the sorted value curve is referred to by “all” in the axes’ labels.
The C2 countries are assigned to the resulting four clusters, as listed in Table 4.

Table 4.
The countries assigned to the sub-clusters C21, C22, C23, and C24.
Next, we depict the cluster contribution overlap for all 38 active indicators. Note that not all 47 original indicators are listed in the Figure 17 from the imputations generated on C2 data (as was explained further above). The identification numbers are used to comply with the original (full data) indicator names from the Section 3.1, i.e., see Table 1.
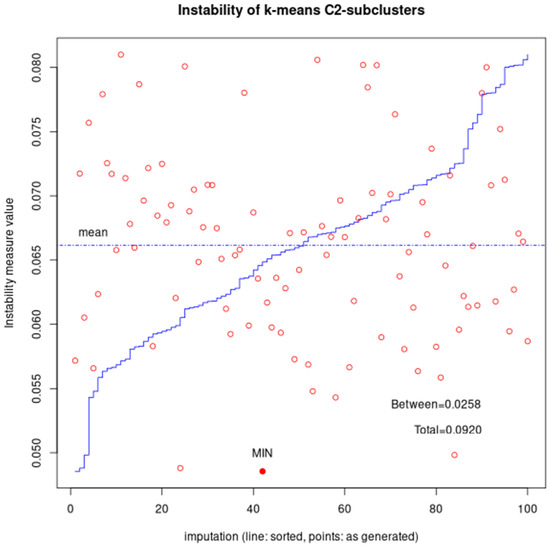
Figure 17.
Instability of the four clusters formed on the 100 different imputations. See the main text for explanations.
From Figure 18 we note that there is especially low overlap of the clustering dimensions (or indicators) 38–40, 42, 44, and 46, that is, for indicators connected with the wider domain of “E-Commerce and E-Commerce rank indices”—which in a way should not come as a surprise, perhaps except for the fact that a completely unsupervised analysis (clustering of the kind used) is readily detecting this.
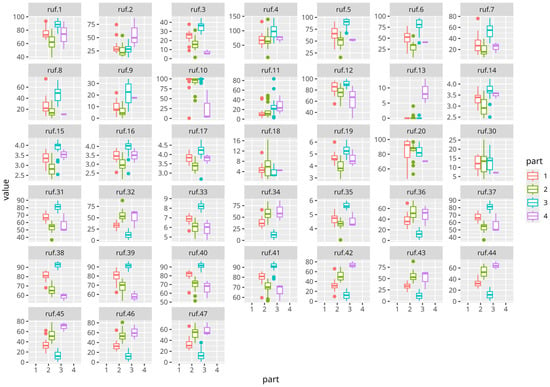
Figure 18.
Value variation in the four sub-clusters for the indicator. The value refers to the actual numerical data of the imputations, and the x-coordinate “part” refers to the clustering (partition) contribution to each active indicator. The dots outside the boxes are individual outliers.
There are also indicators which produce especially high overlap for dimensions (indicators) 10, 11, 20, and 30, which are connected to the wider domains of “Logistics & Trade”, “E-Commerce Skills development”, and aspects of “Finance” (see Table 1), which suggest no clear country-wise distinction for these indicators.
In addition, there are indicators with a strong presence of outliers—or with a strongly non-Gaussian distribution of values to hold a positive view (e.g., indicators 2, 3, and 10—involving aspects of the wider domain of “Payment solutions”, “ICT infrastructure”, etc.). This information may be fed back in the indicator-wise generation of imputations as stated in the general outlay of the data analysis (Figure 1). Finally, there should also be scope for data compression, as, for instance, indicator group 45–47 indicates a strong correlation in the value distribution of the four sub-clusters.
To further interpret what distinguishes clusters C1 and C2 more comprehensively, we look into the role of indicator groups (see Table 1) within each cluster. This view aggregates over the indicators contained in each group and reports a shortened list of basic statistical summaries. Hereby, we avoid information overload and improve readability, but without distorting the result. In general, there are higher values with some self-explanatory exceptions of rank values which have the reverse interpretation (e.g., entry: B2B E-Comm. Rank)
Table 5 shows that in general, in terms of digital economy data, cluster C2 is clearly different from cluster C1 as it relatively and in some cases absolutely outperforms the latter in terms of performance- and service-intensity-related measures. This is especially the case in the Payments and in the Trade & Logistics, as well as in the Legal indicator groups. The same tendency is true for Broadband & service and E-Comm. Skills, but to a lesser extent than expected. This may be because the technical part of a digital economy is based on acquiring formal knowledge, while the multidisciplinary societal part relies more on informal know-how (tacit knowledge), which is more likely to be acquired by evolving in a convenient historical context (hence the important weight of the B2B-related indicator group, since B2B competences are formed by industrial tradition). Other indicator groups display a less clear picture regarding the cluster separation.

Table 5.
Comparison of indicator groups between clusters C1 and C2.
Note from Table 6 that within cluster C1, Iran is a border case representing the intention of being active in a (adapted) digital economy. Note also that the technologically ambitious and active member countries like India, Indonesia, and Vietnam are absent.

Table 6.
Countries with extreme values of indicator groups for cluster C1.
From Table 7, we see that smaller- to medium-sized countries constitute the border cases. Germany stands out in the indicator group Trade & Logistics, while Israel in E-Comm. Skills. Note the absence of member countries with strong IT and AI sectors like the USA, UK, and the Netherlands.

Table 7.
Countries with extreme values of indicator groups for cluster C2.
Cluster C2 contains the economically better performing countries, and turns out to also perform better in digital economy measures. Cluster C1 concentrates the majority of missing values, thereby increasing their share substantially, and thereby increasing the authenticity of the C2 data. Recomputing imputations on such a subset of countries risks reducing their usefulness, as for some indicators, they effectively have two less anchor points (i.e., actually observed values).
Hence, we restrict ourselves to sub-cluster C2, displaying results with regard to indicator groups in Table 8. As may be seen in Table 4, sub-cluster C21 mainly contains smaller emerging countries, sub-cluster C22 mainly large emerging countries, and sub-cluster C23 mainly the most developed countries with a longer industrial tradition. Sub-cluster C24 is an “exotic” residual group of only three countries. Unexpected group members will be discussed further below.

Table 8.
Comparison of indicator groups between sub-clusters C21, C22, C23, and C24.
Sub-cluster C23 (for the member list, see Table 4) stands out with regard to most indicator groups. This underlines the proposition that industrial tradition matters in the digital economy as well. This confirms the fact that complex economic behavior—evolved over a longer time period—is much harder to imitate than the deployment of formalized technical knowledge. The second part of this proposition is further confirmed by the fact that the contributions of the indicator group E-Comm. Skills are not superior in C23, and those of the indicator group Broadband & service are also less so. Also, in the indicator group Legal service, the countries of C23 do not differ from those of C22. This can be explained by the fact that a legal system is imposed top-down and can indeed be “imitated” if the societies of the respective countries wish to do so.
Note from Table 9 that within sub-cluster C21, Israel stands out, making it a potential cluster-switcher.

Table 9.
Countries with extreme values of indicator groups for cluster C21.
From Table 10, we note the border cases within sub-cluster C22 non-European (except Bulgaria) countries, and that the very large member countries China and Brazil are not listed here.

Table 10.
Countries with extreme values of indicator groups for cluster C22.
From Table 11, we note that Germany is strong in Trade & Logistics and weak in E-Comm. Skills. While the former is not surprising, the latter hints at a potential disadvantage of heavily industrialized countries with regard to implementing dynamic “lightweight” digital economy domains. This is a chance for all emerging countries, irrespective of their power and size. Note that countries like the USA, UK, or the Netherlands, which are strong in both AI development and deployment, do not emerge as outstanding.

Table 11.
Countries with extreme values of indicator groups for cluster C23.
There are also countries assigned to unexpected clusters. These results come from the data available for this study but may also be the result of some technical choices. Among these is the two-cluster grouping into C1 and C2. However, according to the instability analysis referred to in the section Empirical Results, this choice is well advised. We therefore note that in cluster C1, the unexpected assignment refers to India, Indonesia, and Vietnam. These countries command, in part, advanced IT services. However, owing to their sizes, these solely represent pockets of higher development, and this information is not reflected in our digital economy data.
In cluster C22, we find Romania and Costa Rica alongside Brazil, China, and Russia, which are almost incomparable in most general terms but seem to be much closer together if viewed through the filter of digital economy data.
At this point, some more remarks concerning the clustering pipeline are in order. While cluster C2 includes OECD countries, with many advanced small players like Israel and Costa Rica, and other big non-OECD players like China and Brazil, the overall information entailed in this grouping seems to be too coarse. Hence, sub-clustering C2 into C21, C22, C23, and C24 provides groups that provoke more interesting thoughts about possible future pathways or consequences. Note that the technological challenges of a digital economy and especially e-businesses are much less involved than those concerning so-called deep-tech sectors ([48]; examples are critical military, airspace, nuclear, and some bio-tech domains, etc.). By and large, competition in economic e-services is about speed, given that client preferences are correctly recognized or oftentimes just powerfully induced. This implies skills very different from those required for the named (long-term) deep-tech projects. The instruments standing behind the indicator groups Broadband & service and E-Comm. Skills can be most easily adapted by single businesses, including those from the C1 countries. The smallest differences between C1 and all C2 sub-clusters are in the dimensions related to formal technological capability, and the largest differences concern indicator groups where institutions (e.g., legal structures and law enforcement) or cooperation between many types of organizations (e.g., finance) are involved. In order to grow successful e-businesses with an over-regional or international reach, cooperations or alliances are of great interest, especially for firms from the less developed C1 countries, but also for the smaller players from C21 and C22. For both the C1 countries and the smaller players from C21 and C22, finding partners from the most advanced countries in C23 would be preferable if the latter implement a more inclusive (fairer) cooperation policy. For single cases, the most important enabling factor would be to identify effective technological or techno-economic complementarities between partners. Owing to the very nature of our aggregated data, this aspect cannot be addressed in the present study.
From a more technical standpoint, we see a small “residual” cluster C24. As already hinted at in the Section 3 a side effect of sub-clustering is the appearance of such outlier groups, which form due to the new cluster boundaries (depicted in Figure 4). Unexpected cluster memberships such as Romania (found in C22, expected in C21) and, to some extent, Italy (found in C21, expected in C23), may indicate that an alternative model-based clustering (superposition of parameterized Gaussians, etc.) may better capture our expectations. The latter are grounded in more complex domain knowledge than that which is extractable from the available data. However, again, there is no objective hint as to what model base to use. Hence, it is preferable to restrict empirical interpretations to information based on the objectively obtained results.
As explained in the Section 3 above, the use of hierarchical clustering is a convenient way of experimenting with the combination of alternative linkage methods and distance measures in order to find out if some of the resulting clusterings produce reasonable groupings, especially when using linkages (e.g., topologically inspired, such as single-linkage), which are not variants of centroid-like methods like k-means. We experimented with an exhaustive combination of linkage distance which is available in statistical software like R. Without showing the large numbers of dendrograms obtained, we report that the methods most similar in nature to k-means produced the most reasonable clusterings, avoiding degenerate co-clusterings (groups of countries and groups of correlated indicators). Hence, our hierarchical clustering turns out to serve primarily as a confirmatory result, which motivates the use of k-means clustering in the sequel.
5. Discussion
Analyzing the economic literature regarding AI, e-commerce, and digital economy, it can be observed that there is a large scale of methods for determining the connections and impact of e-commerce on the digital economy using different types of AI.
The empirical results of the previous studies regarding the correlation between e-commerce and the labor market using AI techniques are quite interesting. In this sense, the evidence from China suggests that the economic structure optimization mechanism is revealed by the increasing trend of e-commerce using logistic density [49]. The taxation issue is a very sensitive subject related to e-commerce, especially in terms of tax evasion and tax loss; in this sense, the double taxation conventions and other important tax treaties are very relevant to more comprehensible and equilibrated tax regulations [50].
Other studies deal with the connections between retail employment and different regional types and conclude that there is a connection between the growth of wage workers and online sales expansion [51]. Electronic business and its impact on employment may be evaluated and assessed only by qualitative aspects, which are more relevant than quantitative ones [52]. COVID-19 issues have generated decreasing trends in terms of e-commerce growth and work mobility; the results have shown that e-commerce has not counteracted the effects of the pandemic period, but has had an important role as a buffer [53].
An interesting approach is revealed by analyzing the e-commerce aspects using the business-to-business (B2B) regression model in the decision-making process of businesses and enterprises; the conclusions of the study present the B2B technique as a solution to enhance the labor productivity of firms [54]. Another study deals with the connections between technology and e-commerce and their impact on labor productivity; the study presents the Pearson coefficient and cross-sectional data to improve employment capacity and the pursuit of different types of jobs [55]. The implementation of e-commerce in rural areas using panel data from more than 300 countries shows that in old revolutionary areas, rural residence status is positively influenced by e-commerce [56].
A comparative study between retail firms and e-commerce firms shows that, using a sample of European countries, higher wages are provided by the qualified jobs that are created and promoted by e-commerce [57]. Globalization and digitalization are nowadays phenomena that have worldwide implications throughout the new digital market platform created by e-commerce; the effects created by e-commerce will have significant outcomes, such as financial credits, an increase in the quality of social life, creation of better jobs, and disruption of retail [58].
Regarding the research questions, we can emphasize the following: research question Q1 has a positive response, because the use of the AI techniques that we have encompassed in this study regarding the e-commerce indicators shows an increase in the digitalization process in several country groups and subgroups, with a direct impact on the labor market’s development.
Research question Q2 also has a positive response, because cluster MI is applied in this study, leading to the integration of the e-economies of different sub-country groups, showing that countries with a similar economic structure encounter better performance in terms of the digitalization process.
Regarding the research question expressed in Q2, the e-economy performance is highly dependent on the institutional structure and the reliability of services in the respective countries. However, there are some discrepancies regarding common expectations. For instance, the industrially highly developed Germany is underperforming in digital economy skills. Furthermore, perceived e-economy champions like the UK and the USA are not absolute top performers according to the data. Here, small developed countries (e.g., Switzerland, Israel) excel.
Research question Q3 has a positive response, because AI usage, through the clustering method that we have proposed on the e-commerce indicators, has a direct and positive impact on the road to digitalization, transforming the process of different types of economies around the globe.
Regarding the hypothesis expressed in Q3, using AI in conjunction with cluster analyses as presented in this study will not produce any added value, at least with regard to expectations of providing “magic” algorithms. However, the vast, all-encompassing databases implicitly contained in the parametrization of popular AI applications like Large Language Models may provide surrogate models for variables with many missing values. One should not confound the huge size of data- and knowledge bases with their effective information content. Hence, high redundancy in the data might be annoying for some purposes, but also increases the probability of information reconstruction, that is, the ability to correctly guess the content of indicators from other highly correlated information.
Regarding the comparison of the empirical results vis à vis the other empirical studies mentioned in this paper, we can emphasize that the results are innovative and have a high degree of significance due to the methodology applied in this paper. To our knowledge, the methodology has not been applied yet in economic sciences. The results update and extend the previous findings of empirical results in economics.
In this study, we contribute to the state-of-the-art with an empirical study that deals with the computational selection of different AI tools over a wide range of e-commerce indicators and a large set of country data frameworks in order to establish different patterns of country groups and variables for determining the impact of e-commerce on the digital economy.
An interesting further study will find out which of the countries are near the cluster boundaries and, hence, may change cluster membership with a higher probability. In general, such an approach will benefit greatly from characterizing the shapes of the high-dimensional data. This analysis might be straightforward for some clustering but poses a challenge for the general case of linkage types, similarity measures, and other specifications. Some functionality of advanced ML-related methods like topological data analysis (TDA) might be useful.
The diversity of the indicator group influences found in the various clusters may lead to the question of what the result of reducing the digital divide would be. Is there a clear reason to assume that reducing the digital divide and leveling out digital economy practices would also lead to more global convergence in more general economic terms or in terms of well-being, which is in everybody’s ultimate interest? The cluster data support the expectation of a partial reduction in the extent of the global digital divide (owing to successfully adopting formalized knowledge), but do lend support to the expectation of reducing the more general economic divide. A partial achievement out of the entrenched economic divide could be to foster open-source software development and training on a large scale. This may not please some established commercial interests, but it would enable a wealth of new commercial niche applications, which can increase and are more profitable in a digital economy.
To conclude, clustering producing country groupings can inform strategic international cooperation and can provide recommendations for businesses or governments, as was explained in Section 4 (Empirical Results). The relatively low discrepancy in indicator group E-Comm. Skills especially, which to a large extent reflects formalizable technical knowledge, may encourage both management and governments from countries in C1 to invest in concerted action and to eventually seek alliances with complementarily skilled companies. This should be possible at a fast pace and at moderate overall cost, as the supporting technologies required are widely available (as opposed to the high-risk, longer-term orientation of the “deep tech” domains, much less relevant to e-business).
6. Conclusions
Concerning the results and further work regarding the task of finding success factors for developing e-economies, we analyze a country-comparative, heterogeneous, publicly available data set, heavily “infected” by missing values. Such a situation of partial information is characteristic of structural evolutions of technology-intensive economic domains. The missing information may be caused by novelty, nondisclosure owing to privacy, among other reasons.
We show that a method of imputation for clustering missing-value-rich data, which recently (as of 2025) became available, is applicable for our data set, and it enables more types of clustering methods than without such imputations. The results so far produce country clusters, which are stable and more refined than those of more naive approaches. Essentially, two clusters emerge as stable, namely a bigger cluster of less developed countries and a somewhat smaller cluster of the developed ones. Indicator variables are identified that are of importance for the cluster formation via distance-correlation-based co-clustering. Data from the less developed countries have more variation, have more extremes (outliers), and have somewhat more missing values.
However, the good performers of the less developed countries are close to and in some dimensions superior to the weaker performers from the cluster of developed countries, indicating the possibility of cluster migration (in both directions).
In future work, we will characterize such “margin” countries in combination with a variable relevance detector.
In this study, we can observe that the connections to AI are computationally intensive (expensive) solutions that call for a connection to ML/AI.
Note that, within the context of applying AI/ML methods to economic data, there is—apart from the notorious missing values problem—also another potentially detrimental effect, namely that there are no useful “geometry” constraints and no structural “neighborhoods”. However, the existence of the latter brings about the widely admired effectiveness of various AIs, for instance, in fields like image processing. Hence, one should have dampened expectations concerning the extraction of surprising results from table-like data, which would be difficult to obtain otherwise.
The ubiquitous missing values problem and the sparsity of interesting economic data demand more, not less, numerical experiments. In the case of missing values, some new procedures are promising. The most flexible way of analyzing data is given by re-formulating a problem in terms of clustering (grouping). This allows for the data to be viewed via different types of constraint clustering [59] and can be connected to different forms of supervised or semi-supervised learning [60] as well as different types of topological data analysis (for a recent computational mathematics account [61] and some economic applications [62]).
In order to reach consensus clustering, a large set of experiments (concerning imputations; finding most relevant variables by, e.g., Shapley-value-inspired statistical procedures; etc.) is required. Its number tends to explode as one needs to traverse a deep tree of parameter combinations.
This, in turn, calls for procedures to automatically rule out unsuitable candidates from a large set of experiments, which is a potential task for AIs.
As a general conclusion, it can be emphasized that we have identified ways of teaching such AIs the procedures of what is “suitable” and “interesting” in the first place. Finally, finding adequate algorithms for both categories; adequate algorithms, in general; and appropriate optimization problems, in particular, may indeed be a tough problem.
The limitations of this study consist, especially, of the large number of NAs in the empirical data available on the international databases. This was the most significant disadvantage of the study, because if the databases had complete data, the application of AI on e-commerce in the digital economy could be counted among other possible applications and developments. Another limitation of this study is the small set of e-commerce indicators available worldwide and the relatively small disclosure of databases which can be accessed. Finally, the limited labor market structure regarding indicators for different periods and country sets of data was another limitation of this study in creating more focused research oriented toward the interconnections between the labor market, e-commerce, and AI applications and techniques.
This study will continue in the future with an investigation of the linkage between AI techniques and developments, the labor market, different types of country groups and subgroups, and how they impact customer expectations and other businesses’ strategies. Moreover, the interconnections between AI, e-commerce, and digital marketing must be taken into account for measuring companies’ performance regarding e-commerce applications. Finally, another interesting future research path relies on determining how management and marketing practices in different types of business sectors can influence e-commerce by using AI techniques and developments.
7. Theoretical and Practical Implications
In regard to the actionable insights, this paper offers a comprehensible overview of the AI usage for the development of a comprehensible framework of e-commerce indicators in the context of globalization and digitalization. In this sense, the insights must be oriented towards the construction of a sustainable digital economy, not only at the European Union level, but also on the international level, which must be seen as a quid pro quo in strengthening the labor market and offering new job opportunities and possibilities for the labor force worldwide.
The policy recommendations are enriched in this paper and focus on the need for the national authorities to adopt and support AI techniques for further development in different stages of the e-economy and digital economy. These techniques must be seen as a prerequisite for strengthening e-commerce worldwide, both in terms of indicators and applications with the direct target of a more friendly and sustainable economy. Furthermore, the authorities must encompass these features mentioned above to develop the labor market, with a direct focus on competition, fairness, and job diversification for the people and businesses worldwide.
The recommendation for countries in clusters lagging behind in digital transformation is for their labor and educational markets to be intervened in by transforming their qualification profiles. They should concentrate on offering and developing fast-lane qualifications in the subtopics of IT/AI, which are especially relevant for the digital economy, and which are not much better mastered by more developed countries. This may succeed through meaningful cooperation or an alliance formed with countries from cluster C2. However, an important strategic concern will be how to choose a sub-cluster of C2 to primarily engage with. This is a matter of cultural compatibility. Joining an alliance with many different participants of different cultural backgrounds may pose a serious barrier for countries from cluster C1. Joining a cooperation with a country from C23 may look at first daunting for the “weaker” partner from C1, but may be less so in the medium term, as many countries from C23 show a certain cultural openness and have a strong and basically impartial legal system that enforces contracts.
International organizations should foster alliances between countries from cluster C1 and appropriate partners from sub-clusters C21,…, C24. They should capitalize on the technical talent of less developed/emergent countries and the informal general expertise, especially of countries from sub-cluster C23. The focus should be on developing high-performance open access AI, for instance open access/open-source Large Language Models and other generative-AI-based modeling tools, which are fundamental for a future “win-win” global digital economy. The main challenge is that of avoiding agency asymmetry and guaranteeing fair, open access to digital tools.
Concerning the use of AI for enhancing economic data analysis, one may learn the following: economic and management data are sparse and contain substantial amounts of missing data entries. To be “sparse” does not necessarily mean that there are few cases or observations! Rather, in the case of sparseness, the number of cases is not substantially larger than the number of indicators, as classical statistics would require. Also, the missing data may exist, but they are not available or accessible, and they may occur randomly or more systematically. Here, AI cannot help in the sense of providing a magic algorithm which goes beyond what we described in this study using clusterMI for analysis tasks or similar procedures for prediction tasks (not touched upon here).
However, it is conceivable that AI may help in finding surrogates for the variables containing missing values by producing proxies of these variables from combining other (seemingly unrelated) variables present in the vast databases, which are implicitly incorporated in, say, Large Language Models. Furthermore, AI-related computational environments may ease the heavy load of training a very large number of data models on subsets of variables, for instance, to offer a stable response if multiple missing values are encountered at the prediction time. The usefulness of these approaches depends on the nature and (hidden) redundancy of the available data, and, for the time being, human judgment is still required. A similar argument applies concerning a possible useful cluster structure that cannot be accessed from the data, even when using different linkage methods (via hierarchical clustering).
Model-based clustering, e.g., centering (radial) basis functions on some data points, can escape the constraints posed by centroid-based clustering, but the hints of “usefully” parametrizing such models cannot be gained from unlabeled data (as are ours). A potential remedy may be obtained in future research by using partial labeling or constrained clustering, leading to semi-supervised data models. For instance, prior beliefs may be expressed via partial Cannot-Be or Must-Be constraints, in that one submits a small list reading “Country A and B Must (or Cannot) Be in the same cluster”, which can dramatically alter the non-constrained cluster composition. This, however, again introduces subjectivity into the analysis, which in turn calls for further resolution, for instance, by deciding to use representative beliefs.
Author Contributions
Conceptualization, F.C.D. and K.B.S.; methodology, F.C.D. and K.B.S.; software, K.B.S.; validation, F.C.D. and K.B.S.; formal analysis, F.C.D.; investigation, F.C.D.; resources, K.B.S.; data curation, K.B.S.; writing—original draft preparation, F.C.D. and K.B.S.; writing—review and editing, F.C.D. and K.B.S.; visualization, K.B.S.; supervision, F.C.D.; project administration, F.C.D. All authors have read and agreed to the published version of the manuscript.
Funding
This research received no external funding.
Institutional Review Board Statement
Not applicable.
Informed Consent Statement
Not applicable.
Data Availability Statement
The original data presented in the study are openly available at https://wits.worldbank.org/analyticaldata/evad-countrystats.aspx and https://data360.worldbank.org/en/prosperity.
Conflicts of Interest
The authors declare no conflicts of interest.
References
- Li, C.; Hao, R.; Zhang, C. Measuring customer experience in AI contexts: A scale development. J. Theor. Appl. Electron. Commer. Res. 2025, 20, 31. [Google Scholar] [CrossRef]
- Esmeli, R.; Gokce, A. An analysis of consumer purchase behavior following cart addition in e-commerce utilizing explainable artificial intelligence. J. Theor. Appl. Electron. Commer. Res. 2025, 20, 28. [Google Scholar] [CrossRef]
- Zhang, Y.; Liu, C. Unlocking the potential of artificial intelligence in fashion design and e-commerce applications: The case of midjourney. J. Theor. Appl. Electron. Commer. Res. 2024, 19, 654–670. [Google Scholar] [CrossRef]
- Lazic, A.; Milic, S.; Vukmirovic, D. The future of electronic commerce in the IoT environment. J. Theor. Appl. Electron. Commer. Res. 2024, 19, 172–187. [Google Scholar] [CrossRef]
- Gogonea, R.M.; Moraru, L.C.; Bodislav, D.A.; Păunescu, L.M.; Vlăsceanu, C.F. Similarities and disparities of e-commerce in the European Union and post-pandemic period. J. Theor. Appl. Electron. Commer. Res. 2024, 19, 340–361. [Google Scholar] [CrossRef]
- Gherghina, Ș.C.; Botezatu, M.A.; Simionescu, L.N. Exploring the impact of electronic commerce on employment rate: Panel data evidence from the European Union countries. J. Theor. Appl. Electron. Commer. Res. 2021, 16, 3157–3183. [Google Scholar] [CrossRef]
- Zarifhonarvar, A. Economics of ChatGPT: A labor market view on the occupational impact of artificial intelligence. J. Electron. Bus. Digit. Econ. 2024, 3, 100–116. [Google Scholar] [CrossRef]
- Wang, X.; Chen, M.; Chen, N. How artificial intelligence affects the labour force employment structure from the perspective of industrial structure optimisation. Helyon 2024, 10, e26686. [Google Scholar] [CrossRef]
- Liang, Y. The impact of artificial intelligence on employment and income distribution. J. Educ. Humanit. Soc. Sci. 2024, 27, 166–171. [Google Scholar] [CrossRef]
- Huang, Y. The Labor Market Impact of Artificial Intelligence: Evidence from US Regions; International Monetary Fund: Washington, DC, USA, 2024; pp. 1–50. [Google Scholar]
- Bănescu, C.E.; Țițan, E.; Manea, D. The impact of e-commerce on the labor market. Sustainability 2022, 14, 5086. [Google Scholar] [CrossRef]
- Shen, Y.; Zhang, X. The impact of artificial intelligence on employment: The role of virtual agglomeration. Humanit. Soc. Sci. Commun. 2024, 11, 122. [Google Scholar] [CrossRef]
- Zhang, Z. The impact of the artificial intelligence industry on the number and structure of employments in the digital economy environment. Technol. Forecast. Soc. Change 2023, 197, 122881. [Google Scholar] [CrossRef]
- Filippucci, F.; Gal, P.; Jona-Lasinio, C.; Leandro, A.; Nicoletti, G. The impact of artificial intelligence on productivity, distribution and growth: Key mechanisms, initial evidence and policy changes. OECD Artif. Intell. Pap. 2024, 15, 1–63. [Google Scholar]
- Mehdi, Z.S.; Rahman, S. The impact of artificial intelligence and emerging technologies on international electronic commerce. SSRN 2024, 1–13. [Google Scholar] [CrossRef]
- Damioli, G.; Roy, V.V.; Vertesy, D. The impact of artificial intelligence on labor productivity. Eurasian Bus. Rev. 2021, 11, 1–25. [Google Scholar] [CrossRef]
- Carbonero, F.; Davies, J.; Ernst, E.; Fossen, F.M.; Samman, D.; Sorgner, A. The impact of artificial intelligence on labor markets in developing countries: A new method with an illustration for Lao PDR and urban Viet Nam. J. Evol. Econ. 2023, 33, 707–736. [Google Scholar] [CrossRef]
- Agrawal, A.; Gans, J.S.; Goldfarb, A. Artificial intelligence: The ambiguous labor market impact of automating prediction. J. Econ. Perspect. 2019, 33, 31–50. [Google Scholar] [CrossRef]
- Gu, T.T.; Zhang, S.F.; Cai, R. Can artificial intelligence boost employment in service industries? Empirical analysis based on China. Appl. Artif. Intell. 2022, 36, 2080336. [Google Scholar] [CrossRef]
- Green, A. Artificial intelligence and the changing demand for skills in the labour market. OECD Artif. Intell. Pap. 2024, 14, 1–55. [Google Scholar]
- Pouye, M.B. The COVID-19 impact on digital & e-commerce. J. Econ. Bibliogr. 2021, 8, 82–96. [Google Scholar]
- Anwansedo, F.; Gbandebo, A.D.; Akinwande, O.T. Exploring the role of AI-enhanced online marketplaces in facilitating economic growth: An impact analysis on trade relations between the United States and Sub-Saharan Africa. Rev. De Gest. Soc. E Ambient. 2024, 18, e07494. [Google Scholar] [CrossRef]
- Caragnano, R. Artificial intelligence and the labour market: Impact and issues. Athens J. Law 2024, 10, 465–476. [Google Scholar] [CrossRef]
- Alqudah, A.M.A.; Jaradat, Y.M.; AlObaydi, B.A.A.; Alquadah, D.; Al Qudah, E.A.; Jarah, B.A.F. Artificial intelligence in design and impact of electronic marketing in companies. J. Ecohumanism 2024, 3, 170–179. [Google Scholar] [CrossRef]
- Erdogan, U. A systematic review on the use of artificial intelligence in e-commerce. J. Soc. Econ. Manag. 2023, 4, 184–197. [Google Scholar] [CrossRef]
- Areiqat, A.Y.; Alheet, A.F.; Qawasmeh, R.A.A.; Zamil, A.M. Artificial intelligence and its drastic impact on e-commerce progress. Acad. Strateg. Manag. J. 2021, 20, 1–11. [Google Scholar]
- Saam, M. The impact of artificial intelligence on productivity and employment—How can we assess it and what can we observe? Intereconomics 2024, 59, 22–27. [Google Scholar] [CrossRef]
- Aldaraso, I.; Doerr, S.; Gambacorta, L.; Rees, D. The Impact of Artificial Intelligence on Output and Inflation. BIS Working Paper No 1179, 2024; pp. 1–38. Available online: https://www.bis.org/publ/work1179.htm (accessed on 17 April 2025).
- Joamets, K.; Chochia, A. Artificial intelligence and its impact on labour relations in Estonia. Slovak J. Political Sci. 2020, 20, 255–277. [Google Scholar] [CrossRef]
- Monjur, E.I.; Rifat, A.H.; Islam, R.; Bhuiyan, R. The impact of artificial intelligence on international trade: Evidence from B2C giant e-commerce (Amazon, Alibaba, Shopify, Ebay). Open J. Bus. Manag. 2023, 11, 2389–2401. [Google Scholar] [CrossRef]
- Jain, A. Impact of Digitalization and Artificial Intelligence as Causes and Enablers of Organizational Change; Report prepared for the Federation of International Civil Servants’ Associations; Nottingham University Business School: Nottingham, UK, 2021; pp. 1–38. [Google Scholar]
- Song, C.; Wei, C. Unemployment or out of the labor force: A perspective from time allocation. Labour Economics. 2019, 61, 101768. [Google Scholar] [CrossRef]
- Li, L.; Wang, Y.; Zhang, Y. Analysis of the application of artificial intelligence in cross-border e-commerce. Adv. Soc. Sci. Educ. Humanit. Res. 2020, 517, 667–670. [Google Scholar]
- Babayev, N.; Israfilzade, K. Creating complexity matrix for classifying artificial intelligence applications in e-commerce: New perspectives on value creation. Jlecon 2023, 10, 141–156. [Google Scholar] [CrossRef]
- Yasar, E.C. How the AI Act applies to e-commerce. Jipitec 2024, 15, 38–55. [Google Scholar]
- Bauer, A.; Guerrico, S.F. Effects of E-Commerce on Local Labour Markets; Discussion Paper No. 16345; IZA Institute of Labour Economics: Bonn, Germany, 2023. [Google Scholar]
- Argiles-Bosch, J.; Ravenda, D.; Garcia-Blandon, J. E-commerce and labour tax avoidance. Crit. Perspect. Account. 2021, 81, 102202. [Google Scholar] [CrossRef]
- Terzi, N. The impact of e-commerce on international trade and employment. Procedia Soc. Behav. Sci. 2021, 24, 745–753. [Google Scholar] [CrossRef]
- Gupta, S.; Kushwaha, P.S.; Badhera, U.; Chatterjee, P.; Gonzalez, E.S. Identification of benefits, challenges, and pathways in e-commerce industries: An integrated two-phase decision-making model. Sustain. Oper. Comput. 2023, 4, 200–218. [Google Scholar] [CrossRef]
- Wegmann, M.; Zipperling, D.; Hillenbrand, J.; Fleischer, J. A review of systematic selection of clustering algorithms and their evaluation. arXiv 2021, arXiv:2106.12792. [Google Scholar] [CrossRef]
- Yin, H.; Aryani, A.; Petrie, S.; Nambissan, A.; Astudillo, A.; Cao, S. A rapid review of clustering algorithms. arXiv 2024, arXiv:2401.07389. [Google Scholar] [CrossRef]
- Zhou, S.; Hu, H.; Zheng, Z.; Chen, J.; Li, Z.; Bu, J.; Wnag, X.; Ester, M. A comprehensive survey on deep clustering: Taxonomy, challenges, and future directions. arXiv 2022, arXiv:2206.07579. [Google Scholar] [CrossRef]
- Lall, R.; Robinson, T. The MIDAS touch: Accurate and Scalable Missing Data Imputation with Deep Learning. Political Anal. 2021, 30, 179–196. [Google Scholar] [CrossRef]
- Audigier, V.; Kim, H.J. clusterMI: Cluster Analysis with Missing Values by Multiple Imputation. 2025. Available online: https://cran.r-project.org/web/packages/clusterMI/index.html (accessed on 17 April 2025).
- Audigier, V. Clustering on Incomplete Data Using ClusterMI, 10èmes Rencontres R. 13 June 2024. Available online: https://hal.science/hal-04550305v1/file/rencontresR_slides_2024-12.pdf (accessed on 17 April 2025).
- Audigier, V.; White, I.R.; Jolani, S.; Debray, T.P.A.; Quartagno, M.; Carpenter, J.; van Buuren, S.; Resche-Rigon, M. Multiple Imputation for Multilevel Data with Continuous and Binary Variables. Stat. Sci. 2018, 33, 160–183. [Google Scholar] [CrossRef]
- European-DeepTech. 2023. Available online: https://dealroom.co/uploaded/2023/01/Dealroom-European-Deep-Tech-2023report.pdf (accessed on 18 February 2025).
- Saar-Tsechansky, M.; Provost, F. Handling Missing Values when Applying Classification Models. J. Mach. Learn. Res. 2007, 8, 1623–1657. [Google Scholar]
- Zeng, S.; Fu, Q.; Haleem, F.; Han, Y.; Zhou, L. Logistics density, e-commerce and high-quality economic development: An empirical based on provincial panel data in China. J. Clean. Prod. 2023, 426, 138871. [Google Scholar] [CrossRef]
- Yapar, B.K.; Bayrakdar, S.; Yapar, M. The role of taxation problems on the development on e-commerce. Procedia Soc. Behav. Sci. 2015, 195, 642–648. [Google Scholar] [CrossRef]
- Choe, C.; Kang, D.; Lee, H. The impact of e-commerce on the local retail employment: Examining heterogenous impacts by employment and regional types. Glob. Econ. Rev. 2024, 53, 99–115. [Google Scholar] [CrossRef]
- Hecker, D.E. Employment impact of electronic business. Mon. Labor Rev. 2001, 124, 3–16. [Google Scholar]
- Ridhwan, M.M.; Suryahadi, A.; Rezki, J.F.; Pekerti, I.S. The Labor Market Impact of COVID-19 and the Role of E-Commerce Development: Evidence from Indonesia. Bank Indonesia Working Paper No 10. 2021. Available online: https://www.bi.go.id/id/publikasi/kajian/Documents/The_Labor_Market_Impact_of_COVID_19_and_The_Role_of_E-Commerce_Development_Evidence_from_Indonesia.pdf (accessed on 17 April 2025).
- Bertschenk, I.; Fryges, H.; Kaiser, U. B2B or Not to Be: Does B2B E-Commerce Increase Labour Productivity? ZEW Discussion Papers No. 04-45. 2004. Available online: https://www.zew.de/en/publications/b2b-or-not-to-be-does-b2b-e-commerce-increase-labour-productivity (accessed on 17 April 2025).
- Santos, K.R.D.; Gabinete, F.E.; Red, M.F.; Camaro, P.J. The implications of e-commerce on labor productivity in the Philippines. Int. J. Soc. Manag. Stud. 2022, 3, 75–86. [Google Scholar]
- Wen, H.; Qui, A.; Huang, Y. Impact of e-commerce development on rural income: Evidence from countries in revolutionary old areas of China. Econ. Labour Relat. Rev. 2024, 35, 345–367. [Google Scholar] [CrossRef]
- Bosch, J.M.A.; Blandon, J.G.; Ravenda, D. Cost behavior in e-commerce firms. Electron. Commer. Res. 2023, 23, 2101–2134. [Google Scholar] [CrossRef]
- Sprague, J.; Sathi, S. Transnational Amazon: Labor Exploitation and the Rise of E-Commerce in South Asia; Pluto Press: London, UK, 2020. [Google Scholar]
- Basu, S.; Davidson, I.; Wagstaff, K.L. Constrained Clustering—Advances in Algorithms, Theory and Applications; Chapman & Hall/CRC Press, Taylor & Francis Group: Boca Raton, FL, USA, 2009. [Google Scholar]
- Bishop, C.M. Pattern Recognition and Machine Learning; Springer: Berlin/Heidelberg, Germany, 2006. [Google Scholar]
- Dey, T.L.; Wang, Y. Computational Topology for Data Analysis; Cambridge University Press: Cambridge, UK, 2022. [Google Scholar]
- Schebesch, K.B.; Stecking, R. Topological Data Analysis for Extracting Hidden Features of Client Data. In Proceedings of the Operations Research Proceedings 2015, Vienna, Austria, 1–4 September 2015; pp. 483–489. [Google Scholar]
Disclaimer/Publisher’s Note: The statements, opinions and data contained in all publications are solely those of the individual author(s) and contributor(s) and not of MDPI and/or the editor(s). MDPI and/or the editor(s) disclaim responsibility for any injury to people or property resulting from any ideas, methods, instructions or products referred to in the content. |
© 2025 by the authors. Licensee MDPI, Basel, Switzerland. This article is an open access article distributed under the terms and conditions of the Creative Commons Attribution (CC BY) license (https://creativecommons.org/licenses/by/4.0/).