Article

An Extended FullEX Method: An Application to the Selection of Online Orders Distribution Modes Based on the Shared Economy

by
Milena Ninović
1,
Momčilo Dobrodolac
2,*,
Sara Bošković
3,
Đorđije Dupljanin
1,
Dragan Lazarević
4 and
Slaviša Dumnić
1
1
Faculty of Technical Sciences, University of Novi Sad, 21000 Novi Sad, Serbia
2
Department of Mathematics SIMATS Engineering, Saveetha Institute of Mechanical and Technical Sciences, Chennai 602105, Tamil Nadu, India
3
Faculty of Transport Engineering, University of Pardubice, 53210 Pardubice, Czech Republic
4
Faculty of Transport and Traffic Engineering, University of Belgrade, 11000 Belgrade, Serbia
*
Author to whom correspondence should be addressed.
J. Theor. Appl. Electron. Commer. Res. 2025, 20(3), 207; https://doi.org/10.3390/jtaer20030207
Submission received: 27 April 2025 / Revised: 20 July 2025 / Accepted: 5 August 2025 / Published: 7 August 2025

Abstract

Urbanization and the rapid growth of e-commerce have significantly increased delivery volumes in cities, creating challenges in terms of cost, efficiency, and sustainability in last-mile delivery (LMD). To address these challenges, this paper proposes an innovative methodological framework for selecting optimal delivery strategies in urban environments, grounded in the principles of collaboration. The framework integrates an Extended FullEx method, developed to calculate criteria weights while accounting for expert reputation based on education and experience, with the MARCOS multi-criteria decision-making (MCDM) method used to rank delivery strategies. The Extended FullEx method proposed in this paper differs from the original FullEx by providing two improvements. The first concerns the introduction of the normalization procedure in the calculation of experts’ reputations, while the second addresses the different scoring of educational degrees, providing a more precise mathematical basis for the process. Four collaborative delivery strategies are evaluated against twelve sustainability-related criteria identified through an extensive literature review. The proposed framework is applied to a real-life case study in Novi Sad, Republic of Serbia. Results indicate that the most suitable delivery strategy is a hybrid model that combines the use of a consolidation center with smaller urban delivery hubs, providing practical insights for enhancing the sustainability and efficiency of urban delivery. This study contributes both methodologically, by advancing MCDM techniques, and practically, by offering decision-makers a comprehensive tool that integrates subjective expert knowledge and objective criteria assessment in the selection of sustainable LMD solutions.

1. Introduction

The rapid growth of e-commerce, accelerated by global events such as the COVID-19 pandemic, has significantly increased the demand for efficient urban deliveries. As consumer expectations rise in terms of speed, convenience, and environmental responsibility, last-mile delivery (LMD) has emerged as a critical and expensive component of the logistics process [1].
In this regard, city logistics, a specific branch of logistics, focuses on the efficient management of transportation and goods movement within the urban environment. City logistics is often referred to as urban logistics and has developed due to changes in citizen behavior, including e-commerce, and technological evolution, enabling innovative delivery methods such as electric vehicles, autonomous vehicles, and drones [2].
For urbanization to be sustainable, it requires careful planning to mitigate negative impacts and support community development. The lack of a theoretical and scientific foundation, as well as the failure to apply principles of sustainable and smart development in the planning of parcel delivery in urban areas, without considering the interests of all relevant stakeholders in city logistics, negatively affects the sustainable development of cities. Therefore, it is essential to develop methods for managing the flow of parcels in urban environments to enhance the sustainability of city logistics.
The main aim of this paper is to propose a methodological framework to be used in the prioritization of distribution modes of online orders in cities. There are several main contributions in the presented research: (i) By an extensive literature review, we identify four shipment delivery strategies and twelve criteria to evaluate the considered alternatives. (ii) We propose an Extended Fullex method, which represents a methodological contribution in the field of multi-criteria decision-making (MCDM) theory. (iii) We illustrate the applicability of the proposed approach based on combined Extended FullEx—MARCOS methods, solving the problem of evaluation of delivery strategies in the city of Novi Sad.
These contributions address both theoretical and practical aspects of urban logistics decision-making. Although various MCDM methods have previously been applied to LMD problems, existing models rarely integrate expert subjectivity, reputational weighting, and normalization robustness within a unified framework. This study addresses that gap by introducing a novel hybrid model specifically tailored to the shared economy context of last-mile delivery.
To the best of our knowledge, the proposed methodology has not been previously applied to any decision-making problem. This paper presents the first–time explanation and practical application of the Extended FullEX method, illustrating its feasibility and relevance through an empirical case study.

2. Theoretical Background of the Considered Problem

2.1. Urbanization, E-Commerce, and LMD Challenges

Urbanization, the process of progressive growth and development of urban areas, induces various economic, social, ecological, and spatial changes. Currently, more than half of the world’s population lives in urban areas, and in some regions, the percentage is significantly higher. For example, this share in the European Union is estimated to be 74% [3,4]. The growth of urbanization increases transportation activities, which leads to harmful environmental effects [5]. According to the United States Environmental Protection Agency, it was projected in 2020 that 33% of all CO2 emissions would originate from transportation, 31% from electricity generation, 16% from industry, 12% from commercial and residential buildings, and 8% from the combustion of non-fossil fuels.
Urbanization, together with globalization, has led to significant changes in the functioning of consumers and business entities, including a rise in e-commerce. The interesting facts are that in Europe, more than 74% of internet users made online purchases in 2021, in the United States, consumers spent approximately $1.03 trillion online in 2022, and in China, around 7.8% of the total retail sales of consumer products are performed online [6].
Consequently, such changes drive an increase in logistics activities, particularly last-mile delivery (LMD), which encompasses the delivery of shipments from the final logistics hub to the end destination [7,8]. The development of city centers has been significantly influenced by urbanization, which has led to a concentration of businesses in these areas. As the number of businesses grows, their demand for deliveries also grows, resulting in an increased volume of shipments entering the city center. This influx contributes to traffic congestion, creating bottlenecks that, in turn, elevate noise levels and emissions of harmful gases. As a result, dissatisfaction with the quality of life among city residents is becoming more pronounced.
The development of cities is crucial for the global economy and social dynamics; however, it brings a challenge to sustainability at the same time. Urban areas, as epicenters of economic development, face numerous challenges due to rapid population growth. The document, “Sustainable Europe by 2030”, adopted by the European Commission in 2019, emphasizes the key role of cities in sustainable urban planning, which includes integrated spatial planning and addressing mobility and infrastructure issues. Urban areas contribute to more than 70% of the total global CO2 emissions, with the majority originating from industrial and motorized transportation systems [9].
Globalization has also led to an increase in e-commerce, resulting in a rise in the number of shipments, particularly in urban areas. A significant portion of urban freight transportation volumes is generated by parcel deliveries [10]. According to the Universal Postal Union, more than one billion parcels are delivered to home or business addresses every working day. The ability to fulfill and deliver online orders plays a key role in ensuring business profitability [11]. Failing to meet end-user expectations in delivery can lead to dissatisfaction, negative reviews, and, consequently, a loss of market share [12].
LMD involves delivering shipments to final destinations while meeting end-user preferences. LMD is a crucial element of any supply chain network, and its importance was especially evident during sudden surges in demand, such as those experienced during the COVID-19 pandemic and the subsequent increase in demand for home delivery services. Global demand for LMD is expected to grow [7]. LMD has become a key source of market differentiation, prompting retailers to invest in various delivery innovations, such as buy-online–pickup-in-store, autonomous delivery solutions, lockers, and free delivery upon meeting minimum purchase levels [13].
LMD is considered an extremely inefficient and costly process, often accounting for 50–75% of total supply chain costs [14,15]. Despite this, LMD significantly impacts customer satisfaction [16]. Operations conducted during LMD create environmental and social effects, such as air pollution, noise, traffic accidents, and road congestion. It is noticeable that under current delivery conditions in cities, two or more vehicles from different delivery companies can be found on the same street or even at the same address simultaneously. This obviously represents an example of poor organizational strategy. The use of human-operated delivery vehicles and demand across a wide delivery area makes delivery an expensive process, prompting researchers to seek solutions to reduce congestion, environmental impact, and adverse health effects in urban areas [8,17]. Without sustainable delivery economics, providing last-mile service will struggle to survive [7].
Companies are exploring new ways to create value through emerging technologies, while researchers are striving to propose innovative solutions for optimizing LMD. These efforts are focused on reducing costs, improving efficiency, minimizing environmental impact, and enhancing customer satisfaction [18].

2.2. Possibilities for LMD Improvement

Potential solutions for improving LMD include the application of advanced technologies such as drones, smart routing, dynamic pricing, and data analytics to optimize deliveries [19,20]. Using electric vehicles, bicycles, and other environmentally friendly modes of transport reduces the negative impact on the environment [8]. Locker systems in public places provide secure parcel delivery [21,22]. The use of autonomous vehicles for delivery can exemplify the application of artificial intelligence for these purposes [22,23]. Many delivery companies have already tested the use of drones for delivering parcels to end users. There is also an idea to use drones for deliveries to hard-to-reach locations [20,22].
Lyons and McDonald [24] identified 22 LMD strategies and grouped them into four categories: technological and routing advances in city logistics, innovative vehicles, urban goods consolidation, and emerging planning tools and policies. They concluded that urban consolidation centers, cargo bikes, and collaborative delivery strategies have attracted significant attention. We will particularly analyze the collaboration principle to improve the LMD, since this is one of the main points of interest of this paper.

2.3. Collaboration Strategies for LMD Improvement

There are various models of collaboration among businesses aimed at sharing resources and relocating certain business processes to improve efficiency and sustainability across the three dimensions of sustainability: economic, environmental, and social. Collaboration is considered the best approach for achieving better outcomes than could be achieved independently. The benefits of collaboration include finding innovative and creative solutions to complex problems, reducing risks, achieving more efficient results, and better utilizing resources through sharing and eliminating redundancies. In their study, Montoya-Torres et al. [25] identified collaboration, along with the adoption of technologies and the creation of new knowledge, as key topics to consider during the pandemic circumstances.
During the last two decades, scientists have devoted significant attention to improving distribution systems through collaboration, coined the term “collaborative distribution”, and recognized it as one of the future trends in transportation and logistics [26]. Collaborative distribution can take a vertical form, which focuses on beneficial vertical relationships between actors within the supply chain [27], or a horizontal form, which focuses on collaboration between two or more actors operating at the same level, regardless of whether they are competitors [28]. Manufacturers and retailers have been collaborating vertically for years, not only in distribution but also in forecasting and inventory management. Research by Argyropoulou et al. [29] recommends horizontal collaboration as a potential solution for improving service quality. Horizontal collaboration helps stakeholders better coordinate routes, increase fleet utilization, reduce traffic congestion and emissions, and simultaneously enhance end-user satisfaction. While horizontal collaboration has attracted significant interest from researchers, its implementation in the market remains limited [30].
Dahl and Derigs [31] argue that collaboration can increase the efficiency of LMD. As one form of collaboration among delivery operators, Deng et al. [32] proposed consolidation, which can make LMD in urban areas economically, socially, and environmentally sustainable. In their study, Deng et al. (2021) [32] found that the potential benefits of urban consolidation centers (UCCs) can arise either from improved vehicle capacity utilization or by shifting the more expensive storage costs from customers in the city center to the less expensive UCC rent costs, due to a less centralized location and/or government subsidies or other cost-sharing mechanisms. However, these benefits are realized when there is a sufficient volume of shipments or a high customer density (i.e., high delivery volume) in the service area.

2.4. Distribution Modes Based on the Sorting Center Concept

One of the key issues in organizing sustainable parcel delivery in urban areas is the concept of sorting or delivery centers [33]. The research by Jana et al. [33] proposes a unique consolidation center, a new organizational concept for parcel delivery in sustainable and smart cities, where all courier companies jointly perform consolidation activities and prepare for zero-emission vehicle deliveries in a centralized manner. This strategy is referred to as “inner-city centers”. To implement this sustainable strategy in practice, city authorities should be involved in investing in new facilities that would later be rented out to all interested parties, such as postal and logistics companies.
Zissis et al. [34] proposed the concept of micro-hubs as an intermediary level between sorting centers and end-user locations. Micro-hubs are shared transshipment facilities that can be used by competing operators, reducing travel distance by up to 10%. They are located near the central urban areas, enabling more efficient delivery. The main drawbacks of this approach are the required investments in micro-hubs and the challenges in constructing such facilities in urban areas. Zissis et al. [34] considered that collaboration could bring benefits to all participants in the supply chain, as well as to the environment in terms of reduced greenhouse gas emissions due to the overall reduction in distance traveled. The study by Ballot and Fontane [35] found that potential demand sharing could lead to at least a 25% reduction in CO2 emissions, although economic benefits were not considered. However, the impact of collaboration in terms of reducing operational costs and generating environmental benefits has also been discussed in the literature [36].
It should be noted that implementing collaboration is much easier today than it was a few years ago due to the availability of technological tools for real-time information sharing [37]. Additionally, obtaining high-quality solutions for complex optimization problems in a short time frame is much easier than before. Technological advancements can enhance collaboration between stakeholders in delivery. Software incorporating intelligent routing algorithms, coordinated collection, flexible delivery time allocation, and customer communication is now easier to implement, given the increasing availability and standardization of platforms that enable this.
Although collaboration may seem straightforward due to its potential financial and environmental benefits, examples of collaboration in the delivery sector are rare. The study of collaboration among delivery service providers has also not been extensively explored in academic circles. This was the motive for the authors to investigate the considered problem further in this paper.

2.5. Application of MCDM and Other Operations Research Methods in Last-Mile Delivery Optimization

Recent studies on last-mile delivery optimization increasingly emphasize innovative and collaborative approaches in urban logistics. A notable research stream focuses on the truck–drone routing problem (TDRP), with contributions by Wang et al. [38] in 2019; Liang and Luo [39], Salama and Srinivas [40], and Wang et al. [41] in 2022; Gu et al. [42] in 2023; and Luo et al. [43] in 2025. These studies aim to improve coordination between trucks and drones to enhance operational efficiency, reduce costs, and extend reach to otherwise inaccessible areas, albeit with technological and temporal constraints.
Expanding the scope of routing problems, Wang et al. [44] introduced a two-echelon multi-period location-routing model (2E-MPLRP), which integrates periodic facility location decisions and vehicle routing with shared transport resources. In another contribution, Wang et al. [45] tackled the collaborative multi-depot electric vehicle routing problem with shared charging stations (CMEVRPTW-SCS), utilizing the Gaussian mixture clustering and a hybrid optimization algorithm combining an improved multi-objective genetic algorithm and tabu search. A Shapley value model was employed for equitable profit distribution. Further, the problem of green logistics was addressed through eco-packaging strategies, minimizing generalized costs via a state–space–time (SST) network and NSGA-II algorithm [46]. More recently, in the year 2024, Wang et al. [47] focused on optimizing reverse logistics using intelligent recycling price mechanisms (MDVRPTW-IRPTRS), employing 3D k-means clustering and a self-adaptive genetic algorithm–particle swarm optimization (SGA-PSO) approach. Collectively, these contributions underscore the importance of collaboration, sustainability, and intelligent algorithmic design in shaping the future of urban logistics.
Within this evolving context, multi-criteria decision-making methods have become essential tools for resolving complex trade-offs in LMD. For instance, Aljohani and Thompson [48] utilized the TOPSIS method to evaluate freight consolidation centers, while Švadlenka et al. [22] assessed sustainable LMD alternatives to identify optimal modes of transportation. Li et al. [49] developed a Bayesian-inspired MCDM framework for evaluating delivery personnel competencies. Simić et al. [2] employed a picture fuzzy WASPAS method to determine the most suitable LMD mode. In addition, Bošković et al. [50] investigated the selection of electric vehicles for LMD, and in a separate study, the same authors evaluated investment strategies for cargo bikes to improve LMD efficiency.
Several subjective MCDM methods used to determine criteria weights differ significantly in their comparison procedures and the degree to which they incorporate expert-related variables. The Analytic Hierarchy Process (AHP) transforms expert judgments into a 1–9 scale (Saaty’s scale) through pairwise comparisons. The SWARA method sequentially ranks criteria by evaluating their relative importance, excluding those deemed less relevant. The Best–Worst Method (BWM) also employs pairwise comparisons but anchors them on the most and least important criteria, reducing inconsistency and bias in data-scarce settings. The FUCOM approach minimizes the number of required comparisons (n − 1) using integer or decimal scales, allowing for more flexible ranking.
A recent methodological advancement, the FullEX technique, introduces Fuller’s triangle as a novel basis for pairwise comparison. Unlike traditional methods, FullEX integrates expert metadata, specifically academic background and professional experience, into the weighting process [50]. A similar technique is named CIMAS; however, it integrates only professional experience [51]. A comparative overview of these methods is provided in Table 1.
As can be concluded, the Fullex method goes the furthest in incorporating certain characteristics of interviewed experts into the calculation procedure. However, we noticed two research gaps that need to be addressed. The first relates to the description of an expert based on their education. In the original Fullex method, the degree is evaluated; however, the time spent to achieve such an education is not considered. We believe this aspect is important and that the years invested in education should have a certain mathematical basis for quantification of this parameter. The second research gap is identified in the procedure of unifying the two expert characteristics (work experience and education) into one value. To provide more accurate results, the assumption is that the two obtained values should be normalized before further calculation to acquire more precise results. To fulfill the mentioned research gaps, we propose the Extended Fullex method in this paper. To illustrate the complete procedure in the decision-making, we combine the Extended FullEX and MARCOS methods to evaluate delivery strategies in the context of a shared economy.

3. Methodology

In real situations, the decision-making process often involves conflicting interests and priorities. Decision-making, aimed at choosing the best solution, requires making decisions where the positive outcomes outweigh potential losses. Decision-makers strive to make choices that create optimal solutions.
LMD has become increasingly important due to its scale, high costs, and air pollution. Decision-making in the area of LMD represents an increasingly challenging task that encompasses solving complex problems, balancing conflicting objectives, and handling diverse types of data and information. Both in literature and practice, there are various models for optimizing and improving the efficiency of postal and delivery services. These models are often associated with solving problems related to location, routing, resource utilization, environmental impact, and more [52,53,54].
This paper analyzes the challenges and potential solutions for urban delivery. The key focus is the identification of sustainable strategies for urban delivery, encompassing environmental, technical, financial, and social aspects. The delivery models analyzed promote collaboration among delivery companies. Through a case study in Novi Sad, the criteria definition is used to explore priorities in establishing sustainable strategies under real-world conditions. This research employs multi-criteria decision-making methods, Extended FullEx and MARCOS, to evaluate various parcel delivery models in an urban setting. The ultimate goal is to find an optimal solution that will improve delivery services and meet the needs of relevant stakeholders. The research configuration is given in Figure 1.

3.1. A Proposal of Extended FullEX Method for Determining Criteria Weights

In this paper, we propose an Extended FullEX method for criteria weights calculation. The FullEX method is a recently developed MCDM technique used for determining the importance of criteria based on expert inputs. It relies on pairwise comparisons and incorporates expert reputation into the weighting process. Unlike traditional methods that assume equal credibility among experts, FullEX introduces a mechanism for calculating and applying expert reputations based on measurable parameters such as education level and professional experience. In its extended version, proposed in this study, this approach improves the realism and objectivity of the weighting process while avoiding the inconsistencies of ratio-scale judgments often found in methods like AHP. The original FullEx method was proposed by Bošković et al. [50]. Here, we will present the procedure of an extended version, using the same steps as in the original approach; however, we propose a change in Step 2, where the experts’ reputations are calculated.
Step 1. Generate an initial input matrix
To generate the initial data matrix, we should interview certain experts. They should perform a pairwise comparison of all criteria between themselves. A more important one in the compared pair should be determined. To ensure consistency and simplicity, a predefined binary scale was used in the pair-wise comparisons. Experts were asked to select which criterion in each pair was more important, without providing numerical intensity. This binary approach simplifies the evaluation process and inherently reduces inconsistency issues that occur in methods like AHP. However, the inconsistency rate will be calculated for the Extended FullEx as well, and the results will be presented in the discussion part of this paper.
Such a comparison in a case study provided in this research will be provided in Appendix A, Appendix B and Appendix C for the initial group of experts and D-F for the control group, where the chosen more important criterion is blue-colored. The structure of answers is triangular because, in every subsequent two lines, there is one criterion less to compare. Such a structure is illustrated in Figure 2.
By summarizing the number of times each criterion is prioritized in pair-wise comparisons, considering each expert, we obtain the initial input data matrix, as presented in Table 2.
Step 2. Assessment of experts’ reputations
As previously mentioned, here we introduce a different procedure compared to the original Fullex approach. However, for a better understanding, we will present here the original procedure first, and after that propose an improvement, i.e., the extended version of the Fullex method.
To calculate the experts’ reputations according to the original procedure, it is required to calculate the level of competence of each expert ( E i ). To achieve this, two parameters should be considered: the number of years of working experience in the considered field and educational degree, as shown in Equation (1).
E i = Y E i + E D i 2 ,   i = 1 ,   2 , , q .
where Y E i denotes the number of years of experience of the i-th expert, while E D i is the educational degree of the i-th expert. In the original FullEx framework, educational qualifications are evaluated on a three-point scale: a score of one denotes a bachelor’s degree, two indicates a master’s degree, and three signifies a doctoral (Ph.D.) degree. After calculating the level of competence of each expert, the reputation of the i-th expert is calculated by applying Equation (2).
W E i = E i i = 1 q E i ,   i = 1 , 2 , , q .
As explained when describing the research gap in Section 2.5, there is a space for methodological improvement in Step 2, which motivated the authors to propose the Extended FullEx method. Accordingly, we propose two changes. The first is the introduction of the normalization procedure, and the second relates to the different scoring of educational degrees, establishing a more accurate mathematical rationale in this procedure.
We will divide Step 2 into four substeps. Since Step 2 should combine two characteristics of experts—years of experience and educational degree—we will first introduce the normalization procedure of each of these two parameters and explain the difference in scoring educational degrees.
Step 2.1. Normalization of the years of experience
The number of years of expert experience in the considered field ( Y E i ) is a significant factor in assessing the expert’s reputation. To be comparable with the next parameter of assessment, we will perform the normalization procedure using Equation (3). The obtained normalized value of years of expert experience is marked with Y E N i .
Y E N i = Y E i i = 1 q Y E i ,   i = 1,2 , , q .
Step 2.2. Assigning the points for an educational degree
To offer a more appropriate mathematical justification for educational degree scoring, we will assign point values to each educational level based on the typical number of years required to attain that degree. For example, in this paper’s case study, we assigned four points to a bachelor’s degree, because the involved experts attended a four-year study program, while a master’s degree is scored by five points, and a Ph.D. degree is characterized by eight points.
Step 2.3. Normalization of the educational degree
Similarly, as in Step 2.1, we will carry out normalization of the parameter educational degree ( E D i ) by Equation (4).
E D N i = E D i i = 1 q E D i ,   i = 1,2 , , q .
Step 2.4. Calculation of experts’ reputations
Finally, to assess the experts’ reputations, the average value of the previous two parameters should be calculated (Equation (5)), i.e., their normalized value (Equation (6)).
L i = Y E N i + E D N i 2 ,   i = 1,2 , , q .
W N E i = L i i = 1 q L i , i = 1,2 , , q .
Step 3. Normalization of the initial input matrix
According to the original FullEx approach, the normalization of the initial input matrix is performed by Equation (7).
v i j = x i j i = 1 q x i j ,   i = 1 , 2 , , q ,     j = 1 ,   2 , , p .
Step 4. Calculation of expert-weighted matrix
Here, the normalized input data are weighted by the experts’ reputations assessed in Step 2. It is calculated by Equation (8).
r i j = v i j · W N E i ,   i = 1,2 , q ,     j = 1 ,   2 , , p .
Step 5. Identification of the optimal value for each criterion
The aim in this step is to determine the optimal value of each criterion’s ( V j   m a x ) by columns. It is calculated by Equation (9) and presented in Table 3.
V j   m a x = max i = 1 , 2 ,   , q r i j ,   j = 1 ,   2 , , p .
Step 6. Calculation of the optimal decision-making matrix
The optimal decision-making matrix is obtained as described by Equation (10).
y i j = r i j V j   m a x , i = 1 ,   2 , , q , j = 1 ,   2 , , p .
Step 7. Summation of the values by columns in the optimal decision-making matrix
In this step, Equation (11) is applied.
K j = i = 1 q y i j ,   i = 1 , 2 , q , j = 1 ,   2 , , p .
Step 8. Calculation of the final ranking
The final calculation in the Extended FullEx method gives the values of criteria weights, by which we can rank each of them and use them in the further decision-making process. Here, Equation (12) should be used. The higher values of F j correspond to the higher importance of the considered criterion.
F j = K j j = 1 p K j ,   i = 1 , 2 , q , j = 1 ,   2 , , p .

3.2. MARCOS Method for Ranking the Alternatives

To evaluate the alternatives under the numerous criteria, where some of them are in conflict with each other, we should use some of the multi-criteria decision-making (MCDM) methods. For the ranking procedure, in this paper, we will use the MCDM method: Measurement of Alternatives and Ranking According to Compromise Solution (MARCOS) [55].
Since the main contribution of this paper relates to the methodology that supports the decision-maker in the determination of criteria weights, we will not provide the complete procedure of the MARCOS approach in this place. The implemented steps of the MARCOS method can be found in the paper by Stević et al. [55].

4. Case Study

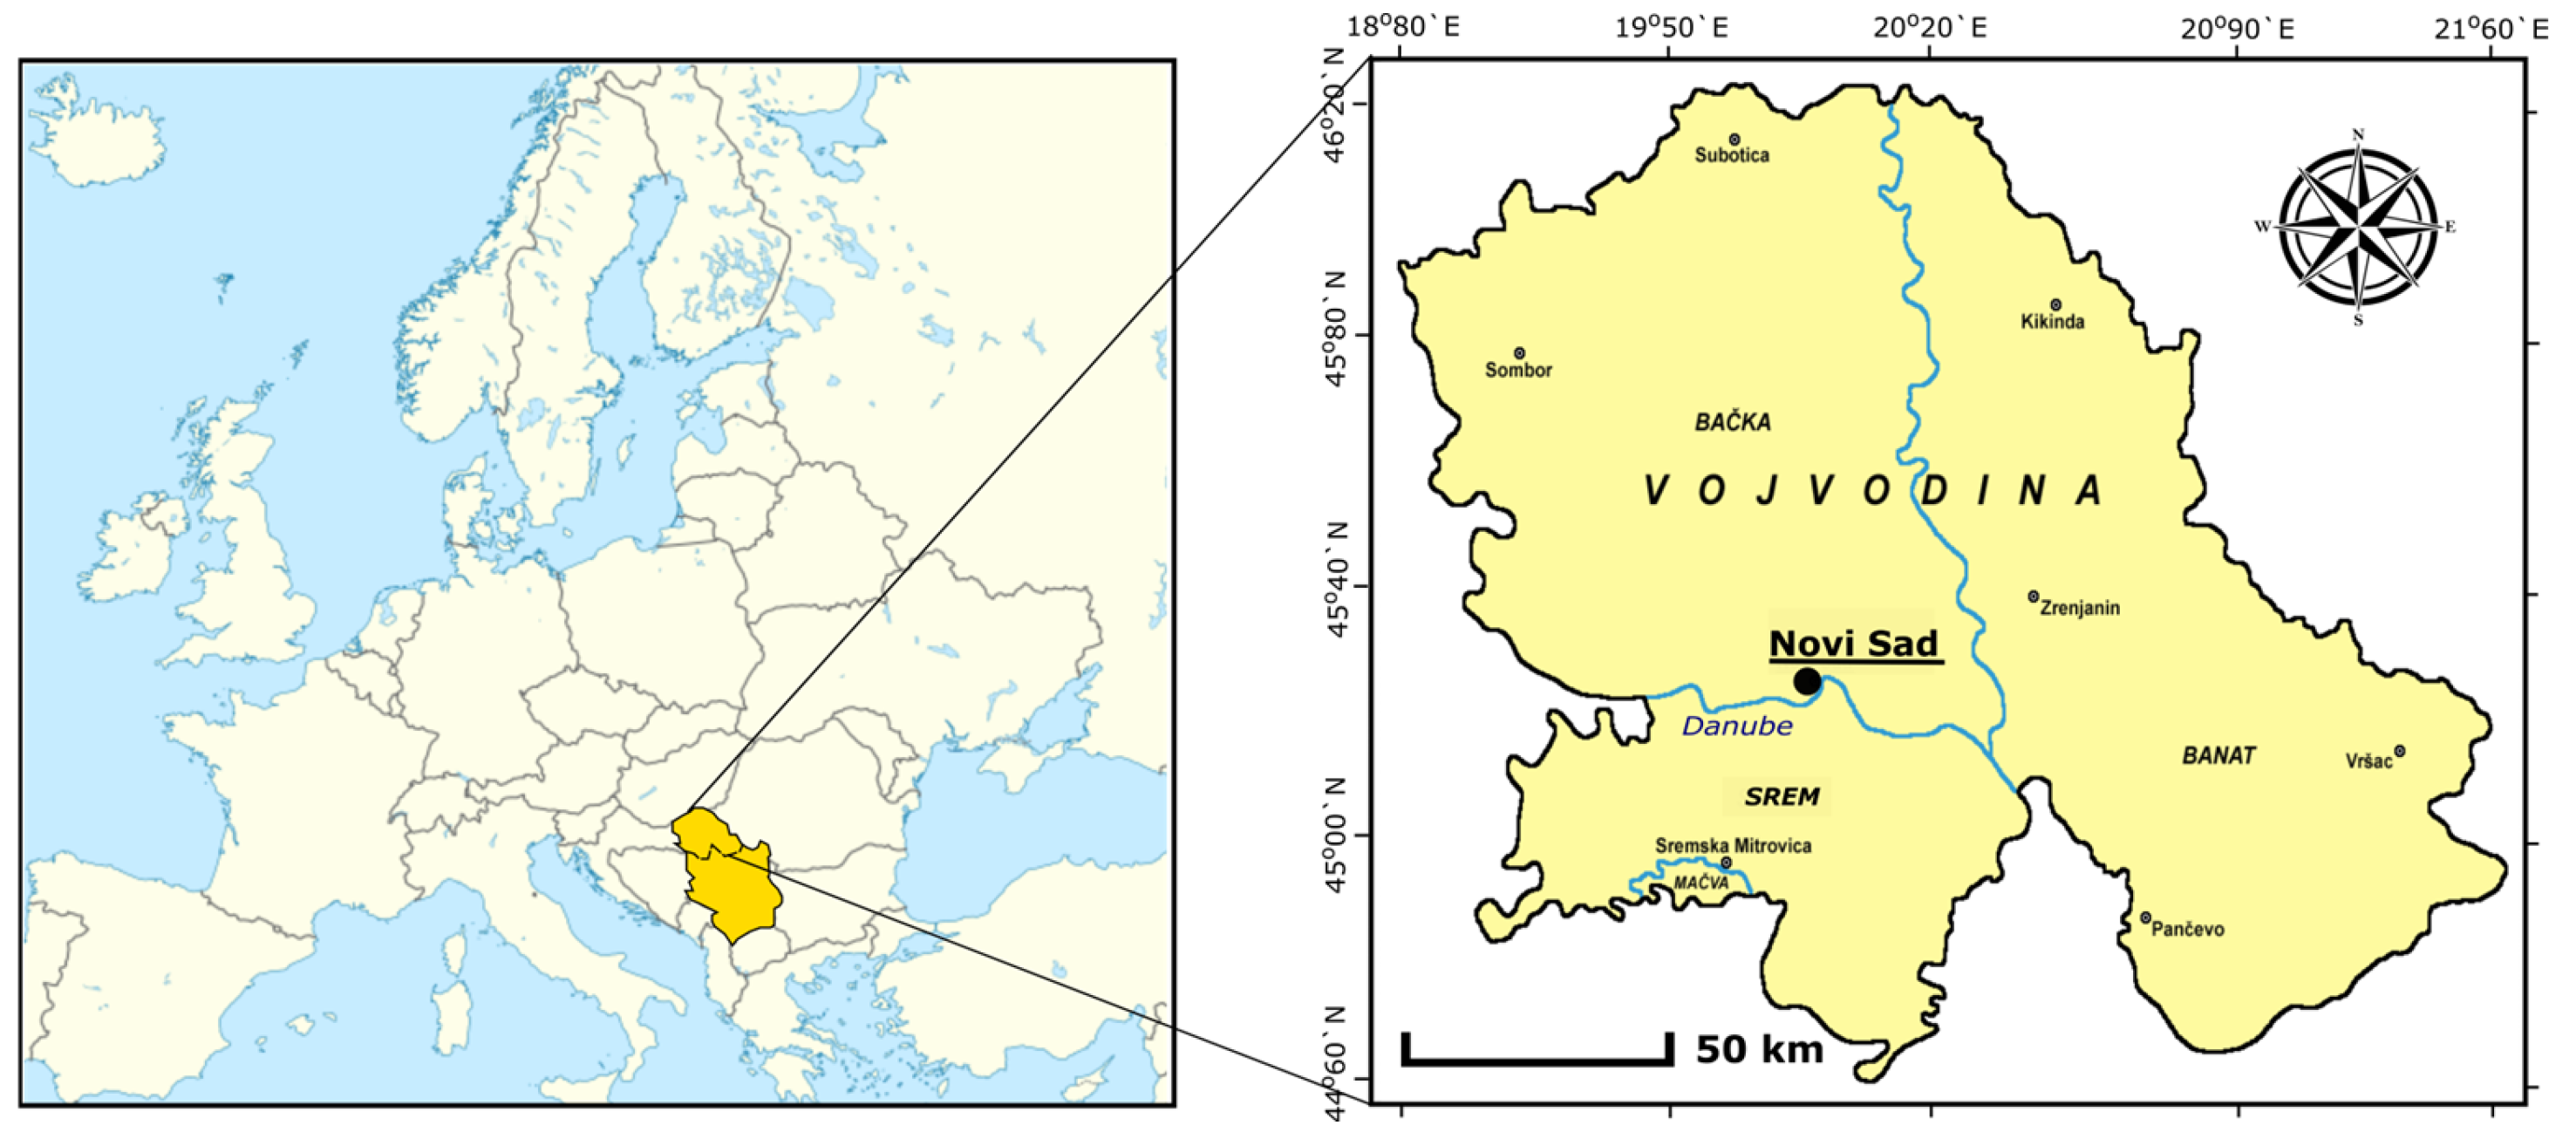
Novi Sad is Serbia’s second-largest city and serves as the capital of the Autonomous Province of Vojvodina, located in the northern part of the country. Vojvodina is divided into three regions: Srem, Banat, and Bačka, as shown in Figure 3. According to the 2022 census, Novi Sad has a population of 368,967 and covers a land area of 129.4 km2.
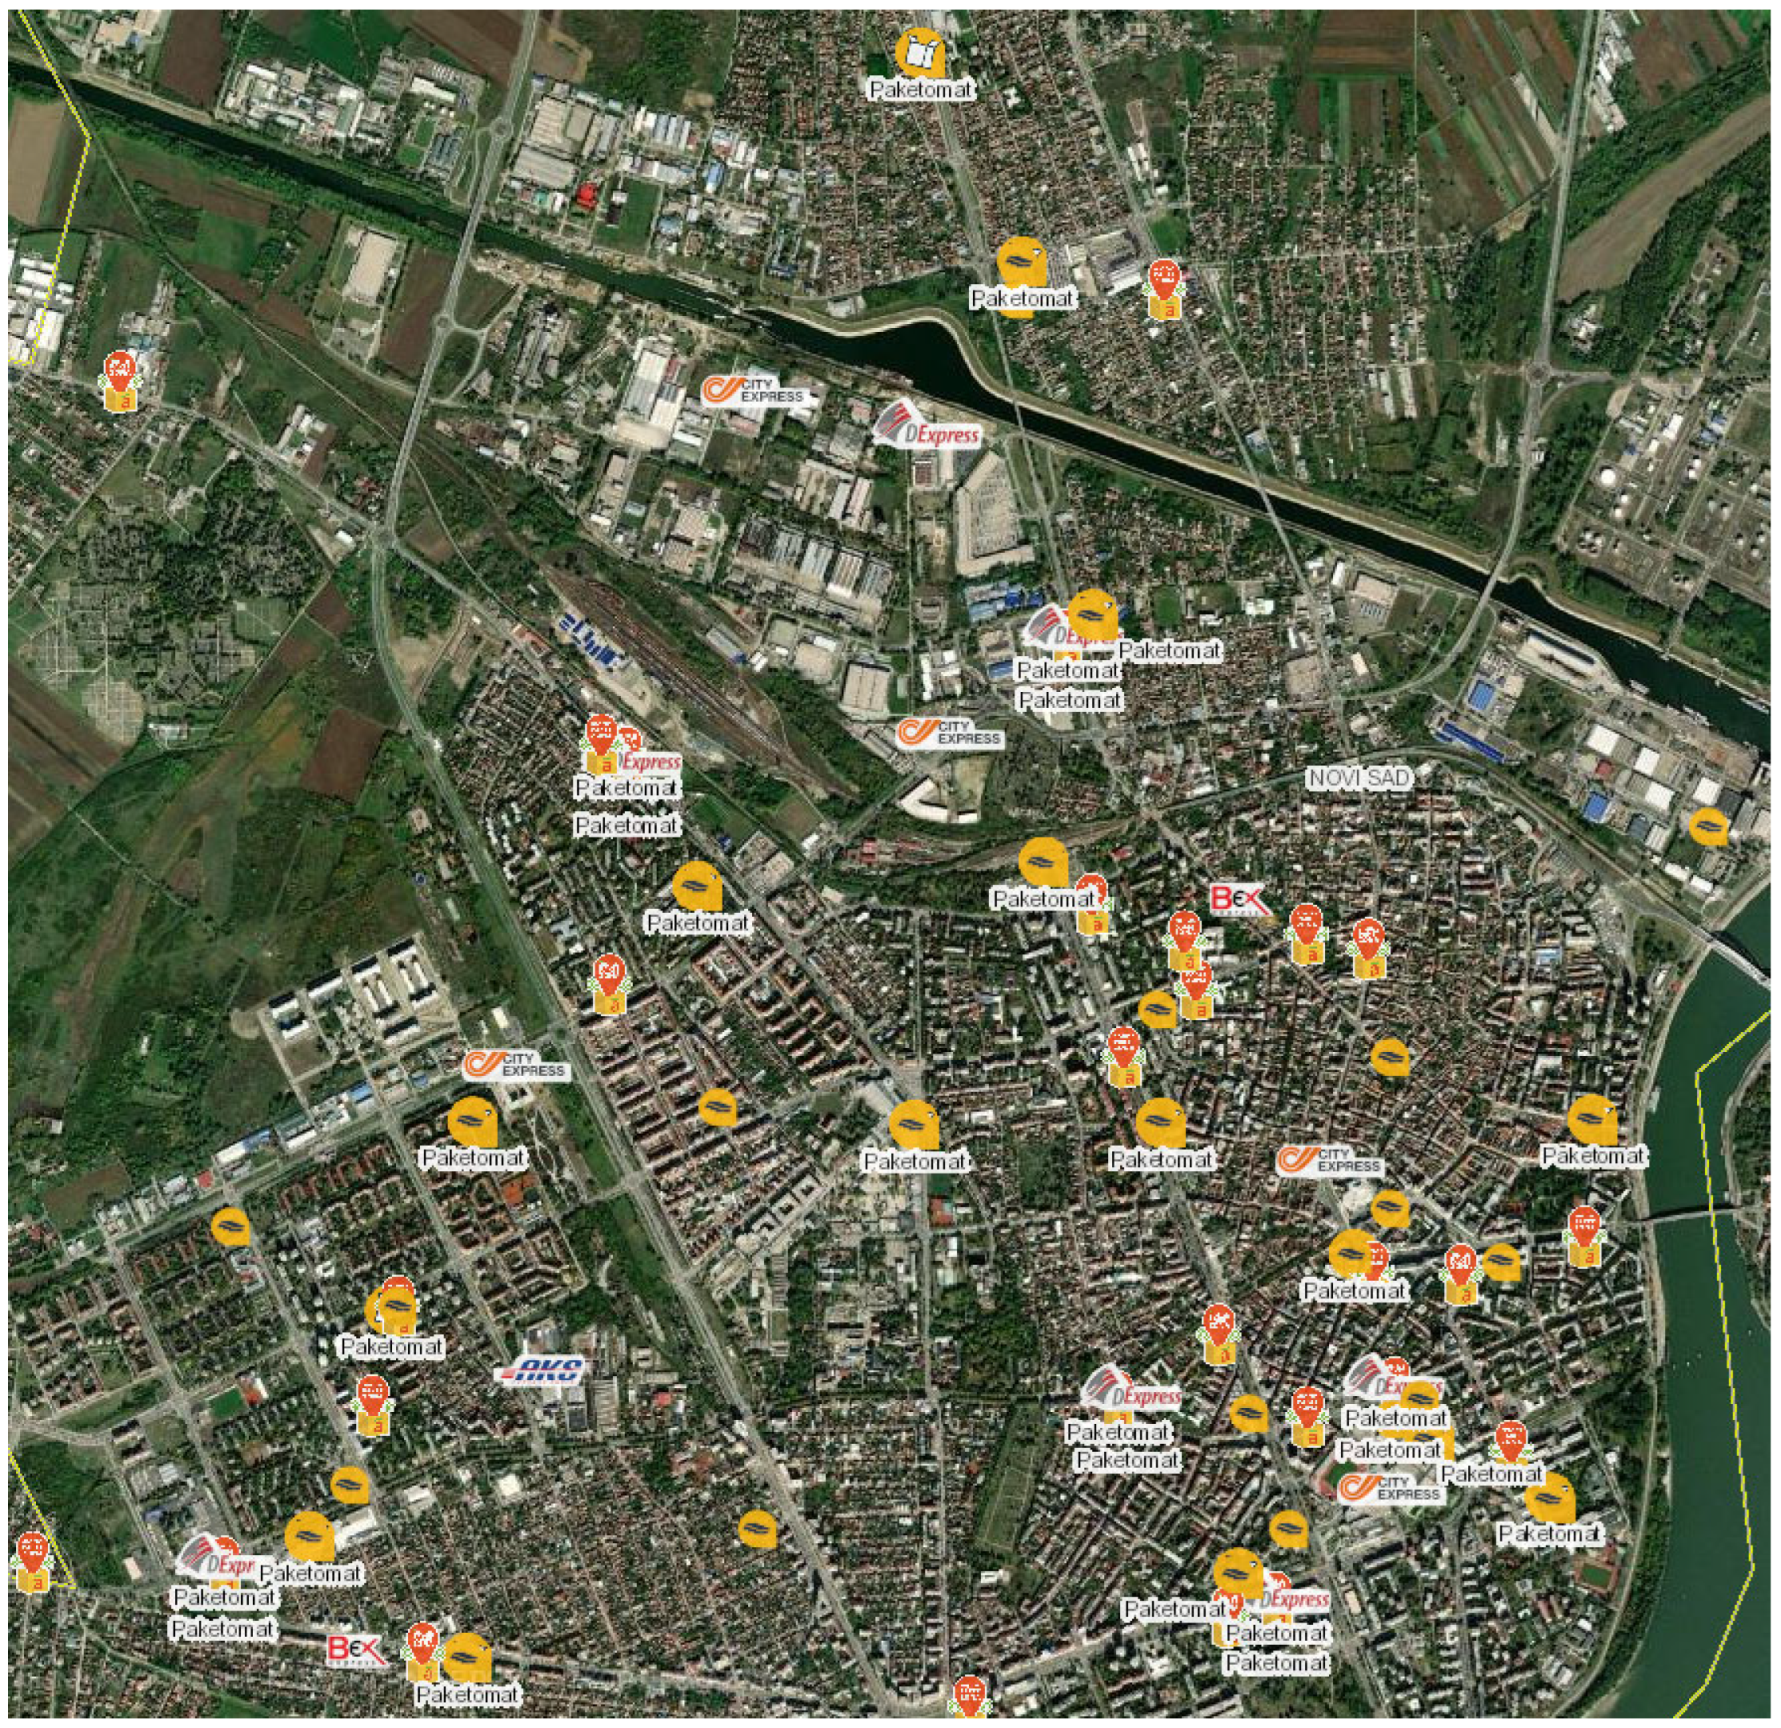
In Novi Sad, 32 postal and courier companies have been granted licenses by the Regulatory Authority for Electronic Communications and Postal Services. The majority of the workload is handled by six companies. Regarding the network of postal operators in Novi Sad, the spatial data of postal operators by different criteria are presented in Figure 4. The map illustrates the following:
  • Locations of postal operators’ offices–both for universal postal service and express and courier services;
  • Locations of parcel lockers for package delivery;
Currently, spatial data for postal operators with the largest market share are available through the GIS portal. The map shows the locations of offices for operators providing postal and courier services: The Post of Serbia, BexExpress, AKS Express Kurir, D Express, City Express, and Ananas Express.
In Novi Sad, the postal industry conducts approximately 180,000 urban deliveries each working day, where online orders account for around 30,000. These significant distribution volumes also bring negative environmental impacts, cause traffic congestion, and create a shortage of parking spaces. These issues have become key motivators for an urgent response and a redesign of the delivery system. However, the critical question remains: What delivery model should be implemented in Novi Sad?

4.1. Considered Alternatives

This study analyzed four parcel delivery models in an urban environment. The key differences between these strategies stem from their varying approaches to the parcel-handling process. Additionally, the strategies differ in terms of environmental impact, technical and technological characteristics, economic and financial features, and social aspects (Figure 5).

4.1.1. Traditional Model—Status Quo (A1)

This model involves delivering parcels from distribution centers located outside the city. Postal operators maintain their own distribution centers for parcel processing, typically positioned on the city outskirts due to organizational considerations and investment costs. Generally, land outside city centers is more affordable compared to urban locations.
With this delivery model, vehicles from various courier services frequently converge on the same streets or locations, resulting in inefficient urban parcel deliveries [56]. This inefficiency mainly stems from suboptimal parcel routing processes, as each company plans its routes independently of other courier services already operating in the city. Consequently, it is common for vehicles from two or more courier companies to traverse identical routes at the same time. Better coordination could reduce the number of vehicles needed in the same areas. Given the challenges related to vehicle load utilization, the traditional model is marked by poor resource efficiency, a negative environmental footprint, and increased demand for parking space.

4.1.2. Unified Consolidation Center (A2)

A unified consolidation center is a facility designed for the consolidation of parcels from various sources before they are dispatched to their final destinations. By consolidating shipments, the aim is to reduce transportation costs by combining multiple parcels into a larger shipment [57]. This method allows for economies of scale, resulting in more efficient and cost-effective transportation. These centers play a crucial role in optimizing transportation processes, especially in the context of delivery. Such centers are typically located in or near the city’s central area, where postal and logistics companies collaborate. This collaboration offers numerous benefits [58], including the implementation of new information and communication technologies that further optimize the entire delivery process [59]. Consolidating parcels leads to more efficient use of transport capacity, reduced delivery costs, savings in infrastructure resources, optimized parking space usage, and minimized environmental impact, including air pollution and noise.
Ownership of a unified consolidation center can vary, ranging from a selected company to municipal authorities. This delivery model supports the use of different types of transportation within the vehicle fleet, including internal combustion engine vehicles or zero-emission vehicles. Centralized management of vehicles helps improve overall delivery efficiency by eliminating the duplication of delivery vehicles to the same addresses at the same time. Depending on the volume of transport, distance, and terrain configuration, various types of vehicles can be used, from cargo bikes, drones, and scooters to cargo vans and trucks.

4.1.3. Urban Hubs (A3)

Urban hubs are smaller processing (logistics) centers located within cities that act as nodes for processing, distributing, and consolidating parcels [60]. Their primary function is to optimize LMD while reducing greenhouse gas emissions and delivery costs. These hubs encourage collaboration among various delivery companies. This delivery approach integrates real-time tracking technology, supports sustainable delivery strategies in urban environments, and contributes to improved efficiency, reduced numbers of delivery vehicles on the road, and meeting the growing demand for fast and reliable delivery in city areas.
This model allows for closer access to end customers, and compared to traditional strategies, it supports various modes of transport, such as cargo bikes, especially in cities with flat terrain [22]. However, a downside of this concept is the supply of smaller hubs scattered throughout the city, where using large-capacity vehicles for transport to a specific hub could negatively impact traffic congestion and parking space availability. The concept of reorganizing parcel delivery through “urban hubs” in large cities, where parcels are transported to various centers and then delivered to end users, encourages the practice of collaboration among different delivery companies, including competitors, intending to achieve more efficient urban delivery.

4.1.4. Hybrid Delivery Model—Consolidation Center and Urban Hubs (A4)

This urban delivery model involves the existence of a central (unified) consolidation center for processing parcels from various delivery companies before transporting them to smaller urban hubs. Such a concept would mitigate the drawbacks of urban hubs. A distinctive feature of this hybrid concept is the enhanced collaboration between delivery companies, which is expected to occur both within the facilities of the central (unified) consolidation center and in the preparatory activities of the inner-city centers (urban hubs). Delivery operators should view collaboration, even with competitors, as an opportunity to rethink their delivery methods to reduce economic and environmental impacts. A model in which operators collaborate can coordinate decisions regarding the urban delivery network to eliminate overlapping routes and increase vehicle utilization while improving the level of service to customers.
A concise overview of each alternative, highlighting its core characteristics, is provided in Table 4.

4.2. Considered Criteria

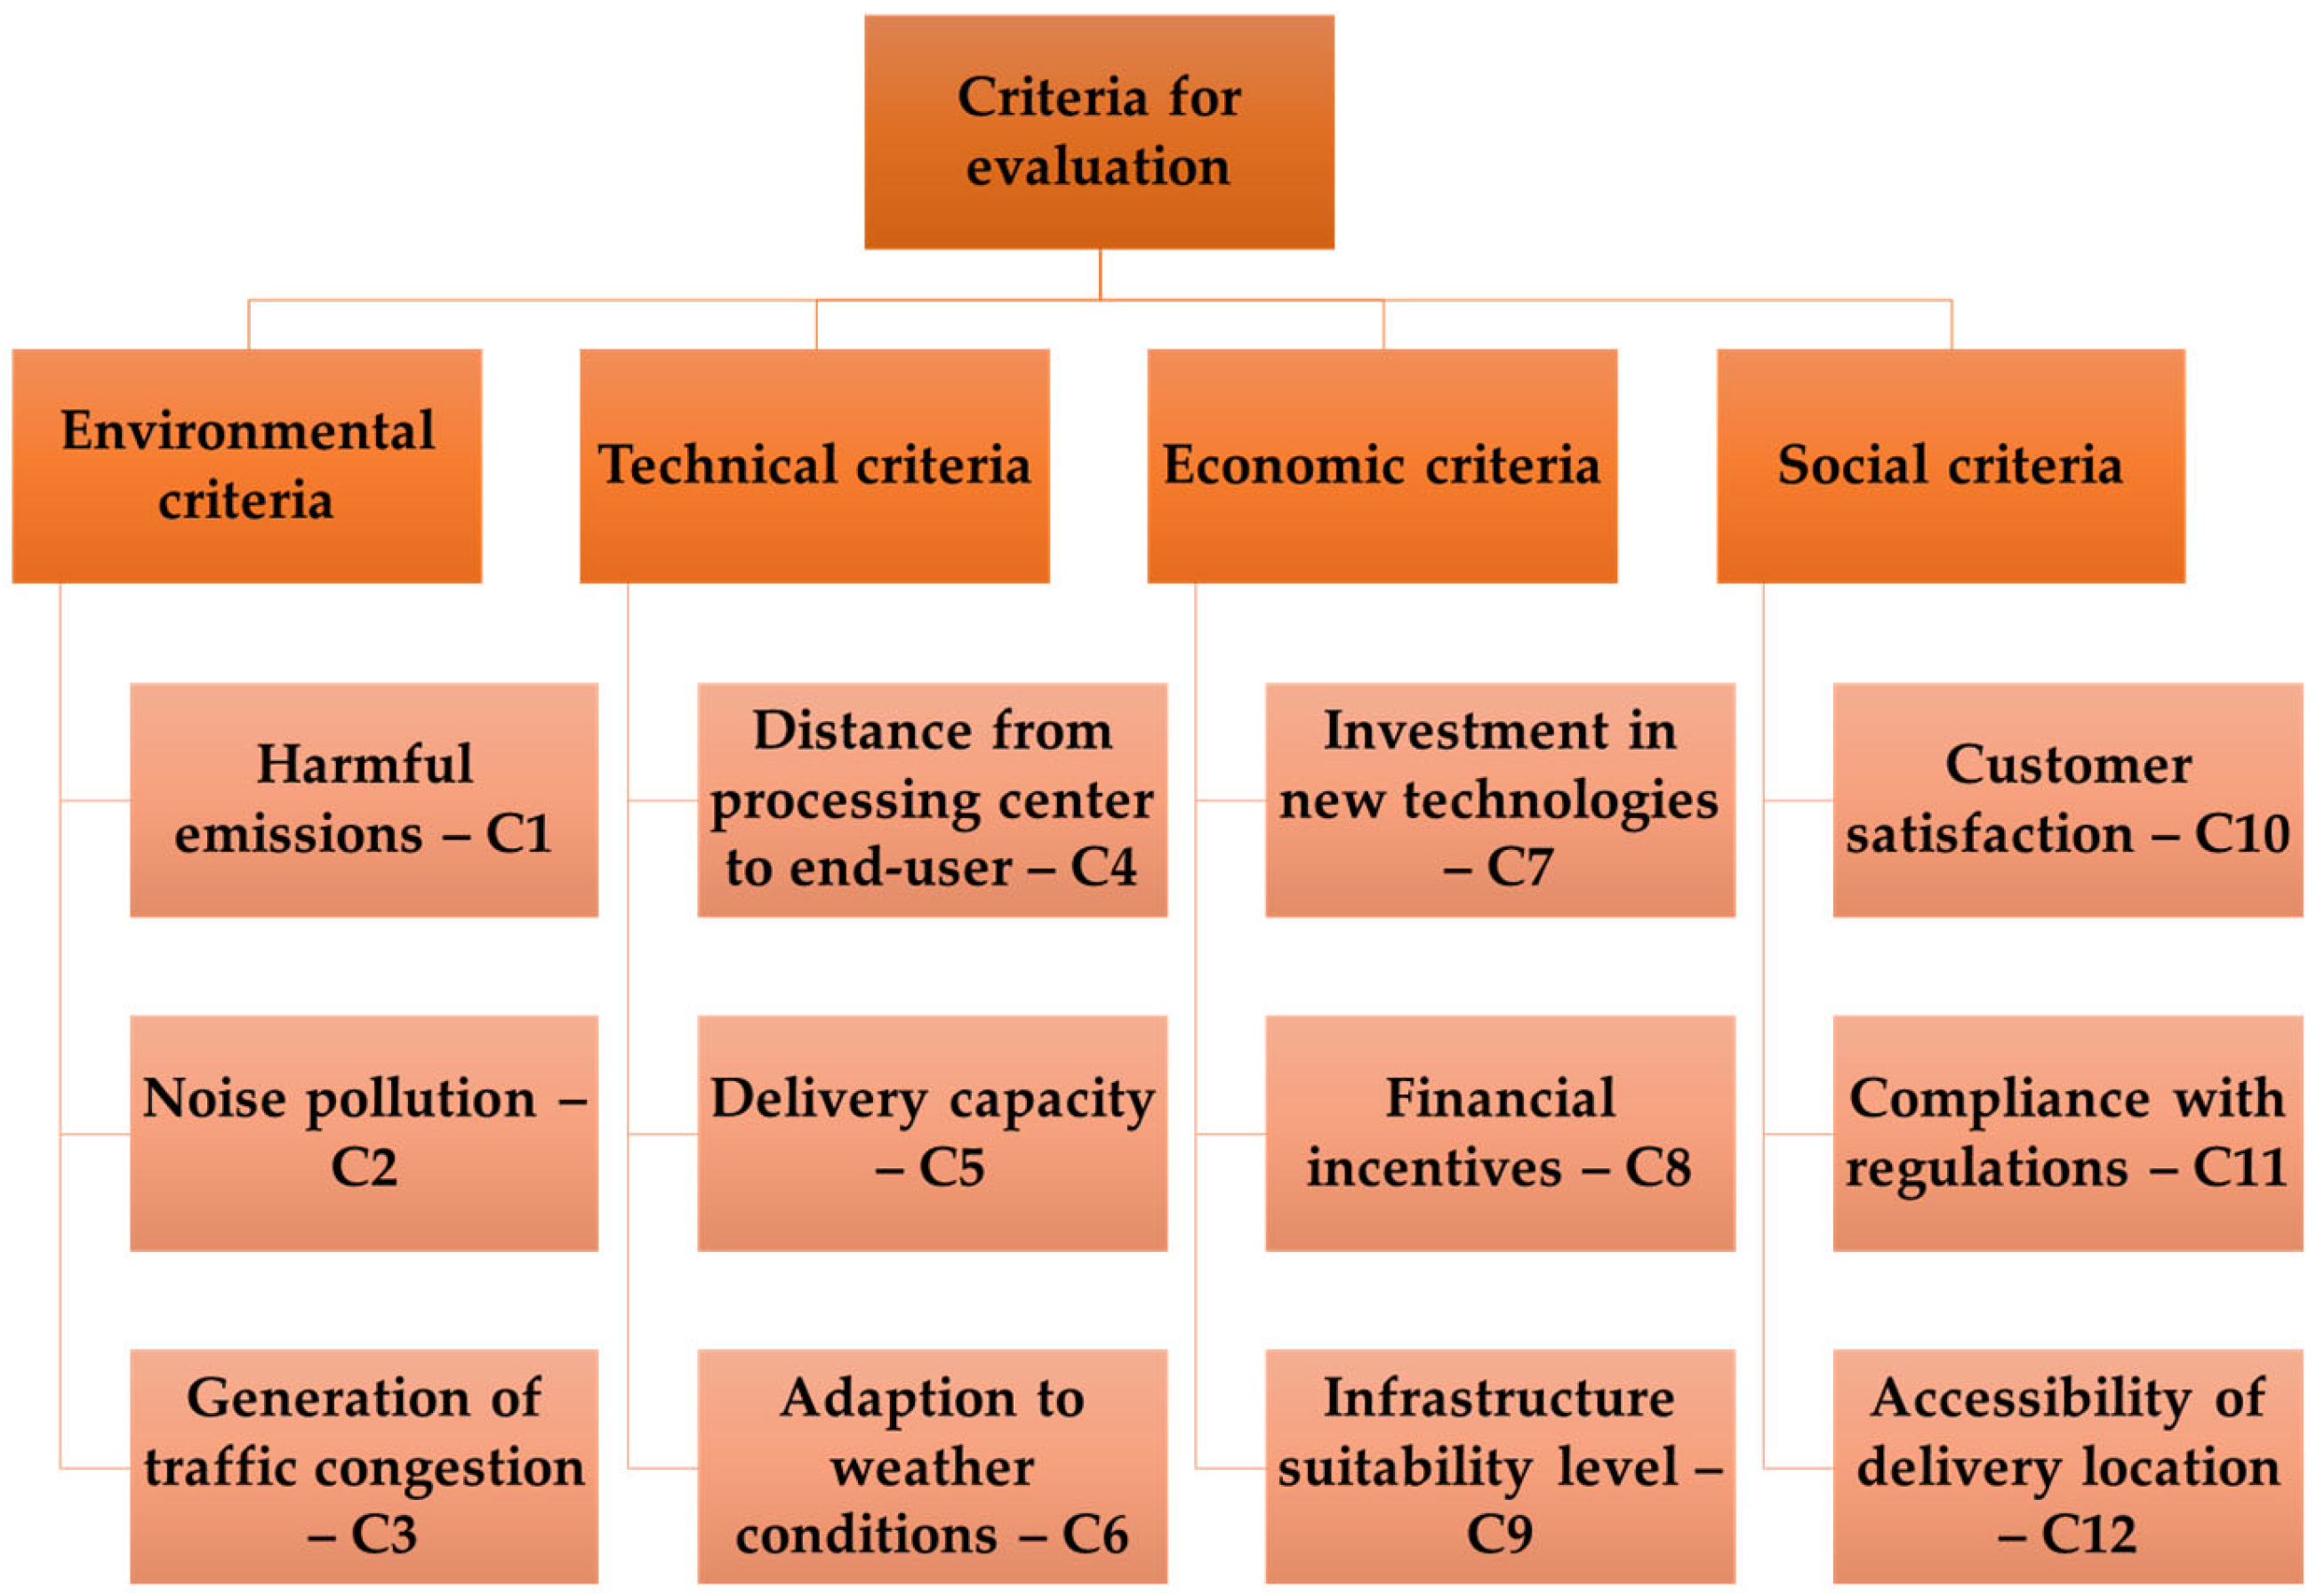
To select the most suitable delivery model for the territory of Novi Sad, the alternatives (delivery models) were ranked based on 12 criteria. These criteria were chosen following a literature review and are grouped into four categories: Environmental Criteria, Technical–Technological Criteria, Economic–Financial Criteria, and Social Criteria (Figure 6).
The sequence of criteria (e.g., from C1 to C12) in the pairwise comparison matrices does not influence the results, as each pair is evaluated independently. Nevertheless, the same order was consistently used across expert inputs to ensure clarity and traceability throughout the process.
The evaluation criteria used in this study were identified through a comprehensive review of relevant scientific literature and were further refined through expert consultations. The set of twelve criteria reflects common themes in sustainable last-mile delivery assessments, including environmental, technical, economic, and social dimensions. These criteria were not arbitrarily selected by the authors but are grounded in previously published studies and industry best practices.

4.2.1. Environmental Criteria

Harmful emissions—C1: The emission of harmful gases during urban deliveries depends on numerous dynamic factors: the number of vehicles, capacity, type of propulsion, and the number of loading and unloading requests [2,61]. It is important to carefully consider these elements to identify the most efficient approaches to reducing harmful gas emissions during deliveries. Innovative technologies and logistics optimization can be sustainable solutions to this problem in urban areas.
Noise pollution—C2: Noise is a harmful byproduct of the functioning of large cities, exacerbated by inefficient traffic systems. Urban deliveries carried out during the day contribute to noise creation. Organizing deliveries with smaller vehicles [62], as well as using more eco-friendly delivery models, would reduce noise, thereby improving the quality of life in cities. Minimizing noise pollution is essential for creating quieter and more pleasant urban environments.
Generation of traffic congestion—C3: Traffic congestion is a common occurrence in cities worldwide, negatively impacting their sustainability and the quality of life for urban residents. One of the key factors in reducing traffic congestion levels lies in the centralization of the parcel delivery process within the city. This approach not only optimizes delivery efficiency but can also have broader positive effects on urban mobility and environmental sustainability. Introducing zero-emission transport means, such as electric bicycles, drones, and others, using dedicated lanes for the delivery process, would further contribute to minimizing traffic congestion [63].

4.2.2. Technical Criteria

Distance from the processing center to end-user—C4: The importance of the distance from the processing center to the end user lies in its role in the efficiency and sustainability of the delivery process. Reducing this distance brings benefits such as cost reduction, improved service quality, and reduced emissions of harmful gases, making it a key factor for the success and sustainability of delivery [32].
Delivery capacity—C5: Delivery capacity varies depending on the delivery model, affecting the number of parcels that can be delivered within a certain time frame. There are delivery models that enable fast individual delivery, but due to the limited cargo space of the transport vehicle, the next delivery may be delayed until the vehicle returns to the processing center for loading new parcels [22].
Adaptation to weather conditions—C6: This criterion refers to the adaptability of the delivery model to various meteorological conditions [2]. This aspect supports strategies that rely on traditional means of transportation in urban environments, as these means provide a high level of efficiency even in challenging weather conditions. Maintaining the operability of the delivery system under different weather circumstances is crucial for achieving reliable and efficient delivery.

4.2.3. Economic Criteria

Investment in new technologies—C7: This includes costs related to system modernization, acquisition of technology, and resources required to support a specific delivery model. While most urban deliveries currently rely on traditional means like trucks and light vehicles, innovative delivery models can be implemented through information and communication technologies (ICT), environmentally friendly vehicles, robotics with augmented reality (AR), artificial intelligence, and the Internet of Things (IoT) [64].
Financial incentives—C8: Financial incentives can motivate companies involved in parcel delivery to transform their delivery processes towards more sustainable practices [65,66]. Financial incentives play a significant role in achieving the low-carbon transition of the postal industry. The implementation of economic support can significantly influence companies’ decisions to adopt more sustainable delivery methods. Financial incentives can cover various aspects, including subsidies for acquiring low-emission vehicles, tax breaks for sustainable transportation initiatives, or even direct financial rewards for reducing emissions in the delivery process. Increased availability of financial incentives at the local level could further encourage businesses to implement sustainable practices, particularly with strategies such as consolidated centers, which can significantly contribute to reducing harmful emissions and costs in the delivery process.
Infrastructure suitability level—C9: The implementation of a specific delivery model faces various challenges depending on geographic conditions. The acceptability of a delivery model directly depends on the necessary infrastructure and additional resources, thereby shaping the feasibility level. Additionally, the availability of land presents a concrete challenge for delivery companies. To overcome these obstacles, it is crucial to develop adaptable delivery models that consider the specifics of each area. Finding the optimal delivery model in an urban area requires a careful analysis of terrain characteristics, taking into account the needs of the local population and economy. Moreover, it is necessary to consider the sustainability of the proposed models and their ability to adapt to changes over time [67].

4.2.4. Social Criteria

Customer satisfaction—C10: Customer satisfaction reflects the judgment on whether a product or service has provided an adequate level of fulfillment. The effects of parcel delivery models in urban environments directly impact customer satisfaction. Increasing convenience for customers is crucial for the sustainability of the postal industry in a highly competitive market environment. One of the important factors for customer satisfaction with delivery services is timely delivery and ensuring the goods arrive in good condition [68].
Compliance with regulations—C11: Regarding the analyzed parcel delivery models in urban areas, there is the issue of compliance with existing laws and policies, as well as urban planning and business practices. Furthermore, imposing an obligation on all companies to use the same consolidation center for processing parcels could face challenges related to competition rules [69]. To overcome these and other potential obstacles, it is essential to carefully analyze and adapt delivery strategies following relevant legislation and monitor changes in the regulatory framework while simultaneously supporting innovation in the delivery industry.
Accessibility of delivery locations—C12: The use of public spaces and parking areas for delivery execution in cities represents an important constraint. Optimizing the use of parking spaces becomes imperative for cities. Integrating smaller and more adaptable vehicles into delivery processes facilitates parking, reduces congestion, and lessens the burden on parking infrastructure in cities, which can positively impact the urban environment [70].
Table 5 outlines the core characteristics of each category of criteria used in the evaluation process.

5. Results and Discussion

The results of this research will be divided into two subsections. The first relates to the calculation of criteria weights and the second to ranking the alternatives.

5.1. The Implementation of the Extended FullEX Method

To illustrate the applicability of the proposed Extended FullEX method, we used it to assess the criteria weights in the decision-making process related to previously explained distribution modes. Twelve criteria were identified from the literature to be used for the evaluation of four alternatives. In addition, three experts from the postal and express delivery industry were interviewed. Details about these experts are provided in Table 6. Regarding their educational qualifications, scores were assigned based on the proposed methodology: a bachelor’s degree was awarded four points, a master’s degree five points, and a Ph.D. eight points.
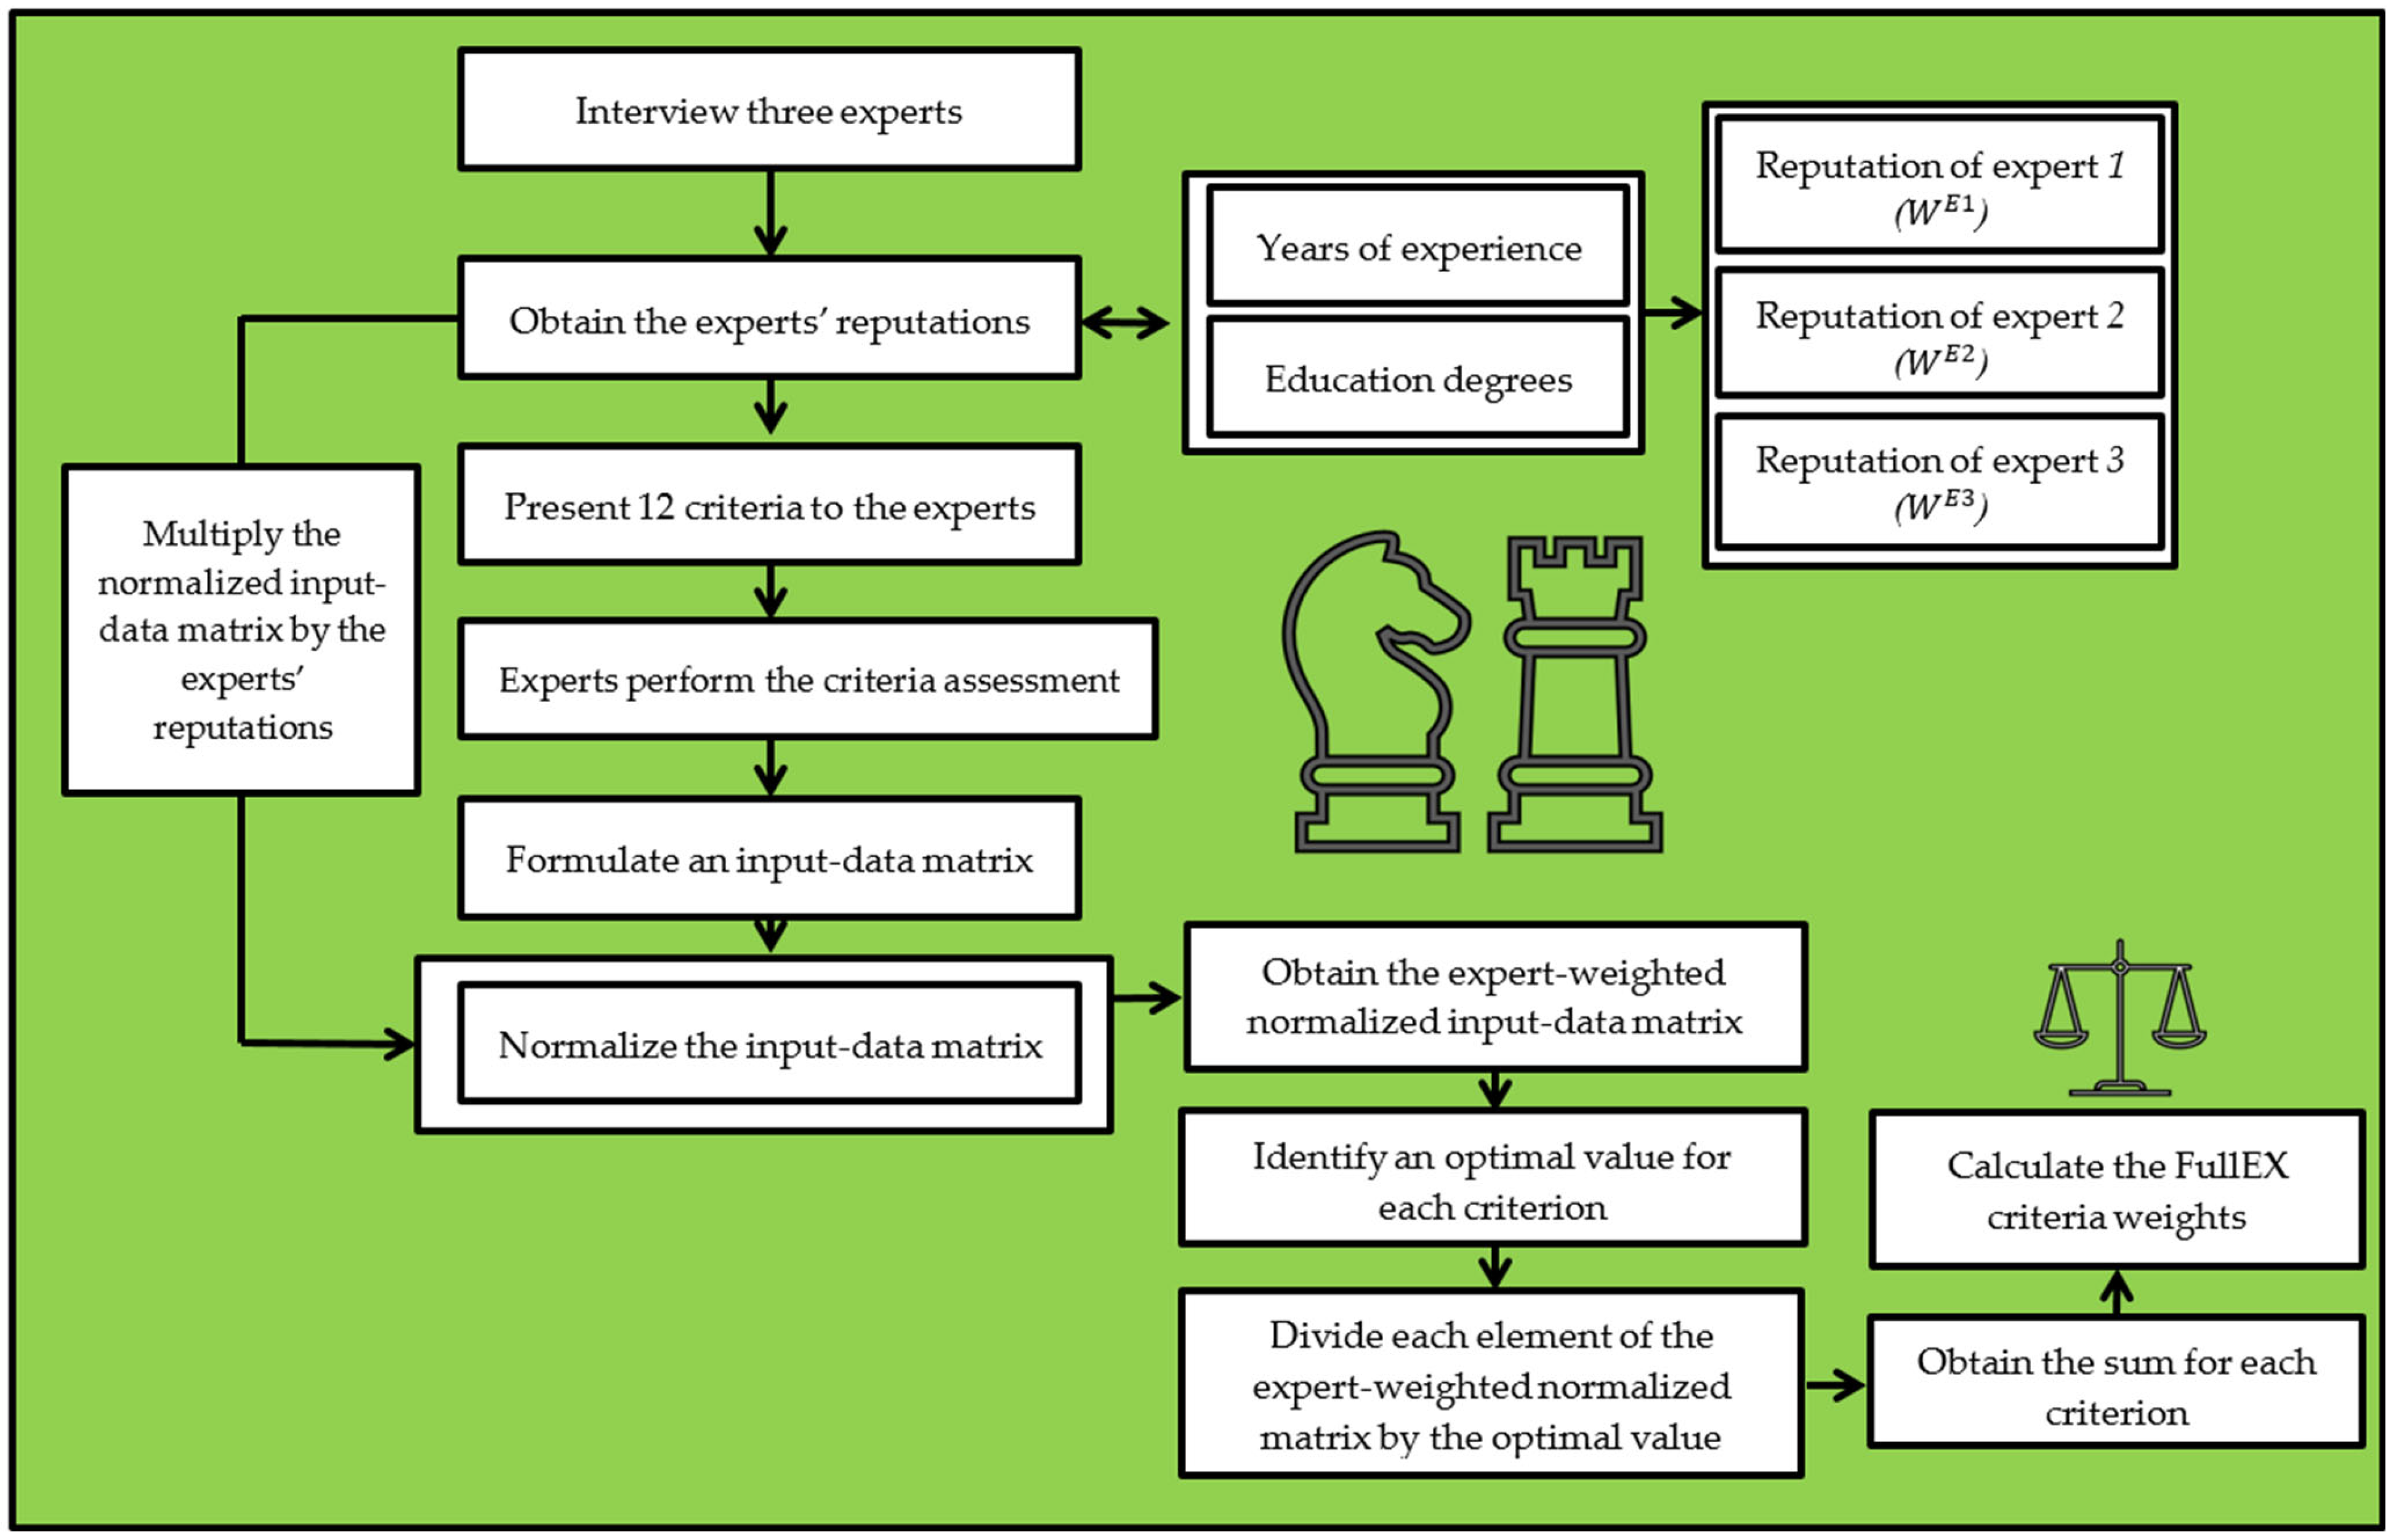
The procedure of the Extended FullEx method is illustrated in Figure 7. In the first step, we should create the initial input matrix. For this purpose, we interviewed the previously mentioned three experts, and their answers are presented in the Appendix A, Appendix B and Appendix C of this paper (Table A1, Table A3 and Table A5). Based on these answers, we generated the input matrix as shown in Table 7.
Step 2 implies the assessment of experts’ reputations, which is already presented in Table 6, where the data about the experts are.
In Step 3, we should carry out normalization of the initial input matrix by using Equation (7). The results are in Table 8. Next, Step 4 is to calculate the expert-weighted matrix, which is presented in Table 9.
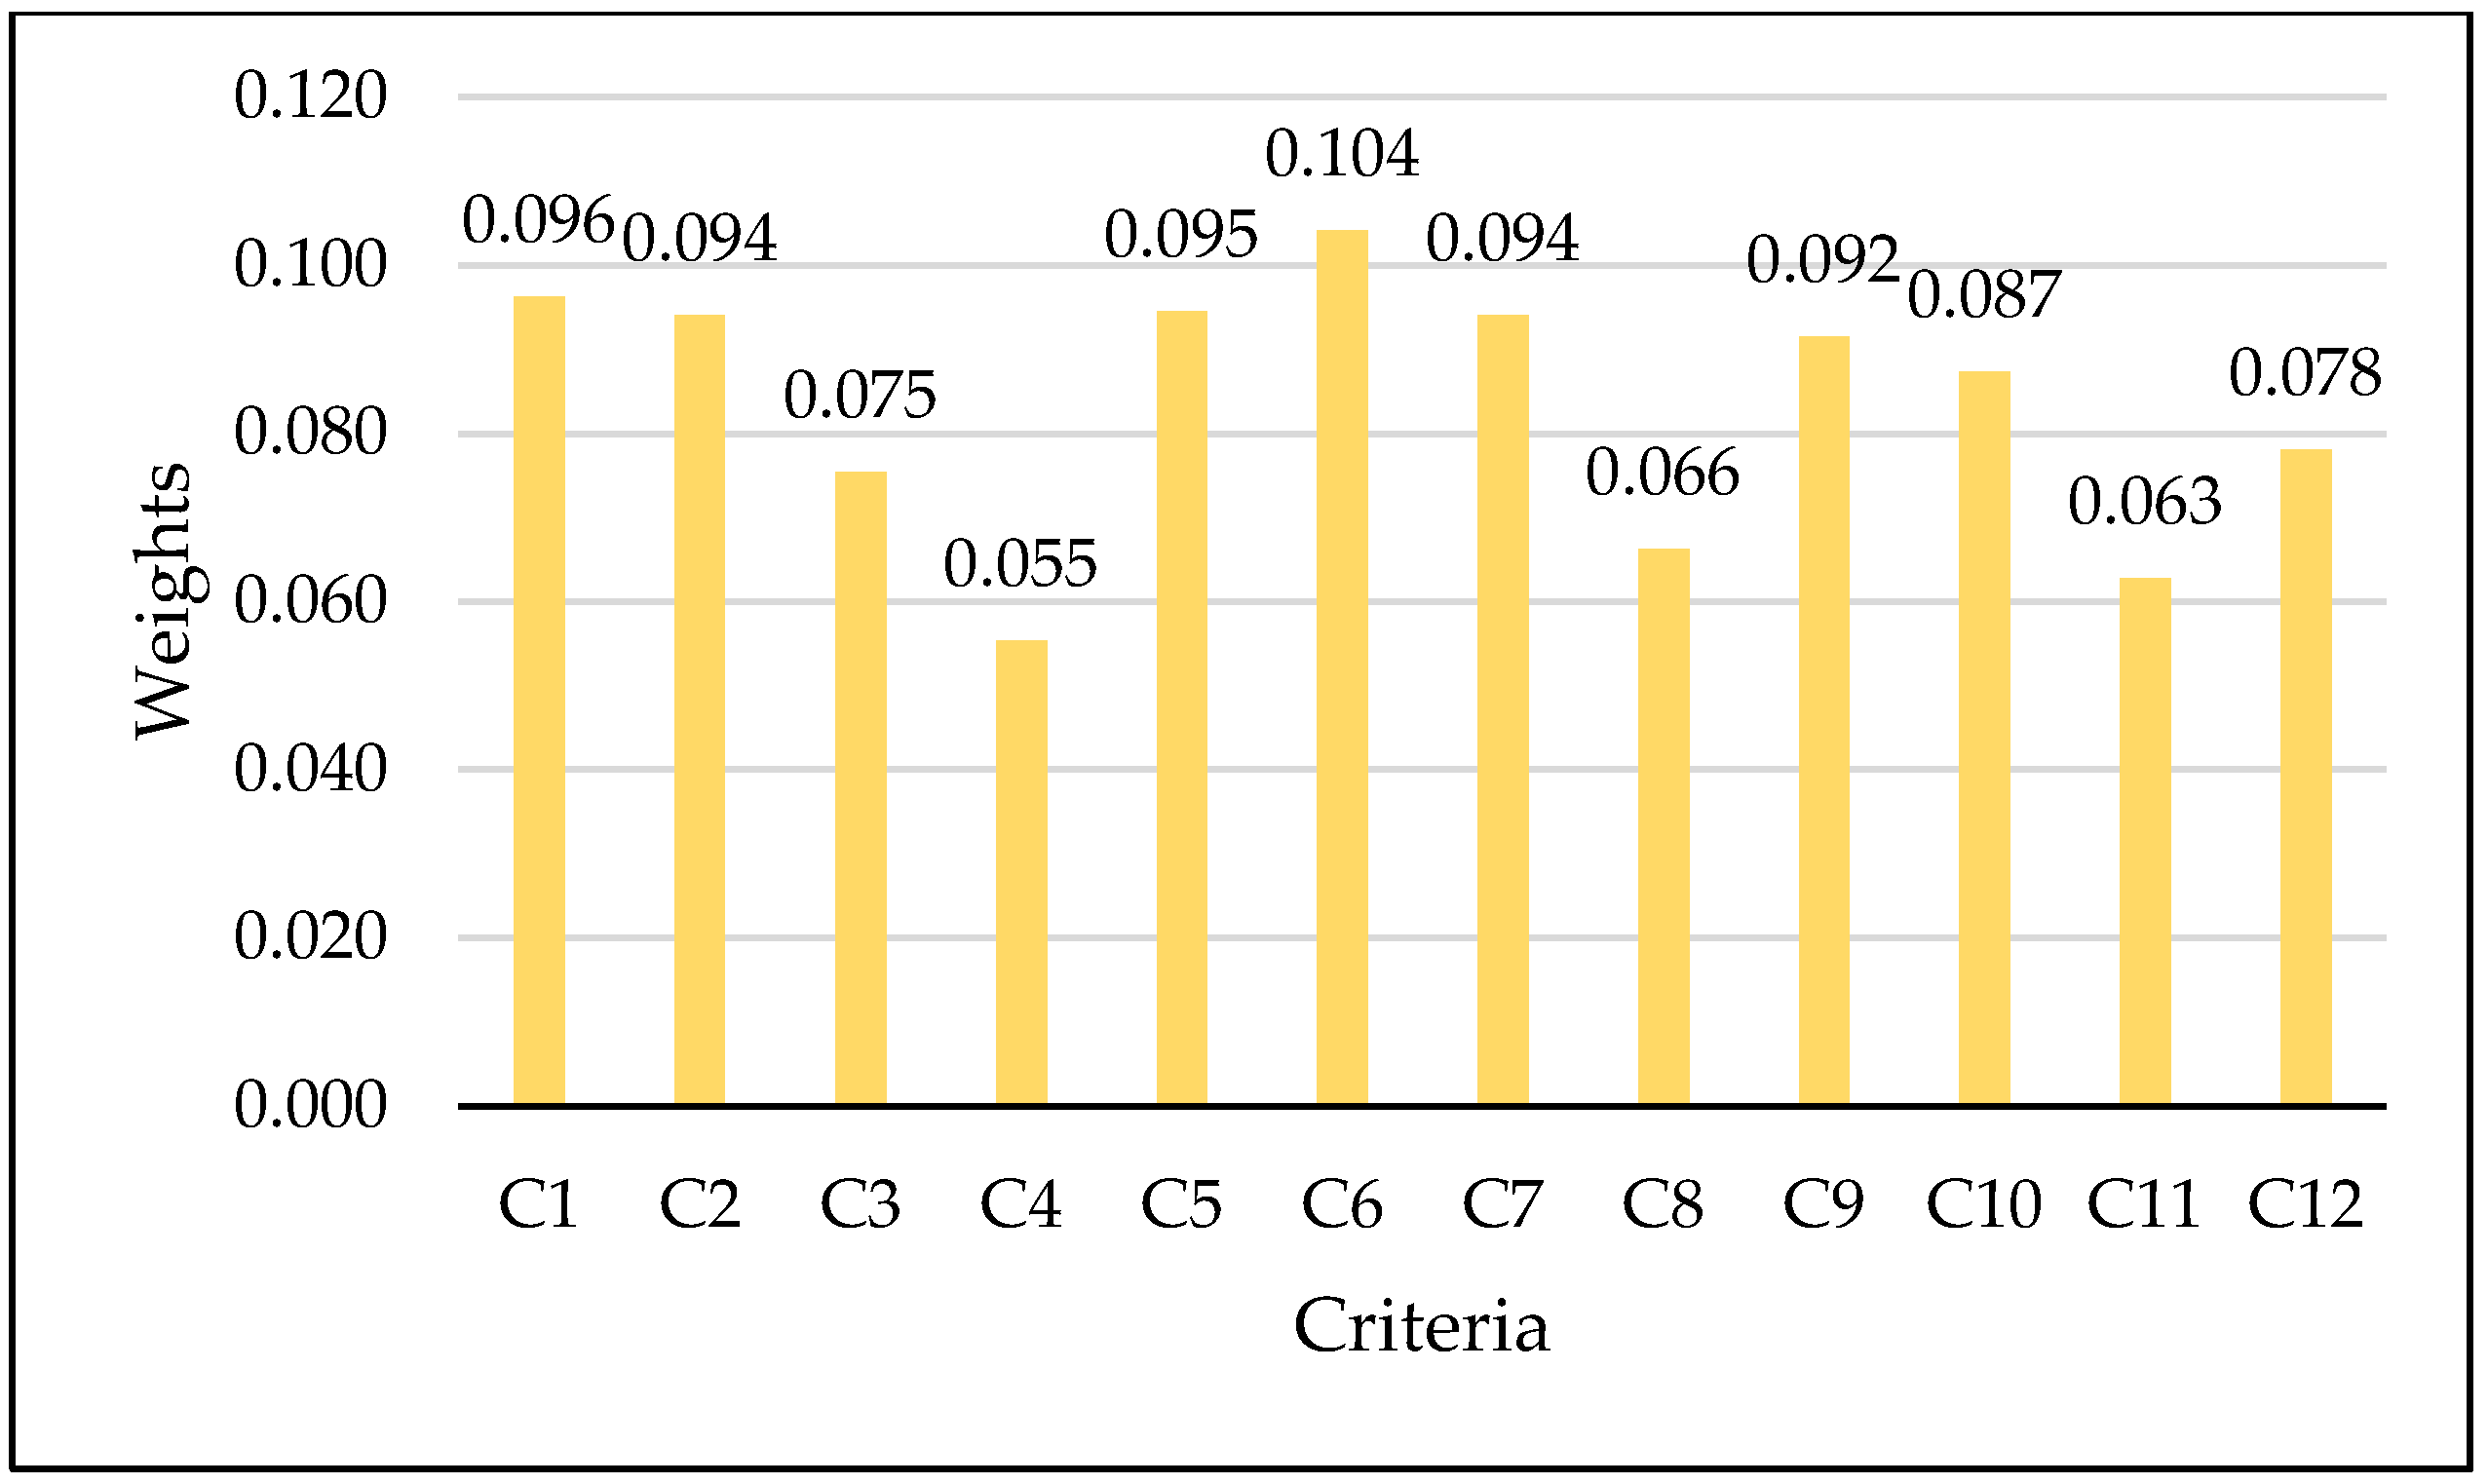
After finding the values by columns according to Step 5, in Step 6, we calculate the optimal decision-making matrix (Table 10). By following Steps 7 and 8, we are obtaining the final criteria weights, which are presented in Figure 8.

5.2. The Implementation of the MARCOS Method

To obtain the initial data matrix for the implementation of the MARCOS method, we interviewed the same three experts as in the case of the criteria weight assessment. The collected answers are shown in Appendix A, Appendix B and Appendix C, in Table A2, Table A4 and Table A6. Based on these data, the initial data matrix is formed as shown in Table 11. After implementing the MARCOS approach, we obtained the results that are presented in Figure 9.

5.3. Discussion

The obtained results can be discussed twofold. First, we can consider the obtained criteria weights, and secondly, we can analyze the final ranks of alternatives.
The proposed Extended FullEx approach indicated that criterion C6 (Adaptation to weather conditions) is the most significant criterion, with a score of 0.104. This means that the interviewed experts put the highest emphasis on the technological aspect in forming the delivery strategy. In the second place, there is a criterion that relates to the environmental issues, C1 (Harmful emissions), with the score 0.096. Such a result can be expected because green technologies represent one of the global aims of sustainable development. In the third place is criterion C5 (Delivery capacity). The fourth place with a score of 0.094 is shared by two criteria, C2 (Noise pollution) and C7 (Investment in new technologies). This means that besides environmental issues, the experts consider the economic aspect to be significant as well.
Speaking about the final rank of alternatives, the best-ranked delivery strategy is A4 (Hybrid Delivery Model—Consolidation Center and Urban Hubs). Such a result was expected because this strategy combines the advantageous characteristics of both approaches, consolidation centers and urban hubs. Consolidation center is based on a collaboration strategy, which provides a significant potential for optimization of the technological process. This optimization should lead to better use of resources and, by that, significant environmental benefits. On the other hand, city hubs bring other types of advantages, such as possibilities for diversification of transport modes that can be adjusted to different situations, depending on weather conditions, capacity demands, and similar.
In this section, we will further discuss the reliability of the collected answers from experts, the sensitivity of the collected answers by introducing a control group of experts, the robustness of the implemented methods by comparing the results with those obtained by other methods, and finally, managerial insights and the role of emerging technologies.

5.3.1. Assessment of the Reliability of the Collected Answers

A significant concern associated with subjective methodologies, such as the FullEx, is the assessment of the reliability of the expert’s responses. In the AHP, for example, a well-established procedure involves calculating the inconsistency ratio, which must remain below a threshold of 0.1 to be considered acceptably reliable. On the other hand, in the Fullex method, this phenomenon can be measured as proposed by Čubranić-Dobrodolac et al. [71].
The procedure involves conducting a second round of expert interviews. Without being informed of the first-round results, where they provided opinions through pairwise comparisons of criteria importance, experts were asked to provide additional assessments. Specifically, they were asked to use a scale ranging from 0 to 100% and assign a percentage value to each of the 12 criteria relevant to the considered problem. The sum of all 12 assessments was required to equal 100%. The results from this second round are then compared to the first-round results to evaluate the reliability of responses. If the second-round responses are denoted as p j , and the weights obtained in the first round as w j , the rate of inconsistency (RI) can be calculated as defined in Equation (13).
R I = j = 1 n w j     100 p j 100
To verify the reliability of the results obtained in this paper, a second-round interview was conducted with the same experts to gather information on the percentage distribution of criteria importance. The results are presented in Table 12. As shown, the inconsistency rate is below 0.1 (RI = 0.0944), indicating a satisfactory level of reliability.

5.3.2. Sensitivity Analysis by Introducing a Control Group of Experts

To assess the sensitivity of the results based on the experts who provide the answers on the relationships between the criteria, we invited three additional experts to serve as a control group in this research. The years of working experience in the postal industry are 12, 7, and 11. Besides, considering their educational background and the proposed methodological concept for the Extended Fullex, they received eight, five, and five points, respectively. Based on these inputs, the calculated values of the experts’ reputation were 0.422, 0.256, and 0.322.
In the further procedure, the experts gave the answers on the relations between the considered criteria following the procedure of the Extended Fullex method. Their answers are shown in Appendix D, Appendix E and Appendix F. After the calculation procedure, the final results for the criteria weights are shown in Table 13.
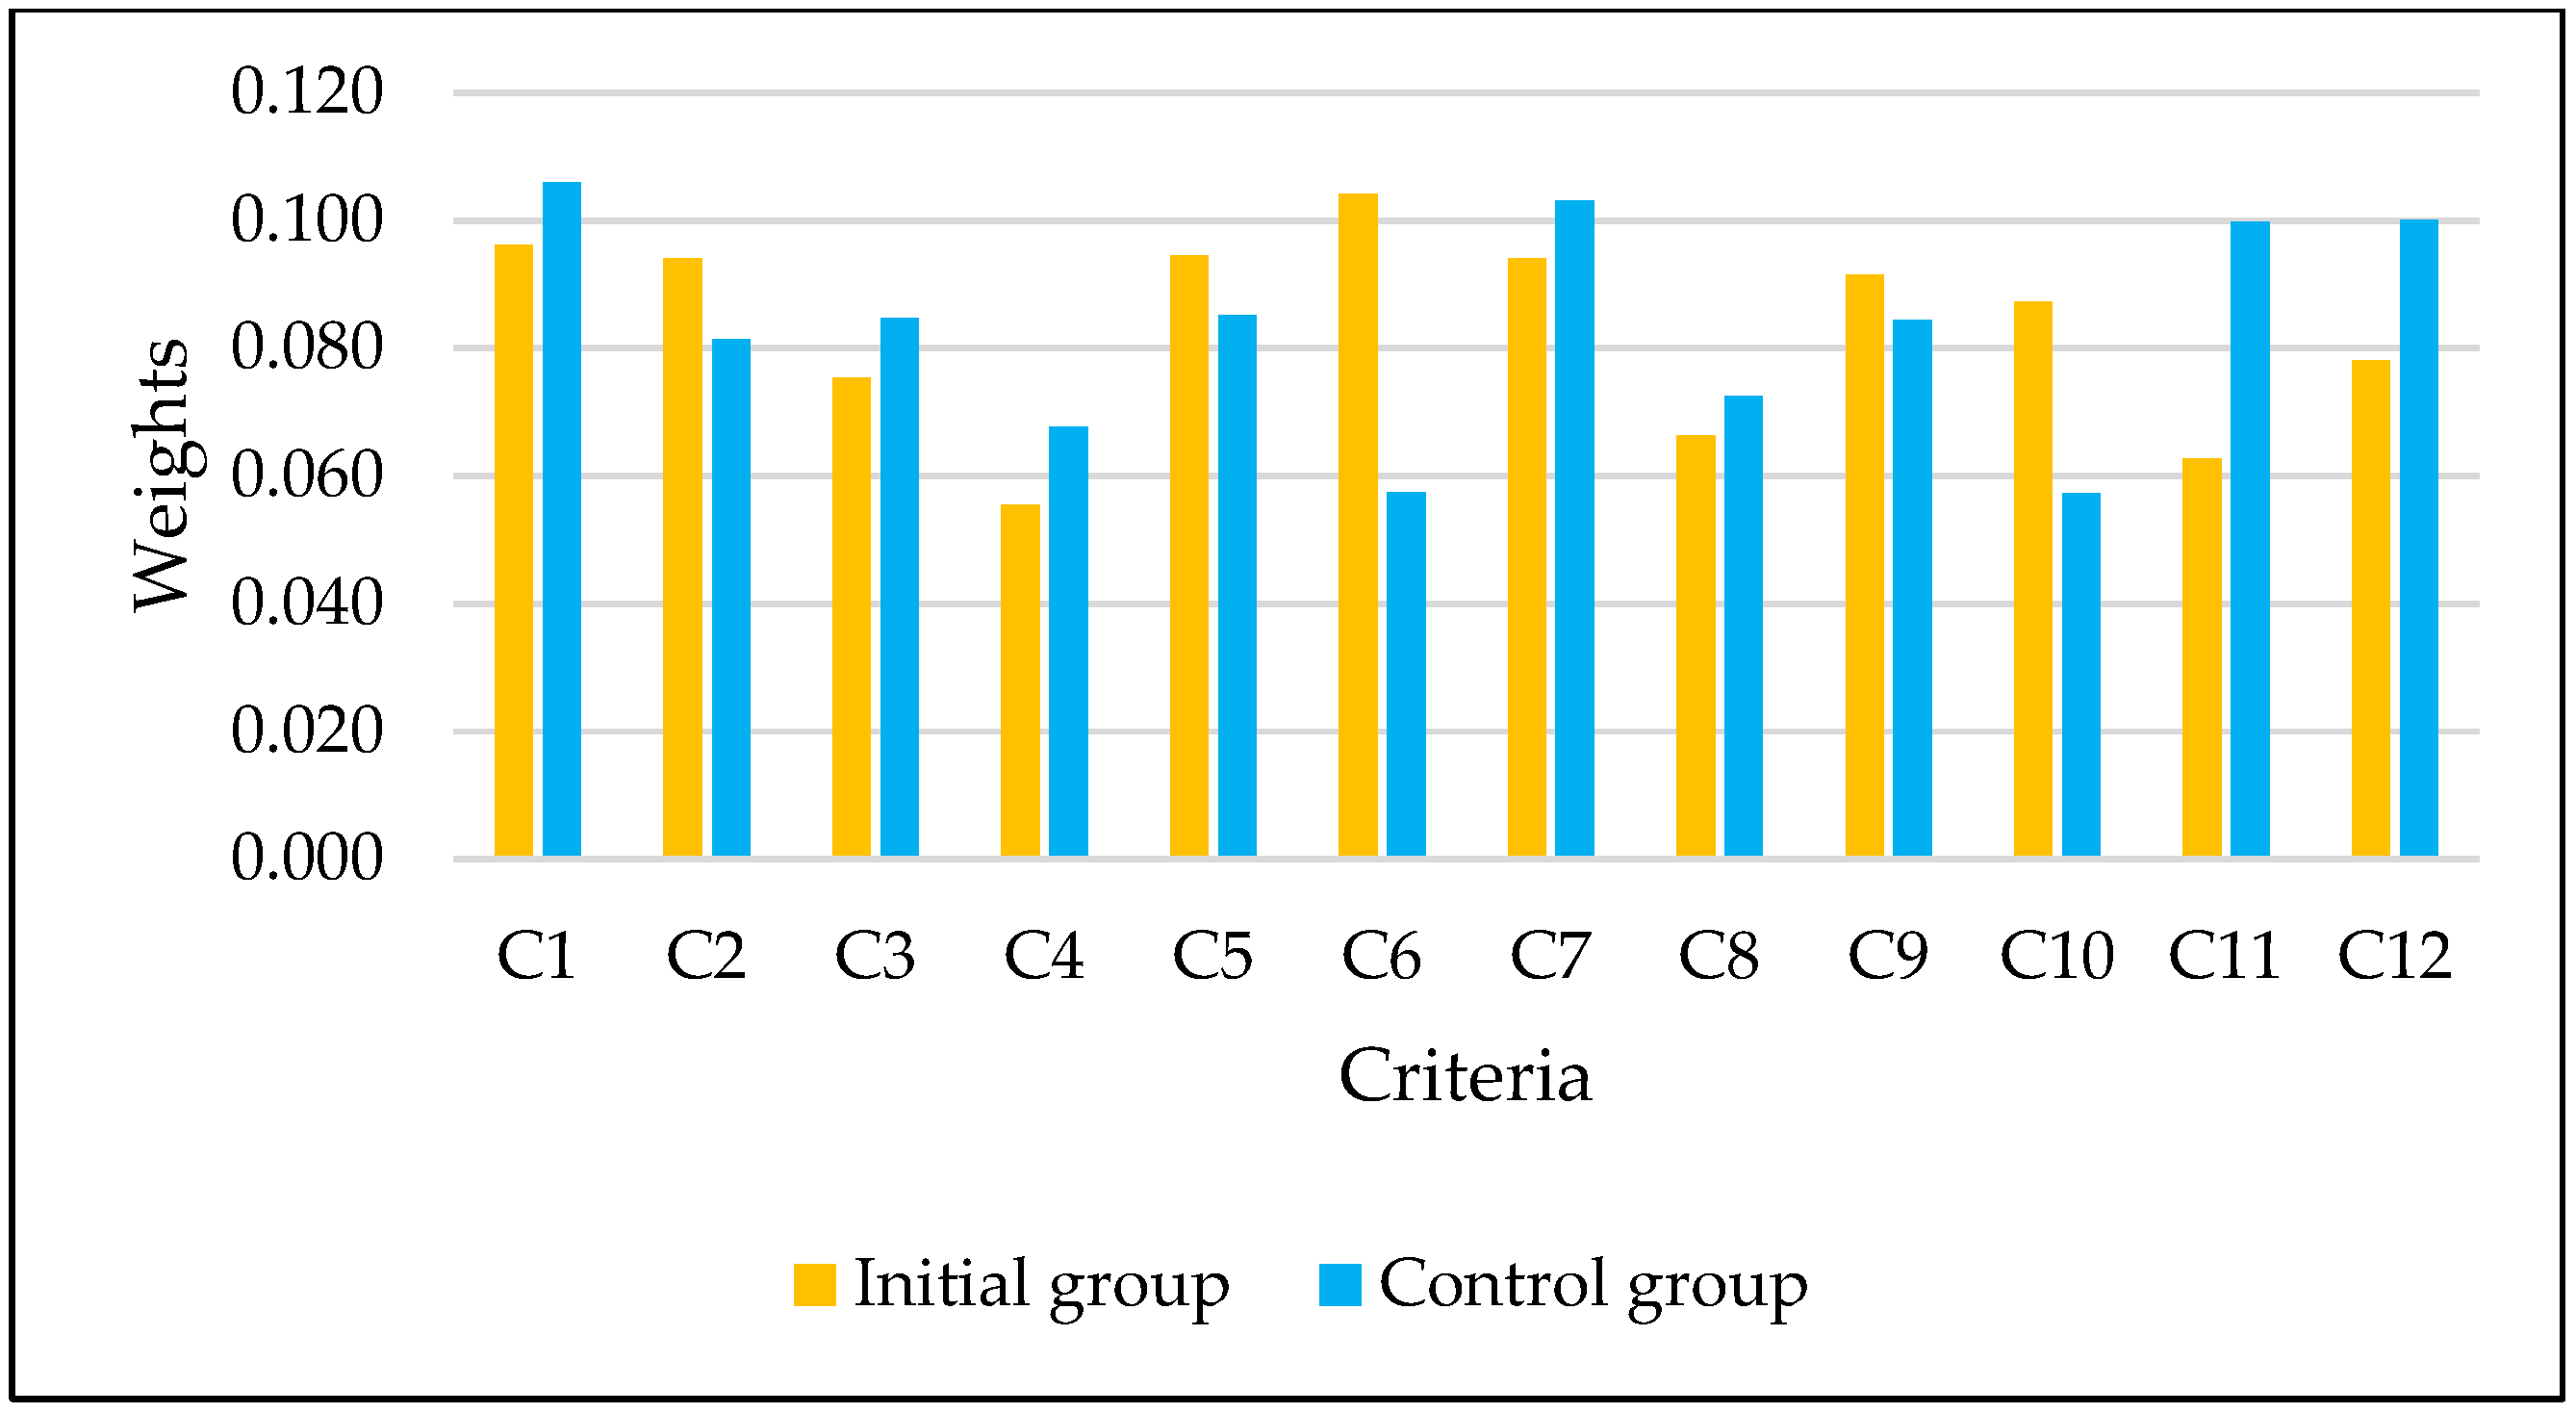
The graphical relationship between the results of the initial and control groups of experts is presented in Figure 10. Even though the results are intuitively similar, we performed a statistical test to examine whether there is a statistically significant difference between these two groups. The results of the unpaired t-test confirmed that the difference in results between the initial (Mean = 0.0832; SD = 0.0155) and control group of experts (Mean = 0.0833; SD = 0.0170) is considered to be not statistically significant (p value equals 0.9901; t = 0.0125; df = 22).

5.3.3. Comparative Analysis

When introducing a new methodological framework, it is useful to compare the results with similar techniques. In this paper, we chose two other MCDM approaches to assess the weights of criteria—CIMAS and AHP. A motive for selecting these methods is that the first incorporates just one parameter that describes the reputation of the expert, in contrast to Fullex, which uses two parameters, and the other, the AHP method, does not consider such a parameter at all.
The results of the comparative analysis are presented in Figure 11. As can be seen, the order of the criteria (Table 14) is not the same in different approaches. This leads to the conclusion that experts’ reputations affect the obtained results. The most significant difference in results can be noticed when comparing the Extended FullEx with the AHP method. This is expected, not only because the AHP does not calculate the influence of experts’ reputations, but also because the data from experts should be collected differently. While in the case of CIMAS and Extended FullEx, the pairwise comparison is performed in a binary manner, the AHP implies comparison using Saaty’s scale. For calculations in this paper, we translate the binary comparison to Saaty’s scale by comparing the number of “wins” of one criterion over all others. However, it is expected that the results would be more accurate if the experts gave their answers directly based on Saaty’s scale.
Another interesting fact to notice in the comparative analysis is that the standard deviations differ in the implemented approaches. The highest standard deviation considering the obtained values per criterion by a single approach is in the case of AHP (0.062), followed by the CIMAS (0.048), while the results of the Extended FullEx (0.015) are the least dispersive. It would be welcome to further compare this phenomenon in the following studies.

5.3.4. Contribution to Knowledge and Managerial Implications

This study makes an important contribution to the literature by introducing the Extended FullEX method for the first time. Previous MCDM approaches, such as AHP, BWM, or FUCOM, primarily treated expert judgments equally, without considering their credibility or reputation. By integrating a reputation-based weighting system, the original Fullex method addressed this gap, offering a more realistic representation of expert-based decision-making. However, the authors noticed a space for methodological improvements and, accordingly, proposed the Extended FullEX. Moreover, the hybridization of Extended FullEX and MARCOS enhances methodological robustness by combining reputation-sensitive weighting with reliable normalization and ranking, which has not been previously applied in the evaluation of collaborative last-mile strategies. This approach provides a solid foundation for future research on shared economy-based logistics models.
When it comes to the managerial implications, the findings of this study offer actionable insights for both logistics companies and city planners. The identified optimal strategy, based on consolidation centers and urban hubs, serves as a blueprint for implementing collaborative and efficient last-mile delivery solutions. For logistics managers, this model facilitates the optimization of resources, reduction in operational costs, and improvement in customer satisfaction through more sustainable delivery systems. For public sector actors, it supports policy development focused on urban mobility, emissions reduction, and smart city integration. The implementation of such strategies can be enhanced through emerging technologies: artificial intelligence (AI) that enables dynamic routing and demand forecasting, while generative AI can assist in simulating urban hub configurations and delivery scenarios tailored to local needs [72,73]. When paired with the Extended FullEx–MARCOS model, these technologies empower data-driven decisions and support the creation of resilient, scalable, and sustainable urban logistics networks.
In practical terms, city authorities could use this model to simulate different collaboration scenarios among delivery operators before implementing policy changes, such as subsidies for shared urban hubs or regulations promoting low-emission vehicles. Logistics providers may also employ the Extended FullEx–MARCOS framework to identify cost-effective investments, including weather-adaptive electric fleets or AI-based route optimization systems [74]. Furthermore, the model can serve as a decision-support tool for smart city platforms by integrating IoT-based real-time data to dynamically adjust delivery strategies according to traffic and weather conditions [75].

6. Conclusions

This paper proposes a combined multi-criteria decision-making framework, Extended FullEX–MARCOS, to evaluate last-mile delivery strategies in urban areas. Its applicability is demonstrated through a case study in Novi Sad, where a hybrid model combining consolidation centers and urban hubs achieved the best performance. The main contribution relates to the proposal of a new Extended Fullex method to be used in the procedure of determining the criteria weights. The improvement is made in the part where the reputation of experts is calculated using educational level and professional experience. The changes are twofold: in the normalization procedure for both parameters and in a new way for educational level scoring.
Educational level and professional experience were selected as parameters for the calculation of expert reputation due to their objectivity, transparency, and ease of verification. Other potential factors, such as the expert’s institutional affiliation or specific domain relevance, were excluded from this model due to the difficulty of objectively quantifying their influence and ensuring consistency across experts. By focusing on measurable attributes, the proposed approach maintains methodological rigor and avoids subjective bias.
On the other hand, the goal of this paper was to improve the existing method, Fullex, where educational level and professional experience are two parameters considered in the model. This is the reason why we used the same parameters in the proposed Extended FullEx method as in the original approach. However, as a direction for future research, some other parameters can be added as well, such as the relevance of the expert’s work or department, the level of connection between work experience and considered problem, the compliance between current work position and considered problem, and similar.
This paper considers the problem of shipment delivery strategy. We considered four alternatives: Traditional Model—Status Quo (A1), Unified Consolidation Center (A2), Urban Hubs (A3), and Hybrid Delivery Model—Consolidation Center and Urban Hubs (A4). The implemented methodology indicated that the hybrid delivery model (A4), combining a consolidation center and urban hubs, is the most suitable strategy for online order delivery in Novi Sad. This model outperformed other alternatives (traditional model, unified consolidation center, and urban hubs) due to its ability to integrate the benefits of collaboration and flexibility in utilizing various transportation modes. The results obtained using the Extended FullEx approach indicate that adaptation to weather conditions (C6) and reduction in harmful emissions (C1) are key decision-making criteria, reflecting global sustainable development priorities.
The practical significance of this research lies in its ability to provide guidelines for city authorities and logistics companies to establish more efficient and sustainable delivery systems. For instance, city authorities in Novi Sad could invest in infrastructure for consolidation centers and urban hubs, while logistics companies could establish collaborative networks to optimize resources. Future research could focus on testing this model in other cities and integrating advanced technologies such as artificial intelligence to further enhance delivery efficiency.
The results confirmed that technological adaptability and environmental criteria are top priorities in sustainable LMD. These findings can help decision-makers prioritize investments in infrastructure and vehicle technology. The proposed model offers not only a theoretical framework but also a practical tool that can be applied in similar urban environments beyond Novi Sad.
In managerial terms, the results offer a structured and evidence-based approach to evaluating collaborative LMD strategies. The proposed method enables urban logistics stakeholders to systematically incorporate expert knowledge, sustainability concerns, and emerging collaborative trends when selecting suitable delivery strategies. Moreover, the model is compatible with future integration of AI-driven tools, such as real-time optimization and generative logistics planning, providing room for dynamic decision support in smart city contexts.
These results provide valuable insights for city planners and logistics operators, as they highlight the importance of investing in shared consolidation infrastructure and adopting environmentally friendly delivery technologies. The proposed methodology offers a practical tool for improving the efficiency and sustainability of urban logistics networks.
Despite its contributions, this study has certain limitations. The number of experts was relatively small, which may influence the generalizability of the results. However, we introduced a control group of experts, and the obtained results do not indicate any statistically significant changes. Although the selection was based on academic qualifications and professional experience, other factors such as domain-specific authority were not included. Future research should test the model in different urban contexts and with larger expert panels. Additionally, the integration of dynamic data, such as IoT-based traffic and weather information, and AI-driven optimization tools could further enhance the adaptability and practical application of the proposed framework.
Future research can also be directed toward testing the proposed methodology in different cases. Additionally, the proposed methodology can be further upgraded. For example, in the circumstances of linguistic answers from experts, a convenient improvement of this methodology can be the introduction of a fuzzy environment in the calculations.

Author Contributions

Conceptualization, M.N. and M.D.; methodology, M.N., M.D. and S.B.; software, M.D. and S.B.; validation, M.N., M.D. and S.B.; formal analysis, M.N., Đ.D. and S.D.; investigation, M.N. and M.D.; resources, S.D. and D.L.; data curation, D.L. and Đ.D.; writing—original draft preparation M.N., M.D. and S.B.; writing—review and editing, M.N. and M.D.; visualization, M.N., M.D. and D.L. All authors have read and agreed to the published version of the manuscript.

Funding

This research has been supported by the Ministry of Science, Technological Development and Innovation of the Republic of Serbia through Contract No. 451-03-136/2025-03/200156 and by the University of Pardubice through the project SGS_2025 ‘Modelling of Selected Aspects of Transportation Technology and Control V’.

Institutional Review Board Statement

Not applicable.

Informed Consent Statement

Informed consent was obtained from all subjects involved in the study.

Data Availability Statement

All data are provided in this paper.

Conflicts of Interest

The authors declare no conflicts of interest.

Abbreviations

The following abbreviations are used in this manuscript:
LMDlast-mile delivery
MARCOSmeasurement of alternatives and ranking according to compromise solution
MCDMmulti-criteria decision-making
UCCurban consolidation centers

Appendix A. Answers from Expert 1

Table A1. Answers related to the Extended FullEX method from Expert 1.
C1C1C1C1C1C1C1C1C1C1C1
C2C3C4C5C6C7C8C9C10C11C12
C2C2C2C2C2C2C2C2C2C2
C3C4C5C6C7C8C9C10C11C12
C3C3C3C3C3C3C3C3C3
C4C5C6C7C8C9C10C11C12
C4C4C4C4C4C4C4C4
C5C6C7C8C9C10C11C12
C5C5C5C5C5C5C5
C6C7C8C9C10C11C12
C6C6C6C6C6C6
C7C8C9C10C11C12
C7C7C7C7C7
C8C9C10C11C12
C8C8C8C8
C9C10C11C12
C9C9C9
C10C11C12
C10C10
C11C12
C11
C12
Table A2. Answers related to the MARCOS method from Expert 1.
C1C2C3C4C5C6C7C8C9C10C11C12
A1999887215191
A2643597856674
A3567232727488
A4211256936789

Appendix B. Answers from Expert 2

Table A3. Answers related to the Extended FullEX method from Expert 2.
C1C1C1C1C1C1C1C1C1C1C1
C2C3C4C5C6C7C8C9C10C11C12
C2C2C2C2C2C2C2C2C2C2
C3C4C5C6C7C8C9C10C11C12
C3C3C3C3C3C3C3C3C3
C4C5C6C7C8C9C10C11C12
C4C4C4C4C4C4C4C4
C5C6C7C8C9C10C11C12
C5C5C5C5C5C5C5
C6C7C8C9C10C11C12
C6C6C6C6C6C6
C7C8C9C10C11C12
C7C7C7C7C7
C8C9C10C11C12
C8C8C8C8
C9C10C11C12
C9C9C9
C10C11C12
C10C10
C11C12
C11
C12
Table A4. Answers related to the MARCOS method from Expert 2.
C1C2C3C4C5C6C7C8C9C10C11C12
A1999775314393
A2433694748585
A3535463639497
A4321373839699

Appendix C. Answers from Expert 3

Table A5. Answers related to the Extended FullEX method from Expert 3.
C1C1C1C1C1C1C1C1C1C1C1
C2C3C4C5C6C7C8C9C10C11C12
C2C2C2C2C2C2C2C2C2C2
C3C4C5C6C7C8C9C10C11C12
C3C3C3C3C3C3C3C3C3
C4C5C6C7C8C9C10C11C12
C4C4C4C4C4C4C4C4
C5C6C7C8C9C10C11C12
C5C5C5C5C5C5C5
C6C7C8C9C10C11C12
C6C6C6C6C6C6
C7C8C9C10C11C12
C7C7C7C7C7
C8C9C10C11C12
C8C8C8C8
C9C10C11C12
C9C9C9
C10C11C12
C10C10
C11C12
C11
C12
Table A6. Answers related to the MARCOS method from Expert 3.
C1C2C3C4C5C6C7C8C9C10C11C12
A1989969225191
A2364589947663
A3653376635488
A4131157946889

Appendix D. Answers from Expert 1 from the Control Group

Table A7. Answers related to the Extended FullEX method from Expert 1 from the control group.
C1C1C1C1C1C1C1C1C1C1C1
C2C3C4C5C6C7C8C9C10C11C12
C2C2C2C2C2C2C2C2C2C2
C3C4C5C6C7C8C9C10C11C12
C3C3C3C3C3C3C3C3C3
C4C5C6C7C8C9C10C11C12
C4C4C4C4C4C4C4C4
C5C6C7C8C9C10C11C12
C5C5C5C5C5C5C5
C6C7C8C9C10C11C12
C6C6C6C6C6C6
C7C8C9C10C11C12
C7C7C7C7C7
C8C9C10C11C12
C8C8C8C8
C9C10C11C12
C9C9C9
C10C11C12
C10C10
C11C12
C11
C12

Appendix E. Answers from Expert 2 from the Control Group

Table A8. Answers related to the Extended FullEX method from Expert 2 from the control group.
C1C1C1C1C1C1C1C1C1C1C1
C2C3C4C5C6C7C8C9C10C11C12
C2C2C2C2C2C2C2C2C2C2
C3C4C5C6C7C8C9C10C11C12
C3C3C3C3C3C3C3C3C3
C4C5C6C7C8C9C10C11C12
C4C4C4C4C4C4C4C4
C5C6C7C8C9C10C11C12
C5C5C5C5C5C5C5
C6C7C8C9C10C11C12
C6C6C6C6C6C6
C7C8C9C10C11C12
C7C7C7C7C7
C8C9C10C11C12
C8C8C8C8
C9C10C11C12
C9C9C9
C10C11C12
C10C10
C11C12
C11
C12

Appendix F. Answers from Expert 3 from the Control Group

Table A9. Answers related to the Extended FullEX method from Expert 3 from the control group.
C1C1C1C1C1C1C1C1C1C1C1
C2C3C4C5C6C7C8C9C10C11C12
C2C2C2C2C2C2C2C2C2C2
C3C4C5C6C7C8C9C10C11C12
C3C3C3C3C3C3C3C3C3
C4C5C6C7C8C9C10C11C12
C4C4C4C4C4C4C4C4
C5C6C7C8C9C10C11C12
C5C5C5C5C5C5C5
C6C7C8C9C10C11C12
C6C6C6C6C6C6
C7C8C9C10C11C12
C7C7C7C7C7
C8C9C10C11C12
C8C8C8C8
C9C10C11C12
C9C9C9
C10C11C12
C10C10
C11C12
C11
C12

References

  1. Zhu, X.; Cai, L.; Lai, P.L.; Wang, X.; Ma, F. Evolution, Challenges, and Opportunities of Transportation Methods in the Last-Mile Delivery Process. Systems 2023, 11, 509. [Google Scholar] [CrossRef]
  2. Simić, V.; Lazarević, D.; Dobrodolac, M. Picture Fuzzy WASPAS Method for Selecting Last-Mile Delivery Mode: A Case Study of Belgrade. Eur. Transp. Res. Rev. 2021, 13, 43. [Google Scholar] [CrossRef]
  3. Karimi, A.; Mohammad, P.; García-Martínez, A.; Moreno-Rangel, D.; Gachkar, D.; Gachkar, S. New Developments and Future Challenges in Reducing and Controlling Heat Island Effect in Urban Areas. Environ. Dev. Sustain. 2023, 25, 10485–10531. [Google Scholar] [CrossRef]
  4. Ionescu, G.H.; Firoiu, D.; Manda, A.M.; Pîrvu, R.; Jianu, E.; Antoniu, M.E. Progress towards the 2030 Sustainable Development Goals for EU Urban Communities (SDG11). Sustainability 2024, 16, 4513. [Google Scholar] [CrossRef]
  5. Zhou, Q.; Nizamani, M.M.; Zhang, H.Y.; Zhang, H.L. The Air We Breathe: An In-Depth Analysis of PM2.5 Pollution in 1312 Cities from 2000 to 2020. Environ. Sci. Pollut. Res. 2023, 30, 93900–93915. [Google Scholar] [CrossRef] [PubMed]
  6. Teng, Z.; He, Y.; Wu, R. E-Commerce: Does Sustainable Logistics Development Matter? Sustainability 2023, 15, 579. [Google Scholar] [CrossRef]
  7. Lim, S.F.W.T.; Jin, X.; Srai, J.S. Consumer-Driven e-Commerce: A Literature Review, Design Framework, and Research Agenda on Last-Mile Logistics Models. Int. J. Phys. Distrib. Logist. Manag. 2018, 48, 308–332. [Google Scholar] [CrossRef]
  8. Lazarević, D.; Popović, Đ.; Çodur, M.Y.; Dobrodolac, M. Fuzzy Logic Approach for Evaluating Electromobility Alternatives in Last-Mile Delivery: Belgrade as a Case Study. Energies 2024, 17, 6307. [Google Scholar] [CrossRef]
  9. Lazarević, D.; Švadlenka, L.; Radojicic, V.; Dobrodolac, M. New Express Delivery Service and Its Impact on CO2 Emissions. Sustainability 2020, 12, 456. [Google Scholar] [CrossRef]
  10. Pan, X.; Li, M.; Wang, M.; Zong, T.; Song, M. The Effects of a Smart Logistics Policy on Carbon Emissions in China: A Difference-in-Differences Analysis. Transp. Res. Part E Logist. Transp. Rev. 2020, 137, 101939. [Google Scholar] [CrossRef]
  11. Bhattacharjya, J.; Ellison, A.; Tripathi, S. An Exploration of Logistics-Related Customer Service Provision on Twitter: The Case of e-Retailers. Int. J. Phys. Distrib. Logist. Manag. 2016, 46, 659–680. [Google Scholar] [CrossRef]
  12. Birch-Jensen, A.; Gremyr, I.; Halldórsson, Á. Digitally Connected Services: Improvements through Customer-Initiated Feedback. Eur. Manag. J. 2020, 38, 814–825. [Google Scholar] [CrossRef]
  13. Lim, S.F.W.T.; Wang, L.; Srai, J.S. Wal-Mart’s Omni-Channel Synergy. Supply Chain Manag. Rev. 2017, 21, 30–37. [Google Scholar]
  14. Gevaers, R.; Van de Voorde, E.; Vanelslander, T. Characteristics and Typology of Last-Mile Logistics from an Innovation Perspective in an Urban Context. In City Distribution and Urban Freight Transport; Macharis, C., Melo, S., Eds.; Edward Elgar Publishing: Cheltenham, UK, 2011. [Google Scholar]
  15. Wang, Y.; Zhang, D.; Liu, Q.; Shen, F.; Lee, L.H. Towards Enhancing the Last-Mile Delivery: An Effective Crowd-Tasking Model with Scalable Solutions. Transp. Res. Part E Logist. Transp. Rev. 2016, 93, 279–293. [Google Scholar] [CrossRef]
  16. Hübner, A.; Kuhn, H.; Wollenburg, J. Last Mile Fulfilment and Distribution in Omni-Channel Grocery Retailing: A Strategic Planning Framework. Int. J. Retail Distrib. Manag. 2016, 44, 228–247. [Google Scholar] [CrossRef]
  17. Schwerdfeger, S.; Boysen, N. Optimizing the Changing Locations of Mobile Parcel Lockers in Last-Mile Distribution. Eur. J. Oper. Res. 2020, 285, 1077–1094. [Google Scholar] [CrossRef]
  18. Pamucar, D.; Lazarević, D.; Dobrodolac, M.; Simic, V.; Görçün, Ö.F. Prioritization of Crowdsourcing Models for Last-Mile Delivery Using Fuzzy Sugeno–Weber Framework. Eng. Appl. Artif. Intell. 2024, 128, 107414. [Google Scholar] [CrossRef]
  19. Ha, Q.M.; Deville, Y.; Pham, Q.D.; Hà, M.H. On the Min-Cost Traveling Salesman Problem with Drone. Transp. Res. Part C Emerg. Technol. 2018, 86, 597–621. [Google Scholar] [CrossRef]
  20. Dobrodolac, M.; Čubranić-Dobrodolac, M.; Jovčić, S. Special Issue: “Fuzzy Logic Applications in Traffic and Transportation Engineering”. Mathematics 2025, 13, 1313. [Google Scholar] [CrossRef]
  21. Xu, W.; Jiang, J.; Wang, W.; Pang, K.-W.; Xu, J.; Jiang, R.; Liu, R. Parcel-Locker-Sharing Model for E-Commerce Logistics Service Providers. Mathematics 2024, 12, 2802. [Google Scholar] [CrossRef]
  22. Svadlenka, L.; Simic, V.; Dobrodolac, M.; Lazarevic, D.; Todorovic, G. Picture Fuzzy Decision-Making Approach for Sustainable Last-Mile Delivery. IEEE Access 2020, 8, 209393–209414. [Google Scholar] [CrossRef]
  23. Guerreiro Augusto, M.; Maas, J.; Kosch, M.; Henke, M.; Küster, T.; Straube, F.; Albayrak, S. Autonomous Van and Robot Last-Mile Logistics Platform: A Reference Architecture and Proof of Concept Implementation. Logistics 2025, 9, 10. [Google Scholar] [CrossRef]
  24. Lyons, T.; McDonald, N.C. Last-Mile Strategies for Urban Freight Delivery: A Systematic Review. Transp. Res. Rec. 2023, 2677, 1141–1156. [Google Scholar] [CrossRef]
  25. Montoya-Torres, J.R.; Muñoz-Villamizar, A.; Mejia-Argueta, C. Mapping Research in Logistics and Supply Chain Management during COVID-19 Pandemic. Int. J. Logist. Res. Appl. 2023, 26, 421–441. [Google Scholar] [CrossRef]
  26. Aloui, A.; Hamani, N.; Derrouiche, R.; Delahoche, L. Systematic Literature Review on Collaborative Sustainable Transportation: Overview, Analysis and Perspectives. Transp. Res. Interdiscip. Perspect. 2021, 9, 100291. [Google Scholar] [CrossRef]
  27. Shah, B.; Singh, G. Can Collaborative Buffering Strategies Reduce Distribution Costs While Improving Product Returns?: A Case of an Asian e-Retailer. Benchmarking 2021, 28, 2808–2834. [Google Scholar] [CrossRef]
  28. Mason, R.; Lalwani, C.; Boughton, R. Combining Vertical and Horizontal Collaboration for Transport Optimisation. Supply Chain Manag. 2007, 12, 187–199. [Google Scholar] [CrossRef]
  29. Argyropoulou, M.; Zissis, D.; Korfiatis, N.; Zampou, E. Horizontal Collaboration in the Last Mile Distribution: Gauging Managerial Response to Disruption and Abnormal Demand. Benchmarking 2023, 30, 460–474. [Google Scholar] [CrossRef]
  30. Basso, F.; D’Amours, S.; Rönnqvist, M.; Weintraub, A. A Survey on Obstacles and Difficulties of Practical Implementation of Horizontal Collaboration in Logistics. Int. Trans. Oper. Res. 2019, 26, 775–793. [Google Scholar] [CrossRef]
  31. Dahl, S.; Derigs, U. Cooperative Planning in Express Carrier Networks—An Empirical Study on the Effectiveness of a Real-Time Decision Support System. Decis. Support Syst. 2011, 51, 620–626. [Google Scholar] [CrossRef]
  32. Deng, Q.; Fang, X.; Lim, Y.F. Urban Consolidation Center or Peer-to-Peer Platform? The Solution to Urban Last-Mile Delivery. Prod. Oper. Manag. 2021, 30, 997–1013. [Google Scholar] [CrossRef]
  33. Jana, C.; Dobrodolac, M.; Simic, V.; Pal, M.; Sarkar, B.; Stević, Ž. Evaluation of Sustainable Strategies for Urban Parcel Delivery: Linguistic q-Rung Orthopair Fuzzy Choquet Integral Approach. Eng. Appl. Artif. Intell. 2023, 126, 106811. [Google Scholar] [CrossRef]
  34. Zissis, D.; Aktas, E.; Bourlakis, M. Collaboration in Urban Distribution of Online Grocery Orders. Int. J. Logist. Manag. 2018, 29, 1196–1214. [Google Scholar] [CrossRef]
  35. Ballot, E.; Fontane, F. Reducing Transportation CO2 Emissions through Pooling of Supply Networks: Perspectives from a Case Study in French Retail Chains. Prod. Plan. Control 2010, 21, 640–650. [Google Scholar] [CrossRef]
  36. Van Loon, P.; Deketele, L.; Dewaele, J.; McKinnon, A.; Rutherford, C. A Comparative Analysis of Carbon Emissions from Online Retailing of Fast Moving Consumer Goods. J. Clean. Prod. 2015, 106, 478–486. [Google Scholar] [CrossRef]
  37. Agarwal, U.A.; Narayana, S.A. Impact of Relational Communication on Buyer–Supplier Relationship Satisfaction: Role of Trust and Commitment. Benchmarking 2020, 27, 2459–2496. [Google Scholar] [CrossRef]
  38. Wang, D.; Hu, P.; Du, J.; Zhou, P.; Deng, T.; Hu, M. Routing and Scheduling for Hybrid Truck-Drone Collaborative Parcel Delivery with Independent and Truck-Carried Drones. IEEE Internet Things J. 2019, 6, 10483–10495. [Google Scholar] [CrossRef]
  39. Liang, Y.J.; Luo, Z.X. A Survey of Truck–Drone Routing Problem: Literature Review and Research Prospects. J. Oper. Res. Soc. China 2022, 10, 343–377. [Google Scholar] [CrossRef]
  40. Salama, M.R.; Srinivas, S. Collaborative Truck Multi-Drone Routing and Scheduling Problem: Package Delivery with Flexible Launch and Recovery Sites. Transp. Res. Part E Logist. Transp. Rev. 2022, 164, 102788. [Google Scholar] [CrossRef]
  41. Wang, Y.; Wang, Z.; Hu, X.; Xue, G.; Guan, X. Truck–Drone Hybrid Routing Problem with Time-Dependent Road Travel Time. Transp. Res. Part C Emerg. Technol. 2022, 144, 103901. [Google Scholar] [CrossRef]
  42. Gu, R.; Liu, Y.; Poon, M. Dynamic Truck–Drone Routing Problem for Scheduled Deliveries and on-Demand Pickups with Time-Related Constraints. Transp. Res. Part C Emerg. Technol. 2023, 151, 104139. [Google Scholar] [CrossRef]
  43. Luo, H.; Duan, J.; Wang, G. Mathematical Models for Truck-Drone Routing Problem: Literature Review. Appl. Math. Model. 2025, 144, 116074. [Google Scholar] [CrossRef]
  44. Wang, Y.; Sun, Y.; Guan, X.; Fan, J.; Xu, M.; Wang, H. Two-Echelon Multi-Period Location Routing Problem with Shared Transportation Resource. Knowledge-Based Syst. 2021, 226, 107168. [Google Scholar] [CrossRef]
  45. Wang, Y.; Zhou, J.; Sun, Y.; Fan, J.; Wang, Z.; Wang, H. Collaborative Multidepot Electric Vehicle Routing Problem with Time Windows and Shared Charging Stations. Expert Syst. Appl. 2023, 219, 119654. [Google Scholar] [CrossRef]
  46. Wang, Y.; Peng, S.; Zhou, X.; Mahmoudi, M.; Zhen, L. Green Logistics Location-Routing Problem with Eco-Packages. Transp. Res. Part E Logist. Transp. Rev. 2020, 143, 102118. [Google Scholar] [CrossRef]
  47. Wang, Y.; Luo, S.; Fan, J.; Zhen, L. The Multidepot Vehicle Routing Problem with Intelligent Recycling Prices and Transportation Resource Sharing. Transp. Res. Part E Logist. Transp. Rev. 2024, 185, 103503. [Google Scholar] [CrossRef]
  48. Aljohani, K.; Thompson, R.G. A Multi-Criteria Spatial Evaluation Framework to Optimise the Siting of Freight Consolidation Facilities in Inner-City Areas. Transp. Res. Part A Policy Pract. 2020, 138, 51–69. [Google Scholar] [CrossRef]
  49. Li, L.; Wang, X.; Rezaei, J. A Bayesian Best-Worst Method-Based Multicriteria Competence Analysis of Crowdsourcing Delivery Personnel. Complexity 2020, 2020, 4250417. [Google Scholar] [CrossRef]
  50. Boskovic, S.; Svadlenka, L.; Jovcic, S.; Dobrodolac, M.; Simic, V.; Bacanin, N. A New FullEX Decision-Making Technique for Criteria Importance Assessment: An Application to the Sustainable Last-Mile Delivery Courier Selection. IEEE Access 2023, 11, 137426–137436. [Google Scholar] [CrossRef]
  51. Bošković, S.; Jovčić, S.; Simic, V.; Švadlenka, L.; Dobrodolac, M.; Bacanin, N. A New Criteria Importance Assessment (CIMAS) Method in Multi-Criteria Group Decision-Making: Criteria Evaluation for Supplier Selection. Facta Univ. Ser. Mech. Eng. 2025, 23, 335–349. [Google Scholar] [CrossRef]
  52. He, Y.; Wang, X.; Zhou, F.; Lin, Y. Dynamic Vehicle Routing Problem Considering Simultaneous Dual Services in the Last Mile Delivery. Kybernetes 2020, 49, 1267–1284. [Google Scholar] [CrossRef]
  53. Comi, A.; Savchenko, L. Last-Mile Delivering: Analysis of Environment-Friendly Transport. Sustain. Cities Soc. 2021, 74, 103213. [Google Scholar] [CrossRef]
  54. Silva, V.; Amaral, A.; Fontes, T. Sustainable Urban Last-Mile Logistics: A Systematic Literature Review. Sustainability 2023, 15, 2285. [Google Scholar] [CrossRef]
  55. Stević, Ž.; Pamučar, D.; Puška, A.; Chatterjee, P. Sustainable Supplier Selection in Healthcare Industries Using a New MCDM Method: Measurement of Alternatives and Ranking According to COmpromise Solution (MARCOS). Comput. Ind. Eng. 2020, 140, 106231. [Google Scholar] [CrossRef]
  56. Boysen, N.; Fedtke, S.; Schwerdfeger, S. Last-Mile Delivery Concepts: A Survey from an Operational Research Perspective. OR Spectr. 2020, 43, 1–58. [Google Scholar] [CrossRef]
  57. Dror, M.; Hartman, B.C. Shipment Consolidation: Who Pays for It and How Much? Manage. Sci. 2007, 53, 78–87. [Google Scholar] [CrossRef]
  58. Correia, D.; Vagos, C.; Marques, J.L.; Teixeira, L. Fulfilment of Last-Mile Urban Logistics for Sustainable and Inclusive Smart Cities: A Case Study Conducted in Portugal. Int. J. Logist. Res. Appl. 2024, 27, 931–958. [Google Scholar] [CrossRef]
  59. Reyes-Rubiano, L.; Serrano-Hernandez, A.; Montoya-Torres, J.R.; Faulin, J. The Sustainability Dimensions in Intelligent Urban Transportation: A Paradigm for Smart Cities. Sustainability 2021, 13, 10653. [Google Scholar] [CrossRef]
  60. Verlinde, S.; Macharis, C.; Milan, L.; Kin, B. Does a Mobile Depot Make Urban Deliveries Faster, More Sustainable and More Economically Viable: Results of a Pilot Test in Brussels. Transp. Res. Procedia 2014, 4, 361–373. [Google Scholar] [CrossRef]
  61. Rosenberg, L.N.; Balouka, N.; Herer, Y.T.; Dani, E.; Gasparin, P.; Dobers, K.; Rüdiger, D.; Pättiniemi, P.; Portheine, P.; van Uden, S. Introducing the Shared Micro-Depot Network for Last-Mile Logistics. Sustainability 2021, 13, 2067. [Google Scholar] [CrossRef]
  62. Katsela, K.; Güneş, Ş.; Fried, T.; Goodchild, A.; Browne, M. Defining Urban Freight Microhubs: A Case Study Analysis. Sustainability 2022, 14, 532. [Google Scholar] [CrossRef]
  63. Garus, A.; Alonso, B.; Raposo, M.A.; Grosso, M.; Krause, J.; Mourtzouchou, A.; Ciuffo, B. Last-Mile Delivery by Automated Droids. Sustainability Assessment on a Real-World Case Study. Sustain. Cities Soc. 2022, 79, 103728. [Google Scholar] [CrossRef]
  64. Mohammad, W.A.M.; Nazih Diab, Y.; Elomri, A.; Triki, C. Innovative Solutions in Last Mile Delivery: Concepts, Practices, Challenges, and Future Directions. Supply Chain Forum Int. J. 2023, 24, 151–169. [Google Scholar] [CrossRef]
  65. Jaller, M.; Pineda, L.; Ambrose, H.; Kendall, A. Empirical Analysis of the Role of Incentives in Zero-Emission Last-Mile Deliveries in California. J. Clean. Prod. 2021, 317, 128353. [Google Scholar] [CrossRef]
  66. Aljohani, K.; Thompson, R.G. Profitability of Freight Consolidation Facilities: A Detailed Cost Analysis Based on Theoretical Modelling. Res. Transp. Econ. 2021, 90, 101122. [Google Scholar] [CrossRef]
  67. Xiao, Z.; Yuan, Q.; Sun, Y.; Sun, X. New Paradigm of Logistics Space Reorganization: E-Commerce, Land Use, and Supply Chain Management. Transp. Res. Interdiscip. Perspect. 2021, 9, 100300. [Google Scholar] [CrossRef]
  68. Cardenas, I.; Borbon-Galvez, Y.; Verlinden, T.; Van de Voorde, E.; Vanelslander, T.; Dewulf, W. City Logistics, Urban Goods Distribution and Last Mile Delivery and Collection. Compet. Regul. Netw. Ind. 2017, 18, 22–43. [Google Scholar] [CrossRef]
  69. Zhao, F.; Fashola, O.I.; Olarewaju, T.I.; Onwumere, I. Smart City Research: A Holistic and State-of-the-Art Literature Review. Cities 2021, 119, 103406. [Google Scholar] [CrossRef]
  70. Winter, K.; Cats, O.; Martens, K.; van Arem, B. Relocating Shared Automated Vehicles under Parking Constraints: Assessing the Impact of Different Strategies for on-Street Parking. Transportation 2021, 48, 1931–1965. [Google Scholar] [CrossRef]
  71. Čubranić-Dobrodolac, M.; Jovčić, S.; Bošković, S.; Babić, D. A Decision-Making Model for Professional Drivers Selection: A Hybridized Fuzzy–AROMAN–Fuller Approach. Mathematics 2023, 11, 2831. [Google Scholar] [CrossRef]
  72. Royappa, A.; Venkatesh, K.; Purushothaman, N.; Moorthy, A.; Solainayagi, P. AI-Driven Optimization for Freight and Logistics Management Using Predictive Analytics. In Proceedings of the 2024 International Conference on Cybernation and Computation (CYBERCOM), Dehradun, India, 15–16 November 2024; pp. 677–682. [Google Scholar] [CrossRef]
  73. Dobrodolac, M. Optimization of Industrial Process Management in Postal and Logistics Centers Based on Transit Time Quality Standards. J. Ind. Intell. 2025, 3, 12–19. [Google Scholar] [CrossRef]
  74. Vimala Ithayan, J.; Ranganathan, C.S.; Vinola, C.; Venkatesh, G.; Meenakshi, R.; Muthulekshmi, M. Smart Tracking and Surveillance Systems for Automated Delivery Robots in Food and E-Commerce Systems. In Proceedings of the 2nd International Conference on Self Sustainable Artificial Intelligence Systems (ICSSAS), Erode, India, 23–25 October 2024; pp. 1553–1558. [Google Scholar] [CrossRef]
  75. Sujatha, M.; Kovarasan, R.K.; Sudha, K.; Mishra, N.; Thiyagarajan, G.; Srinivasan, C. Smart Last-Mile Delivery with IoT-Connected Robot Vehicles. In Proceedings of the 2024 10th International Conference on Smart Computing and Communication (ICSCC), Bali, Indonesia, 25–27 July 2024; pp. 417–422. [Google Scholar] [CrossRef]
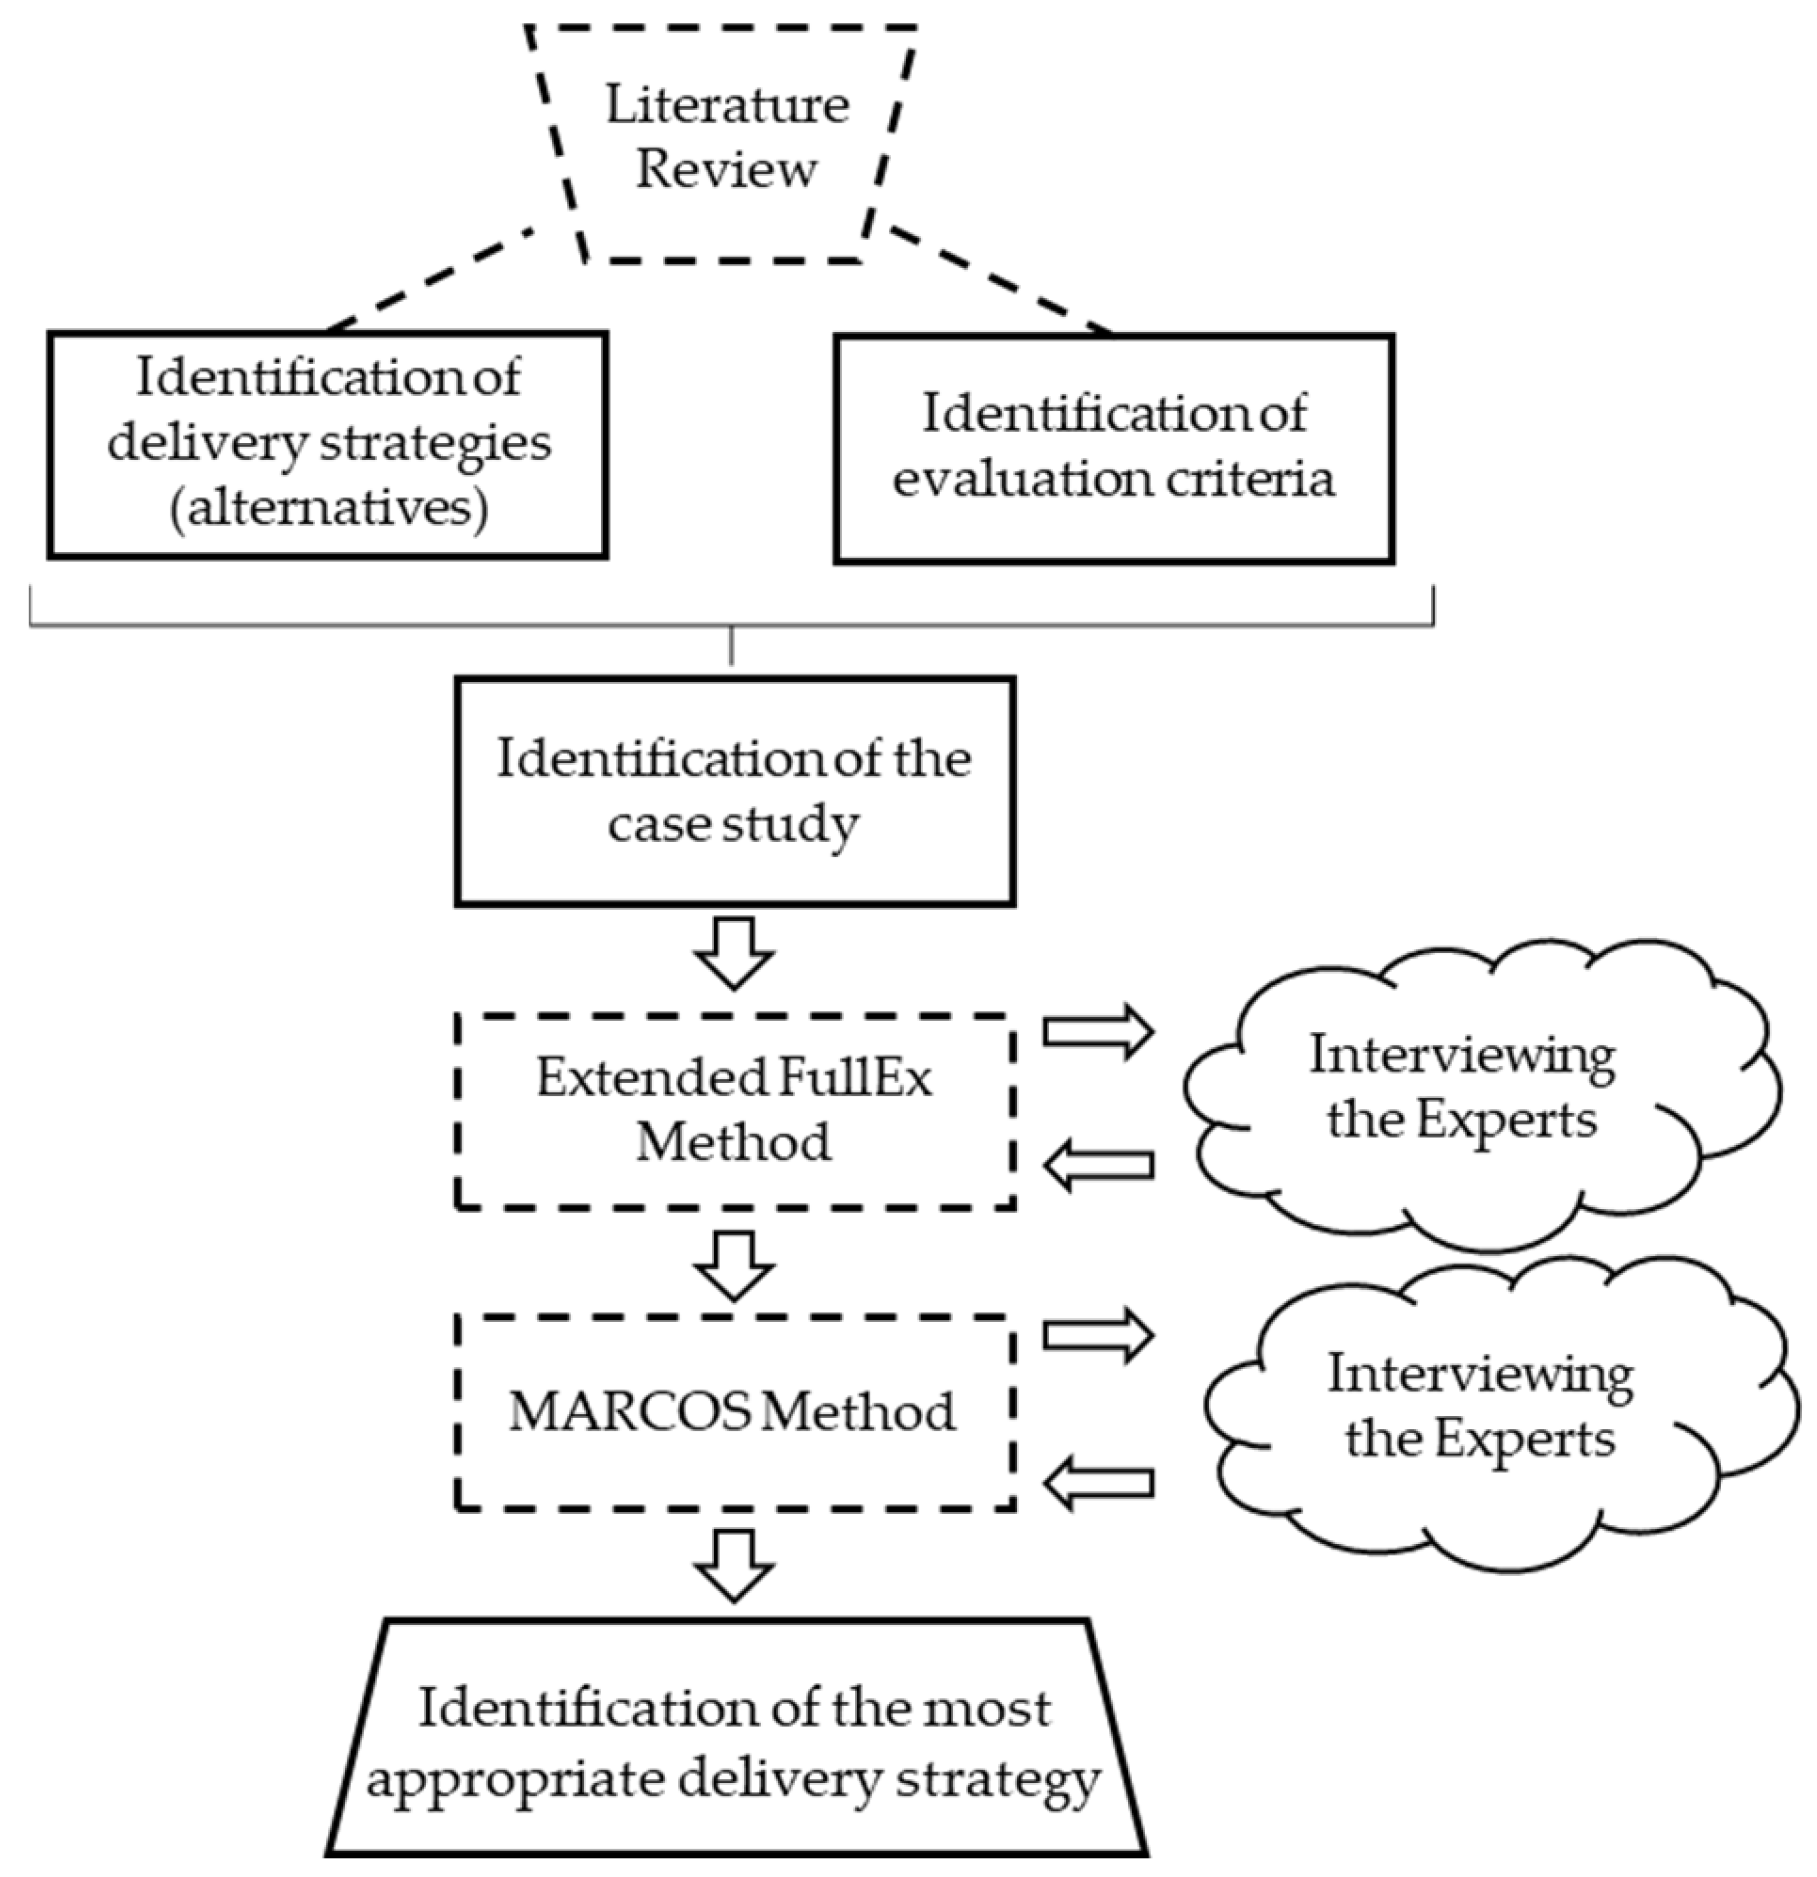
Figure 1. Research configuration.
Jtaer 20 00207 g001
Figure 2. An example of the criteria comparison structure. The answer of the expert in the pairwise comparison is marked by the blue color.
Jtaer 20 00207 g002
Figure 3. The position of the Vojvodina region and its capital, Novi Sad. On the left side of the Figure, The Republic of Serbia is marked with darker yellow, while on the right side Vojvodina is shown.
Jtaer 20 00207 g003
Figure 4. The branches of the main postal operators in Novi Sad.
Jtaer 20 00207 g004
Figure 5. The analyzed alternatives.
Jtaer 20 00207 g005
Figure 6. Criteria for evaluation.
Jtaer 20 00207 g006
Figure 7. A flowchart of the implemented Extended FullEX method.
Jtaer 20 00207 g007
Figure 8. Criteria weights obtained by the Extended FullEX method.
Jtaer 20 00207 g008
Figure 9. The ranks of alternatives obtained by the Extended FullEX-MARCOS method.
Jtaer 20 00207 g009
Figure 10. The difference between the criteria weights of the two groups of experts.
Jtaer 20 00207 g010
Figure 11. The results of the comparative analysis between AHP, CIMAS, and Fullex.
Jtaer 20 00207 g011
Table 1. Comparison of subjective MCDM methods.
MethodPairwise Comparison ScaleExperts
Included
The Expert’s
Experience
The Expert’s Educational Degree
AHP1–9 (Saaty’s scale)YesNoNo
SWARA1–9YesNoNo
BWM1–9YesNoNo
FUCOMInteger/DecimalYesNoNo
CIMASBinaryYesYesNo
FullExBinaryYesYesYes
Table 2. An example of the initial input matrix.
Experts/Criteria C 1 C 2 C j C p
E 1 x 11 x 12 x 1 p
E 2 x 21 x 22 x 2 p
E i x i j
E q x q 1 x q 2 x q p
E 1 E q are experts wherein their number is q, C 1 C p are criteria wherein their number is p, x i j is the expert’s criteria for importance assessments.
Table 3. Expert-weighted matrix.
Experts/Criteria C 1 C 2 C j C P
E 1 r 11 r 12 r 1 j r 1 p
E 2 r 21 r 22 r 2 j r 2 p
E i
E q r i 1 r i 2 r i j r i p
V j   m a x V 1   m a x V 2   m a x V j   m a x V   p   m a x
Table 4. The considered alternatives.
LabelAlternativesKey Description
A1Traditional Model—Status QuoDelivery from out-of-city centers, inefficient routing, high environmental impact, and increased parking demand.
A2Unified ConsolidationCentralized parcel consolidation, cost reduction, eco-friendly, diverse vehicles, and company collaboration.
A3Urban HubsSmall in-city logistics centers, optimized delivery, sustainable transport, and potential traffic/parking issues.
A4Hybrid Delivery Model (Consolidation Center and Urban Hubs)Combining a consolidation center and urban hubs, enhanced collaboration, eliminates route overlap, higher efficiency.
Table 5. The identified criteria.
CriterionCategoryKey Description
C1: Harmful EmissionsEnvironmentalEmissions depend on vehicle number, type, and delivery frequency; innovative technologies reduce emissions.
C2: Noise PollutionEnvironmentalUrban deliveries increase noise; smaller, eco-friendly vehicles reduce noise pollution.
C3: Traffic CongestionEnvironmentalCentralized delivery and zero-emission vehicles reduce congestion and enhance urban mobility.
C4: Distance to End-UserTechnicalShorter distances improve efficiency, reduce costs, and lower emissions.
C5: Delivery CapacityTechnicalVaries by model; limited cargo space may delay subsequent deliveries.
C6: Adaptation to WeatherTechnicalReliable delivery models maintain efficiency in adverse weather conditions.
C7: Investment in TechnologiesEconomicCosts for modernizing systems with ICT, eco-friendly vehicles, and AI technologies.
C8: Financial IncentivesEconomicSubsidies and tax breaks encourage sustainable delivery practices.
C9: Infrastructure SuitabilityEconomicDelivery model feasibility depends on geographic and infrastructure conditions.
C10: Customer SatisfactionSocialTimely delivery and good conditions are key to customer satisfaction.
C11: Compliance with RegulationsSocialModels must align with laws, urban planning, and competition rules.
C12: Accessibility of Delivery LocationsSocialOptimizing parking with smaller vehicles reduces congestion and infrastructure strain.
Table 6. Data about experts.
ExpertsYEEDExpert Reputation ( W N E i )
E1680.3553
E2840.2776
E31150.3671
Table 7. The initial input matrix based on the experts’ assessments.
C1C2C3C4C5C6C7C8C9C10C11C12
E19694669321011
E2766189933635
E38441866731153
Table 8. The normalized input data matrix.
C1C2C3C4C5C6C7C8C9C10C11C12
E10.3750.3750.4740.6670.2730.2860.3750.2310.2500.3700.1110.111
E20.2920.3750.3160.1670.3640.4290.3750.2310.3750.2220.3330.556
E30.3330.2500.2110.1670.3640.2860.2500.5380.3750.4070.5560.333
Table 9. Expert-weighted matrix in the case study.
C1C2C3C4C5C6C7C8C9C10C11C12
E10.1330.1330.1680.2370.0970.1020.1330.0820.0890.1320.0390.039
E20.0810.1040.0880.0460.1010.1190.1040.0640.1040.0620.0930.154
E30.1220.0920.0770.0610.1330.1050.0920.1980.1380.1500.2040.122
Table 10. Optimal decision-making matrix.
C1C2C3C4C5C6C7C8C9C10C11C12
E11.0001.0001.0001.0000.7260.8531.0000.4150.6450.8800.1940.256
E20.6080.7810.5210.1950.7561.0000.7810.3240.7560.4130.4541.000
E30.9180.6890.4590.2581.0000.8810.6891.0001.0001.0001.0000.793
Table 11. Initial decision-making matrix.
C1C2C3C4C5C6C7C8C9C10C11C12
A19.0008.6679.0008.0007.0007.0002.3331.3334.6671.6679.0001.667
A24.3334.3333.3335.3338.6676.6678.0004.3337.0005.6677.0004.000
A35.3334.6675.0003.0005.3333.6676.3332.6677.0004.0008.3337.667
A42.0002.0001.0002.0005.6675.3338.6673.3337.0007.0008.3339.000
Table 12. Calculation of the rate of inconsistency.
Criteria w j Expert 1
[%]
Expert 2
[%]
Expert 3
[%]
Average
Assessment— p j
w j 100 p j R I j
C10.096210101010.00000.37560.0038
C20.094199109.33330.07800.0008
C30.07547555.66671.87760.0188
C40.05546565.66670.12830.0013
C50.09461191110.33330.87560.0088
C60.104212111211.66671.24850.0125
C70.09419101210.33330.92200.0092
C80.06635655.33331.29220.0129
C90.091511989.33330.18290.0018
C100.087391199.66670.93220.0093
C110.06285776.33330.05670.0006
C120.07816856.33331.47390.0147
RI = 0.0944
Table 13. The obtained criteria weights by the initial and control group of experts.
Group of
Experts
C1C2C3C4C5C6C7C8C9C10C11C12
Initial group0.0960.0940.0750.0550.0950.1040.0940.0660.0920.0870.0630.078
Control group0.1060.0810.0850.0680.0850.0570.1030.0730.0840.0570.1000.100
Table 14. Order of criteria weights.
MethodOrder of Criteria Weights
AHPC10 > C1 > C7 > C11 > C5 > C3 > C2 > C6 > C8 > C9 > C12 > C4
CIMASC8 > C6 > C12 > C10 > C4 > C9 > C5 > C1 > C11 > C2 > C7 > C3
Extended FullexC6 > C1 > C5 > C2 > C7 > C9 > C10 > C12 > C3 > C8 > C11 > C4
Disclaimer/Publisher’s Note: The statements, opinions and data contained in all publications are solely those of the individual author(s) and contributor(s) and not of MDPI and/or the editor(s). MDPI and/or the editor(s) disclaim responsibility for any injury to people or property resulting from any ideas, methods, instructions or products referred to in the content.