Article

Sustainable Food Package Supplier Selection in Business-to-Business Websites Based on Online Reviews with a Novel Approach

Logistics Management Department, College of Management Science, Chengdu University of Technology, Chengdu 610059, China
*
Author to whom correspondence should be addressed.
J. Theor. Appl. Electron. Commer. Res. 2025, 20(3), 163; https://doi.org/10.3390/jtaer20030163
Submission received: 6 April 2025 / Revised: 17 June 2025 / Accepted: 24 June 2025 / Published: 1 July 2025

Abstract

Suppliers nowadays can be directly approached in business-to-business (B2B) E-commerce websites. This makes the product and service information of certain suppliers accessible in online reviews. Therefore, online reviews have become important for B2B supplier evaluation and selection. Recently, the sustainability of food packaging has attracted increasing attention from companies and consumers. This study developed a novel multi-criteria decision making (MCDM) method called Percentage Assessment with Synergistic Comparisons And Aggregated Ranks (PASCAAR) to support the selection of sustainable food package suppliers based on online review information in B2B E-commerce websites. Such a method used three different percentage comparisons between alternatives and the minimal options, and then aggregates the comparisons with their ranks. This study confirmed the effectiveness of PASCAAR by applying it to a case study to select the supplier of sustainable food packages (i.e., biodegradable food containers) from six candidates in the B2B E-commerce website by considering multi-dimensional online review information and their own product properties. Using PASCAAR, this study obtained the outcome that the third candidate is the most suitable one, as quantitative results indicate this supplier has the highest PASCAAR score. Based on the results, this study further conducted thorough sensitivity tests to validate the results. It can be found that, compared with the classical MCDM methods in measuring the performance of alternatives and aggregating evaluation scores, the PASCAAR method can have more robust and informative results. This study also developed a PASCAAR Solver to enable easy implementation of this method. This study contributes to the existing literature by providing new ranking and aggregation ideas in MCDM and can offer practitioners a more informative and highly actionable method for supplier selection and decision support system development by utilizing online review information.

1. Introduction

In recent years, due to the increase in carbon emissions and environmental pollution, sustainable management has drawn great attention from both governments and companies [1]. Therefore, multiple policies have been designed to drive companies to adopt more sustainable management practices. For example, in China, the government has issued the “Green and Low-Carbon Transition Industry Guidance Catalog for 2024 Edition” (see: https://www.ndrc.gov.cn/) to encourage companies to transform from resource-intensive operations to more sustainable operations, reducing carbon emissions and environmental harms.
The food industry is one of the industries producing high wastes and carbon emissions [2,3]. Therefore, achieving sustainability can greatly enhance the competitiveness of food companies and realize their corporate social responsibility. One of the main barriers that hinders the pursuit of sustainability for food companies is food packaging. The choice of inappropriate food packages can not only cause severe resource wastes and environmental pollution, but can also harm customer health [2]. This means companies nowadays can significantly benefit from sustainable and green packaging [4,5], such as paper-made food containers which are bio-degradable and environmental-friendly.
However, it can be difficult for food companies to choose and use appropriate sustainable packages, and significant aids and supports are needed from their suppliers. Therefore, the first and foremost task is the sustainable food package supplier selection (SFPSS). Considering that the indicators of SFPSS are essentially multi-facets (e.g., price, quality, size, service, etc.), the selection task is essentially an MCDM problem. To effectively solve it, the prior literature has provided different methods, such as Simple Additive Weighting (SAW) by MacCrimmon [6], the Technique for Order Preference by Similarity to Ideal Solution (TOPSIS) by Hwang and Yoon [7], Weighted Aggregated Sum Product Assessment (WASPAS) by Zavadskas et al. [8], Combined Compromised Solution (CoCoSo) by Yazdani et al. [9], Additive Ratio ASsessment (ARAS) by Zavadskas and Turskis [10], etc. Although each method has their own strengths, it is still necessary to improve the MCDM methods to cope with the tasks for SFPSS, as nowadays they have become increasingly complex.
To obtain a better decision in SFPSS, this study proposed a new MCDM method called Percentage Assessment with Synergistic Comparisons and Aggregated Ranks (PASCAAR). Compared with the previous literature, it can better capture information from an alternative decision matrix by utilizing different ratio indicators, producing more robust evaluation results. The performance of PASCAAR was tested by applying it to the SFPSS in a B2B E-commerce website and its effectiveness was confirmed in the MCDM context. This study also developed a PASCAAR Solver in the Supplementary Materials to enable a fast and easy implementation of this method.
This study is believed to have the following academic and practical contributions:
From an academic perspective, it proposed a new MCDM method which is able to provide informative and robust evaluation results. The method utilized the novel ratio indicators and aggregation approaches that are effective but largely ignored by the previous literature. Therefore, this study can offer new methodological foundations in MCDM studies for future research to create effective algorithms for different evaluation and assessment tasks.
Practically speaking, the PASCAAR method proposed is easy to implement with a little computational cost, but its results have high interpretability to decision makers. Therefore, practitioners can benefit from the method by applying PASCAAR to SFPSS and upgrade their decision support systems.
The structure of this paper is as follows. After the introduction, Section 2 reviews the previous literature relevant to this study. The PASCAAR decision procedures were articulated in Section 3, followed by an illustrative case study of B2B E-commerce sustainable package supplier selection in Section 4. The strengths of the methods were discussed in Section 5, with the conclusion of the whole study in Section 6.

2. Literature Review

There are three streams of literature relevant to our study, namely sustainability in the food industry, B2B food transaction studies, and MCDM in supplier selection. This section will review each of them sequentially and then summarize the research gaps in the existing literature.

2.1. Sustainability in the Food Industry

This study is closely related to the literature of sustainability in the food industry. In the existing literature, this study summarized three key research directions in this topic. First, the previous literature focused on the measurement of sustainable levels in the food industry. For example, Azzurra et al. [11] measured the sustainability food consumption levels. Using fuzzy logic, the authors developed an index system to evaluate the regional food consumption sustainability and explored the driving factors of it. Desiderio et al. [12] constructed a systematic literature review to summarize the tools and indicators for social sustainability levels in food supply chains. They found that the tools and indicators were mainly developed and applied to the food production stages, followed by the processing stage. The food consumption stage, however, had the least attention. Zarei et al. [13] focused on the agricultural system and developed hybrid indicator sets to measure its water, energy and food sustainability. Using AHP and expert rating, the importance of agricultural sustainability factors was sorted.
Second, the literature focused on how technologies can drive the development of food sustainability. For example, Kamble et al. [14] conducted a literature review for data-driven agricultural food supply chain studies, and summarized the influence of technologies such as internet-of-things, blockchain, and big data on agricultural food sustainability. Based on the review, they proposed a holistic framework for practitioners to invest for technologies to develop agri-food sustainability. Friedman and Ormiston [15] also focused on the blockchain’s influence on food sustainability. Adopting a global food supply chain perspective, the authors collected expert opinions and identified the opportunities and resistance of blockchain technology in influencing food sustainability level. Kumar et al. [16] considered how technologies can help transform green food supply chains and eliminate hunger due to food unsustainability. The technologies, including internet-of-thing and blockchain, were considered, with enablers for supply chain transformation and hunger reductions identified. Tseng et al. [17] studied how digitalization can facilitate the sustainable transition of the agri-food industry. Using the coffee industry as the research object, they applied fuzzy decision models and found the important aspects that digitalization can contribute to support sustainable food transition.
Finally, the previous literature showed that the development and adoption of sustainable packages are important for achieving food sustainability. For example, Ganeson et al. [18] showed that smart packaging materials and technologies can effectively support food waste management, enhancing the sustainability of the food industry. Otto et al. [19] studied consumers’ perceptions on the sustainability of food packages. They found that there exists a difference between consumer judgments and the scientific facts of food package sustainability, leading to the necessity of educating consumers to develop their true sustainable purchase behaviors. Therefore, food packaging can not only protect food quality and decrease food wastes [20], but also improve sustainability in food business [21].

2.2. B2B Food Transaction Studies

This study is also relevant to B2B food transaction studies. According to the previous literature (e.g., [22]), B2B food transactions mean that the customers that the food product suppliers face are not individuals but companies and business organizations. Three key directions can be identified in the previous literature. First, previous studies focused on the buyer–supplier relationship in B2B food markets. Lee et al. [23] examined how the solid relationship between food agencies and manufacturers can be developed under a non-exclusive transaction in B2B markets. They found that multiple types of relational benefits can contribute to the calculative and affective commitments which together influence the long-term buyer–supplier relationship. Busch et al. [24] examined how collaboration between buyers and suppliers of organic foods can be developed, and they found that different types of fairness are the pre-requisite of the trust between buyers and suppliers which supports the development of buyer–supplier collaboration.
Second, existing studies also discussed the development of sustainable B2B food transactions. For example, Luu [25] explored how food waste behaviors can be reduced in B2B contexts. The author found that the quality of green communication can be an important factor, but its influence on B2B food waste can present multiple paths. Mangla et al. [26] investigated the information-hiding phenomenon in B2B circular food supply chains. They identified different dimensions of the hidden knowledge, as well as the types of companies having the most knowledge-hiding behaviors. Ekren et al. [27] explored how B2B inventory policies can enhance the food supply network sustainability. Using inventory optimization techniques, they found that the lateral inventory policy can be more advantageous than the non-lateral policy.
Finally, due to the rapid development of information technologies and innovations in E-commerce, B2B food studies increasingly focus on E-business contexts. Garner and Mady [28] studied how B2B food companies can use social media to promote products with sustainability information. By analyzing twitter data, they found that B2B companies prioritized the employment sustainability information, which was different from B2C companies preferring to post benefit sustainability information. Badren et al. [29] conducted social media analysis and interviews to study how B2B companies in food sectors established identity, and different processes of identity development were classified in the study. Drummond et al. [30] also examined the food B2B companies’ social media accounts. Through companies’ communication, they found that B2B food companies can develop or maintain the B2B relationship through resource mobilization enabled by social media usage.
However, there are relatively fewer studies on supplier selections in B2B food contexts based on online reviews. As an effective mechanism reflecting the market perceptions to the suppliers’ offering [31], online reviews can greatly help supplier selection processes. Therefore, as suppliers are vitally important for cost reduction and sustainability enhancement in the B2B food industry, it is necessary to establish an appropriate and easy-to-use framework for SFPSS based on online reviews.

2.3. MCDM in Supplier Selection

Supplier selection is an important topic in production and logistics management research. In recent decades, multiple MCDM methods have been developed and applied to the supplier selection. Excluding the purely qualitative methods such as Analytic Hierarchy Process (AHP), Best-Worst Method (BWM), and Full Consistency Method (FUCOM), the following Table 1 indicates the widely adopted MCDM methods in supplier selections with illustrative studies cited. There are two important perspectives that can be summarized from Table 1. First, the supplier selection is a common problem that needs to be addressed in the practice. Also, multiple methods have been adopted to support the selection decision to fit different scenarios and obtain appropriate results.
SAW is one of the earliest methods proposed for MCDM [6] and has been applied to supplier selection [32,33]. Using the weighted arithmetic average of the normalized criterion values, decision-makers can easily measure performance and compare the relative importance of different alternatives. After that, TOPSIS was proposed by [7], with the idea of compromised solutions introduced to the MCDM. Multiple studies for supplier selection have taken advantages of TOPSIS to identify the most appropriate candidates (e.g., [37,38,39]). In recent years, novel MCDM methods, including WASPAS [8], CoCoSo [9], and ARAS [10], have been developed. The alternative importance is measured by multiple types of expressions, such as the ratio, the sum of arithmetic and geometric average values, or the combination of multiple compromised solutions. These novel methods highly advanced the effectiveness of MCDM by capturing the information embedded in the decision-making matrix, providing new tools for supplier selection.
However, the MCDM methods utilized for supplier selection still have the following potential shortage, offering the chance for further improvement:
First, traditional MCDM methods (e.g., SAW, TOPSIS, or ARAS) usually utilize single indicators for alternative importance measurement. Although such an approach might promote the ease of use, by doing so the useful information for alternative evaluation is difficult to fully capture.
Second, although the above potential shortage has been noticed by scholars and is partially mitigated in WASPAS and CoCoSo which adopt two or three indicators for comprehensive alternative evaluation, the processes of multi-indicator aggregation in the developed MCDM methods can still have some shortages. Specifically, either WASPAS or CoCoSo utilize the numerical values rather than the ordinal values of different indicators in the aggregation. This can possibly make the methods more easily influenced by the extreme values, potentially undermining the robustness of the results.
Finally, the existing literature is lacking in the development of ratio indicators. Compared with the additive type indicators (e.g., SAW, WASPAS), the ratio indicator can also provide rich information. ARAS and TOPSIS use ratio indicators for alternative importance evaluation, but the indicator form is still simple and can only capture limited information. To enhance the information richness, different forms of ratio indicators should be supplemented to MCDM studies.
To sum up, to fill the above potential shortages and to provide a more informative and robust method for MCDM, this study aims to propose a novel PASCAAR method in the following sections and test its performance with a real case for SFPSS.

3. Materials and Methods

In this section, the PASCAAR method is proposed to facilitate the selection of sustainable food package suppliers in B2B E-commerce websites.
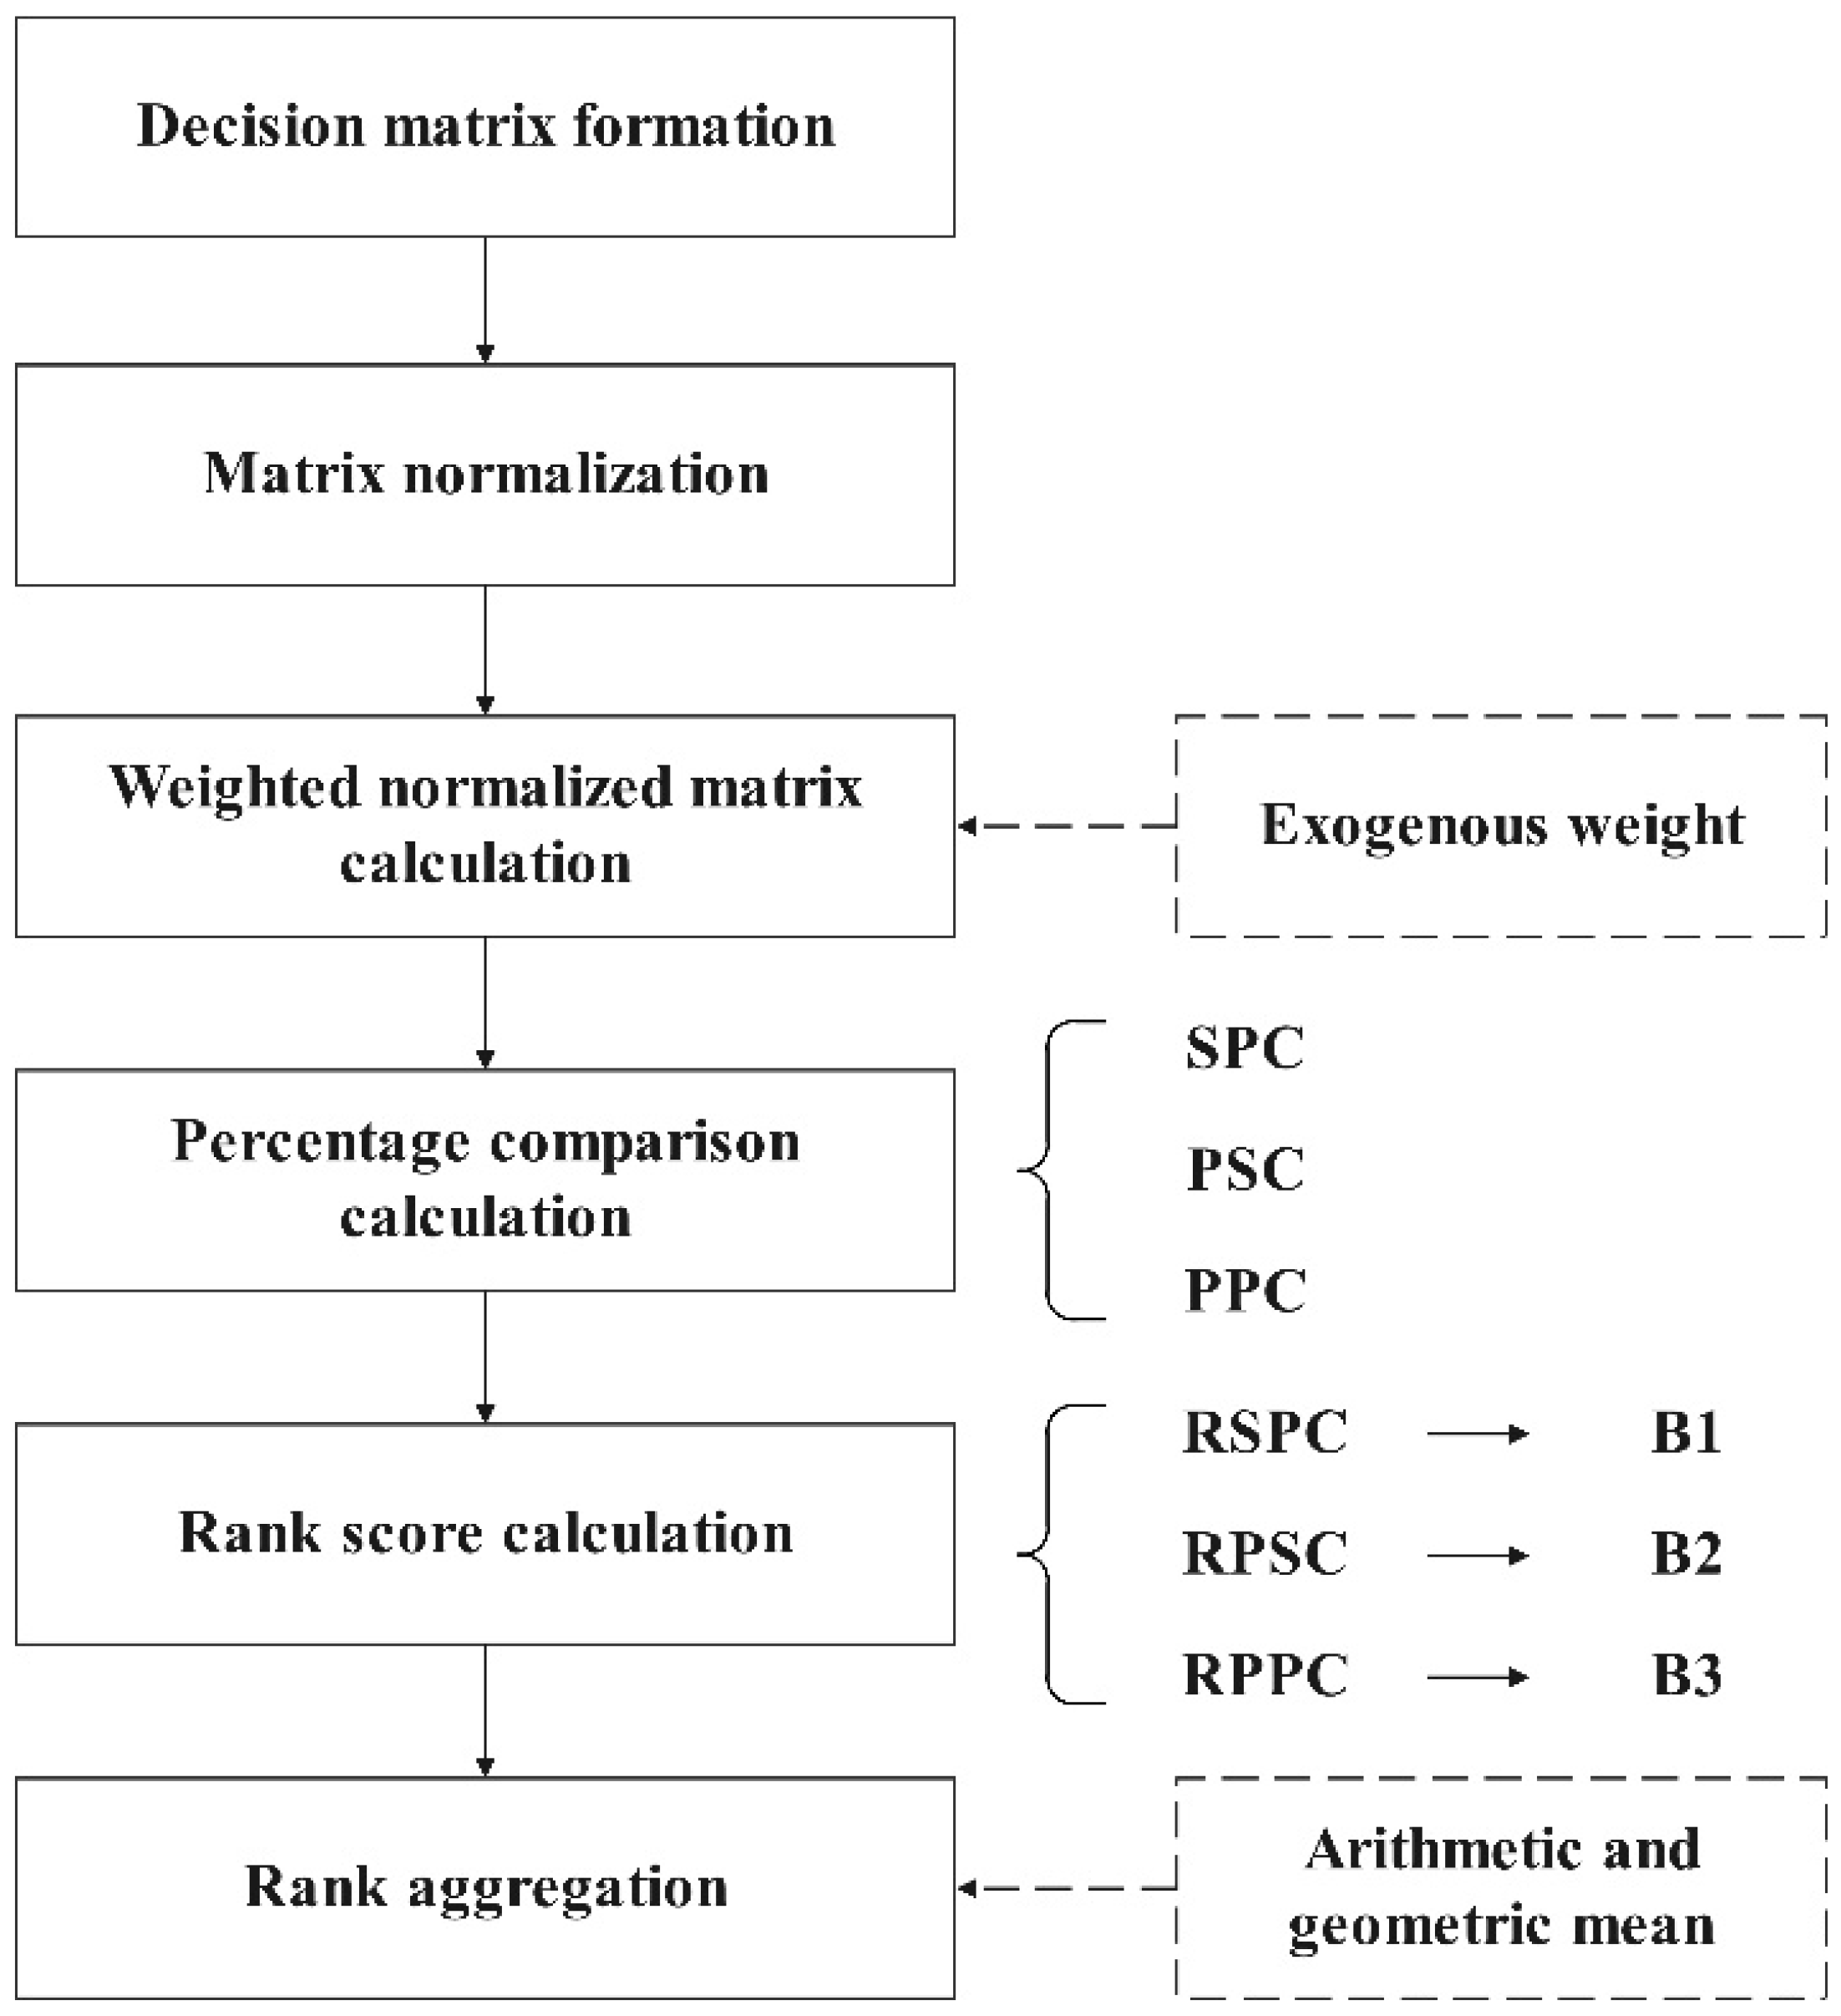
The generic processes of PASCAAR are presented in Figure 1.
Suppose the initial decision matrix A m × n for a MCDM problem has m alternatives under n criteria:
A m × n = a 11 a 12 a 21 a 22 a 1 n a 2 n a m 1 a m 2 a m n
Each element of A m × n is notated as a i j where 1 i m , 1 j n . The i index means i t h alternative, while j represents j t h criterion.
To obtain a fair comparison among criteria, based on A m × n , the normalized matrix R m × n is considered. Suppose the r i j is the element of R m × n where 1 i m , 1 j n , and its relationship with a i j is based on the widely adopted approach (e.g., [8,43,44]) as follows:
r i j = a i j max j   a i j ;     i f   a i j   i s   a   b e n e f i c i a l   c r i t e r i o n           min j   a i j a i j ;                             i f   a i j   i s   a   c o s t   c r i t e r i o n            
w j is the j t h criterion’s weight which can be a prior knowledge, or obtained based on subjective (e.g., AHP) or objective (e.g., entropy method) approaches. The weighted normalized matrix, W m × n , can be derived. Notate h i j as the element of W m × n where 1 i m , 1 j n , it can be calculated as:
h i j = w j r i j
Based on the weighted normalized value for each alternative, there are three comparisons calculated, and they are called Sum of Percentage Comparison ( S P C ), Percentage of Summative Comparison ( P S C ), and Percentage of Productive Comparison ( P P C ), respectively:
S P C i = j = 1 n h i j min j   h i j
P S C i = j = 1 n h i j j = 1 n min j   h i j  
P P C i = j = 1 n h i j j = 1 n min j   h i j = i = 1 n h i j min j   h i j
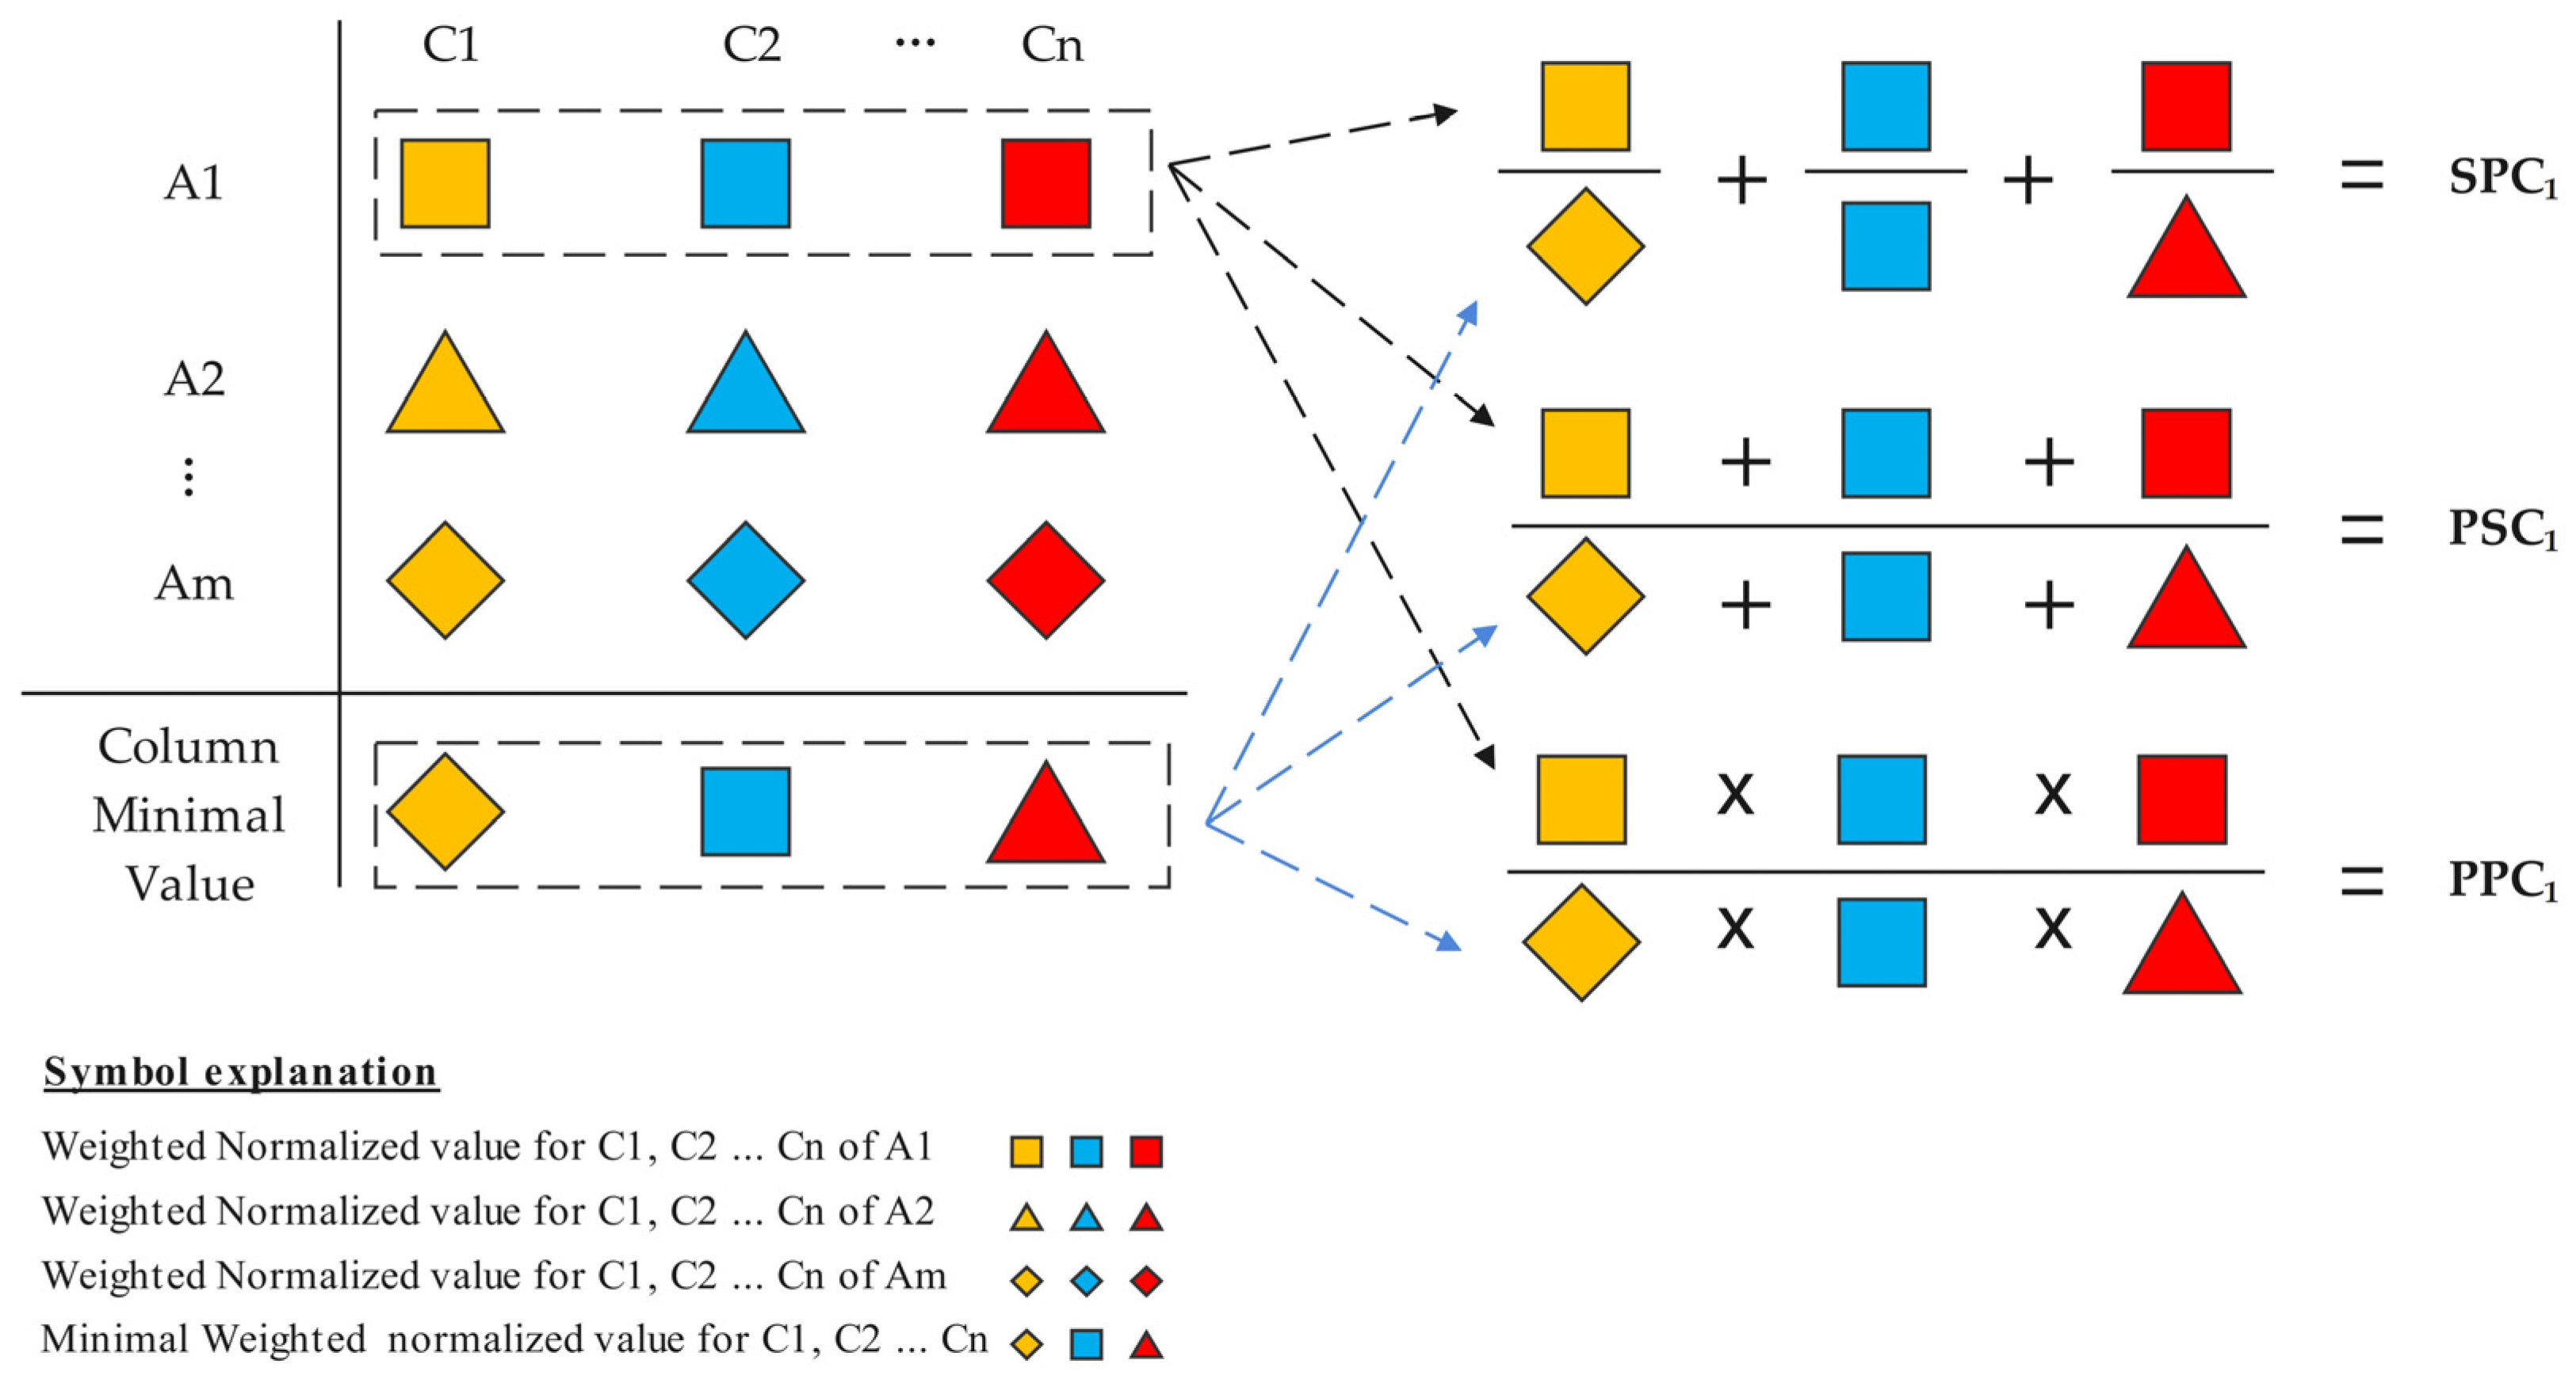
The three comparisons are the key steps of PASCAAR. To better illustrate their logic and eliminate the barriers of understanding for non-specialists, Figure 2 visualizes the mathematical processes through calculating the values of Alternative 1 (i.e., A1) from weighted normalized decision matrix. Specifically, A1, A2, …, Am are the alternatives, and C1, C2, …, Cn are the criteria. The reason why the indicators are percentages is to reveal ‘how many percentages of a certain alternative are compared to the minimal value option’. It can be noticed from Equation (6) that mathematically the Percentage of Productive Comparison (i.e., the ratio of product of alternative value over the product of the minimal value) is also equal to the Product of Percentage Comparison (i.e., the product of the ratio of alternative value over the minimal value), meaning that P P C can essentially be regarded as a multiplicative form of both S P C and P S C . By simultaneously considering three values, both the additive and multiplicative properties of alternatives under multiple criteria can be reflected. It can be seen that the higher the S P C i , P S C i , and P P C i are, the higher performance of an alternative should be.
Based on values of S P C i , P S C i , and P P C i , each alternative i can have three sets of ranks, namely R S P C i , R P S C i , and R P P C i . Then, inspired by the logic of ‘Borda count’ rule, scores are assigned to R S P C i , R P S C i , R P P C i as B 1 i , B 2 i , and B 3 i , respectively:
B 1 i = m R S P C i + 1
B 2 i = m R P S C i + 1
B 3 i = m R P P C i + 1
What should be particularly noticed is that our approach of assigning scores to R S P C i , R P S C i , and R P P C i is slightly different from the traditional Borda count [45]. Specifically, the traditional rule starts assigning the score for an alternative with first rank as m 1 and the last rank as 0, while this study here assigns the first rank as m and the last rank as 1. The justification of this modification is to avoid the existence of 0, so that more information in the rank aggregation can be kept in Equation (10) in which the multiplications of different rank scores are needed.
Finally, the PASCAAR value for each alternative i , H i , is calculated as follows:
H i = u 1 B 1 i + u 2 B 2 i + u 3 B 3 i + B 1 i u 1 B 2 i u 2 B 3 i u 3
Such a way of aggregation extends the idea in WASPAS and CoCoSo [10,11,46], where u 1 , u 2 , u 3 are the weights for B 1 , B 2 , and B 3 , indicating the relative importance of ranks derived from three comparisons. Here, this study sets u 1 = u 2 = u 3 = 1 / 3 , indicating equal importance for different comparisons. Based on the aggregated ranks, the higher H i means the higher importance of an alternative. It can be observed that, by aggregating ranks from three comparisons rather than their evaluative values, the methods are expected to be more robust, as the extreme value influence can be effectively limited.

4. Results: An Illustrative Case

In this section, a case study for SFPSS in a Chinese B2B E-commerce site is presented to illustrate the effectiveness of the PASCAAR. The products considered are paper-made biodegradable food containers. To obtain a fair comparison, this study narrowed the product attributes and specifically focused on the 500 ML containers whose production origin is China.

4.1. PASCAAR Implementation in SFPSS

To effectively control the operational cost and obtain a good quality of the product and its related service, food company operators should select an appropriate package supplier from multiple candidates. Based on a website search, this study initially selected six suppliers (i.e., A1 to A6) of such types of containers in this case. To thoroughly evaluate the suppliers, multiple criteria are considered and presented in Table 2, ranging from C1 to C6. First, C1 is price and C2 is the customer rating for product return and exchange. C3 is the customer rating for product quality while C4 is the customer rating for delivery speed. In addition, C5 is the customer rating for product issue solving, and C6 is the customer rating for pre-purchase inquiry quality. Finally, C7 is the repurchase rate. Specifically, the cost information was collected from the supplier price lists, while the information from C2 to C6 was collected from the online review rating provided by the B2B E-commerce platform. The platform adopts the feedback mechanism, and customers can rate on these dimensions based on their purchasing experiences with suppliers. The higher the rates that customers give to a supplier, the better a supplier is. Finally, the repurchase rate was collected from the statistics that the platform provides, and it means the proportions of the customers who purchase at least twice in a certain supplier. It can be justified that this criterion also belongs to the benefit type criterion, as the higher the repurchase rate, the more customers would feel satisfied after consumption, suggesting better supplier performance. The case study data are publicly accessible and collected from a Chinese B2B supplier E-commerce website.
Based on the information collected from the E-commerce website, Table 3 presents the numerical values for C1 to C7 of each supplier.
As an illustrative case study, the weights for criterion are derived based on entropy method (e.g., [47]) in Table 4, but it is acknowledged that subjective weights can also be used depending on the preference of decision makers. Based on Equations (2) and (3), the weighted normalized matrix is derived in Table 5.
Using data from Table 5, the S P C i , P S C i , and P P C i , can be calculated and transformed into rank scores based on Equations (4)–(9). The results are presented in Table 6.
Finally, the H i is calculated, with final alternative ranks presented in Table 7. It can be seen that supplier 3 is the best, followed by supplier 1 and 4. Therefore, the customer companies can probably benefit most from supplier 3’s product.

4.2. Sensitivity Analysis for Rank Aggregation

To test the robustness of PASCAAR, sensitivity analysis needs to be conducted. Following the previous literature (e.g., [43]), the influences of different values of key parameters, namely u 1 , u 2 , and u 3 , on results are examined.
Table 8 provides the different combinations of u 1 , u 2 , and u 3 . The original values of three parameters are u 1 = u 2 = u 3 = 1 / 3 , and nine more different combinations are tests. It can be found that the majority of the combinations (i.e., six) leads to identical ranks with the original result, with three (i.e., the 2nd, 5th, and 7th combination) having slight differences. Overall, it can be seen from the results that supplier 3 is certainly the best, while supplier 1 and 4 should be ranked as the second and the third with sufficient confidence. Such a result is consistent with the original finding.
To further examine the robustness of the results, the Spearman’s Rank Correlation Coefficient [48,49] between the original rank and the rank of each new combination is calculated:
ρ = 1 6 i = 1 n   ( x i y i ) 2 n ( n 2 1 )
The x i and y i are the ranks for the same alternative generated from two comparative combinations. The results are in Table 8, and it can be seen that all ρ values are above 90%, indicating a very high correlation between original ranks and ranks from sensitivity analysis. This means PASCAAR is sufficiently robust to its parameters.
In practice, this study would firstly recommend a setting of u 1 = u 2 = u 3 if the practitioners equally believe the different performance percentage values, but a larger number can be assigned to u 1 than the other two parameters if the adopter prefers traditional additive ratio analysis. However, what should be particularly acknowledged is that other advanced techniques can probably be applied to analytically derive the value of them, such as entropy method [47] or maximum variance optimization [50].

4.3. Sensitivity for Criterion Weights

Apart from the sensitivity analysis of the parameters in rank aggregation, the result sensitivity to criterion weights is also considered. Following [9], a weight replacement strategy is adopted. As there are seven criterion weights (i.e., Table 4), the alternative ranks by considering the permutation of all seven weights in different criteria are calculated. This means 7 × 6 × 5 × 4 × 3 × 2 × 1 = 5040 calculations of PASCAAR were conducted to cover every possible exchange of weights among criteria.
In Table 9, the ranks for each alternative in 5040 calculations are summarized. It can be seen that A3 should be ranked first place in great confidence as it appears 4667 in the first. Also, A6, A2 and A5 can be ranked the 4th to the 6th as they appear most frequently in these places. Although the 2nd and the 3rd places seem to present slight inconsistencies with the original results, the sensitivity tests confirm above original decision results are quite robust.
To better reveal the robustness of the PASCAAR results under the exchange of criterion weights, this study calculated the rank correlation between the original results and each of the ranks generated from the exchanged weights. Figure 3 indicates the histogram of the rank correlation. It can be found that although there are some results having correlations smaller than 0.8, the majority of the tests obtain correlations over 0.8. This indicates adequate robustness under the tests of weight replacement.

4.4. Result Validation with Other Widely Adopted Methods

As a newly developed method, PASCAAR’s results are validated with other widely adopted MCDM methods in this section. A thorough comparison is conducted between PASCAAR and the other five methods, including SAW, TOPSIS, WASPAS, CoCoSo, and ARAS. The results are presented in Table 10. It can be seen that the correlations between ranks generated from PASCAAR and ranks from other methods are all very high (i.e., greater than 85%). This indicates that the results of PASCAAR achieve high agreement with the previously widely adopted methods. Interestingly, the results of all other MCDM methods, except CoCoSo, are identical to RSPC of PASCAAR (see Table 6). Therefore, it can be reasonably surmised that compared with other MCDM methods, more information is captured in PASCAAR. In this specific case, the extra information is conveyed from SCP and PPC operations.

4.5. PASCAAR Solver

As PASCAAR is a newly proposed method with aggregation from different ranks, it is not time-efficient to implement it manually using a spreadsheet. To overcome this and to provide an easily implemented package for readers who are interested in this method, we provided a PASCAAR Solver in R. Readers who want to implement PASCAAR for their own MCDM problem can directly use the code in Supplementary Materials and follow the instructions to enter the decision-related information (Please see Supplementary Materials in the end of the paper for details). The results will be directly obtained after running the Solver, with the outcome in the same format as Table 7.

5. Discussion

The above illustrative case study confirms the effectiveness of PASCAAR in SFPSS in B2B E-commerce contexts. Also, it reveals PASCAAR is a promising method compared with the previous MCDM techniques. Specifically, this study summarizes the following strengths from which adopters of PASCAAR could benefit.
First, PASCAAR can better utilize ratio indicators, thus capturing more information from the decision matrix. The effectiveness of ratio indicators in MCDM has been widely confirmed in previous literature (e.g., [10]). However, the ratio format in the previous literature was relatively simple and thus less informative, with little focus on multiplicative ratio forms. In PASCAAR, from the Equations (4)–(6), three different ratio indicators with additive and multiplicative forms are adopted. The advantage of adopting them can be seen in Table 7, i.e., that the alternative ranks under each of the indicator are slightly different. In other words, by using three indicators together, the correlated but not identical information can be captured, increasing the information richness of the decisions compared with the previous single-indicator MCDM methods. In the B2B food packaging industry, the market can change rapidly. To maintain sustainable competitiveness, suppliers should continuously improve its packaging products. There are many improvement opportunities in online reviews. Once they are carefully analyzed, the suppliers can properly position themselves in the market and design suitable business plans. As PASCAAR can thoroughly capture online review information by its three percentage type values, it can enhance supplier competitiveness.
Also, PASCAAR is relatively insensitive to and thus less influenced by extreme values. This is because PASCAAR adopted rank values (i.e., Equations (7)–(9)) rather than the numerical values in the final aggregation. This can effectively regulate the effects of extreme values and outliers in the decision matrix, ensuring the robustness of the overall results. In addition, Equations (7)–(10) reveal the computation of PASCAAR is not very intensive, and each ratio indicator is of reasonable interpretability. It enables flexibility for decision makers to adjust the relative weights among three indicators, as the aggregation process follows an arithmetic/geometric weighted average form. The advantage of enabling such adjustment has been revealed in previous research (e.g., [9,43,44]). Through the adjustment, adopters, especially practitioners, can incorporate their decision preferences easily in evaluation processes.
Finally, PASCAAR also reveals the potential of solving qualitative MCDM problems. Although our illustrative case study is presented in a quantitative form, the criteria C2 to C6 are essentially the customer rates of certain services. Such rates are similar to the scores in questionnaires or surveys, which can be effectively expressed by linguistic variables (e.g., [51]). Therefore, PASCAAR is potentially compatible with qualitative data, offering an extension to fuzzy numbers, interval-valued numbers, or grey numbers. This means PASCAAR has the potential to handle both objective and subjective criteria, and thus could generalize to other types of supplier selection problems under wider contexts. For example, it can be useful for supplier selections for garment retailers (e.g., [52]) or website service operators (e.g., [53]), as they may consider objective and subjective criteria simultaneously.

6. Conclusions

This study proposed a new MCDM method called PASCAAR for package supplier selection. It utilizes different ratio indicators with rank aggregations to compare the relative importance of different alternatives. It then provided an illustrative case study of SFPSS in a B2B E-commerce website to test the effectiveness of PASCAAR. The results showed that PASCAAR can effectively and robustly evaluate alternatives, and its results are compatible with the widely adopted MCDM methods, including SAW, TOPSIS, WASPAS, CoCoSo, and ARAS.
It is believed that this study has both academic and practical implications. From an academic perspective, this study proposed a new method which reveals the potential to solve MCDM with high effectiveness, robustness, and information richness. This method contributes to the previous literature with new ideas of utilizing and aggregating ratio indicators. Also, as this method is proved to be useful for SFPSS, it can advance the methodological basis for sustainable supply chain management literature, paving the way for future research in this field with novel analytical tools.
From a practical perspective, the effectiveness of PASCAAR in sustainable supplier selection indicates that it can directly facilitate the sustainable transformation of food companies in practice. Also, the PASCAAR can inform managers and engineers to develop or update decision support systems to tackle complex MCDM problems. With the aid of our PASCAAR Solver, practitioners can implement this method economically. In the E-commerce context, as many E-commerce sellers are small and medium enterprises (SMEs) whose budgets on decision support systems could be low, PASCAAR and its Solver can help them make better decisions related to sustainable management with lower costs. For example, they can integrate the Solver to their procurement decision support system to foster more structured operational decisions and design better sourcing policies and supplier evaluation protocols. Also, the PASCAAR can also support E-commerce and social media analysts to extract rich and multi-dimensional information from online reviews. By doing so, they can easily generate a robust and comprehensive evaluation of an online company (e.g., an E-commerce supplier) to support their business decisions.
As a newly proposed method, it should be acknowledged that this paper has limitations, offering places for future studies to advance it. On the one hand, as mentioned earlier, this study only utilized PASCAAR in a fully quantitative criterion context, without considering the scenarios with qualitative or mixed criteria involved. To solve this problem, this study proposes that PASCAAR can extend to the contexts of fuzzy numbers (e.g., [54]), interval-valued numbers (e.g., [55]), and stochastic numbers (e.g., [56]) in future studies. For fuzzy number extensions, as the rules of fuzzy adding and multiplication are well developed for different types of fuzzy numbers (e.g., triangular fuzzy numbers, hesitant fuzzy numbers, intuitionistic fuzzy numbers, etc.), they can be adapted to the PASCAAR method and produce reliable results. Similarly, as the adding and multiplication rules are well developed for interval-valued numbers, it is also promising to extend PASCAAR to interval-valued contexts to capture the uncertainty of the problems. Finally, stochastic numbers may be able to be integrated into PASCAAR. For example, PASCAAR can be extended with Stochastic Multi-criteria Acceptance Analysis (SMAA) [56]. By this means, the stochastic numbers and the randomness of the criteria can be considered using PASCAAR. On the other hand, this paper only tested the effectiveness of PASCAAR in sustainable package supplier selection, without validating it in other decision-making models. Therefore, future studies can apply PASCAAR to other common MCDM questions, such as location selection, technology selection, or service provider selection [57].

Supplementary Materials

The following supporting information can be downloaded at: https://www.mdpi.com/article/10.3390/jtaer20030163/s1, PASCAAR Solver.

Author Contributions

Conceptualization, S.H.; Formal analysis, S.H.; Funding acquisition, S.H. and H.C.; Investigation, S.H., K.L., Z.M. and K.D.; Methodology, S.H., K.L., Z.M. and K.D.; Project administration, M.T.; Software, S.H.; Validation, S.H.; Visualization, S.H.; Writing—original draft, S.H.; Writing—review and editing, S.H., M.T. and H.C. All authors have read and agreed to the published version of the manuscript.

Funding

This research is funded by Yibin Smart Logistics Research Institute (project number: YW2024YB03), Chengdu Key Research Base for Water Ecological Civilization Construction (project number: SST2023-2024-16), and Philosophy and Social Science Research Fund of Chengdu University of Technology (project number: YJ2024-QN003).

Institutional Review Board Statement

Not applicable.

Informed Consent Statement

Not applicable.

Data Availability Statement

Data supporting this study are included in the article.

Conflicts of Interest

The authors declare no conflicts of interest.

References

  1. Waqas, M.; Qingfeng, M.; Ahmad, N.; Iqbal, M. Green brands, customer satisfaction and sustainable performance in the Chinese manufacturing industry. Manag. Decis. 2023, 61, 3545–3572. [Google Scholar] [CrossRef]
  2. Li, X.; Jiang, Y.; Qing, P. Estimates of Household Food Waste by Categories and Their Determinants: Evidence from China. Foods 2023, 12, 776. [Google Scholar] [CrossRef] [PubMed]
  3. Lucía, S.; Cristina, B. Functional Ingredients from Food Waste and By-Products: Processing Technologies, Functional Characteristics and Value-Added Applications. Foods 2025, 14, 847. [Google Scholar]
  4. Du, S.; Liu, M.; Nie, T.; Zhu, Y. Package-type strategies and packaging’s carbon reduction decisions in the take-out industry. Int. J. Prod. Res. 2024, 62, 6542–6572. [Google Scholar] [CrossRef]
  5. Zhang, J.; Li, L.; Zhang, J.; Chen, L.; Chen, G. Private-label sustainable supplier selection using a fuzzy entropy-VIKOR-based approach. Complex Intell. Syst. 2023, 9, 2361–2378. [Google Scholar] [CrossRef]
  6. MacCrimmon, K.R. Decisionmaking Among Multiple-Attribute Alternatives: A Survey and Consolidated Approach (No. RM-4823-ARPA); Rand Corporation: Santa Monica, CA, USA, 1968. [Google Scholar]
  7. Hwang, C.-L.; Yoon, K. Multiple Attribute Decision Making—Methods and Applications: A State-of-the-Art Survey; Springer: Berlin/Heidelberg, Germany, 1981. [Google Scholar]
  8. Zavadskas, E.K.; Turskis, Z.; Antucheviciene, J.; Zakarevicius, A. Optimization of weighted aggregated sum product assessment. Elektron. Elektrotech. 2012, 122, 3–6. [Google Scholar] [CrossRef]
  9. Yazdani, M.; Zarate, P.; Kazimieras Zavadskas, E.; Turskis, Z. A combined compromise solution (CoCoSo) method for multi-criteria decision-making problems. Manag. Decis. 2019, 57, 2501–2519. [Google Scholar] [CrossRef]
  10. Zavadskas, E.K.; Turskis, Z. A new additive ratio assessment (ARAS) method in multicriteria decision-making. Technol. Econ. Dev. Econ. 2010, 16, 159–172. [Google Scholar] [CrossRef]
  11. Azzurra, A.; Massimiliano, A.; Angela, M. Measuring sustainable food consumption: A case study on organic food. Sustain. Prod. Consum. 2019, 17, 95–107. [Google Scholar] [CrossRef]
  12. Desiderio, E.; García-Herrero, L.; Hall, D.; Segrè, A.; Vittuari, M. Social sustainability tools and indicators for the food supply chain: A systematic literature review. Sustain. Prod. Consum. 2022, 30, 527–540. [Google Scholar] [CrossRef]
  13. Zarei, S.; Bozorg-Haddad, O.; Singh, V.P.; Loáiciga, H.A. Developing water, energy, and food sustainability performance indicators for agricultural systems. Sci. Rep. 2021, 11, 22831. [Google Scholar] [CrossRef] [PubMed]
  14. Kamble, S.S.; Gunasekaran, A.; Gawankar, S.A. Achieving sustainable performance in a data-driven agriculture supply chain: A review for research and applications. Int. J. Prod. Econ. 2020, 219, 179–194. [Google Scholar] [CrossRef]
  15. Friedman, N.; Ormiston, J. Blockchain as a sustainability-oriented innovation?: Opportunities for and resistance to Blockchain technology as a driver of sustainability in global food supply chains. Technol. Forecast. Soc. Change 2022, 175, 121403. [Google Scholar] [CrossRef]
  16. Kumar, M.; Choubey, V.K.; Raut, R.D.; Jagtap, S. Enablers to achieve zero hunger through IoT and blockchain technology and transform the green food supply chain systems. J. Clean. Prod. 2023, 405, 136894. [Google Scholar] [CrossRef]
  17. Tseng, M.L.; Bui, T.D.; Lewi, S.; Rizaldy, H.; Lim, M.K.; Wu, K.J. Causality sustainable supply chain management practices in the Indonesian coffee industry using qualitative information: Digitalization integration leads performance improvement. Int. J. Logist. Res. Appl. 2025, 28, 210–240. [Google Scholar] [CrossRef]
  18. Ganeson, K.; Mouriya, G.K.; Bhubalan, K.; Razifah, M.R.; Jasmine, R.; Sowmiya, S.; Amirul, A.-A.A.; Vigneswari, S.; Ramakrishna, S. Smart packaging− A pragmatic solution to approach sustainable food waste management. Food Packag. Shelf Life 2023, 36, 101044. [Google Scholar] [CrossRef]
  19. Otto, S.; Strenger, M.; Maier-Nöth, A.; Schmid, M. Food packaging and sustainability–Consumer perception vs. correlated scientific facts: A review. J. Clean. Prod. 2021, 298, 126733. [Google Scholar] [CrossRef]
  20. Brennan, L.; Langley, S.; Verghese, K.; Lockrey, S.; Ryder, M.; Francis, C.; Phan-Le, N.T.; Hill, A. The role of packaging in fighting food waste: A systematised review of consumer perceptions of packaging. J. Clean. Prod. 2021, 281, 125276. [Google Scholar] [CrossRef]
  21. Battini, D.; Calzavara, M.; Persona, A.; Sgarbossa, F. Sustainable packaging development for fresh food supply chains. Packag. Technol. Sci. 2016, 29, 25–43. [Google Scholar] [CrossRef]
  22. Rudawska, E. Sustainable marketing strategy in food and drink industry: A comparative analysis of B2B and B2C SMEs operating in Europe. J. Bus. Ind. Mark. 2019, 34, 875–890. [Google Scholar] [CrossRef]
  23. Lee, C.J.; Lee, S.M.; Iyer, R.; Lee, Y.K. Do relational benefits influence commitments and loyalty in a non-contract mechanism? Asia Pac. J. Mark. Logist. 2023, 35, 2012–2028. [Google Scholar] [CrossRef]
  24. Busch, M.; Mühlrath, D.; Herzig, C. Fairness and trust in organic food supply chains. Br. Food J. 2024, 126, 864–878. [Google Scholar] [CrossRef]
  25. Luu, T.T. Can food waste behavior be managed within the B2B workplace and beyond? The roles of quality of green communication and dual mediation paths. Ind. Mark. Manag. 2021, 93, 628–640. [Google Scholar] [CrossRef]
  26. Mangla, S.K.; Börühan, G.; Ersoy, P.; Kazancoglu, Y.; Song, M. Impact of information hiding on circular food supply chains in business-to-business context. J. Bus. Res. 2021, 135, 1–18. [Google Scholar] [CrossRef]
  27. Ekren, B.Y.; Mangla, S.K.; Turhanlar, E.E.; Kazancoglu, Y.; Li, G. Lateral inventory share-based models for IoT-enabled E-commerce sustainable food supply networks. Comput. Oper. Res. 2021, 130, 105237. [Google Scholar] [CrossRef]
  28. Garner, B.; Mady, A. Social media branding in the food industry: Comparing B2B and B2C companies’ use of sustainability messaging on Twitter. J. Bus. Ind. Mark. 2023, 38, 2485–2504. [Google Scholar] [CrossRef]
  29. Badran, A.; Tanner, S.; Alton, D. Organisational identity development by entrepreneurial firms using social media: A process-based model. J. Bus. Ind. Mark. 2023, 38, 1689–1709. [Google Scholar] [CrossRef]
  30. Drummond, C.; McGrath, H.; O’Toole, T. The impact of social media on resource mobilisation in entrepreneurial firms. Ind. Mark. Manag. 2018, 70, 68–89. [Google Scholar] [CrossRef]
  31. Xiao, L.; Qian, C.; Wang, C.; Wang, J. Can the conditional rebate strategy work? Signaling quality via induced online reviews. J. Theor. Appl. Electron. Commer. Res. 2023, 19, 54–72. [Google Scholar] [CrossRef]
  32. Parkouhi, S.V.; Ghadikolaei, A.S.; Lajimi, H.F. Resilient supplier selection and segmentation in grey environment. J. Clean. Prod. 2019, 207, 1123–1137. [Google Scholar] [CrossRef]
  33. Arman, A.; Arman, H.; Hadi-Vencheh, A. The Homogeneous MADM Methods: Is Trade-Off between Attributes Important? Comput. Intell. Neurosci. 2022, 2022, 8629986. [Google Scholar] [CrossRef] [PubMed]
  34. Chen, Z.; Ming, X.; Zhou, T.; Chang, Y. Sustainable supplier selection for smart supply chain considering internal and external uncertainty: An integrated rough-fuzzy approach. Appl. Soft Comput. 2020, 87, 106004. [Google Scholar] [CrossRef]
  35. Mina, H.; Kannan, D.; Gholami-Zanjani, S.M.; Biuki, M. Transition towards circular supplier selection in petrochemical industry: A hybrid approach to achieve sustainable development goals. J. Clean. Prod. 2021, 286, 125273. [Google Scholar] [CrossRef]
  36. Kasirian, M.N.; Yusuff, R.M. An integration of a hybrid modified TOPSIS with a PGP model for the supplier selection with interdependent criteria. Int. J. Prod. Res. 2013, 51, 1037–1054. [Google Scholar] [CrossRef]
  37. Masoomi, B.; Sahebi, I.G.; Fathi, M.; Yıldırım, F.; Ghorbani, S. Strategic supplier selection for renewable energy supply chain under green capabilities (fuzzy BWM-WASPAS-COPRAS approach). Energy Strategy Rev. 2022, 40, 100815. [Google Scholar] [CrossRef]
  38. Ghorabaee, M.K.; Zavadskas, E.K.; Amiri, M.; Esmaeili, A. Multi-criteria evaluation of green suppliers using an extended WASPAS method with interval type-2 fuzzy sets. J. Clean. Prod. 2016, 137, 213–229. [Google Scholar] [CrossRef]
  39. Ecer, F.; Pamucar, D. Sustainable supplier selection: A novel integrated fuzzy best worst method (F-BWM) and fuzzy CoCoSo with Bonferroni (CoCoSo’B) multi-criteria model. J. Clean. Prod. 2020, 266, 121981. [Google Scholar] [CrossRef]
  40. Yazdani, M.; Torkayesh, A.E.; Stević, Ž.; Chatterjee, P.; Ahari, S.A.; Hernandez, V.D. An interval valued neutrosophic decision-making structure for sustainable supplier selection. Expert Syst. Appl. 2021, 183, 115354. [Google Scholar] [CrossRef]
  41. Fu, Y.K. An integrated approach to catering supplier selection using AHP-ARAS-MCGP methodology. J. Air Transp. Manag. 2019, 75, 164–169. [Google Scholar] [CrossRef]
  42. Fan, J.; Han, D.; Wu, M. Picture fuzzy Additive Ratio Assessment Method (ARAS) and VIseKriterijumska Optimizacija I Kompromisno Resenje (VIKOR) method for multi-attribute decision problem and their application. Complex Intell. Syst. 2023, 9, 5345–5357. [Google Scholar] [CrossRef]
  43. Chakraborty, S.; Zavadskas, E.K.; Antucheviciene, J. Applications of WASPAS method as a multi-criteria decision-making tool. Econ. Comput. Econ. Cybern. Stud. Res. 2015, 49, 5–22. [Google Scholar]
  44. Huang, S.; Cheng, H.; Tan, M.; Tang, Z.; Teng, C. Evaluating Regional Potentials of Agricultural E-Commerce Development Using a Novel MEREC Heronian-CoCoSo Approach. Agriculture 2024, 14, 1338. [Google Scholar] [CrossRef]
  45. Ecer, F. A consolidated MCDM framework for performance assessment of battery electric vehicles based on ranking strategies. Renew. Sustain. Energy Rev. 2021, 143, 110916. [Google Scholar] [CrossRef]
  46. Huang, S.; Cheng, H.; Luo, M. Comparative Study on Barriers of Supply Chain Management MOOCs in China: Online Review Analysis with a Novel TOPSIS-CoCoSo Approach. J. Theor. Appl. Electron. Commer. Res. 2024, 19, 1793–1811. [Google Scholar] [CrossRef]
  47. Huang, W.; Shuai, B.; Sun, Y.; Wang, Y.; Antwi, E. Using entropy-TOPSIS method to evaluate urban rail transit system operation performance: The China case. Transp. Res. Part A Policy Pract. 2018, 111, 292–303. [Google Scholar] [CrossRef]
  48. Bączkiewicz, A.; Kizielewicz, B.; Shekhovtsov, A.; Wątróbski, J.; Sałabun, W. Methodical aspects of MCDM based E-commerce recommender system. J. Theor. Appl. Electron. Commer. Res. 2021, 16, 2192–2229. [Google Scholar] [CrossRef]
  49. Shekhovtsov, A.; Sałabun, W. A comparative case study of the VIKOR and TOPSIS rankings similarity. Procedia Comput. Sci. 2020, 176, 3730–3740. [Google Scholar] [CrossRef]
  50. Lai, H.; Liao, H.; Wen, Z.; Zavadskas, E.K.; Al-Barakati, A. An improved CoCoSo method with a maximum variance optimization model for cloud service provider selection. Eng. Econ. 2020, 31, 411–424. [Google Scholar] [CrossRef]
  51. Acuña-Soto, C.M.; Liern, V.; Pérez-Gladish, B. A VIKOR-based approach for the ranking of mathematical instructional videos. Manag. Decis. 2019, 57, 501–522. [Google Scholar] [CrossRef]
  52. Karami, S.; Ghasemy Yaghin, R.; Mousazadegan, F. Supplier selection and evaluation in the garment supply chain: An integrated DEA–PCA–VIKOR approach. J. Text. Inst. 2021, 112, 578–595. [Google Scholar] [CrossRef]
  53. Wang, H.C.; Lee, C.S.; Ho, T.H. Combining subjective and objective QoS factors for personalized web service selection. Expert Syst. Appl. 2007, 32, 571–584. [Google Scholar] [CrossRef]
  54. Taherkhani, A.; Sharifi, A.; Koubaa, M. Optimization of Bioactive Compound Extraction from Iranian Brown Macroalgae Nizimuddinia zanardini with Ultrasound and Microwave Methods Using Fuzzy Logic. Foods 2024, 13, 3837. [Google Scholar] [CrossRef] [PubMed]
  55. Goswami, M.; Daultani, Y.; Chan, F.T.; Pratap, S. Assessing the impact of supplier benchmarking in manufacturing value chains: An Intelligent decision support system for original equipment manufacturers. Int. J. Prod. Res. 2022, 60, 7411–7435. [Google Scholar] [CrossRef]
  56. Lahdelma, R.; Salminen, P. SMAA-2: Stochastic multicriteria acceptability analysis for group decision making. Oper. Res. 2001, 49, 444–454. [Google Scholar] [CrossRef]
  57. Behzadian, M.; Otaghsara, S.K.; Yazdani, M.; Ignatius, J. A state-of the-art survey of TOPSIS applications. Expert Syst. Appl. 2012, 39, 13051–13069. [Google Scholar] [CrossRef]
Figure 1. The flowchart of the process of PASCAAR.
Jtaer 20 00163 g001
Figure 2. Mathematical logics of calculating SPC, PSC, and PPC.
Jtaer 20 00163 g002
Figure 3. Histogram for rank correlation.
Jtaer 20 00163 g003
Table 1. MCDM methods in supplier selection.
MCDM MethodsInitial DevelopmentStudies for Supplier Selection
SAW[6][32,33]
TOPSIS[7][34,35,36]
WASPAS[8][37,38]
CoCoSo[9][39,40]
ARAS[10][41,42]
Table 2. Supplier selection criteria in the B2B E-commerce platform.
CriteriaDescriptionCriterion Type
C1Product priceCost
C2Online review rating for product return and exchangeBeneficial
C3Online review rating for product qualityBeneficial
C4Online review rating for delivery speedBeneficial
C5Online review for product issue solvingBeneficial
C6Online review for pre-purchase inquiry qualityBeneficial
C7Product repurchase rateBeneficial
Table 3. Decision matrix for B2B E-commerce SFPSS.
AlternativeC1C2C3C4C5C6C7
CostBenefitBenefitBenefitBenefitBenefitBenefit
A10.383.503.004.004.004.000.40
A20.673.505.002.005.003.000.21
A30.433.504.004.005.003.500.50
A40.423.505.004.005.004.500.27
A50.704.005.005.005.002.000.07
A60.443.003.004.005.003.000.17
Table 4. Criteria weights for B2B E-commerce SFPSS.
CriteriaC1C2C3C4C5C6C7
Weights0.095870.012910.090880.116520.011820.11280.55911
Table 5. Weighted normalized matrix for B2B E-commerce SFPSS.
C1C2C3C4C5C6C7
A10.0960.0110.0550.0930.0090.1000.447
A20.0540.0110.0910.0470.0120.0750.235
A30.0850.0110.0730.0930.0120.0880.559
A40.0870.0110.0910.0930.0120.1130.302
A50.0520.0130.0910.1170.0120.0500.078
A60.0830.0100.0550.0930.0120.0750.190
Remark: results are round to three decimal places.
Table 6. Results for three percentage comparisons, their rank values, and their Borda values.
SPCRSPCB1PSCRPSCB2PPCRPPCB3
A114.723252.7002549.12334
A210.628521.7464311.42752
A316.271163.0611679.13416
A413.857342.3573470.31325
A59.750611.372616.94461
A610.769431.7205214.48943
Remark: results are round to three decimal places.
Table 7. Alternative ranks based on PASCAAR.
B1B2B3HRank
A15549.3082
A22324.6235
A366612.0001
A44458.6423
A51112.0006
A63235.2874
Remark: results are round to the three decimal places.
Table 8. Sensitivity analysis results for aggregation parameters.
Parameter Value CombinationsRank ρ
A1A2A3A4A5A6
u 1 = 1 3 ; u 2 = 1 3 ; u 3 = 1 3 251364Benchmark
u 1 = 1 6 ; u 2 = 1 6 ; u 3 = 2 3 35126494.286%
u 1 = 1 6 ; u 2 = 2 3 ; u 3 = 1 6 24136594.286%
u 1 = 2 3 ; u 2 = 1 6 ; u 3 = 1 6 251364100%
u 1 = 1 6 ; u 2 = 1 3 ; u 3 = 1 2 25126497.143%
u 1 = 1 6 ; u 2 = 1 2 ; u 3 = 1 3 251364100%
u 1 = 1 3 ; u 2 = 1 6 ; u 3 = 1 2 25126497.143%
u 1 = 1 3 ; u 2 = 1 2 ; u 3 = 1 6 24136497.143%
u 1 = 1 2 ; u 2 = 1 6 ; u 3 = 1 3 251364100%
u 1 = 1 2 ; u 2 = 1 3 ; u 3 = 1 6 251364100%
Remark: results are round to the three decimal places.
Table 9. Sensitivity analysis for criterion weights.
Rank1st2nd3rd4th5th6th
A10150634874700
A20007343333973
A346673730000
A437331611506000
A50001548254061
A6004741058826
Table 10. Comparison between PASCAAR and other methods.
AlternativePASCAARSAWWASPASCoCoSoTOPSISARAS
A1222322
A2544444
A3111111
A4333233
A5666666
A6455555
ρ Benchmark94.286%94.286%88.571%94.286%94.286%
Remark: results are round to the three decimal points.
Disclaimer/Publisher’s Note: The statements, opinions and data contained in all publications are solely those of the individual author(s) and contributor(s) and not of MDPI and/or the editor(s). MDPI and/or the editor(s) disclaim responsibility for any injury to people or property resulting from any ideas, methods, instructions or products referred to in the content.

