Abstract
The adoption of cryptocurrency as a payment instrument by firms has sparked ongoing debates about how such strategic moves are perceived by key stakeholders. This study investigates how investors react when an e-commerce firm adds or withdraws from providing cryptocurrency as a payment option. To explore these aspects, we examine two cases: MercadoLibre’s decision to introduce Meli Dólar as a payment option, representing the inclusion of cryptocurrency, and eBay’s withdrawal from the Libra project, representing strategic exclusion. We assess the causal impact of these strategies by employing a Regression Discontinuity Design (RDD) and deriving the observation period by using an optimal bandwidth method. The results indicate that there was an immediate decline in share prices following the adoption of the Meli Dólar as a payment instrument and an immediate increase following the decision to withdraw from using Libra as a payment instrument. The findings suggest that including cryptocurrency as a payment method may run counter to investor expectations. This study contributes to the discourse on the viability of cryptocurrency adoption by e-commerce firms and emphasizes the importance of understanding how decisions around cryptocurrency convey market signals, which may have strategic implications for a firm’s overall strategy.
1. Introduction
The adoption of cryptocurrency as a payment method has garnered the attention of investors, policymakers, and researchers. This evolution is particularly relevant in the e-commerce sector where cryptocurrency adoption has emerged as a disruptive force driven by consumer demand and transactional benefits [1]. The adoption of cryptocurrency by the e-commerce sector is particularly critical, considering that the e-commerce sector has witnessed exponential growth in the last few years, driven largely by changing consumer behavior and increasing access to the Internet. The shift towards cryptocurrency is still in its nascent stage; therefore, it is imperative for e-commerce firms to evaluate the costs and benefits related to its adoption. In this sense, the question of concern is how investors of these e-commerce firms view the adoption of cryptocurrency.
Cryptocurrency-based payments confer certain advantages such as efficiency and convenience [2]. The logical concomitant is that firms may conceive the possibility of including cryptocurrency-based payments as a mechanism to target a wider audience, especially the segment that is more prone to preferring cryptocurrency as a means of payment. However, this strategic decision is much more complex than appears at first blush as the adoption of cryptocurrency has to be weighed against the risks related to cryptocurrency adoption.
The influence of cryptocurrency-based assets on the risk profile of firms is substantial [3] and therefore it is of interest to firms to assess how this tends to influence the decisions of shareholders. The risk aspect is particularly relevant in studies related to cryptocurrencies, as market trades of these assets tend to be influenced by regulatory aspects with investors tending to react negatively to market regulations [4]. The risk aspect is critical as the factors impacting the price of cryptocurrencies are complex and multifaceted, and in this regard, evidence points to the fact that even the behavior of crypto-tastemakers can influence the price of cryptocurrencies [5].
The impact of cryptocurrencies on the risk profile may appear superficial at first glance as firms consider it as a transaction medium rather than an investment asset. Nevertheless, this distinction between holding it as an asset and using it as a payment medium warrants further investigation as it is possible that market participants might perceive that the firm’s risk profile is altered based on the risk inherent in cryptocurrency as an asset in itself. The distinction between considering cryptocurrency as an asset as compared to using it as a transactional medium represents a gap in the current literature as most studies have examined cryptocurrencies from the perspective of an asset being held by investors rather than as a mechanism for transactions. From a transactional point of view, consumer intention to adopt cryptocurrency as a means of payment is influenced by an array of factors that support its use as well as factors that dissuade them from using cryptocurrency [6].
From the above argument, it is clear that there are certain inherent tensions that need to be resolved and this brings into question how business strategies centered around the adoption of cryptocurrency impact investor perception. This study seeks to assess this question by examining it within the context of the adoption of cryptocurrency by MercadoLibre, a large e-commerce platform that operates primarily in Latin American markets. In August 2024, MercadoLibre’s fintech arm Mercado Pago introduced a stablecoin called Meli Dólar [7]. This study aims to assess whether the introduction of the Meli Dólar as a payment method by MercadoLibre has had an impact on investor perception of MercadoLibre. In order to isolate the impact of the adoption of cryptocurrency we seek to examine it using a Regression Discontinuity Design (RDD)-based approach as it will help in examining the market impact at the exact point in time of introduction of cryptocurrency. We also consider the case of the withdrawal of the Libra currency by eBay on 11 October 2019. This will give us a holistic view of how investors perceive cryptocurrency as a payment option.
Existing studies on the adoption of cryptocurrency as a means of payment are limited or deal with firm-specific aspects such as the one by Gao, et al. [8], which deals with the impact of cryptocurrency on firm performance. Prior studies also examine cryptocurrency as a payment mode from the perspective of consumers [9]. However, studies dealing with how investors perceive the adoption of cryptocurrency as a payment instrument are limited such as the study of Eshghi and and Farivar [10]. However, to the best of our knowledge, there are almost no studies on how shareholders perceive the withdrawal of cryptocurrency as a payment instrument. In order to fill this gap, this study seeks to highlight how investors perceive the impact of addition as well as the impact of the withdrawal of cryptocurrency as a payment tool. The novelty is further complemented by the usage of the RDD approach. Our findings contribute to the ongoing discourse on the implications of integrating cryptocurrencies in the e-commerce sector.
The remainder of this paper is structured as follows: Section 2 covers the literature review; Section 3 explains the model derivation; Section 4 discusses the data and methodology adopted in the study; Section 5 explores the results and discusses the findings in the light of existing studies; Section 6 concludes; and the final section covers the limitations and directions for future research.
2. Theoretical Background, Literature Review, and Hypothesis Development
In this section, we present the theoretical background, most relevant related literature review, and hypothesis development.
2.1. Efficient Market Theory
The theory of efficient markets was introduced by Fama [11], arguing that financial markets operate efficiently and the security prices reflect all available information. Under the Efficient Market Hypothesis (EMH) proposed by Fama [11], market efficiency takes on three forms: (1) the weak form implies that historical stock returns and prices can predict future returns and prices, (2) the semi-strong form suggests that the prices of securities incorporate both publicly accessible information and past information, and (3) the strong form states that stock prices reflect all available information, both public and private. In addition, according to this theory, investors and decision-makers behave in a completely logical and rational way and make choices that maximize utility [12]. Hence, as market participants are rational and objective in their information evaluation, stock prices always reflect the real value of assets [13]. Nevertheless, rational theory assumptions cannot be fully confirmed, as investors are also influenced by certain behavioral factors [14]. In this context, it is particularly important to assess investor perception as it plays a role in understanding decision-making.
2.2. Signaling Theory
Originally developed by Spence [15], signaling theory explains how signals are used by individuals to impact others’ perceptions focusing on the transmission of positive information in order to reduce information asymmetry [16]. This framework provides an understanding of how information is transmitted in circumstances where not all parties have access to the same information. Signaling theory has been widely used in several fields to explain behavior and decision-making. In e-commerce transactions, a considerable information asymmetry exists between buyers and sellers [17] whereby the signaler (which could be the e-commerce venture) has a significant amount of information that the received (which could be the investor) does not possess.
2.3. Investor’s Behavior and Cryptocurrency Adoption
Advancements in financial technology and payment systems play a crucial role in promoting the global growth of e-commerce. Consequently, several companies are embracing new technology payment systems in e-commerce to maintain a competitive edge with other industry leaders in the market.
A variety of digital payment systems are currently used, among them PayPal, electronic cards, and mobile payments [18,19], and there has been a growing interest in using cryptocurrencies as a payment method [20,21].
In the context of the new generation of payment systems with cryptocurrencies and blockchain technology, stablecoins have emerged as an alternative decentralized payment tool. These digital currencies exhibit unique characteristics that set them apart from traditional electronic transaction platforms, warranting an examination of their distinctive features compared to conventional electronic payment tools. While cryptocurrencies offer users greater flexibility, enhanced security, and greater economies, making them potentially superior to traditional forms of money, their widespread acceptance has been impeded by the high [22] and returns volatility resulting from inflexible monetary policies [23,24,25,26,27,28]. The fluctuating values of these digital assets prevent users from effectively utilizing them as a medium of exchange. Although stability remains a crucial and highly sought-after feature of this technology, it continues to be one of the most challenging aspects to achieve in the cryptocurrency landscape.
However, cryptocurrencies do not serve as a store of value, due to their price volatility, and cannot function as money. Stablecoins, which have their values indexed to fat currencies, such as the US dollar, are cryptocurrencies that are designed to maintain a consistent price. These digital assets offer an innovative solution to overcome price instability in the cryptocurrency market, creating a link between the decentralized aspect of digital currencies and the stability of traditional financial systems [29]. Additionally, stablecoins enable smoother transactions within the cryptocurrency ecosystem for everyday purchases. As a consequence, users are protected against significant price fluctuations between the time they initiate a transaction and the time it is confirmed [30]. Given the potential risks associated with cryptocurrencies, one might wonder: what drives companies to willingly adopt/invest in such volatile assets?
The adoption of stablecoins has boomed all over the world in 2024, overtaking the main traditional financial parties in terms of transaction volume. In the rapidly evolving financial industry, understanding cryptocurrency adoption as a transaction medium is crucial.
Existing studies have shown that users’ intention to adopt cryptocurrencies could be influenced by several factors, including ease of use, perceived utility, and perceived risk [31,32]. A study on a sample of retailers active in e-commerce, conducted by Jonker [1], shows that even if the acceptance of cryptocurrencies as a payment tool is modest (2%), online retailers are showing considerable interest in adopting cryptocurrencies, pointing out that the most serious barrier to crypto-acceptance is a lack of consumer demand.
According to Nadeem, et al. [33], the uptake of cryptocurrencies remains limited, with consumers requiring more information about confidence, protection, and perceived worth as key drivers in embracing cryptocurrencies for commercial transactions [32,34]. Hence, considerable investment is required to encourage the adoption of electronic payments and establish a robust digital infrastructure to enable easy access. A barrier to adopting cryptocurrency as a payment mode is the risk of fraud and cyberattacks. In order to build trust in digital payment systems, investments should focus on securing the payment infrastructure with strong cybersecurity measures [35].
The work of Alafeef, et al. [36] further illustrates this complexity by showing that the adoption of cryptocurrencies, particularly stablecoins, is influenced by risk perception and market stability. The study emphasizes that stablecoin adoption is largely dependent on trust in stablecoin systems, transparency, and regulatory compliance.
A recent study by Mercik, Słoński and Karaś [3] examines the impact of including crypto-assets on companies’ balance sheets on their risk profiles and stock prices. Using the Fama–French six-factor model, they find that crypto-assets significantly influence stock returns. The results underline the importance of taking crypto-assets into account in companies’ investment decisions and financial strategies.
In addition, the adoption of cryptocurrencies can significantly impact investor perception of the risk profile considering that regulatory issues may affect the adoption of cryptocurrencies. E-commerce firms can be particularly vulnerable to this as concerns about regulations may introduce an element of uncertainty. This uncertainty raises questions as to how investors perceive events around decisions taken by firms regarding cryptocurrency. We hypothesize that strategic decisions taken around cryptocurrencies can impact investor behavior and thereby the dynamics of the movement of stock prices. A firm’s decision related to cryptocurrency can relate to its introduction or withdrawal. We propose to assess this aspect and consider the following as the principal research question guiding this study—How does the market react to strategic decisions related to cryptocurrency? We examine this question by considering how markets react to the adoption of cryptocurrencies and also examine how markets react when a firm decides to withdraw from providing cryptocurrency as a payment mode.
Strategic decisions related to adding cryptocurrencies as a payment mode may have positive spinoffs in terms of the added choice available to consumers and this benefit might be pronounced in the case of e-commerce ventures as they are by nature reliant on online payment systems. The benefit of adding cryptocurrency has salience when viewed in light of the increasing adoption of cryptocurrencies [37,38]. However, the challenge that e-commerce firms have to navigate is trying to balance issues that concern potential regulatory issues against the need to add value to the firm. Regulatory aspects are a real concern when it comes to cryptocurrencies [39], but nevertheless, we consider that the introduction of cryptocurrency as a payment instrument provides significant value to consumers and is therefore likely to influence investor perception and thereby the stock price.
A notable research gap exists in the cryptocurrency literature regarding the understanding of user perspectives and factors influencing the adoption of stablecoins as a strategy to address volatility in crypto markets. Despite the increasing literature on stablecoins and their role in mitigating market fluctuations, research is lacking on the impact of stablecoin adoption on the stock performance of e-commerce firms. In view of the above literature gap and in response to the growing importance of digital assets, the present study seeks to evaluate the following hypothesis:
H1:
The introduction of cryptocurrency as a payment method by e-commerce firms is associated with positive abnormal stock returns.
E-commerce firms are particularly wary of the risk related to the adoption of cryptocurrency as it has spillover effects that may be a source of concern for investors. Wu, et al. [40] note that the intention to adopt cryptocurrencies is driven by considerations of consumer convenience and compatibility, but nevertheless, firms should take potential regulatory issues into consideration when it comes to strategizing around cryptocurrencies. Taking into account these aspects, we posit that an e-commerce firm’s decision related to the discontinuation of cryptocurrencies is likely to have a favorable impact on consumer perception and therefore is likely to cascade into stock prices. We therefore hypothesize as follows:
H2:
The discontinuation of cryptocurrency as a payment method is associated with abnormal negative stock returns.
Thus, our contribution to the literature on the impact of cryptocurrency adoption on stock market performance is twofold. First, to the best of our knowledge, our paper being the first of its kind investigates the impact of stablecoin adoption on e-commerce stock performance. This gives us a more complete insight into the factors influencing e-commerce companies’ equity performance. Second, this study adopts a different method, the Regression Discontinuity Design approach, to analyze the Mercado Libre (MELI) stock price trends before and after the introduction of stablecoin as a payment option.
This study considers using an RDD model to examine the causal effect of the introduction of the Meli Dólar on investor behavior considering stock prices as a proxy [41,42]. RDD fits the requirements of the study as the data relates to stock prices and in accordance with the semi-strong form of efficient market hypothesis, any information should reflect immediately on the intervention date. The method has also been used in studies related to equity markets [43]. In addition, we seek to confirm the findings of the RDD-based approach by estimating the abnormal returns as well as the cumulative abnormal returns following the approach of Brown and Warner [44].
3. The Model
3.1. The RDD Model
The goal of the study is to estimate the causal impact of the introduction of the Meli Dólar on investor behavior. Stock prices are taken as a proxy for investor behavior. This method has been adopted in other studies related to stock prices [43]. In order to assess this, we use a sharp Regression Discontinuity Design (RDD) approach. The underlying idea is to compare stock prices before and after the intervention date considering time as the running variable. The treatment effect at the cutoff is defined by Equation (1).
This equation represents the average treatment effect at the cutoff point Xi = 0 where Xi measures time in days relative to the intervention date of 21 August 2024. Yi(1) represents the potential outcome under treatment, and in this instance, it stands for the stock price that would be observed for unit i if the Meli Dólar had been launched. Y0 represents the stock that would have occurred if the Meli Dólar had not been introduced. Therefore, Yi(1) − Yi(0) captures the individual causal effect. The in the equation indicates that only observations related to the cutoff point are considered.
In order to estimate the treatment effect, we examine the expected outcome just above and just below the cutoff point (which corresponds to 21 August 2024, the intervention date given by Xi = 0).
where corresponds to the average value of stock prices for the observations relating to the period just after the cutoff date and relates to the period before the intervention date, which, in other words, is the untreated portion as it is prior to the introduction of the Meli Dólar.
Since the conditional expectations in Equation (2) are not observable directly, they must be estimated from the data. In order to do this, we consider a local polynomial regression that will help in estimating the regression functions on either side of the cutoff point. We consider a bandwidth ‘h’ to fit the local polynomials and this will help in obtaining the initial estimator . However, local polynomial estimators near boundary points such as the cutoff are known to exhibit bias. To address this, we apply the robust bias-corrected estimator proposed by Calonico, et al. [45], which adjusts the initial estimate by subtracting an estimate of its leading bias term. We derive the bias-corrected estimator as follows:
Here, is the estimated bias term and it is obtained by fitting a higher-order local polynomial regression using a larger bandwidth ‘b’. This provides for an approximation of the curvature of the regression function near the cutoff point. The bias estimator is then scaled appropriately and subtracted from the initial estimator to improve the accuracy and ensure that the inference is valid. The bias in a local polynomial regression is linked to the degree of the polynomial. In other words, the bias grows with the square of the bandwidth (given by ‘h’). For a polynomial of order ‘p’ the bias grows with ‘’.
3.2. Abnormal Returns and Cumulative Abnormal Returns
To complement the RDD approach and in order to test the hypotheses, we estimate Abnormal Returns (AR) and Cumulative Abnormal Returns (CAR) around the events. We consider the model adopted by Brown and Warner [44] for the purpose of estimating expected returns [46]. The formulation involves regressing the daily stock returns of the firm against the returns of the NASDAQ. The abnormal returns are computed as the difference between the actual value and predicted returns obtained from the OLS model. Following Brown and Warner [44], we construct a short-term event window in order to isolate the impact of the event from general market-related movements. We consider a period spanning 8 days before and after the event as this will ensure that it closely aligns with the period specified in the RDD formulation and is consistent with the period obtained using the window selection approach given by Calonico, Cattaneo, Farrell and Titiunik [45]. The formulation for abnormal returns based on the market-based returns is as follows:
where stands for excess returns over the market for firm ‘i’ in time ‘t’ and represents the return of firm ‘i’ on day ‘t’ and stands for the returns of the market index NASDAQ (given by ‘m’) on day ‘t’. ‘’ and ‘’ represent the ordinary least squares regression values for the estimation period.
This approach will help us confirm the impact of these announcements and thereby lend further credence to the findings of the RDD-based approach. The AR is restricted to the event date whereas the CAR is computed based on an 8-day window before and after the event.
The time period is given by ‘t1’ which stands for the starting date and ‘t2’ represents the end date.
4. Data and Methodology
In furtherance of the study, we examine the case of Mercado Libre to assess the hypothesis relating to the impact of the adoption of cryptocurrency on the stock price of e-commerce firms. The choice of Mercado Libre is based on the fact that it is a large e-commerce firm with a substantial presence in Latin American countries [47]. On 21 August 2024, Mercado Libre introduced Meli Dólar, a stablecoin linked to the US Dollar, into its payment ecosystem. The move was marked by a series of public communications that sought to emphasize the benefits of using Meli Dólar for transactions. As this represents a significant cryptocurrency intervention, we investigate whether the Meli Dólar ’s inclusion as a mode of payment by Mercado Libre had an impact on its stock performance and we address this question by using an RDD-based approach considering 21 August 2024 as the cutoff date. The RDD approach has been used in studies where time is the running variable, and the approach allows for rigorous causal inferences by considering observations just above and below a cutoff point such that we consider all t > e to be different from t < e considering ‘e’ as the event and ‘t’ as time [48]. We examine our hypothesis by assessing whether there is a statistically significant abnormal return on Mercado Libre stock before and after the cutoff date of 21 August 2024.
The idea of using a cutoff is based on the premise that stock prices may react differently after the cutoff date, as the reaction is likely to be instantaneous, which is in keeping with the signaling theory. The cutoff date is the date on which the signal was received; therefore, any abrupt changes in stock prices at the cutoff can be attributed to information related to the adoption of cryptocurrency as a mode of payment by the firm. Given that the cutoff date serves as a marker of the date on which information was incorporated into the stock, we consider that any abrupt change in price is related to the information rather than the gradual change in prices that is part of the normal market process. Since the cutoff date is the inflection point, we consider the RDD as the ideal approach to isolate the causal effect of the information related to decisions around cryptocurrencies and, more specifically, decisions related to adopting or withdrawing from using cryptocurrency within the payment infrastructure.
We focus on e-commerce ventures because their presence is primarily online; therefore, cryptocurrency adoption has a direct impact on their operations and profitability. The nature of e-commerce firms also makes cryptocurrency integration a natural and viable option as it broadens consumer choice. We consider the case of Mercado Libre as it has a large presence in Latin America and is a significant player in the e-commerce marketplace.
In order to assess the second hypothesis relating to the discontinuation of cryptocurrency, we take the case of eBay as they are well-known players in the e-commerce space. eBay initially considered Libra, a cryptocurrency introduced by Facebook, as a mode of payment; however, on 11 October 2019, eBay shifted its strategy by withdrawing its Libra offering, taking into consideration issues related to possible regulatory issues revolving around continuing with Libra. How did the withdrawal of cryptocurrencies from the payment ecosystem impact the stock price of eBay? We examine this question by considering whether there was a significant impact on stock prices during the announcement period.
To examine the impact of the introduction of Meli Dólar on the stock prices of Mercado Libre, we employed a Regression Discontinuity Design (RDD) approach, considering the date of introduction of the Meli Dólar as the cutoff date. The data for the purposes of the study was obtained from Yahoo Finance. The stock prices of Mercado Libre with the ticker symbol MELI and eBay with the ticker symbol EBAY were considered. The daily closing prices of the stock were considered for the purposes of the study. We consider a shorter period around the cutoff date as being critical to the assessment, as it captures the specific effect of the event in addition to minimizing the impact of confounding factors, which is usually the case when dealing with longer periods. For the purposes of this study, we consider using a sharp RDD based on a local polynomial regression approach, following the method proposed by Calonico, Cattaneo, Farrell and Titiunik [45], considering a triangular kernel and estimation of nearest-neighbor (NN) variance. We consider a first-order local linear polynomial estimation with bias correction of the second order, as this allows for a bandwidth that optimally balances bias and variance. The optimal bandwidth is estimated using the mean squared error method, as this helps ascertain the appropriate pre-treatment and post-treatment period.
5. Results and Discussion
For clarity, we consider the first and second hypotheses to be Study 1 and Study 2, respectively.
First, we describe the data and then estimate the model. The running variable in the study is time. The bandwidth is selected using the Mean Squared Estimation (MSE) method proposed by Calonico, Cattaneo, Farrell and Titiunik [45]. We examine the Regression discontinuity plot to obtain a visual overview before estimating the RDD. Our analysis is conducted in the following order:
- Descriptive statistics indicating the distribution before and after the cutoff date;
- Regression discontinuity plot;
- RDD estimation;
- Placebo tests;
- Assessing abnormal returns.
5.1. Study 1: Assessing the Impact of the Introduction of the Meli Dólar on the Stock Price of Mercado Libre
In this subsection, we examine the impact of the introduction of the Meli Dólar on MercadoLibre’s stock price. We first examine the descriptive statistics and then examine the results of the RDD output. We also conduct a robustness test considering 5, 10, and 15 days prior to after the event as event dates.
5.1.1. Descriptive Statistics of MELI Stock Prices
Descriptive statistics related to the Mercado Libre stock prices are given with a break in the mean and standard deviation before and after the cutoff date. Table 1 shows a marked increase in MercadoLibre’s stock price during the post-cutoff period. The standard deviation decreased in the post-event period, indicating that the price was less volatile after the introduction of Meli Dólar.

Table 1.
Descriptive statistics relating to MELI stock prices.
Figure 1 shows visual evidence of the movement of the stock price of Mercado Libre (MELI) and indicates the scatter around the event, with 0 representing the cutoff date of 21 August 2024. The scatterplot shows that there was considerable volatility, with prices ranging from 1850 to 2050 within a 20-day period. The chart further indicates that there was an overall upward trend prior to the event, despite a few dips, which is consistent with a normal market cycle. The post-event performance of the stock was volatile, but, in general, it maintained levels that were higher than the pre-event levels.
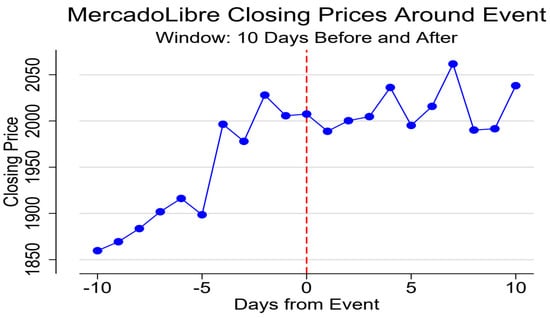
Figure 1.
Mercado Libre closing price around the event with x = 0 indicating the event date. Note: The red line refers to the event date and the blue line represents the movement of stock prices.
5.1.2. RDD Estimation of the Impact of the Introduction of Meli Dólar
Because this study is concerned with isolating discontinuous changes on the cutoff date, we first assessed the appropriate order of the polynomial that would provide the best fit for the analysis. We tested the values for different polynomial orders; the coefficients, standard errors, p-values, and bandwidth-related information are presented in Table 2. It is clear that the first-order polynomial is highly significant, and because higher-level polynomials are likely to induce excessive curvature, they may potentially indicate more noise. The bandwidth is 6 to the left of the cutoff date and 7 to the right of the cutoff date, and we consider this to be optimal as it involves stock price movements and a period that is too large may introduce bias.
Table 2.
RD estimates of MercadoLibre’s stock prices with different polynomial orders.
Figure 2 provides a visual representation of the first-order polynomial fit of log-transformed closing prices across the period surrounding the event. The RDD results provide evidence of a clearly significant discontinuity at the threshold date (21 August 2024) on which the Meli Dólar was introduced.
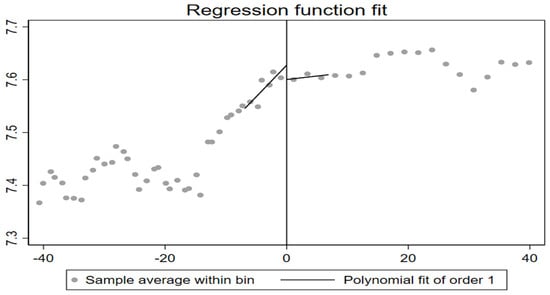
Figure 2.
Regression discontinuity function fit for the first-order polynomial for the price of Mercado Libre. ‘0’ indicates 21 August 2024 (date of event).
The RDD estimates (Table 3), estimated using a first-order polynomial regression, indicate a treatment effect of −0.0227 (p = 0.009). This constitutes an approximately 2.27% reduction in the stock price of MercadoLibre on 21 August 2024, which corresponds with the introduction of the Meli Dólar. This estimate is robust even after applying bias correction techniques (robust p = 0.052). The parameter estimates in Table 3 align with the visual evidence in Figure 2, thereby providing statistically meaningful evidence of a discontinuity. The optimal bandwidth selection criterion yielded h = 6.866 on both sides of the cutoff, with the effective sample sizes being six observations on the left and seven on the right of the cutoff point (c = 0).
Table 3.
Estimates of the RDD for the MercadoLibre stock prices as of 21 August 2024.
The triangular kernel-based weighting method assigns greater weights to observations that are closer to the event, thereby enhancing the precision of the treatment effect. This approach avoids the problem of possible confounding biases creeping in from distant observations, and more particularly, as stocks are prone to a wide range of event-based shifts. The statistical and graphical evidence supports the hypothesis that the introduction of Meli Dólar had an impact on the stock price of MercadoLibre and that the market established a new equilibrium, subsequently indicating that it had internalized the information shock.
5.1.3. Robustness Check
In order to assess the robustness of the model, we conducted placebo tests using artificial cutoff points instead of the true cutoff point which corresponds with August 21, the date on which the Meli Dólar was introduced. The placebo test examines the possibility of discontinuities by taking a period 5, 10, and 15 days before and after the event. The output is provided in Table 4, where it can be seen that the coefficients vary in sign and magnitude, but none of these values are significant at the conventional significance level (α = 0.05).
Table 4.
Placebo test to assess the robustness of the model testing the impact of the introduction of the Meli Dólar on the stock price of MercadoLibre.
The results of the placebo test do not provide any evidence of a consistent pattern, with only one of the six tests approaching marginal significance (p = 0.076). The robustness test indicates that there are no discontinuities on other dates and this confirms our hypothesis that there is a discontinuity on the event date (p = 0.052).
5.2. Study 2: Assessing the Impact of the Withdrawal of Libra Currency on the Stock Price of eBay
In this subsection, we examine the impact of the introduction of the Libra currency on eBay’s stock price. We first examine the descriptive statistics and then examine the results of the RDD output. We carry out a robustness check considering 5, 10, and 15 days prior to after the event as event dates.
5.2.1. Descriptive Statistics of eBay Stock Prices
The output in Table 5 indicates that the average price before the event is much higher than that after the event. The descriptive statistics indicate a mean decrease of about 3.17 during the post-event phase. The post-event phase indicates clearly higher volatility, but this in itself does not reflect a specific discontinuity, as stock prices are likely to be influenced by a broad array of external variables.
Table 5.
Descriptive statistics of eBay stock prices.
Figure 3 provides a visual presentation of the data and shows a noticeable jump on the event date (11 October 2019) corresponding to x = 0 on the chart.
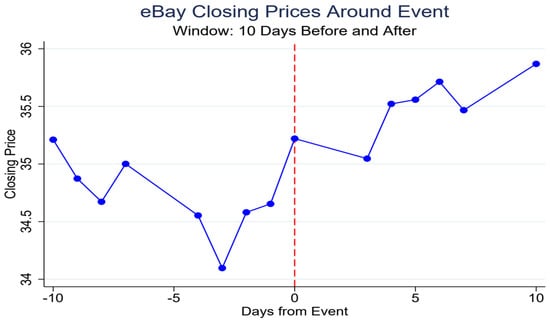
Figure 3.
eBay closing prices around the event with x = 0 representing the event date of 11 October 2019. Note: The red line refers to the event date and the blue line represents the movement of stock prices.
5.2.2. RDD Estimation of the Impact of the Withdrawal of the Libra
The regression discontinuity estimates for the first-to-fourth-order polynomials are presented in Table 6. The first-order polynomial provided the highest coefficient and was also highly significant (p = 0.001), indicating a reliable discontinuity at the cutoff point. The higher-order polynomial estimates appear to be smaller by comparison, besides using wider bandwidths, which increases the risk of bias as it includes observations away from the cutoff point.
Table 6.
RDD estimates of eBay’s stock price with different polynomial orders.
The RD plot for the polynomial fit of order one is shown in Figure 4. There is an abrupt increase near the event date, which conveys a discontinuity. The event date of 11 October 2019 is denoted by the vertical line at x = 0. The graph plots the log of eBay’s closing prices and indicates a clear upward jump at the cutoff point, which indicates a positive discontinuity in stock prices. This jump indicates that investors reacted favorably to the discontinuation of Libra as a means of payment and possibly interpreted it as being beneficial to the firm.
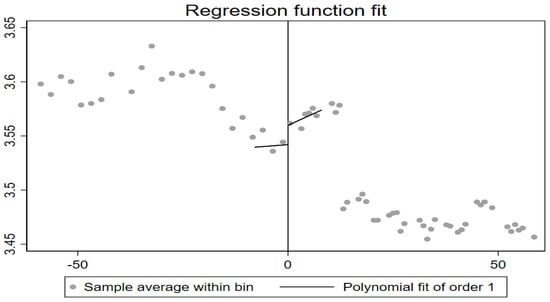
Figure 4.
Regression discontinuity plot for the first-order polynomial of the stock prices of eBay surrounding the event window.
The estimates of the RDD estimates for the event study related to the impact of the withdrawal of the Libra currency are given in Table 7. The estimated treatment effect is 0.629 in both the conventional as also the robust estimates and the low p-values of 0.008 and 0.041 indicate strong evidence against the null hypothesis that there is no effect.
Table 7.
RDD estimates for the eBay stock prices as of 11 October 2019.
5.2.3. Robustness Checks
A robustness check was performed using placebo tests at alternative cutoff points around the event date. The output in Table 8 indicates the tests performed at cutoffs—−15, −10, −5, 5, 10, and 15. Overall, the results are insignificant and this indicates that the significant jump in the event date is not a random occurrence. More precisely, the results indicate non-significant results except for +5 days, which indicates a positive coefficient (0.0309, p-value = 0.0031), indicating some noise or market reaction in that period. However, this could be due to the overall market movement, as the NASDAQ index declined on 18 October 2019.
Table 8.
Placebo test to assess the robustness of the model testing the impact of the withdrawal of Libra currency on the stock price of eBay.
5.3. Calculation of Abnormal Returns
Table 9 provides the output for the estimation of the abnormal returns and the cumulative abnormal returns. The period of estimation for the Meli Dólar’s impact is from 13 August to 3 September 2024 and the period for the estimation of the impact of the withdrawal of Libra is from 3 October to 24 October 2019.
Table 9.
Estimation of abnormal returns and cumulative abnormal returns.
5.3.1. Study 1: Market-Based AR and CAR—Introduction of Meli Dólar
We have seen that the RDD estimate provides for a significant negative discontinuity of −2.27% in the log of Meli’s stock price as of 21 August 2024, which corresponds to the date of the Meli Dólar announcement. Market-based assessment lends support to this finding as the AR on the event is −0.79% and the CAR for the period between 13 August to 3 September 2024 is at −5.55%. This probably indicates that the investors consider the initiative to include cryptocurrency as a payment option as being risky. This finding also aligns with the EMH as prices adjusted quickly in response to the announcement [49].
5.3.2. Study 2: Assessment of AR and CAR Relating to the Event Period Surrounding the Withdrawal of the Libra Currency
The RDD assessment indicates a positive discontinuity of +6.29% on the event date (11 October 2019). The abnormal return on the event day was a positive 0.51% and the CAR for the period from 3 October to 24 October 2019 is +1.22%. This result implies that investors probably consider the strategic decision of eBay as prudent. The investor reaction is consistent with signaling theory as the decision to withdraw was probably perceived as a positive signal. The markets subsequently adjusted rapidly, thereby indicating that the news was rapidly absorbed into the equity prices.
5.4. Discussion
The RDD analysis reveals that the market is clearly averse to cryptocurrency being used as a payment method by e-commerce firms. The negative reaction can be attributed to various factors such as perceived uncertainty, which is a critical determiner that impacts investor perception [50]. The findings are consistent with signaling theory, which posits that critical strategic decisions send signals to investors about the future prospects of the firm [16].
While the adoption of cryptocurrency as a payment mode contributes to convenience and efficiency for customers [2], their integration into the payment systems may heighten risk perception. The finding that the adoption of cryptocurrency as a payment mode is associated with negative investor sentiment also resonates with [51], who examined the introduction of cryptocurrency as a payment mode and its impact on revenue. Gao, Gu, Leung, Liu and Ye [51] examined this in the context of an online travel agency and found that the adoption of cryptocurrency as a means of payment led to a decrease in revenue. This result aligns with Mercik, Słoński and Karaś [3] who found that firm decisions around cryptocurrencies have an impact on its stock price.
The findings of this study also resonate with EMH and particularly the semi-strong form whereby stock prices rapidly incorporate publicly available information. Indeed, the immediate adjustments observed in both cases serve to support EMH. This finding is supported by many previous studies, notably that of Chang, Hong and Liskovich [43], in which an RDD approach was used to demonstrate that stock prices react sharply to changes in index membership, and this is consistent with the semi-strong form of EMH. These abrupt changes indicate that investors are rational players and that market reactions are not arbitrary.
The relative difference between the abnormal returns of MELI and eBay highlight the nonlinearity of investor risk tolerances for adoption as compared to withdrawal. We acknowledge that this difference is minimal and could also be attributed to other factors, as stock movements are impacted by a wide array of factors such as the breadth of information dissemination [52]. Nevertheless, this finding aligns with other studies that demonstrate that negative news is viewed more unfavorably by the market [53,54].
Our findings highlight the fact that strategic decisions related to cryptocurrency serve as powerful signals that impact investor perceptions. In the case of both events, the announcements serve as signals prompting investors to weigh in on the potential risks, and this is consistent with studies related to signaling theory [55,56]. In this sense, it is possible for firms to use costly signaling to offset the potential negative impact, as these may help in improving investor perception [55].
6. Conclusions
The study examined the question of how investors respond to strategic decisions regarding the adoption and withdrawal of cryptocurrencies as payment instruments by e-commerce firms and, towards this end, analyzed two key events—MercadoLibre’s adoption of a stablecoin-based payment method and eBay’s withdrawal from the Libra project. The results indicate a negative market reaction to the adoption of cryptocurrency and a positive reaction to the firm’s decision to dissociate itself from providing cryptocurrency as a payment mode. These findings challenge the narrative that the integration of cryptocurrency as a mode of payment adds to shareholder value.
The study demonstrates that firms may consider cryptocurrency integration as being beneficial in attracting new customers, though investors tend to interpret such moves as increasing risk. This clearly stresses the necessity for firms to carefully weigh in, not only on the potential operational and strategic benefits but also taking into consideration the impact of such decisions on the investor base.
The findings also highlight the critical role of communication and signaling in shaping market responses, particularly with reference to cryptocurrency-related announcements. Firms must consider how these strategic decisions are framed and communicated to the market. Overall, this study contributes to the literature by revealing that cryptocurrency adoption has important ramifications for e-commerce firms. The study has important implications for managers and policymakers as they have to carefully consider these decisions and approach them with careful attention to timing, communication strategy, and the regulatory context.
The key implication is that the adoption of cryptocurrency as a payment mode may not be perceived as value-enhancing by investors. Such strategies may actually incite adverse reactions on account of the perception of heightened risk and this may be particularly pronounced in regulatory regimes that do not view cryptocurrencies favorably. The findings of this study highlight the necessity for firms to conduct a comprehensive risk assessment and examine its impact on shareholders.
7. Limitations and Directions for Future Research
The study is limited to e-commerce firms and there are multiple avenues for exploring this further. Firstly, future research can explore whether these findings extend to other types of businesses. Secondly, the study is limited in terms of the period being restricted to the short-term implications and future studies can examine the long-term implications of these strategies. Thirdly, given the critical role of signaling theory, subsequent studies can examine how the manner, timing, and framing of announcements influence market reactions. By addressing these aspects, future research can enrich our understanding of how markets tend to react to strategic innovations situated around the adoption of payment technologies.
Author Contributions
Conceptualization, S.K.V.; methodology, S.K.V.; software, S.K.V.; validation, M.T. and S.K.V.; formal analysis, S.K.V.; investigation, S.K.V.; resources, M.T. and S.K.V.; data curation, S.K.V.; writing—original draft preparation, M.T. and S.K.V.; writing—review and editing, M.T.; visualization, S.K.V. and M.T.; supervision, M.T. and S.K.V.; project administration, M.T.; funding acquisition, Not applicable. All authors have read and agreed to the published version of the manuscript.
Funding
This research received no external funding.
Institutional Review Board Statement
This study is based on publicly available stock data and therefore an approval is deemed unnecessary.
Informed Consent Statement
Not applicable.
Data Availability Statement
This study is based on publicly available data.
Conflicts of Interest
The authors declare no conflict of interest.
References
- Jonker, N. What drives the adoption of crypto-payments by online retailers? Electron. Commer. Res. Appl. 2019, 35, 100848. [Google Scholar] [CrossRef]
- Titov, V.; Uandykova, M.; Litvishko, O.; Kalmykova, T.; Prosekov, S.; Senjyu, T. Cryptocurrency Open Innovation Payment System: Comparative Analysis of Existing Cryptocurrencies. J. Open Innov. Technol. Mark. Complex. 2021, 7, 102. [Google Scholar] [CrossRef]
- Mercik, A.; Słoński, T.; Karaś, M. Understanding crypto-asset exposure: An investigation of its impact on performance and stock sensitivity among listed companies. Int. Rev. Financ. Anal. 2024, 92, 103070. [Google Scholar] [CrossRef]
- Chokor, A.; Alfieri, E. Long and short-term impacts of regulation in the cryptocurrency market. Q. Rev. Econ. Financ. 2021, 81, 157–173. [Google Scholar] [CrossRef]
- Cary, M. Down with the #Dogefather: Evidence of a Cryptocurrency Responding in Real Time to a Crypto-Tastemaker. J. Theor. Appl. Electron. Commer. Res. 2021, 16, 2230–2240. [Google Scholar] [CrossRef]
- Murugappan, M.; Nair, R.; Krishnan, S. Global Market Perceptions of Cryptocurrency and the Use of Cryptocurrency by Consumers: A Pilot Study. J. Theor. Appl. Electron. Commer. Res. 2023, 18, 1955–1970. [Google Scholar] [CrossRef]
- MercadoLivre. Meli Dolar tem o Mesmo Valor do Dolar. Available online: https://www.mercadolivre.com.br/melidolar (accessed on 1 February 2025).
- Gao, L.; Shi, Y.; Zheng, Y. Cryptocurrency exposure and the cost of debt. Financ. Res. Lett. 2025, 73, 106668. [Google Scholar] [CrossRef]
- Al Reshaid, F.; Tosun, P.; Yanar Gürce, M. Cryptocurrencies as a means of payment in online shopping. Digit. Policy Regul. Gov. 2024, 26, 375–393. [Google Scholar] [CrossRef]
- Eshghi, K.; and Farivar, S. The Addition of New Payment Method and Shareholder Value: Evidence From Cryptocurrency Adoption. J. Organ. Comput. Electron. Commer. 2025, 35, 89–114. [Google Scholar] [CrossRef]
- Fama, E.F. Efficient Capital Markets: A Review of Theory and Empirical Work. J. Finance 1970, 25, 383–417. [Google Scholar] [CrossRef]
- Ritter, J.R. Behavioral finance. Pac.-Basin Financ. J. 2003, 11, 429–437. [Google Scholar] [CrossRef]
- Bazerman, M.H.; Moore, D.A. Judgment in Managerial Decision Making; John Wiley & Sons: Hoboken, NJ, USA, 2012. [Google Scholar]
- Shah, A.K.; Zhao, J.; Mullainathan, S.; Shafir, E. Money in the Mental Lives of the Poor. Soc. Cogn. 2018, 36, 4–19. [Google Scholar] [CrossRef]
- Spence, M. Job Market Signaling. Q. J. Econ. 1973, 87, 355–374. [Google Scholar] [CrossRef]
- Connelly, B.L.; Certo, S.T.; Ireland, R.D.; Reutzel, C.R. Signaling Theory: A Review and Assessment. J. Manag. 2011, 37, 39–67. [Google Scholar] [CrossRef]
- Rao, S.; Lee, K.B.; Connelly, B.; Iyengar, D. Return Time Leniency in Online Retail: A Signaling Theory Perspective on Buying Outcomes. Decis. Sci. 2018, 49, 275–305. [Google Scholar] [CrossRef]
- Tang, Y.M.; Chau, K.Y.; Hong, L.; Ip, Y.-K.; Wan, Y. Financial Innovation in Digital Payment with WeChat towards Electronic Business Success. J. Theor. Appl. Electron. Commer. Res. 2021, 16, 1844–1861. [Google Scholar] [CrossRef]
- Thoumrungroje, A.; Suprawan, L. Investigating M-Payment Intention across Consumer Cohorts. J. Theor. Appl. Electron. Commer. Res. 2024, 19, 431–447. [Google Scholar] [CrossRef]
- Casino, F.; Dasaklis, T.K.; Patsakis, C. A systematic literature review of blockchain-based applications: Current status, classification and open issues. Telemat. Inform. 2019, 36, 55–81. [Google Scholar] [CrossRef]
- Garcia-Teruel, R. Legal challenges and opportunities of blockchain technology in the real estate sector. J. Prop. Plan. Environ. Law 2020, ahead-of-print. [Google Scholar] [CrossRef]
- Rudkin, S.; Rudkin, W.; Dłotko, P. On the topology of cryptocurrency markets. Int. Rev. Financ. Anal. 2023, 89, 102759. [Google Scholar] [CrossRef]
- Catania, L.; Grassi, S. Forecasting cryptocurrency volatility. Int. J. Forecast. 2022, 38, 878–894. [Google Scholar] [CrossRef]
- Evrim Mandaci, P.; Cagli, E.C. Herding intensity and volatility in cryptocurrency markets during the COVID-19. Financ. Res. Lett. 2022, 46, 102382. [Google Scholar] [CrossRef] [PubMed]
- Qian, L.; Wang, J.; Ma, F.; Li, Z. Bitcoin volatility predictability: The role of jumps and regimes. Financ. Res. Lett. 2022, 47, 102687. [Google Scholar] [CrossRef]
- Takaishi, T. Rough volatility of Bitcoin. Financ. Res. Lett. 2020, 32, 101379. [Google Scholar] [CrossRef]
- Troster, V.; Tiwari, A.K.; Shahbaz, M.; Macedo, D.N. Bitcoin returns and risk: A general GARCH and GAS analysis. Financ. Res. Lett. 2019, 30, 187–193. [Google Scholar] [CrossRef]
- Zhang, C.; Ma, H.; Arkorful, G.B.; Peng, Z. The impacts of futures trading on volatility and volatility asymmetry of Bitcoin returns. Int. Rev. Financ. Anal. 2023, 86, 102497. [Google Scholar] [CrossRef]
- Ante, L.; Fiedler, I.; Strehle, E. The influence of stablecoin issuances on cryptocurrency markets. Financ. Res. Lett. 2021, 41, 101867. [Google Scholar] [CrossRef]
- Cao, Y.; Dai, M.; Kou, S.; Li, L.; Yang, C. Designing stablecoins. Math. Financ. 2025, 35, 263–294. [Google Scholar] [CrossRef]
- Ecer, F.; Murat, T.; Dinçer, H.; Yüksel, S. A fuzzy BWM and MARCOS integrated framework with Heronian function for evaluating cryptocurrency exchanges: A case study of Türkiye. Financ. Innov. 2024, 10, 31. [Google Scholar] [CrossRef]
- Hayashi, F.; Routh, A. Financial Literacy, Risk Tolerance, and Cryptocurrency Ownership in the United States; The Federal Reserve Bank of Kansas City Research Working Papers; The Federal Reserve Bank of Kansas City: Kansas City, MO, USA, 2024. [Google Scholar] [CrossRef]
- Nadeem, M.; Liu, Z.; Pitafi, A.H.; Younis, A.; Xu, Y. Investigating the Adoption Factors of Cryptocurrencies—A Case of Bitcoin: Empirical Evidence From China. SAGE Open 2021, 11, 2158244021998704. [Google Scholar] [CrossRef]
- El Hajj, M.; Farran, I. The cryptocurrencies in emerging markets: Enhancing financial inclusion and economic empowerment. J. Risk Financ. Manag. 2024, 17, 467. [Google Scholar] [CrossRef]
- Khando, K.; Islam, M.S.; Gao, S. The Emerging Technologies of Digital Payments and Associated Challenges: A Systematic Literature Review. Future Internet 2023, 15, 21. [Google Scholar] [CrossRef]
- Alafeef, M.; Al-Smadi, R.; Al-Smadi, A. The role of stable coins in mitigating volatility in cryptocurrency markets. Int. J. Appl. Econ. Financ. Account. 2024, 19, 176–185. [Google Scholar] [CrossRef]
- ElBahrawy, A.; Alessandretti, L.; Kandler, A.; Pastor-Satorras, R.; Baronchelli, A. Evolutionary dynamics of the cryptocurrency market. R. Soc. Open Sci. 2017, 4, 170623. [Google Scholar] [CrossRef]
- Urquhart, A.; Yarovaya, L. Cryptocurrency research: Future directions. Eur. J. Finance 2024, 30, 1849–1854. [Google Scholar] [CrossRef]
- Corbet, S.; Lucey, B.; Urquhart, A.; Yarovaya, L. Cryptocurrencies as a financial asset: A systematic analysis. Int. Rev. Financ. Anal. 2019, 62, 182–199. [Google Scholar] [CrossRef]
- Wu, R.; Ishfaq, K.; Hussain, S.; Asmi, F.; Siddiquei, A.; Anwar, M. Investigating e-Retailers’ Intentions to Adopt Cryptocurrency Considering the Mediation of Technostress and Technology Involvement. Sustainability 2022, 14, 641. [Google Scholar] [CrossRef]
- Baker, M.; Wurgler, J. Investor Sentiment and the Cross-Section of Stock Returns. J. Finance 2006, 61, 1645–1680. [Google Scholar] [CrossRef]
- Firth, M.; Wang, K.; Wong, S. Corporate Transparency and the Impact of Investor Sentiment on Stock Prices. Manag. Sci. 2015, 61, 1630–1647. [Google Scholar] [CrossRef]
- Chang, Y.-C.; Hong, H.; Liskovich, I. Regression Discontinuity and the Price Effects of Stock Market Indexing. Rev. Financ. Stud. 2014, 28, 212–246. [Google Scholar] [CrossRef]
- Brown, S.J.; Warner, J.B. Using daily stock returns: The case of event studies. J. Financ. Econ. 1985, 14, 3–31. [Google Scholar] [CrossRef]
- Calonico, S.; Cattaneo, M.D.; Farrell, M.H.; Titiunik, R. Rdrobust: Software for Regression-discontinuity Designs. Stata J. 2017, 17, 372–404. [Google Scholar] [CrossRef]
- Maurya, P.K.; Bansal, R.; Mishra, A.K. Russia–Ukraine conflict and its impact on global inflation: An event study-based approach. J. Econ. Stud. 2023, 50, 1824–1846. [Google Scholar] [CrossRef]
- Franco, S.F.; Graña, J.; Rikap, C. Dependency in the Digital Age? The Experience of Mercado Libre in Latin America. Dev. Change 2024, 55, 429–464. [Google Scholar] [CrossRef]
- Hausman, C.; Rapson, D. Regression Discontinuity in Time: Considerations for Empirical Applications. Annu. Rev. Resour. Econ. 2017, 10, 533–552. [Google Scholar] [CrossRef]
- Aggarwal, R.; Chen, S. The speed of adjustment of stock prices to new information. Financ. Rev. 1985, 20, 2. [Google Scholar] [CrossRef]
- Ah Mand, A. Cryptocurrency returns and cryptocurrency uncertainty: A time–frequency analysis. Financ. Innov. 2025, 11, 52. [Google Scholar] [CrossRef]
- Gao, C.; Gu, B.; Leung, A.; Liu, X.; Ye, Q. EXPRESS: The Risk of Cryptocurrency Payment Adoption and the Role of Social Media: Evidence from Online Travel Agencies. Prod. Oper. Manag. 2024, 33, 10591478241231860. [Google Scholar] [CrossRef]
- Fang, L.; Peress, J. Media Coverage and the Cross-section of Stock Returns. J. Finance 2009, 64, 2023–2052. [Google Scholar] [CrossRef]
- Black, E.L.; Jie, G.; Nan, H.; and Vagenas-Nanos, E. Uncertainty triggers overreaction: Evidence from corporate takeovers. Eur. J. Finance 2017, 23, 1362–1389. [Google Scholar] [CrossRef]
- Mangee, N. Stock price swings and fundamentals: The role of Knightian uncertainty. Int. Rev. Financ. Anal. 2024, 91, 102987. [Google Scholar] [CrossRef]
- Baldenius, T.; Meng, X. Signaling firm value to active investors. Rev. Account. Stud. 2010, 15, 584–619. [Google Scholar] [CrossRef]
- Hennessy, C.A.; Livdan, D.; Miranda, B. Repeated Signaling and Firm Dynamics. Rev. Financ. Stud. 2010, 23, 1981–2023. [Google Scholar] [CrossRef]
Disclaimer/Publisher’s Note: The statements, opinions and data contained in all publications are solely those of the individual author(s) and contributor(s) and not of MDPI and/or the editor(s). MDPI and/or the editor(s) disclaim responsibility for any injury to people or property resulting from any ideas, methods, instructions or products referred to in the content. |
© 2025 by the authors. Licensee MDPI, Basel, Switzerland. This article is an open access article distributed under the terms and conditions of the Creative Commons Attribution (CC BY) license (https://creativecommons.org/licenses/by/4.0/).