1. Introduction
The digital creative industry (DCI), which emerges from the convergence of contemporary information technology with cultural and creative industries, plays a pivotal role in driving economic development, promoting industrial upgrading, and enriching cultural offerings. Countries like the United States, Japan, South Korea, and the United Kingdom have increasingly recognized the significance of the DCI. For instance, the United Kingdom launched the UK Digital Strategy in 2017, emphasizing the core role of creative industries and intellectual property in technological innovation and economic development, and proposing the integration of digital technologies with the creative sector. The UK Digital Strategy 2022 further highlighted creativity and intellectual property as one of the six key areas for development. In China, the DCI was incorporated into the 13th Five-Year Plan for Strategic Emerging Industries in 2016, establishing it as a pillar industry with significant potential for influencing overall societal development. This endorsement was further reinforced by the 14th Five-Year (2021–2025) Plan and the Vision for 2035, which clearly outlined the need to implement a digital strategy for the cultural industry, propelling the rapid growth of the digital creative sector.
China’s DCI is experiencing rapid expansion, with diverse sub-industries contributing to its growth. In 2023, 73,000 enterprises above a designated size in the cultural and related industries achieved operating revenues of 1.85 trillion US dollars. Of this, 16 sub-sectors, characterized by new cultural business formats, generated revenues of 749 billion US dollars, marking a year-on-year increase of 15.3%, outpacing the overall cultural enterprises by 7.1 percentage points. Sectors such as virtual reality, digital publishing, film and television media, and animation games have demonstrated impressive performance, with the application of digital technologies significantly expanding the reach and audience engagement.
However, the spatial distribution of China’s DCI exhibits significant regional disparities, with central and western areas lagging behind the eastern coastal regions [
1,
2,
3,
4]. Our findings also indicate that China’s DCI follows a general “east-rich, west-poor” distribution, concentrated in major cities such as Beijing, Shanghai, and Guangzhou, forming distinct regional patterns. Addressing this imbalance requires a clear understanding of the factors that influence the spatial agglomeration of China’s creative sectors. The Chinese government is dedicated to optimizing the spatial layout of the DCI to achieve the coordinated development of creative industries across regions.
This study makes a significant contribution to understanding the locational drivers of DCI in China, a rapidly growing digital economy. Using data from digital creative enterprises at the county level in 2022, the study employs kernel density maps, correlation analysis, and principal component analysis to examine the relationship between locational factors and enterprise numbers in four DCI sub-sectors. Our findings show that technological innovation and economic development universally impact the agglomeration of all DCI sub-sectors. Furthermore, service-oriented digital creative enterprises tend to cluster in areas rich in cultural resources and public facilities, while government policies and financial subsidies play a significant role as well. In contrast, digital creative equipment manufacturing companies are more likely to be located near market demand and related industries.
2. Literature Review on Locational Factors of DCI
2.1. Spatial Distribution of Creative Industries
Creative industries in European countries and the United States tend to cluster in major urban centers or specific regions, such as the neo-artisanal industrial districts in central Italy. This clustering phenomenon has been observed in various studies [
5,
6,
7,
8,
9]. Scott attributes this trend to the dependence of cultural activities on complex local labor markets and extensive producer networks [
10], while Yum underscores the significance of factors like local population size, the growth of knowledge-based sectors, and infrastructure [
11].
DCIs in China are primarily centered in major urban centers, where they tend to agglomerate in central districts [
12,
13]. For instance, in Hangzhou, cultural and creative industries expand from the city center to the periphery [
14,
15]. Kernel density analysis has been used to examine agglomeration patterns, as seen in the studies of Beijing’s creative industries [
16] and the cultural and creative industries in the Beijing–Tianjin–Hebei region [
17] and in Harbin [
18] all showing strong spatial dependence and a “core-periphery” structure. This overall pattern of central-city concentration is further supported by recent analyses of China’s digital industry at the national scale [
19].
In addition to the core-periphery agglomeration pattern, DCI in China also reveals an overall distribution pattern of “more in the east, less in the west” [
20]. Due to better economic development, larger market, and richer talent pool, the agglomeration of DCI in the southeastern coastal region is significantly higher than that in the western region. This regional distribution pattern differs from the distribution trends observed in many Western countries. Similar spatial heterogeneity has also been observed in Europe. Crociata, Pinate, and Urso examine the cultural and creative economy in peripheral areas of Italy, identifying distinct patterns of specialisation and spatial dependency at the NUTS-4 level [
21].
Research on the geographic distribution of China’s DCIs covers both the sector as a whole and specific sectors like film, video games, and digital music. Zhan et al. pointed out distinctive spatial distribution characteristics among various types of digital creative enterprises [
22]. Notably, digital creative technology equipment manufacturing is mainly concentrated in Shenzhen and Guangzhou, while digital creative activities and digital integration services are spread across multiple areas, including Beijing, Shanghai, and Guangzhou. Design service firms are predominantly clustered in the eastern coastal regions, with the Yangtze River Delta as a key hub. Ma et al. observed a declining concentration trend of the animation industry from east to west, with the performing arts sector showing the highest level of agglomeration in the western regions. Moreover, the entertainment industry exhibits consistently high levels of clustering and stability in eastern China [
23].
It is worth noting that digital technology has the potential to impact the spatial distribution of creative industries, with divergent views in existing research. While communication technologies have reduced the significance of geographic distance, enabling the formation of virtual teams and remote work arrangements, leading to a more dispersed spatial landscape in the economy [
24], there are contrasting views. Pratt argues that despite the flexibility provided by new media technologies, the concentration of the creative industry in major city centers persists, potentially even reinforced [
25]. This is attributed to the industry’s heavy reliance on dense network effects, face-to-face interactions, and the concentration of knowledge and resources, all of which are more prevalent in major cities where creative firms, specialized talent, and supportive infrastructure are concentrated, facilitating industry clustering. Our research could provide valuable insights into this contrasting topic by empirically examining the spatial distribution of DCI in China, a rapidly evolving digital landscape.
2.2. Locational Factors of Creative Industries
Research on the locational factors influencing the agglomeration of the creative industry (or cultural industry) has thrived in recent decades. Several factors contribute to the clustering of these industries, including a skilled labor pool, established creative networks, supportive infrastructure, resource accessibility, and cultural environment. Factors such as openness and city ambiance also play a supportive role in this clustering process [
26].
Empirical studies typically derive locational factors from three theoretical frameworks. Firstly, economic theory considers factors such as increasing returns to scale, production costs, positive externalities, transport costs, and market demand in enterprise location decisions [
27,
28]. Secondly, the Porter Diamond Model identifies factor conditions, market demand, related and supporting industries, firm strategy, along with opportunities and government influences, as determinants of a country’s competitiveness in certain industries. This framework is widely applied in cultural industry research, focusing on endowments, market demand, related industries, and policy environment. Lastly, Florida’s “3T” theory emphasizes talent, technology, and tolerance as critical factors in promoting cultural and creative industries [
29]. In this context, ‘tolerance’ refers to the acceptance and support of diversity and inclusivity within a city or region. Researchers have applied these frameworks to analyze the dynamics of creative industry clustering, while others integrate factors from multiple frameworks and conduct tailored analyses based on these factors [
30,
31,
32].
Our study also adopts a comprehensive approach using the aforementioned frameworks. First, we identify potential locational factors. Then, through statistical analysis, we extract the actual factors that impact the spatial distribution of DCI. Based on the frameworks provided above, we have categorized the potential influencing factors into four main groups: resource endowment (including infrastructure, cultural resources, human resources, and technological innovation), market demand (including economic development, consumer demand, and the level of urbanization), government policy, and related industries.
Resource endowment, market demand, government policy, and related industries are possible key drivers of creative industry agglomeration. Studies in Italy, Spain, Zhejiang Province of China, and Jiangsu Province of China underscore the importance of infrastructure, societal tolerance, and technological capabilities in fostering agglomeration [
33,
34,
35]. Zhan and Gu identified market demand as a key driver for digital creative enterprises in China [
22]. Ding finds that policy and institutional factors heavily influence the locational decisions of creative firms in Shanghai [
36]. In the context of the digital economy, Chen and Liu emphasize the role of government policies and the digital landscape in promoting virtual clustering of creative industries [
37]. Studies in regions like the Guangdong–Hong Kong–Macao Greater Bay Area reveal both positive and negative effects of government intervention [
38]. Wang and Wang highlight how regional differences in industrial structure and economic diversity impact the spatial clustering of creative industries [
39]. Support from related industries is also influential, with external services, infrastructure, and cultural facilities being essential components, as shown in studies of Beijing’s clusters [
40].
Moreover, research within various sectors of the creative industry reveals distinct clustering patterns. Cruz and Teixeira point out that knowledge-intensive sectors such as “Advertising/Marketing” and “TV/Radio” tend to cluster in major urban areas rich in human capital, contrasting with traditional creative fields such as “Architecture” and “Crafts” [
41]. Zhang and Li observe a mix of concentration and parallel development trends in the film industry in China [
42], while the online video sector experiences notable growth in smaller cities and remote regions [
43]. Cultural creative industry parks in Shenzhen and Guangzhou demonstrate a core-periphery spatial pattern with clear hierarchical relationships among cities [
38].
Our study makes several contributions compared to previous research. Firstly, it utilizes data at a smaller geographical scale, specifically at the county level. Most studies on China’s creative industries have been based on national, provincial, or municipal data. However, the spatial agglomeration characteristics and locational factors of the creative industries exhibit significant spatial scale effects. The amplification of scale has a diluting effect on the degree of spatial agglomeration, and the agglomeration mechanisms at different scales vary. Secondly, the creative industries encompass a wide range of sectors, each with distinct agglomeration characteristics and influencing factors. An analysis conducted at the sector level provides a more precise depiction of the agglomeration characteristics and influencing factors of different sub-sectors. Lastly, our research findings are broadly consistent with previous studies, indicating that the creative industries are predominantly concentrated in major metropolitan areas and their surroundings, showing an overall pattern of more concentration in the east and less in the west. This overall regional imbalance in distribution is a key characteristic that distinguishes the distribution of China’s DCI from those in Europe and America.
Moreover, the locational factors of different sub-industries exhibit variations. The conclusions drawn from the sub-industry analysis allow for a deeper understanding compared to existing research. We find that for all DCIs, technological innovation, infrastructure, and the level of economic development are the most significant factors. Additionally, service-oriented DCIs are influenced by resource endowment (notably public cultural facilities and cultural resources) and government support. The importance of creativity in the services provided by these enterprises is paramount, making them more dependent on local cultural traits. These enterprises are generally smaller in scale and more susceptible to tax incentives and financial subsidies. Such businesses tend to settle in areas rich in cultural endowments and where government support policies are more readily available. In contrast, the distribution of digital creative equipment manufacturing industries is highly concentrated, due to transportation costs, and tends to cluster in regions closer to consumer markets and with well-developed supporting industries.
3. Data Sources and Processing
Based on the “Classification of Strategic Emerging Industries (2018)” released by the National Bureau of Statistics of China, the DCI is categorized into four sub-sectors: digital creative equipment manufacturing, digital creative activities, design services, and digital creativity and integration services.
Table A1 in
Appendix A provides a detailed classification of the DCI in China according to this document.
It Is noteworthy that the digital creative equipment manufacturing, a fundamental sector actively promoted by China, is related to the production of digital cultural content and services. Therefore, incorporating this industry within the statistical scope of the DCIs is logical. Furthermore, statistical results indicate significant geographical distribution differences between the digital creative equipment manufacturing industry and other sub-sectors of DCIs. This disparity is crucial for a comprehensive analysis of the overall distribution patterns of the DCI.
This paper utilizes the Aiqicha enterprise search platform to retrieve geographical location data for digital creative enterprises. Aiqicha, a subsidiary of Baidu, is one of the most commonly used commercial enterprise search and display platforms in China. Its data sources mainly include the National Enterprise Credit Information Publicity System, the China Execution Information Disclosure Network, the National Intellectual Property Administration, the Trademark Office, the Copyright Office, and the Ministry of Civil Affairs, among others.
During the query process, the names of 42 national economic industries were entered into the search bar, followed by filtering and removal of duplicate data. Ultimately, a total of 1,453,911 digital creative enterprise records were obtained. This includes 586,788 enterprises engaged in digital creative activities, 508,221 in digital creativity and integration services, 11,656 in digital creative equipment manufacturing, and 347,246 in design services. To ensure the accuracy and professionalism of the data, the final dataset was cross-referenced with enterprise information from the National Enterprise Credit Information Publicity System through a sample comparison.
Building on the county-level data of DCI, further analysis was conducted using ArcGIS 10.8 and SPSS 27. Spatial distribution patterns of the DCI were illustrated using kernel density maps, highlighting distribution differences among four sub-sectors of the DCIs, thus aiding in the study of locational factors. Principal Components Analysis (PCA) and multiple linear regression analysis were employed to explore the locational factors of sub-DCIs.
4. The Geographic Distribution of China’s DCI
4.1. General Distribution Characteristics of DCI
Overall, the spatial distribution of China’s DCI follows a “more in the east, less in the west” pattern, with enterprises predominantly concentrated in provincial capitals or economically developed major cities within provinces.
Figure 1 presents a kernel density map of the spatial distribution of digital creative enterprises across China. Regions in red indicate a higher concentration of these enterprises. As shown in the figure, the number of digital creative enterprises in eastern China significantly surpasses that in the central and western regions. This agglomeration pattern of China’s DCI closely aligns with the Hu Line (depicted as the black line in
Figure 1), which highlights a major West–East divide in China’s population distribution [
44]. The area to the east of the line accounts for 36% of the land and 94% of the population, while the area to the west covers 64% of the land but only 6% of the population. Given that population-dense regions tend to experience better economic development, higher education levels, and greater cultural dynamics, it is reasonable to expect that these regions would also serve as centers for creative industry clusters.
Beijing, Shanghai, and Guangzhou have emerged as major industrial agglomeration centers, with industry clusters forming in regions like the North China Plain, the Yangtze River Delta, and the Pearl River Delta. The concentration of creative industries in metropolitan areas aligns with empirical findings on the distribution of creative industries in several European countries [
6]. In the central and western regions, the DCI has not formed large-scale industrial agglomerations and is primarily concentrated in provincial capitals and other large cities. Cities such as Chengdu in Sichuan Province, Chongqing, and Xi’an in Shaanxi Province have developed small-scale industry clusters centered around their core urban areas. Compared to small and medium-sized cities, large cities possess stronger competitiveness due to better industrial infrastructure, economic levels, and policy incentives. The differences in industrial agglomeration between large and small cities offer valuable insights into the locational factors influencing the clustering of the DCI.
4.2. The Distribution Characteristics of the Four Sub-Sectors
The spatial distribution of the four sub-sectors of DCIs in China is characterized by a higher concentration in the eastern regions compared to the west, with notable variations in specific details. Understanding the distinctive distribution traits of the four sub-sectors can greatly enhance the exploration of the underlying reasons for enterprise location choices, which is crucial for comprehending and selecting locational factors.
Figure 2 illustrates the distribution of enterprise numbers within the four sub-sectors of China’s DCIs.
As illustrated in
Figure 2a, digital creative activities are primarily clustered in areas such as the North China Plain, the Yangtze River Delta, and the Pearl River Delta, exhibiting a multi-core distribution pattern. Among these, the Pearl River Delta region, centered on Guangzhou, has the highest concentration of this industry. Although the concentration in cities, such as Beijing and Shanghai, is slightly lower than that in Guangzhou, their radiative impact on neighboring cities is stronger. This significantly promotes the development of digital creative activities in the coastal areas of Eastern China.
Digital creativity and integration services enterprises are also primarily concentrated in major cities such as Beijing, Shanghai, and Guangzhou. Compared to the digital creative activities, this sector shows a stronger preference for clustering in Shanghai. As depicted in
Figure 2b, the number of enterprises engaged in digital creativity and integration services in Shanghai far exceeds that of other cities. Together with multiple locations in Jiangsu and Zhejiang, Shanghai forms a large-scale industrial cluster with a significant impact range.
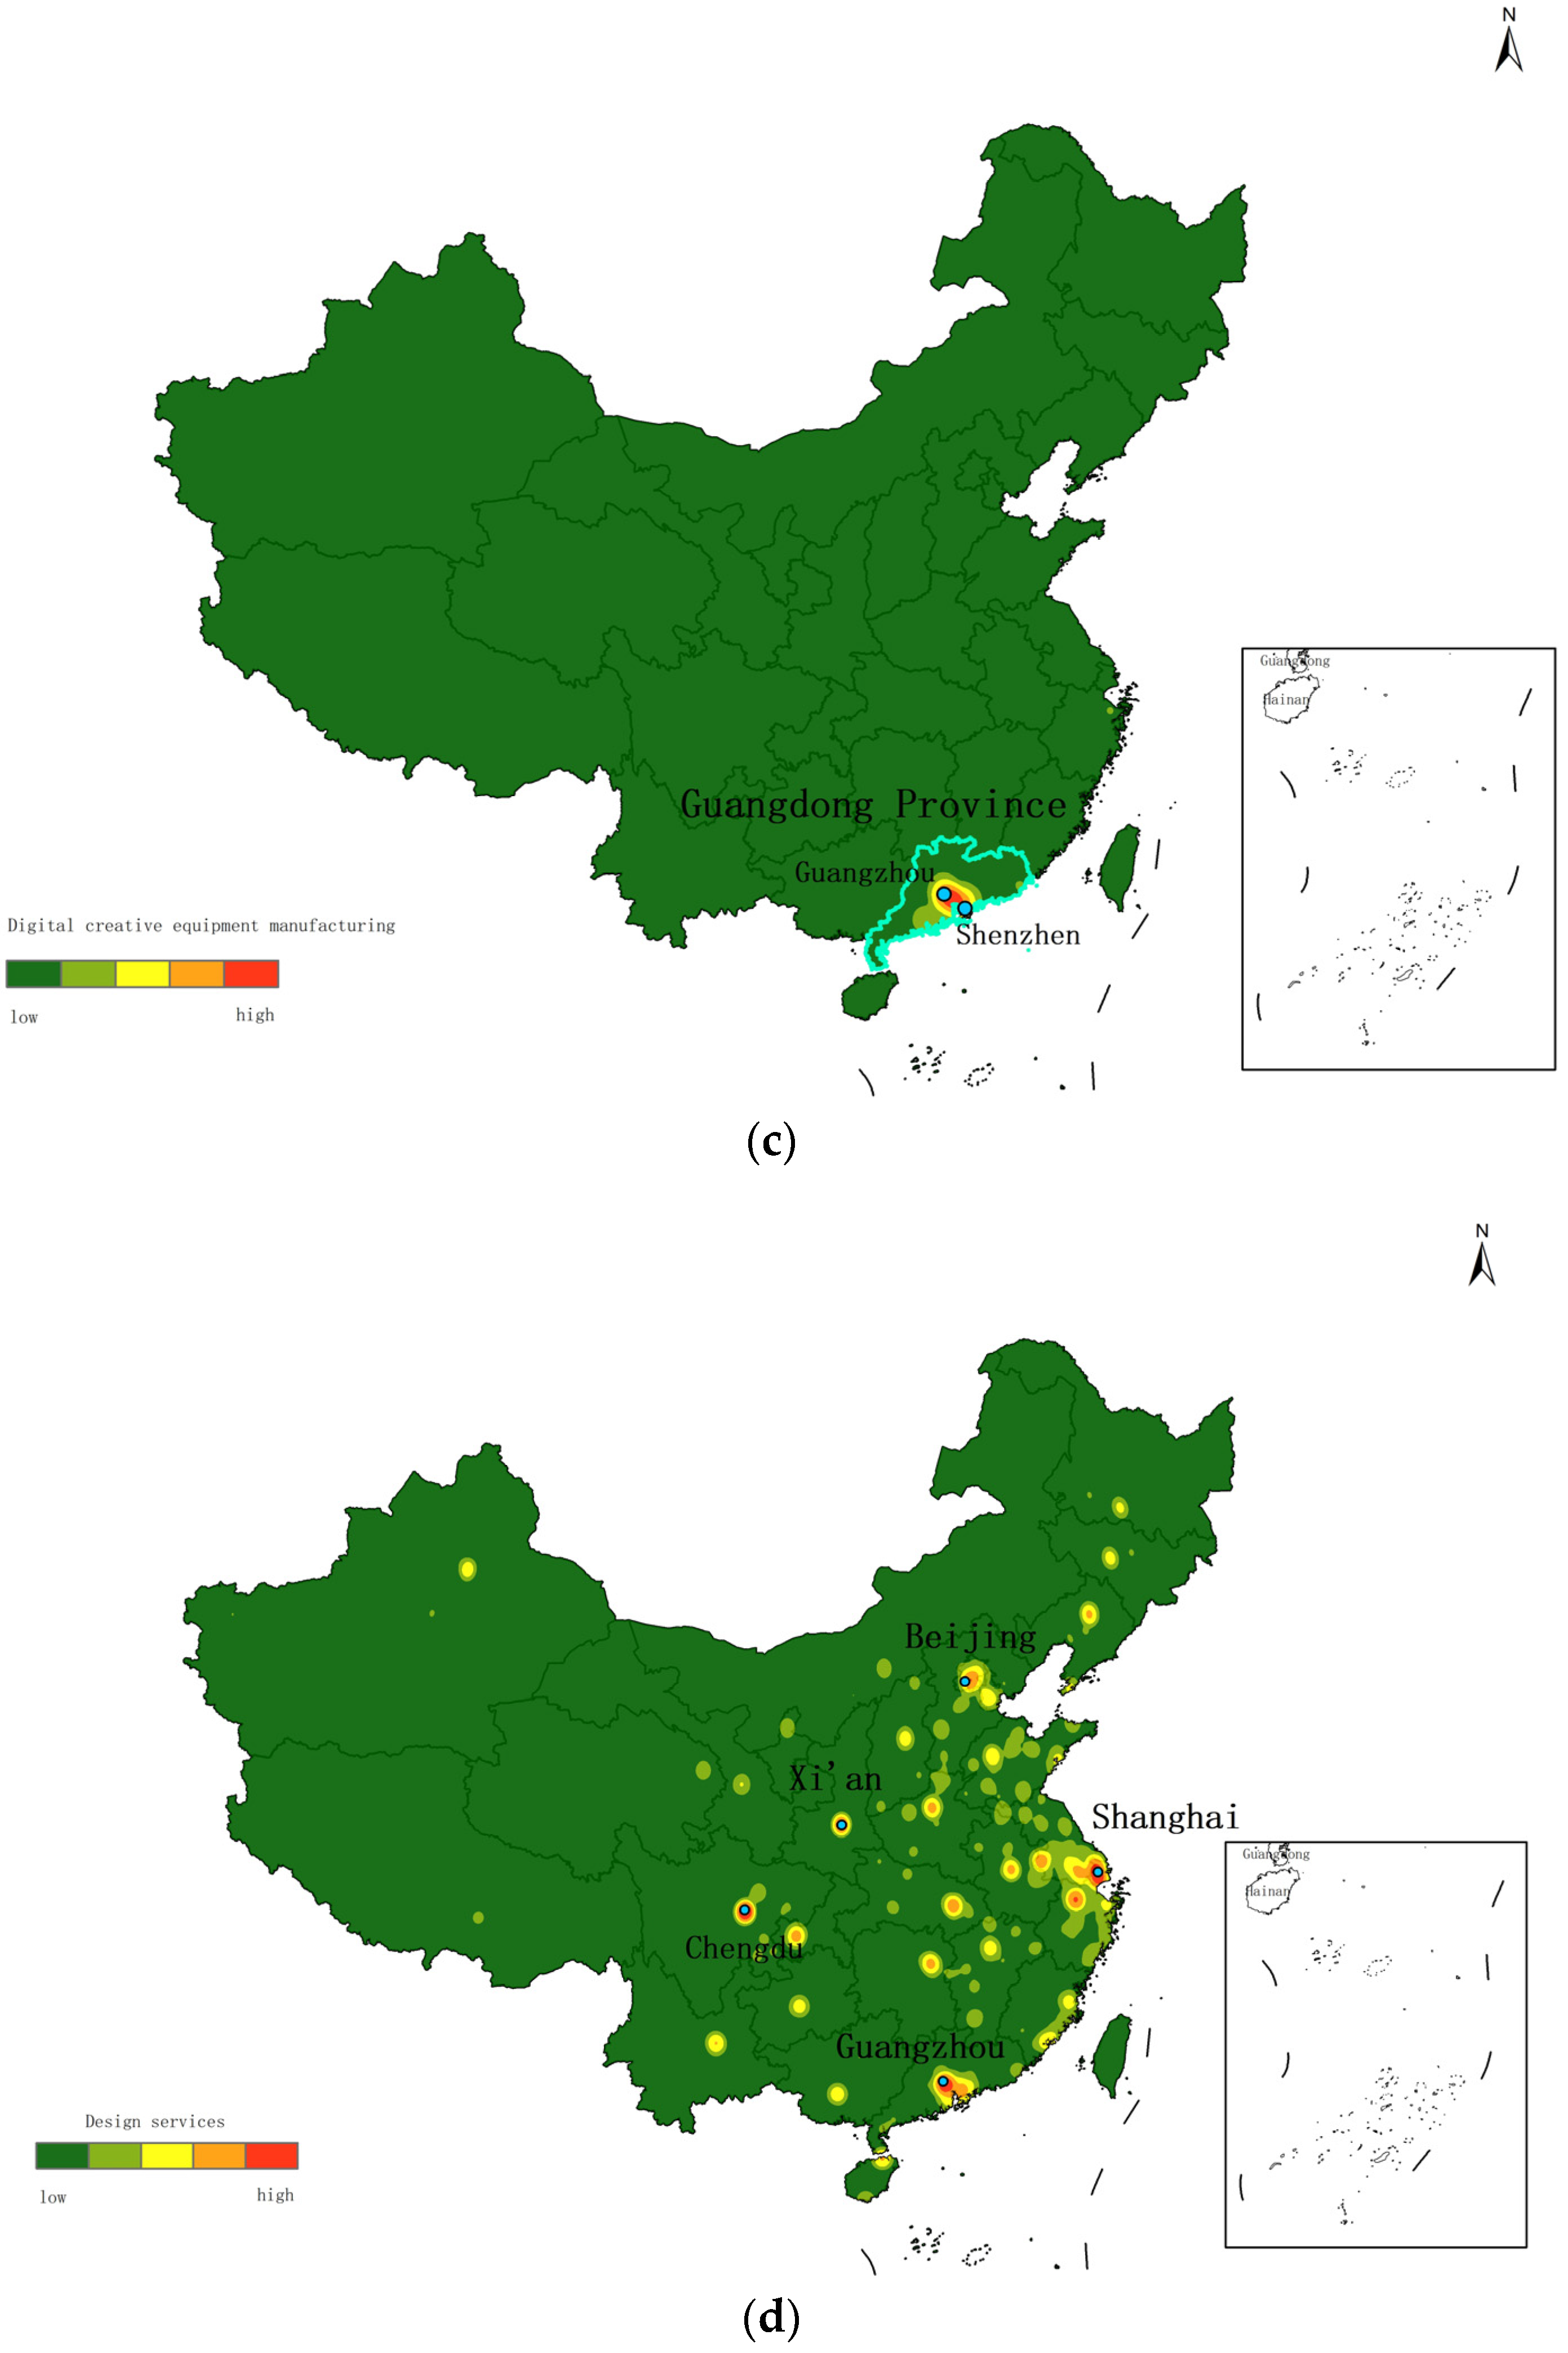
The digital creative equipment manufacturing enterprises exhibit a distinct single-core distribution. As shown in
Figure 2c, enterprises are predominantly located in Guangdong Province, with cities such as Guangzhou serving as central hubs, thereby forming a pronounced concentric structure. Within this framework, Guangzhou and Shenzhen act as dual-core engines that drive the development of digital creative equipment manufacturing. They continually foster the growth of DCI in surrounding cities within the province.
The design services enterprises also display characteristics of a multi-core distribution. As shown in
Figure 2d, the main industrial clusters include cities such as Beijing, Shanghai, Guangzhou, Chengdu, and Xi’an. It is noteworthy that the main clusters of the design services are relatively dispersed and do not form large-scale industrial agglomerations. Moreover, this industry exhibits a higher degree of clustering in the central and western regions of China compared to other sub-sectors, yet the influence range of clustering in individual cities is relatively limited.
Overall, the four sub-sectors of China’s DCIs each exhibit distinct spatial distribution characteristics, reflecting varying industry properties. This suggests that the locational factors of various sub-DCIs are unique and influenced by multiple factors. Therefore, the examination of locational factors for the DCI should commence with an understanding of the industry’s characteristics. A systematic summary of potential factors influencing industry agglomeration is required, followed by a separate investigation into the locational factors for different sub-sectors.
5. The Locational Factors of DCIs
5.1. Research Methodology and Data Processing
In researching the locational factors influencing the agglomeration of the DCI, methods such as Principal Components Analysis (PCA), Kaiser–Meyer–Olkin (KMO), Pearson correlation coefficient analysis, and multiple linear regression analysis are primarily employed. Building on existing research and considering the specific characteristics of the DCI, 19 indicators are selected and subjected to dimensionality reduction. The locational factors for the agglomeration of the four sub-sectors of DCIs are identified and analyzed for their distinct characteristics.
5.1.1. Selection of Locational Factors
After systematically reviewing existing studies on locational factors potentially related to the DCI [
8,
26,
33,
34] and integrating elements such as digital information technology and cultural creativity, 19 locational factors were ultimately selected. These factors encompass four areas: resource endowments, market demand, government policy, and related industries, as shown in
Table 1. The number of enterprises in the DCI serves as the dependent variable, while the standardized indices of locational factors are used as independent variables, with statistical processing conducted using SPSS 27.
This study selected seven representative provinces and cities—Beijing, Tianjin, Hebei, Shandong, Shanghai, Zhejiang, and Guangdong—for a comparative analysis. The selected regions represent the North China Plain, the Yangtze River Delta, and the Pearl River Delta. Data for each city and district were primarily sourced from the “2023 Beijing Statistical Yearbook”, “2023 Tianjin Statistical Yearbook”, “2023 Hebei Statistical Yearbook”, “2023 Shandong Statistical Yearbook”, “2023 Shanghai Statistical Yearbook”, “2023 Zhejiang Statistical Yearbook”, “2023 Guangzhou Statistical Yearbook”, the Chinese Intangible Cultural Heritage website, various city statistical yearbooks, and city government official websites. In the actual data survey, cities with missing data in the aforementioned provinces were excluded, resulting in a total of 44 cities participating in the survey.
5.1.2. Data Standardization
Significant scale differences exist among the raw data of the 19 locational factor indices. To ensure no impact on the subsequent analysis results, the Z-score normalization method is employed to standardize the raw data of these 19 locational factors. The computational formula is as follows:
In this formula, represents the initial data for each influencing factor, represents the mean, σ represents the variance, and represents the standardized value of each influencing factor. When the original sample data are less than the mean, the transformed standardized value is negative; when they are greater than the mean, the standardized value is positive.
5.1.3. Dimensionality Reduction in Locational Factors
Given that the 19 indicators may exhibit some intercorrelations, to ensure the scientific rigor of the study, it is proposed to employ the PCA method to reduce dimensionality and transform the existing indicators into linearly uncorrelated composite indicators. The KMO measure stands at 0.745, and the Bartlett’s test of sphericity shows a
p-value less than 0.001, as shown in
Table 2. The KMO test assesses the correlations and partial correlations among variables, with values ranging from 0 to 1; higher values, closer to 1, indicate stronger correlations and greater suitability for factor analysis,. Bartlett’s test of sphericity is used to verify if the sample data conform to a multivariate normal distribution. The results indicate that the data are suitable for principal component analysis.
Through principal component analysis, the eigenvalues and variance contributions of the principal components were obtained. Based on the criterion of eigenvalues greater than 1, three common components were extracted, denoted as , , . Their corresponding eigenvalues are 12.121, 2.506, and 1.292, respectively. The variance contribution rates of these three principal components are 63.796%, 13.192%, and 6.799%, totaling 83.787%. Since the cumulative contribution exceeds 80% and the eigenvalues of the three components are all greater than 1, it can be concluded that there is minimal data loss from the original indicators, making the principal component analysis highly ideal and significant for research.
5.1.4. Extraction of Principal Components
There are varying degrees of correlation among the 19 indicators with components
,
, and
, as shown in
Table 3. Based on the extent of these correlations, the 19 indicators are classified into specific categories as detailed in the table below:
The first principal component () includes resource endowments such as cultural resources, public infrastructure, human resources, and government expenditure. These factors are all, to varying degrees, related to government investment and support. Thus, we have named “Resource Endowment and Government Support”. The second component () mainly includes factors related to technological innovation, such as the population with university education and the number of patents, as well as GDP, which reflects the level of local economic development. This component is named “Technological Innovation and Economic Development”. The third component () includes factors that influence consumption potential and market size, including per capita disposable income, per capita consumer spending, and the proportion of urban population to the total permanent population. It also includes factors related to industries such as wholesale and retail, finance, and transportation. This component is named “Consumption and Industry Support”.
When conducting PCA using SPSS, the software automatically generates the score coefficient matrix for each component. Each coefficient in the matrix reflects the loading of each indicator on the corresponding component, representing the correlation between each component and its factors. Using the score coefficient matrix, the scores for each component can be calculated for each city, using the following equations. For transparency and reproducibility, the detailed score coefficients for all 19 locational indicators are provided in
Appendix A.
In Equations (1)–(3), the coefficients are derived from the score coefficient matrix, while
to
represent the standardized values of the 19 indicators in
Table 1. The scores for the three components across 44 cities are provided in
Table A3 in
Appendix A.
The 44 cities exhibit varying levels of development in three aspects, with the degree of development indicated by scores. A higher score denotes a higher level of development in that aspect. For instance, Beijing rates highest in terms of , indicating a robust industrial base in “transportation, culture, and policies” support. Conversely, Shijiazhuang in Hebei Province is notably more advanced in .
As shown in the
Table 4, the 44 cities exhibit varying scores for
,
, and
. Higher scores indicate that a city has a more favorable development status in that particular component, demonstrating a competitive advantage. For example, Beijing ranks first in
among all cities, indicating that the city holds a significant advantage in “Resource Endowment and Government Support”. Additionally,
has the highest score among the three components, suggesting that Beijing’s advantage is most prominent in “Resource Endowment and Government Support” compared to technological innovation and market demand.
5.2. Analysis of Locational Factors for Four Sub-Sectors of DCIs
The spatial agglomeration of the four sub-sectors within DCIs exhibits distinct characteristics, indicating that the factors influencing the locational factors of different types of enterprises vary. By analyzing enterprise data from 44 cities, with the number of enterprises in each sub-sector treated as dependent variables and , , and as independent variables, the locational factors of each sub-sector can be determined through Pearson correlation coefficient analysis and multiple linear regression analysis.
The Pearson correlation coefficient is a statistical measure that reflects the degree of linear relationship between two variables, ranging from −1 to 1. The formula is expressed as follows:
where
and
represent the
ith observation of variables
and
,
and
are their respective means, and
is the total number of observations. This coefficient provides a preliminary assessment of the linear association between the number of digital creative enterprises and the locational factors derived through principal component analysis.
5.2.1. Digital Creative Activities
A Pearson correlation coefficient analysis between the number of enterprises engaged in “digital creative activities” and the components of
,
and
are performed. The results are displayed in
Table 5:
It can be observed that there is a highly significant positive correlation between the number of enterprises engaged in digital creative activities and components
and
. No correlation exists with
. Regression analysis was conducted on the factors with significant correlations, yielding the following regression equation:
As shown in
Table 6, the component
has the greatest impact on digital creative activities. For every 1 unit increase in
, the number of enterprises increases by 0.471 units. Similarly, a 1 unit increase in
results in an increase of 0.266 units in the number of enterprises.
Multiple linear regression analysis further confirms that the samples pass the independence test and meet the assumptions for multiple regression. Firstly, the variance inflation factor (VIF) is 1 (as seen in
Table 6), which is below the threshold of 5, indicating that there is no multicollinearity in the regression equation. Secondly, according to
Table 7, the R
2 value is 0.642, demonstrating that the independent variables can explain 64.2% of the variance in the dependent variable, which is significantly higher than the standard threshold of 30%. Additionally, the Durbin–Watson statistic is 2.192, close to 2, essentially passing the test for independence of the samples.
5.2.2. Digital Creativity and Integration Services
A Pearson correlation coefficient analysis between the number of digital creativity and integration services and the components of
,
and
was performed. The results are displayed in
Table 8:
It can be observed that there is a significant positive correlation between the number of enterprises engaged in digital creativity and integration services and the components of
and
. No correlation exists with
. Regression analysis was conducted on the factors with significant correlations, yielding the following regression equation:
As shown in
Table 9, the component
has the greatest impact on digital creativity and integration services. For every 1 unit increase in this factor, the number of enterprises increases by 0.522 units. The other significant impact comes from
, where a 1 unit increase results in an increase of 0.430 units in the number of enterprises.
Multiple linear regression analysis further confirms that the existing samples pass the independence test and meet the assumptions for multiple regression. Firstly, the variance inflation factor (VIF) is 1 (as seen in
Table 9), which is below the threshold of 5, indicating that there is no multicollinearity in the regression equation. Secondly, according to
Table 10, the R
2 value is 0.766, demonstrating that the independent variables can explain 76.6% of the variance in the dependent variable, which is significantly higher than the standard threshold of 30%. Additionally, the Durbin–Watson statistic is 1.877, close to 2, essentially passing the test for independence of the samples.
5.2.3. Digital Creative Equipment Manufacturing
Table 11 displays the results of the Pearson Correlation Coefficient analysis between digital creative equipment manufacturing and the three principal components.
It can be observed that there is a significant positive correlation between the number of enterprises engaged in digital creative equipment manufacturing and
and
. No correlation exists with
. Regression analysis was conducted on the components with significance, yielding the following regression equation:
As shown in
Table 12, the component
has the greatest impact on the digital creative equipment manufacturing. For every 1 unit increase in this component, the number of enterprises increases by 0.026 units. The next significant impact comes from
, where a 1 unit increase results in an increase of 0.017 units in the number of enterprises.
Multiple linear regression analysis further confirms that the existing samples pass the independence test and meet the assumptions for multiple regression. Firstly, the variance inflation factor (VIF) is 1 (as seen in
Table 12), which is below the threshold of 5, indicating that there is no multicollinearity in the regression equation. Secondly, according to
Table 13, the R
2 value is 0.340, demonstrating that the independent variables can explain 34.0% of the variance in the dependent variable, which is higher than the standard threshold of 30%. Additionally, the Durbin–Watson statistic is 2.385, close to 2, essentially passing the test for independence of the samples.
5.2.4. Design Services
A Pearson correlation coefficient analysis between the number of enterprises engaged in “design services” and the three components was conducted. The results are displayed in
Table 14:
It can be observed that there is a significant positive correlation between the number of enterprises engaged in design services and the components of
and
with
p < 0.001, and
with
p < 0.05. Regression analysis was conducted on the components with significance, yielding the following regression equation:
As shown in
Table 15,
has the greatest impact on the design services. For every 1 unit increase in this factor, the number of enterprises increases by 0.287 units. The next significant impact comes from
, where a 1 unit increase results in an increase of 0.217 units in the number of enterprises. Lastly,
also influences design services. An increase of 1 unit in this factor results in a rise of 0.152 units in the number of enterprises.
Multiple linear regression analysis further confirms that the existing samples pass the independence test and meet the assumptions for multiple regression. Firstly, the variance inflation factor (VIF) is 1 (as seen in
Table 16), which is below the threshold of 5, indicating that there is no multicollinearity in the regression equation. Secondly, according to
Table 16, the R
2 value is 0.872, demonstrating that the independent variables can explain 87.2% of the variance in the dependent variable, which is significantly higher than the standard threshold of 30%. Additionally, the Durbin–Watson statistic is 1729, close to 2, essentially passing the test for independence of the samples.
6. Discussion
Through the correlation analysis of the four DCI sub-sectors, it is evident that the locational factors of different sub-industries exhibit both similarities and distinct differences. Analyzing the locational factors of DCIs will aid in understanding the distribution characteristics and location preferences of various sub-industries, thereby promoting the coordinated development of the DCI.
6.1. Technological Innovation and Economic Development: Key Drivers of DCI Clustering
Component plays a leading role in the clustering of the four sub-sectors of DCIs. Within , the indicator of (Population with University Education) and (Number of Patents) directly reflects the level of technological innovation of a region, while the regional GDP directly determines the level of economic development. The Number of Museums is often correlated with the level of economic development and can, to some extent, reflect the cultural resource endowment of the region. The combination of these factors significantly influences all four sub-industries of DCIs, and their impact is stronger than that of and .
Undoubtedly, regions with a high level of technological innovation are more likely to attract DC. Firstly, the growth in DCI requires robust support from digital technology. Digital creative products are characterized by production digitization, network-based distribution, and online consumption spaces. The processes of production, transmission, and sales in digital creative industries are primarily dependent on advanced digital technologies. This characteristic could lead digital creative enterprises to favor locations with lower production costs (e.g., rent), relying on the internet to acquire production factors and distribute products. For example, Scott suggests that advances in information technology may drive industries to disperse to peripheral regions [
45]. However, our findings indicate that, rather than prioritizing cost reduction, digital creative enterprises prefer to establish themselves in areas with higher technological capabilities. This strategic choice not only provides access to digital technology support services but also benefits from positive externalities arising from knowledge spillovers. This conclusion aligns with the findings of Audretsch and Feldman, which highlighted that knowledge spillovers drive the clustering of economic activities [
46].
A strong reserve of high-quality talent (as indicated by
) is a major factor in attracting digital creative enterprises to specific locations. Creativity is the cornerstone of the DCI, primarily driven by talented individuals. A sufficient pool of talent ensures the technological renewal of products, imbues products with sustained vitality, and maintains a competitive edge. Regarding product content, high-quality talent not only provides technological support for the DCI but also contributes creative ideas for cultural content. Digital creative enterprises tend to establish themselves in areas where high-level talent is concentrated. This facilitates the exchange of information within the creative industry and ensures the industry’s continued innovation. This conclusion is consistent with the findings of Pratt, who emphasized that for knowledge-intensive industries like the creative sector, face-to-face communication among workers is essential [
25]. The positive externalities generated by such interactions cannot be easily replaced by the dispersion effects of information technology.
The level of local economic development (as indicated by ) plays a significant role in DCIs’ location choices. Higher GDP corresponds to higher incomes and stronger purchasing power, thereby expanding the market size for digital creative products. Furthermore, regions with higher GDP often have a more contractually sound business environment, a more inclusive social atmosphere, and an open cultural milieu, all of which favor the growth of the DCI. This is exemplified by the geographical distribution of China’s DCI, which is primarily concentrated in the eastern regions, especially the Beijing–Tianjin–Hebei area, the Yangtze River Delta, and the Pearl River Delta. These regions offer a more mature business environment and a more open social atmosphere that foster the development of the DCI.
6.2. Resources Endowment and Government Support: Driving Service-Oriented DCIs
The agglomeration of service-oriented DCIs, particularly digital creativity and integration services as well as design services, is significantly influenced by resource endowment and government support. Most service-oriented digital creative enterprises are relatively small in scale and significantly influenced by local cultural resources, public facilities, human resources, and government fiscal policies.
Despite the increasing reliance on digital technologies during production, dissemination, and sales phases in DCIs, traditional locational factors like (Total Road Length) remain vital. Better transportation infrastructure enhances communication and inter-regional cooperation, facilitating enterprise participation in various industry activities such as conferences, forums, and exhibitions, thereby promoting mutually beneficial symbiosis among DCIs. Additionally, accessible transportation attracts more potential customers for local consumption and experiences, enabling enterprises to gain deeper insights into consumer needs and offer more sophisticated services.
Cultural resource endowments, encompassing both tangible and intangible cultural resources (as indicated by , , ), provide the creative impetus for digital creative products and services. Many digital creative activities are concentrated in or around cultural heritage sites, scenic areas, and public facilities, through developing services with local cultural traits. Digital creativity and integration services, such as exhibitions, tourism, libraries, and museums, heavily depend on public cultural facilities. In regions rich in public cultural facilities, integration services and creative activities are more developed. Furthermore, service-oriented digital creative industries are labor-intensive, and human resource endowment (as indicated by ) has a significant positive correlation with the spatial distribution of these industries.
Fiscal expenditure and other forms of government support play a significant and direct role in the development of service-oriented DCIs. In China, given that the DCI is a key emerging industry supported by the state, relevant industrial development policies have been enacted, alongside essential financial support, such as government transfer payments and tax incentives. For example, since 2012, Shanghai has annually allocated fiscal funds to promote cultural and creative projects, and in 2021, the Ministry of Finance issued the “Administrative Measures for Special Funds for Cultural Industry Development,” which outlined specific methods for subsidizing cultural creative projects (This special fund primarily supports cultural and creative industries, including performing arts, publishing and distribution, copyright trade, film and television production and transactions, animation and online game, and trade, advertising and exhibitions, antiques and artwork trading, design and creativity, and cultural tourism. The focus of support is on creative projects with development potential, strategic significance, independent innovation, and intellectual property rights.
https://czj.beijing.gov.cn/zwxx/tztg/201912/t20191206_889022.html. accessed on 20 May 2025). These policies enhance the agglomeration of DCIs, particularly for small and medium-sized enterprises, not only by providing financial support but also by guiding the flow of various resources into the creative industry. The positive orientation of government policies towards the DCI helps to create a relatively stable industrial environment and reduces non-economic risks for digital creative enterprises. Furthermore, regional industrial policies help clarify local industry positioning and promote the level and scale of industrial clustering, thus influencing the locational choices of industries engaged in digital creativity and integration services.
6.3. Consumption and Related Industrial Support: Drivers of Digital Creative Equipment Manufacturing
The regression results show that significantly influences the industry of digital creative equipment manufacturing. Firstly, there exists a notable distinction in production characteristics and product forms between digital creative equipment manufacturing and the other three DCIs, which mainly produce services and digital content products. Digital content products benefit from digital transmission technologies, allowing them to be distributed at low transportation costs due to minimal physical distance requirements between production sites and consumer markets. In contrast, digital creative equipment manufacturing involves substantial physical transportation costs, making proximity to consumer markets critical. Consequently, regions with higher consumer spending and disposable income (as indicated by and ), which indicate stronger purchasing power, are preferred for setting up production facilities to facilitate local consumption of these products.
Secondly, digital creative equipment manufacturing tends to cluster in regions with strong support from related industries (as indicated by , and ) and a higher level of urbanization (as indicated by ). The wholesale and retail sectors enhance market prosperity by providing a comprehensive sales service system and a secure market environment. Meanwhile, Transportation, Storage, and Postal Services are instrumental in improving logistical efficiency, reducing transportation costs, expanding sales markets, and fostering supply chain collaboration. For example, a well-developed warehousing industry helps expand the market by ensuring the timely delivery of products, thereby improving service quality and customer loyalty.
Furthermore, the financial sector plays a crucial role in supporting DCIs not only through financial backing but also by facilitating efficient financial services. The digital transformation in the finance sector promotes timely and transparent services, which enable industry operators to swiftly adapt to market dynamics, target markets more precisely, and enhance product innovation. The advent of online trading platforms and internet payment methods has also significantly boosted the sales volumes in the digital creative equipment manufacturing industry, demonstrating the essential role of digital finance in modern industrial growth.
6.4. Design Services: The Triple Confluence of Factors
The spatial distribution of the design services is the most dispersed among the four sub-sectors of DCIs and is the only one simultaneously influenced by three components. Similar to other DCIs, (Technological Innovation and Economic Development) has the greatest influence on the agglomeration of design services, followed by (Resource Endowment and Government Support) and finally, (Consumption and Related Industrial Support).
Specifically, regions with better resource endowment and government support tend to attract creative services. The richness of cultural resources, for example, significantly impacts the quality of cultural design content. The unique cultural traits of different regions provide designers with diverse creative inspirations, facilitating the creation of design products and services with local features, thus enhancing brand recognition. Additionally, policy support plays a universally guiding role in the development of DCIs, steering the agglomeration of design services toward certain regions through tax incentives, government transfers, and other measures.
has the least impact on the agglomeration of design services compared to and however, it still exerts a significant positive influence. This is primarily because design services are largely demand-driven, requiring designers to maintain close communication with clients to meet personalized needs. Proximity to consumers facilitates face-to-face interactions, which are crucial for promoting effective communication and collaboration. In the context of product iteration and market competition, market demand becomes a critical factor in determining the locational choices of design service enterprises. In other words, regions with higher consumption potential (as indicated by and ) tend to have a greater concentration of digital creative enterprises.
7. Conclusions
This article employs kernel density distribution maps, principal component analysis, Pearson correlation coefficient analysis, and multiple linear regression analysis to examine the spatial structure and locational factors of the DCI in China. The study reveals a terraced concentration pattern that diminishes from east to west, closely aligning with the Hu Line.
Sub-sector analysis shows that while all DCIs follow the east-to-west thinning trend, they exhibit distinct spatial features. Digital creative activities flourish predominantly within the North China Plain, the Yangtze River Delta, and the Pearl River Delta, creating distinct regional clusters. Digital creativity and integration services firms favor the economically thriving megacities, resulting in a multi-core distribution landscape. Digital creative equipment manufacturing is highly centralized, with a pronounced presence in Guangdong that steps down in influence outwardly. The design services demonstrate a more dispersed spatial footprint across major cities.
Although factors like technological innovation, a well-educated population, and economic development influence all sub-sectors, specific locational preferences vary. Service-oriented sub-sectors, such as digital creative activities and integration services, are additionally shaped by cultural resource endowments and government support policies. Creative equipment manufacturing is significantly impacted by market demand and related industry support, while design services are influenced by a broader range of factors, including technology innovation, cultural resource endowment, human resources, government policy, and consumption.
Our study offers a valuable explanation for the uneven spatial distribution of China’s digital creative industries, with many of the influencing factors being more prevalent in the eastern regions, particularly in large cities and their surrounding areas. Despite certain limitations, such as challenges in data acquisition, the principal component and regression analyses were conducted using data from 44 cities, the majority of which are located in eastern China. Furthermore, our analysis primarily relies on enterprise data from Aiqicha, which may have limitations in capturing informal or emerging creative enterprises. Although there are potential data limitations and biases, the variation in the number of enterprises across selected cities and the diverse values of indicators suggest that our conclusions remain objective and provide a comprehensive depiction of the factors shaping the DCI in China. While informal creative activities are not accounted for in our statistical analysis, their proportion in the overall commercial activity of DCI is minimal, and thus, the conclusions drawn still hold significant explanatory power.
Future research could focus on two directions: (1) compiling panel data on the number of digital creative enterprises across all cities (districts) in China and employing spatial econometrics to quantitatively analyze the impacts of specific factors on the spatial distribution of sub-industries and the dynamic evolution of the creative industry; (2) conducting qualitative case studies of successful DCI hubs and exploring emerging trends such as remote work and virtual clustering in creative industries.
Based on our findings, we propose several policy recommendations for fostering balanced DCI growth, especially in underdeveloped regions. Given the significant impacts of technological innovation, support policies, resource endowment, and related industry support to Chinese DCI, the government can focus on the following areas. Firstly, local government can increase targeted investments in digital infrastructure, such as high-speed internet and cloud computing services. This can bridge the digital divide between developed and underdeveloped regions and enable creative enterprises in less-developed areas to access the same technological tools and resources as those in major urban centers.
Secondly, local governments could offer incentives, such as tax breaks, housing subsidies, or funding for creative projects, for skilled professionals to move to underdeveloped areas to mitigate the talent gap between eastern and western regions. Additionally, improving higher education institutions and vocational training programs in the digital creative fields could help cultivate local talent pools in these regions. This recommendation is consistent with emerging evidence from European contexts. For instance, Maddah and Arauzo-Carod find that in rural Catalonia, specialization in cultural and creative industries is positively associated with employment growth, highlighting the potential of locally adapted creative economy strategies outside metropolitan cores [
47].
Thirdly, governments can provide financial support, including direct subsidies and tax incentives, as well as simplified regulatory processes for service-oriented digital creative enterprises. This support could also take the form of incubators, co-working spaces, and industry-specific research parks that promote collaboration among local firms. Governments can also emphasize the integration of creative industries with digital technology through policy frameworks, subsidies, and grants that support digital content production, cultural exchange, and innovation. Special attention should be given to facilitating collaboration between the cultural and tech industries.


