To develop the proposed MUDS, the feature engineering and machine learning algorithms were implemented using the Pandas [
34], Scikit-learn [
35], and XGBoost [
36] libraries in Python, while the hyperparameter optimization (HPO) methods were implemented using Optuna [
37] and extending the Skopt [
38] and Hyperopt [
39] libraries. The source code of our project is available at:
https://github.com/yunduannnn/Malicious-URL-Detection-System (accessed on 23 October 2024). The experiments were carried out on a Dell Precision 3660 Tower machine with an i9-12900 central processing unit (CPU) (12 core, 2.40 GHz) and 64 gigabytes (GB) of memory, representing a server machine for model training and a vehicle-level machine for model testing, respectively.
The experimental study is structured as follows. In
Section 5.1, we present the results of a comprehensive statistical analysis, demonstrating that our feature engineering for this dataset has been well designed and is effective. In
Section 5.2, we evaluate the performance of the known-MUDS when tested with known malicious URLs (MURLs).
Section 5.2.2 examines the robustness of the known-MUDS against simulated unknown MURLs, analyzing how well the system performs under these conditions. In
Section 5.3, we investigate the performance of the proposed unknown-MUDS, specifically designed to address unknown MURLs. Additionally, we compare the proposed unknown-MUDS, which incorporates CL_K-means and biased classifiers, against a binary classifier specifically designed to tackle unknown MURLs.
5.1. Statistical Analysis of URL-Based Features
In the following, we present the results of a comprehensive statistical analysis, demonstrating that the proposed feature engineering for this MURL dataset has been well designed and is effective.
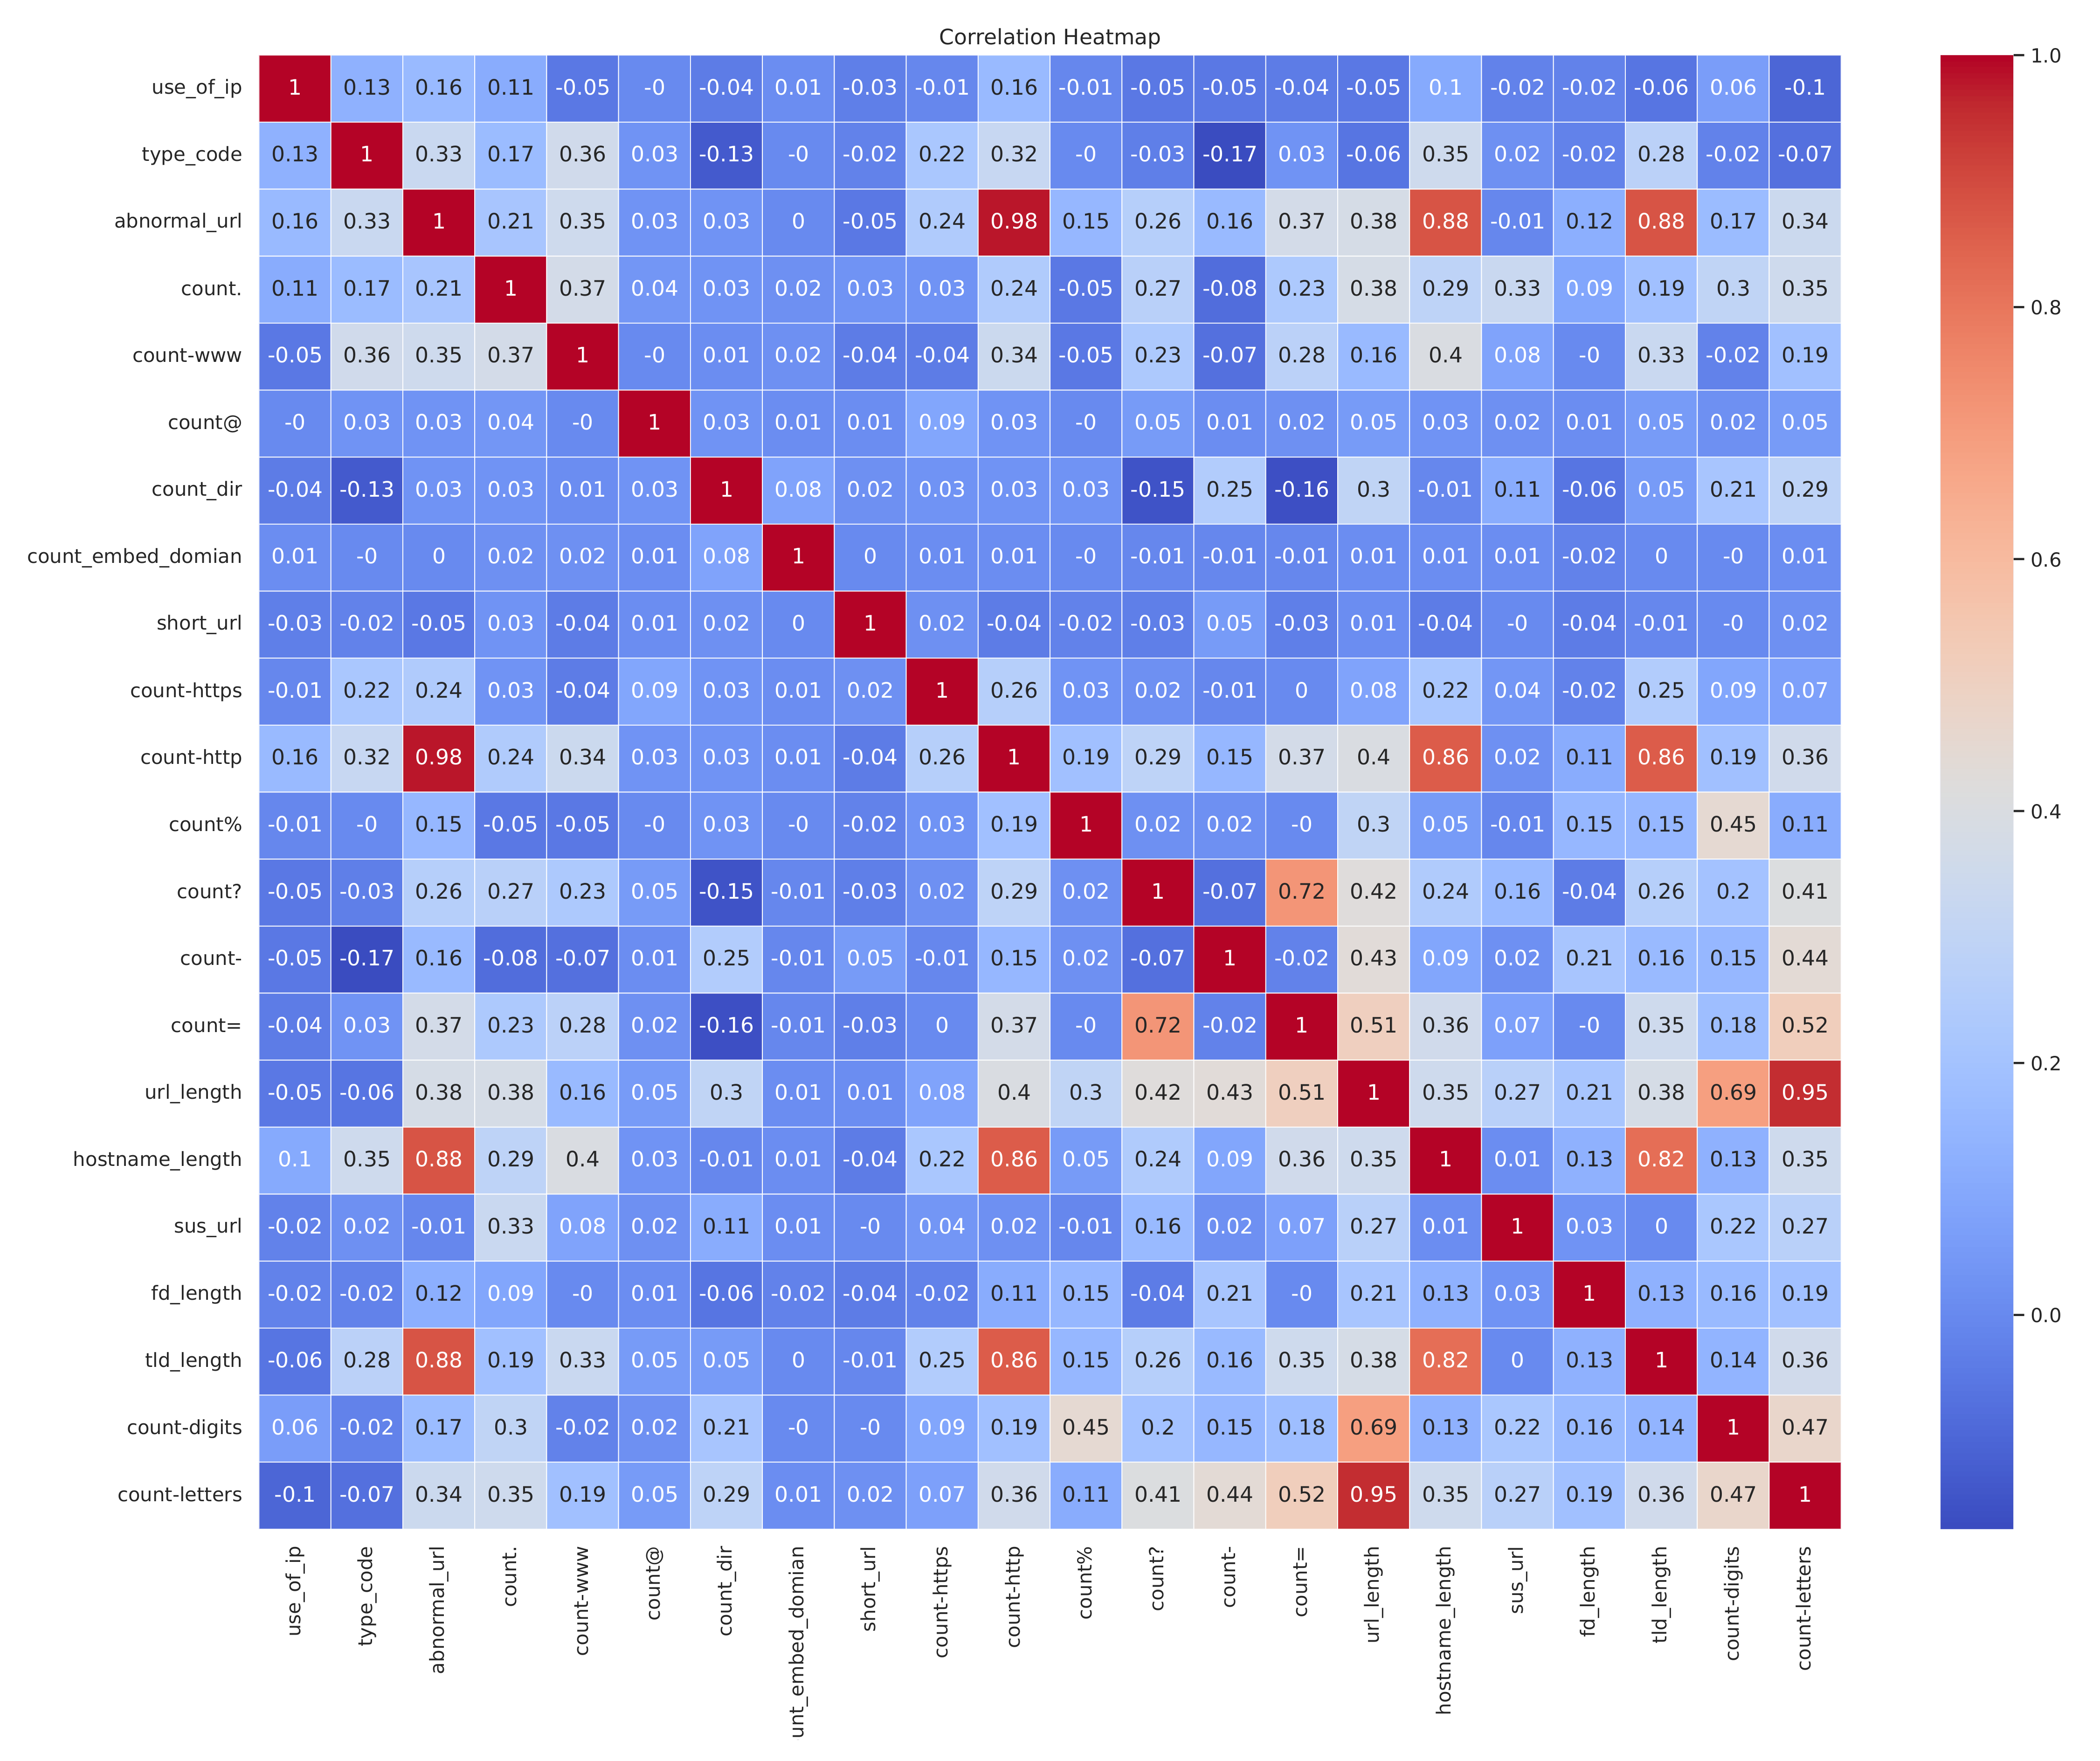
Following the systematic application of feature construction and selection methodologies, 21 features were obtained and are delineated in
Figure 5 and
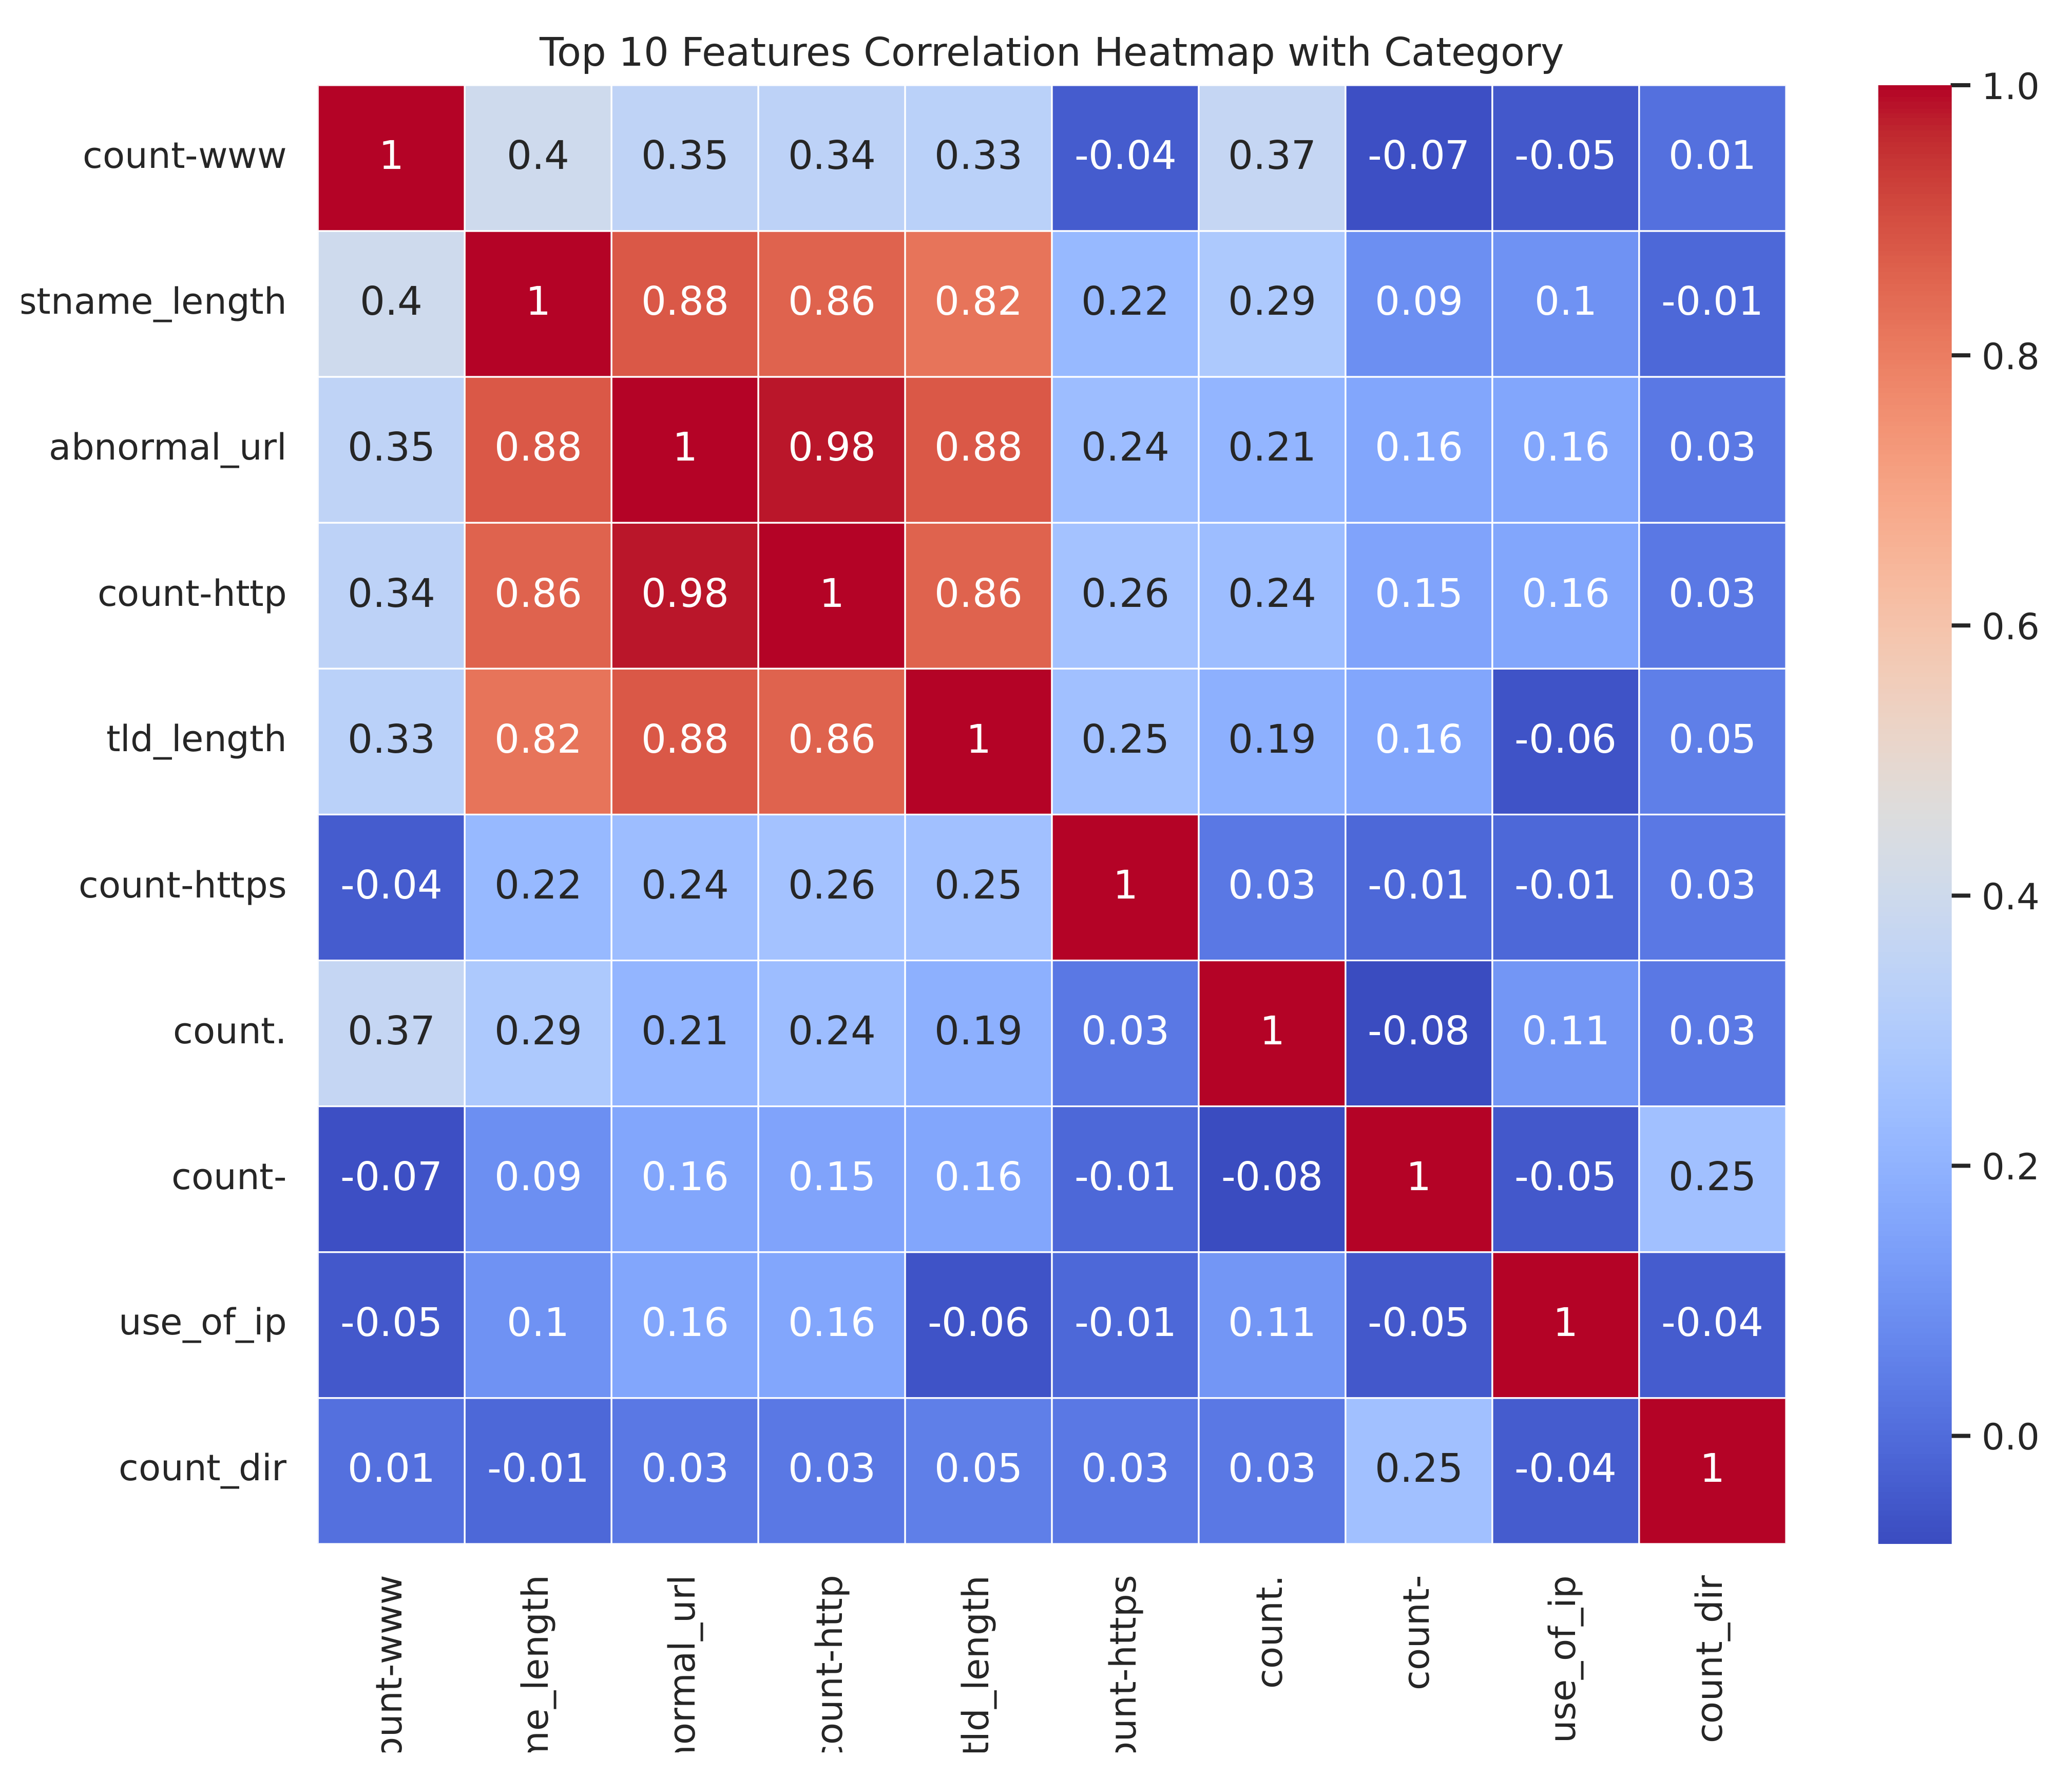
Figure 6.
Figure 5 illustrates the correlations between all features.
Figure 6 illustrates the top ten features correlated with the category.
There are several strong positive correlations (shown in dark red) between variables, such as:
“abnormal_url” and “count-http”;
“abnormal_url” and “tld_length”;
“abnormal_url” and “hostname_length”;
“count_http” and “hostname_length”;
“hostname_length” and “tld_length”.
There are also some weak or negative correlations (shown in blue/green) between certain variables, indicating little relationship or an inverse relationship.
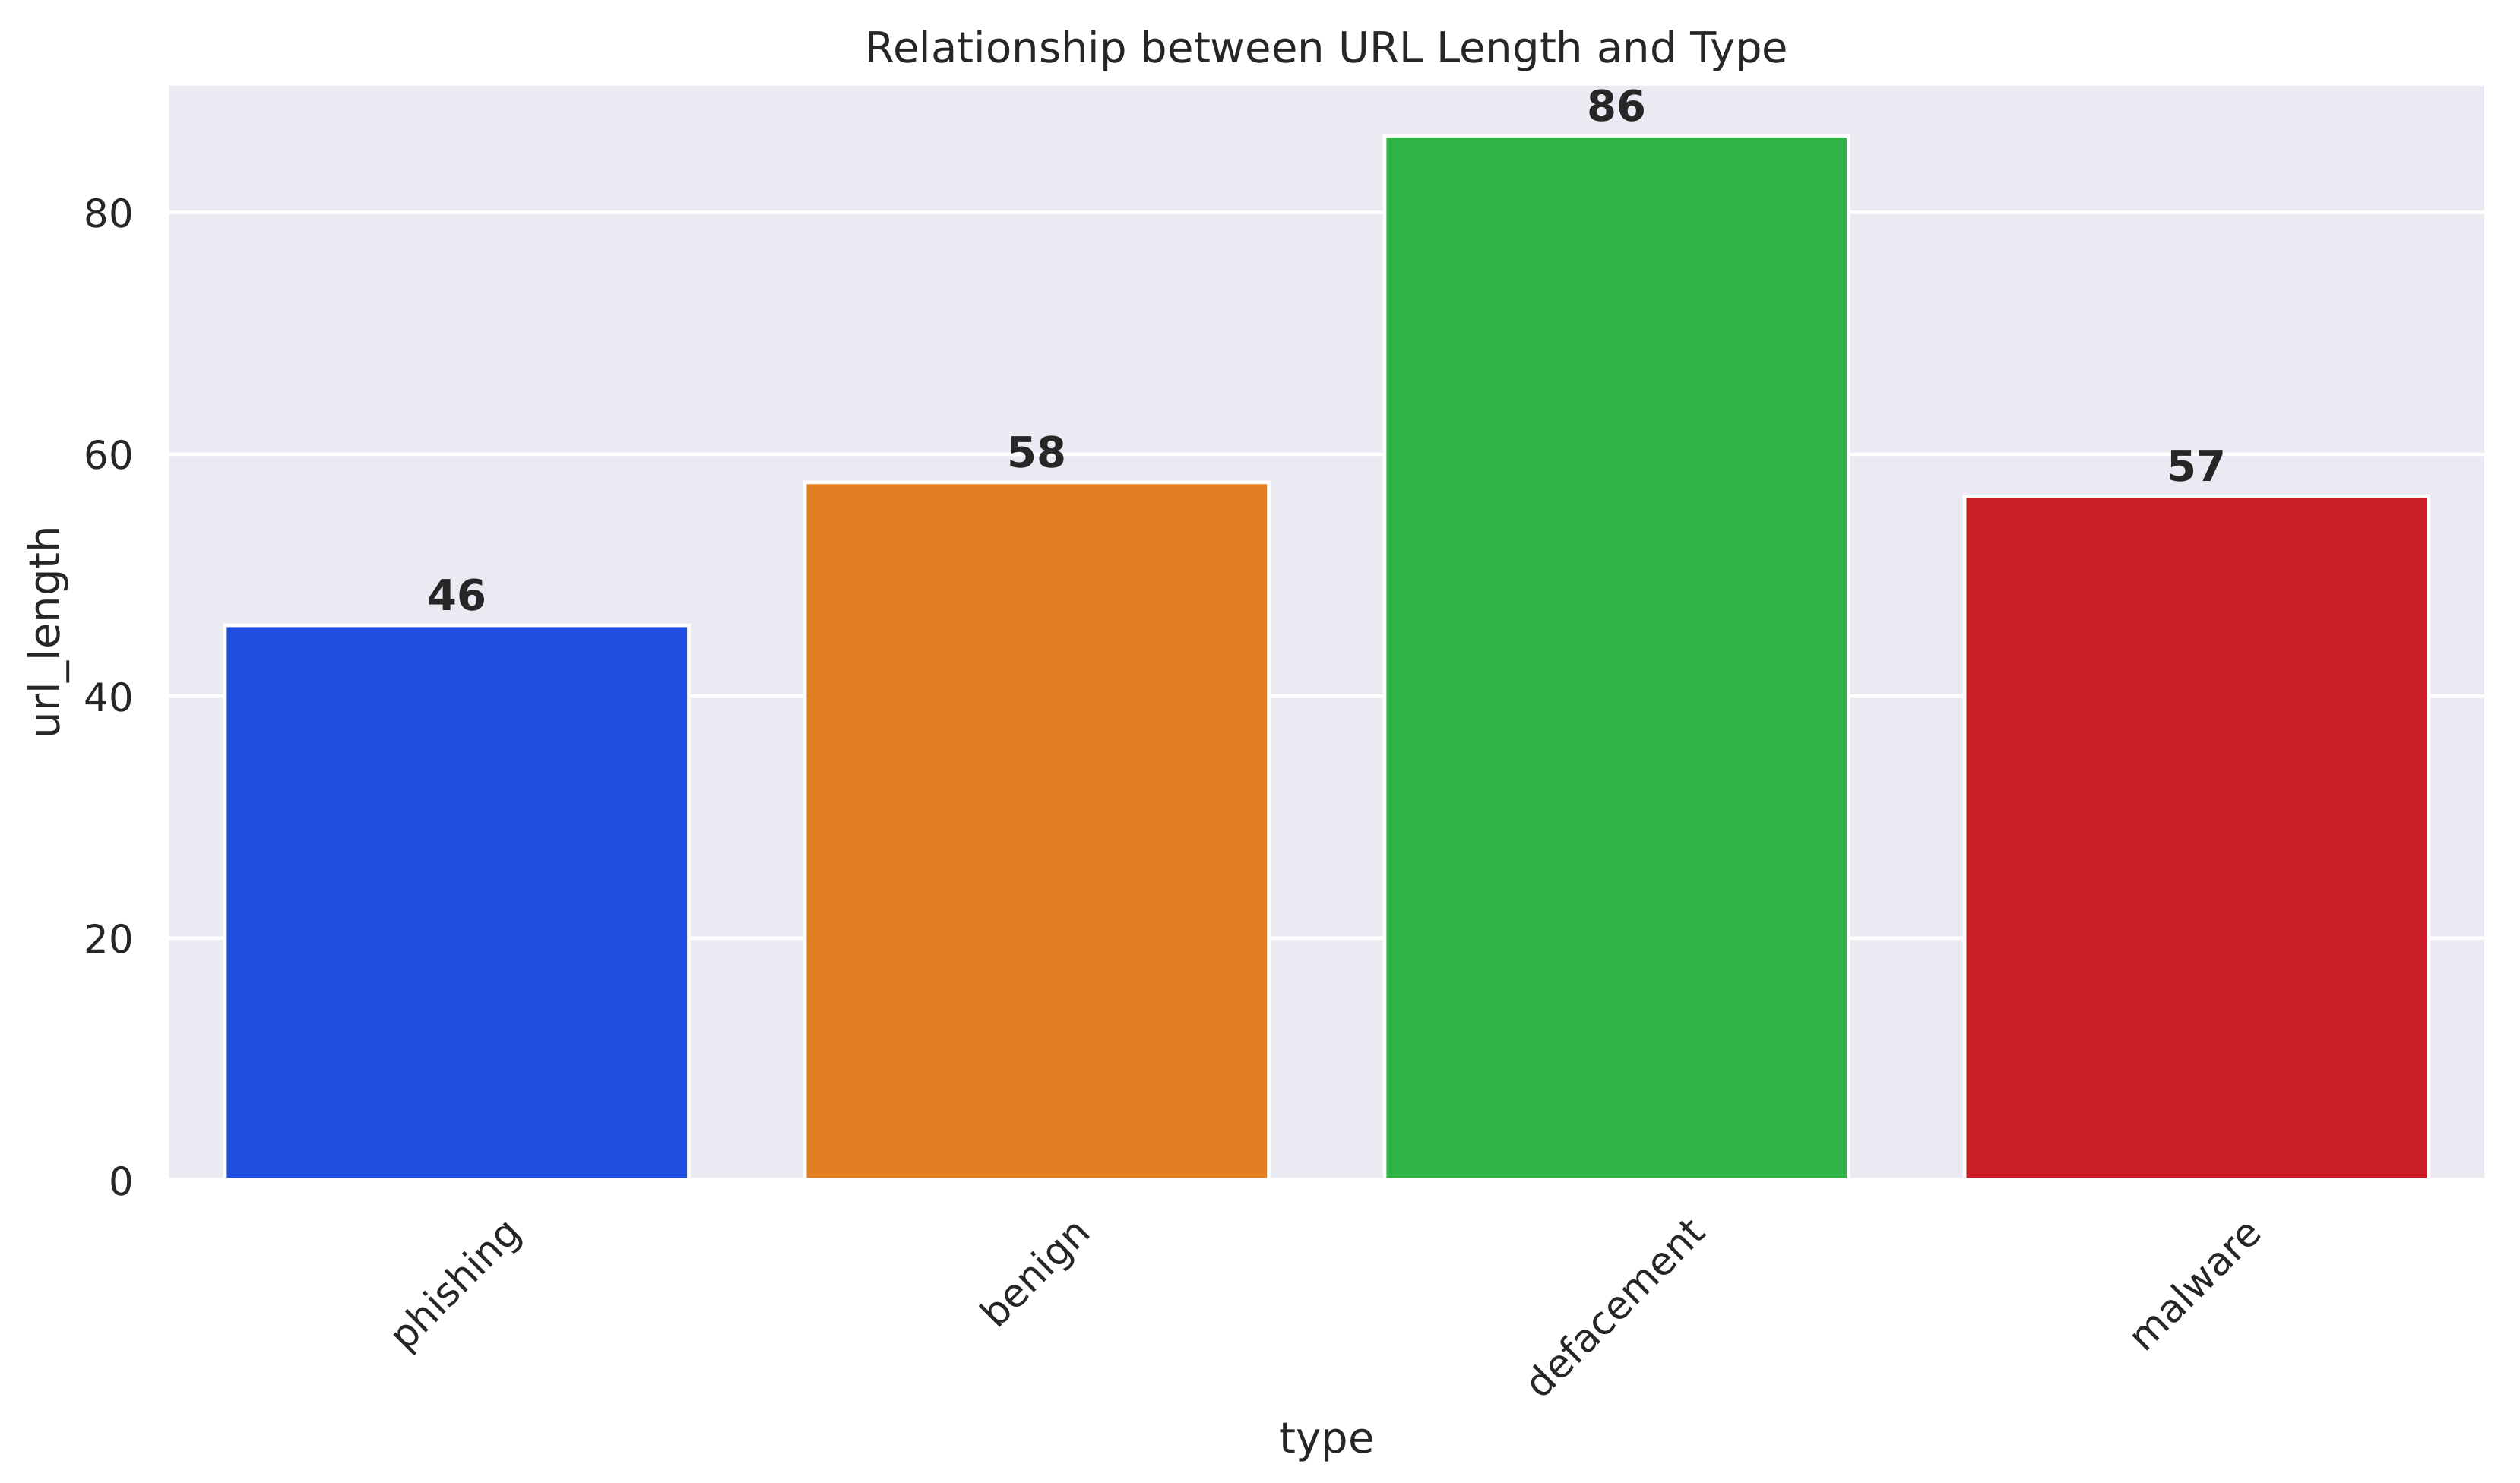
Figure 7 depicts the relationship between URL length and URL type, which can be classified as phishing, benign, defacement, or malware.
Figure 7 indicates that the average URL length for phishing URLs is 46 characters. The average URL length for benign URLs is 58 characters; the average URL length for defacement URLs is 86 characters; and the average URL length for malware URLs is 57 characters.
From these data, we can observe the following.
Defacement URLs have the longest average URL length at 86 characters. Phishing URLs have the shortest average URL length at 46 characters. Benign URLs and malware URLs have similar average URL lengths, around 57-58 characters. The positive correlation between longer average URL lengths and MURL types indicates that this feature could be valuable for the MUDS framework. By incorporating the average URL length as a feature, the model may better differentiate between benign and MURLs, potentially improving the overall classification performance.
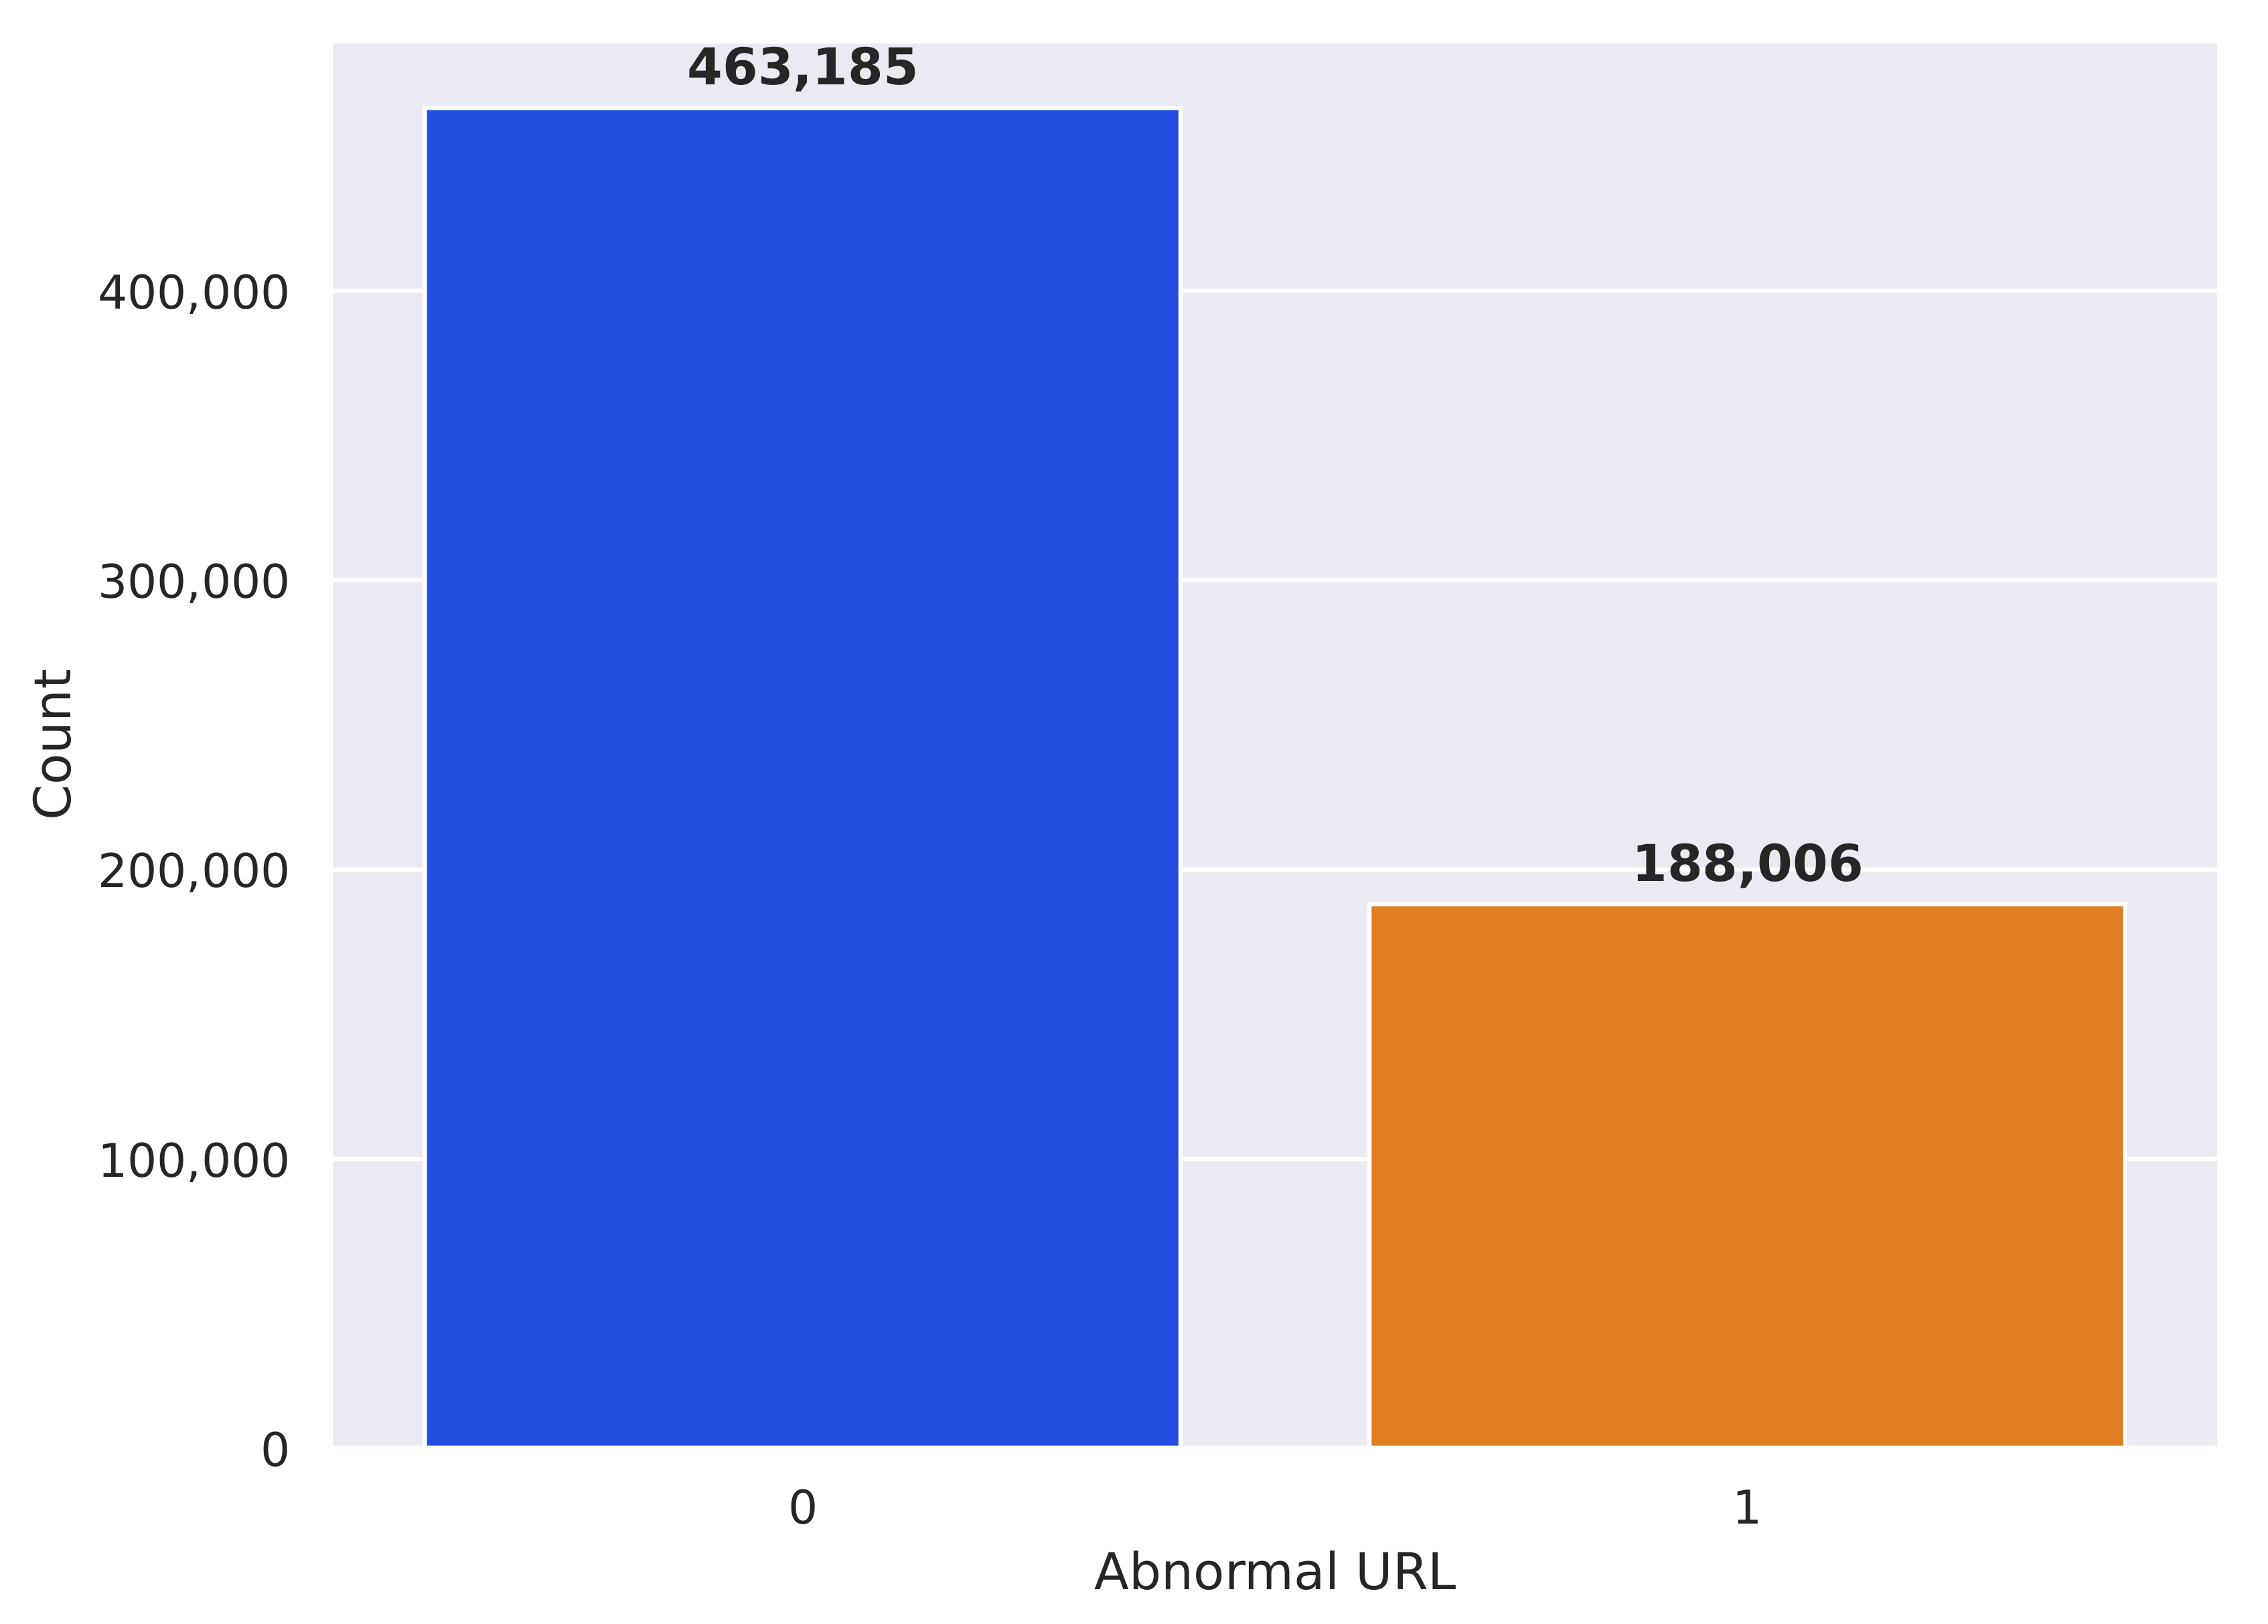
Based on
Figure 8, the following analysis can be provided. The bar graph in
Figure 8 displays the frequency distribution of abnormal URLs and normal URLs. The blue bar represents a significantly higher count of 463,185 for “normal URL” compared to the orange bar of 188,006 for “abnormal URL”. This indicates that the dataset contains a predominant proportion of abnormal URLs relative to normal URLs.
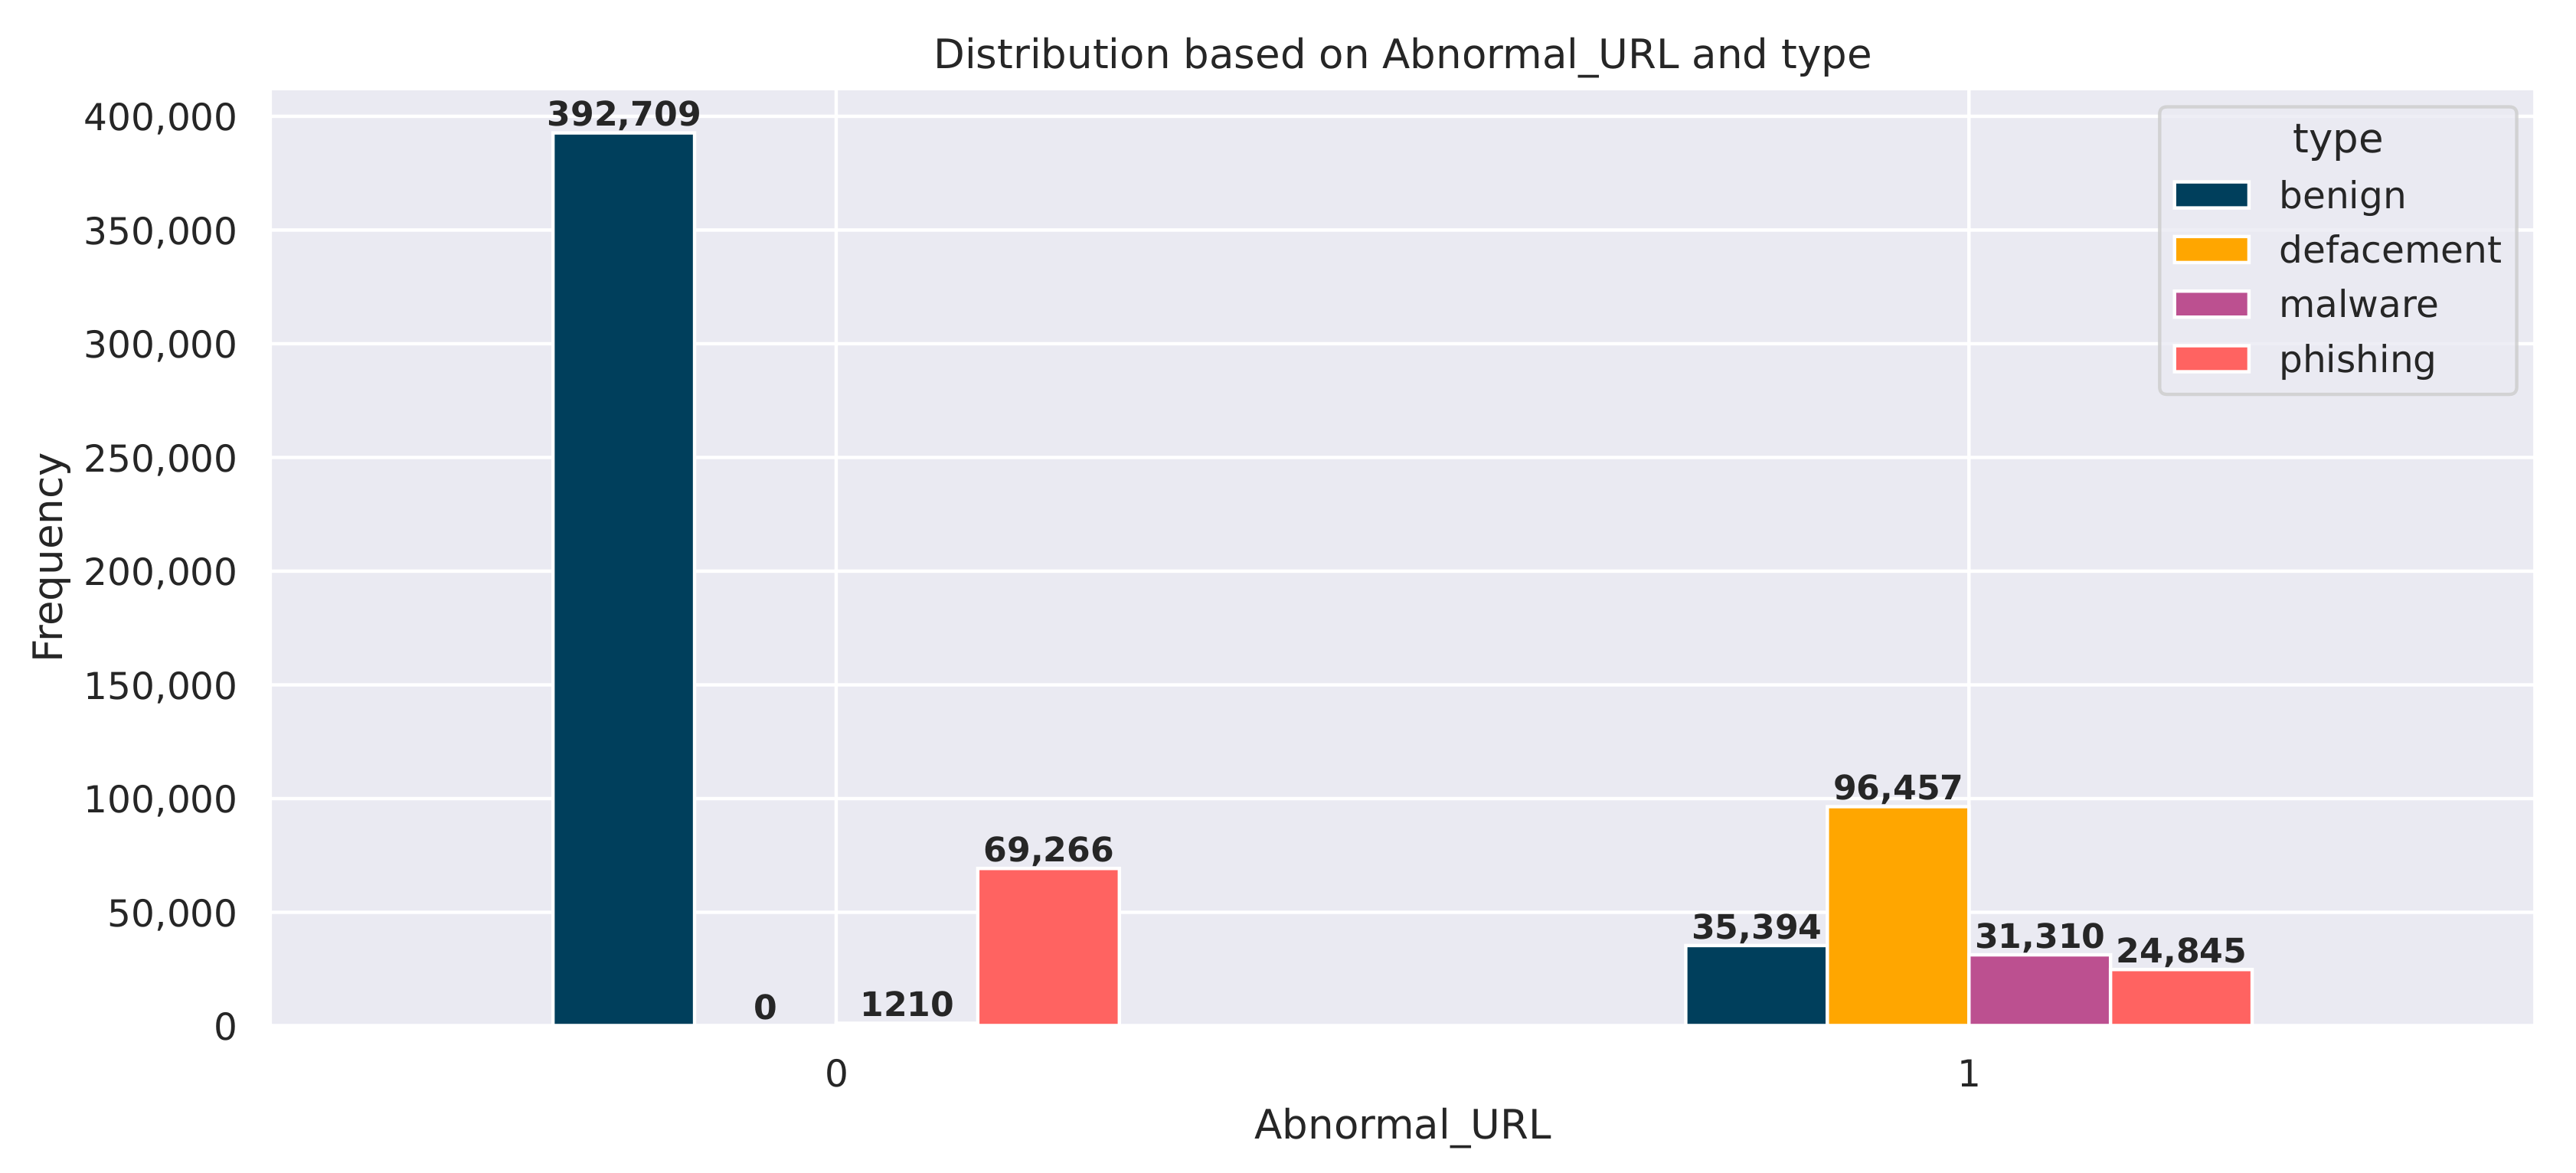
Figure 9 presents the distribution of URLs based on their classification as “Abnormal_URL” and their associated “types” (benign, defacement, malware, phishing). The graph illustrates the frequency counts for each category. The data reveal that the majority of URLs are classified as “Abnormal_URL”, with a frequency count of 392,709. This indicates that the dataset under study contains a significant proportion of abnormal URLs. Further examining the breakdown of the “Abnormal_URL” category, the graph shows that the most prevalent type is “defacement” with a frequency of 96,457, followed by “malware” with 31,310 and “phishing” with 24,845. This distribution highlights the diverse nature of the abnormal URLs within the dataset. This information can be valuable for understanding the characteristics and composition of the abnormal URLs present in the dataset, which may have implications for MURL detection and classification.
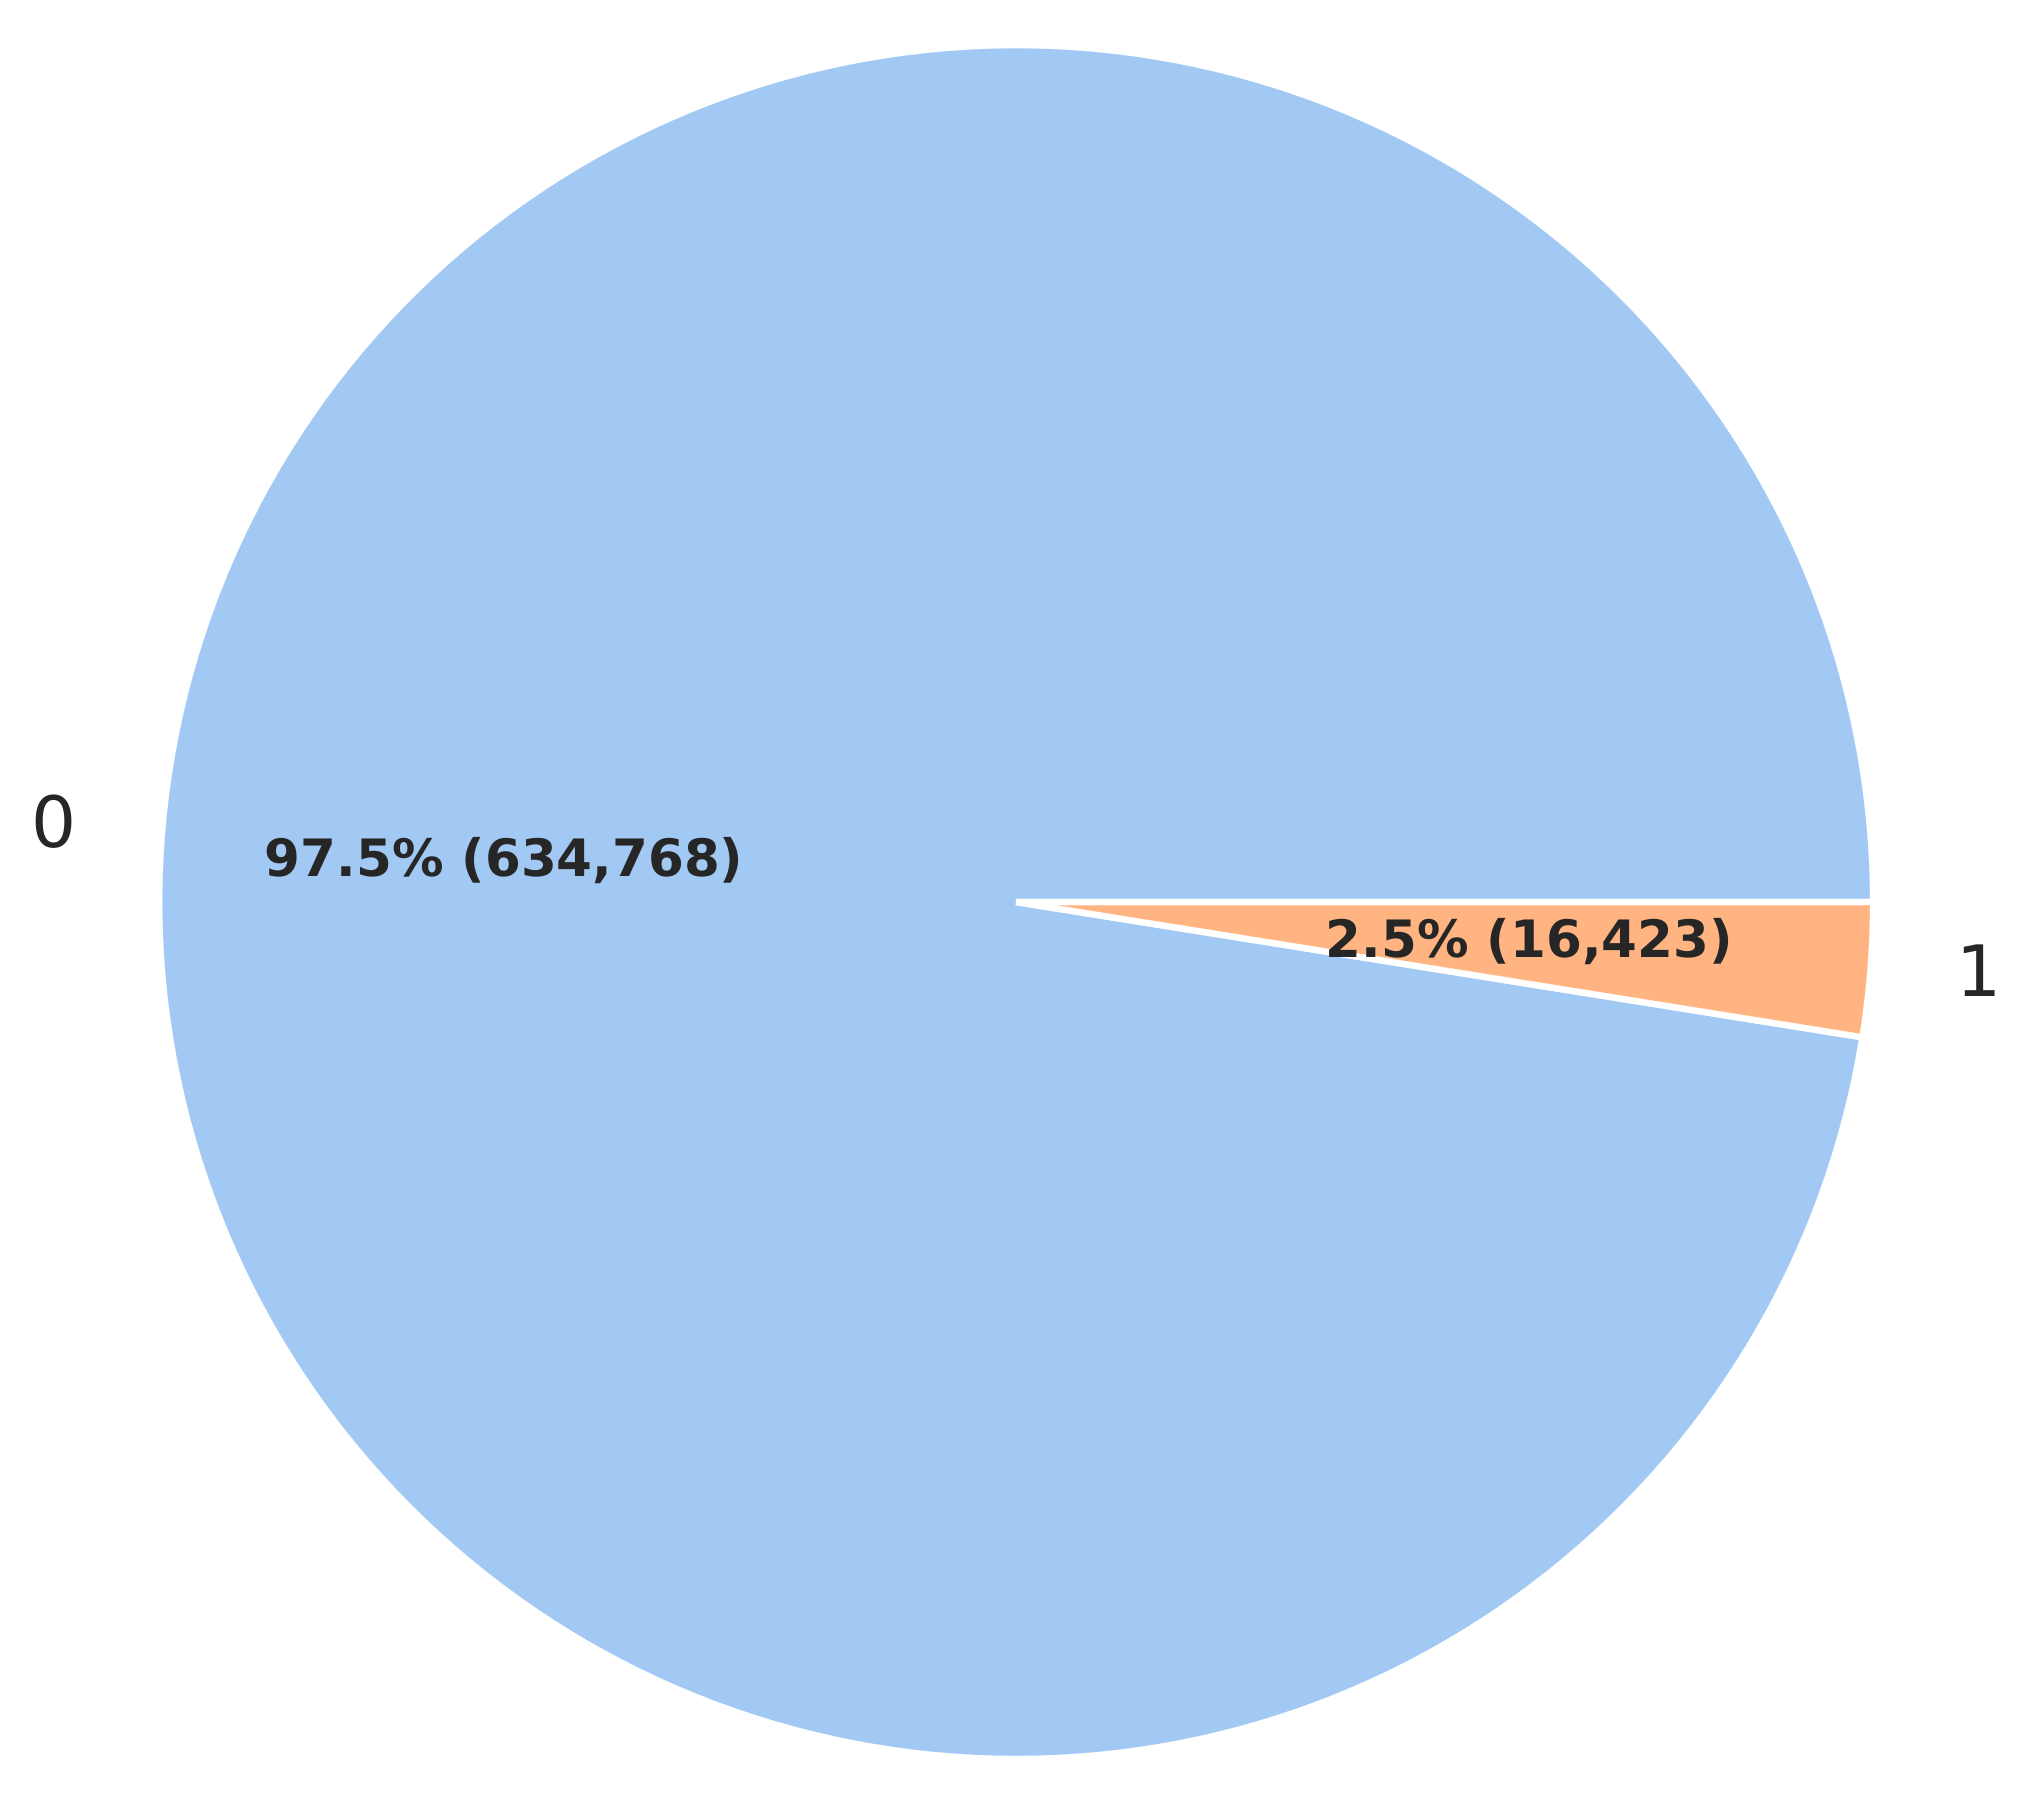
Figure 10 presents the distribution of HTTPS usage within the dataset. The graph displays two distinct categories: HTTPS usage and non-HTTPS usage. The data reveal that most URLs, approximately 97.5% (634,768), utilize HTTPS for communication. In contrast, only a small portion, approximately 2.5% (16,423), of the URLs do not use HTTPS. This suggests that the dataset is predominantly composed of URLs that prioritize secure communication through the adoption of the HTTPS protocol. The high prevalence of HTTPS usage among the URLs in the dataset is noteworthy and aligns with the broader industry trend towards increased adoption of secure protocols.
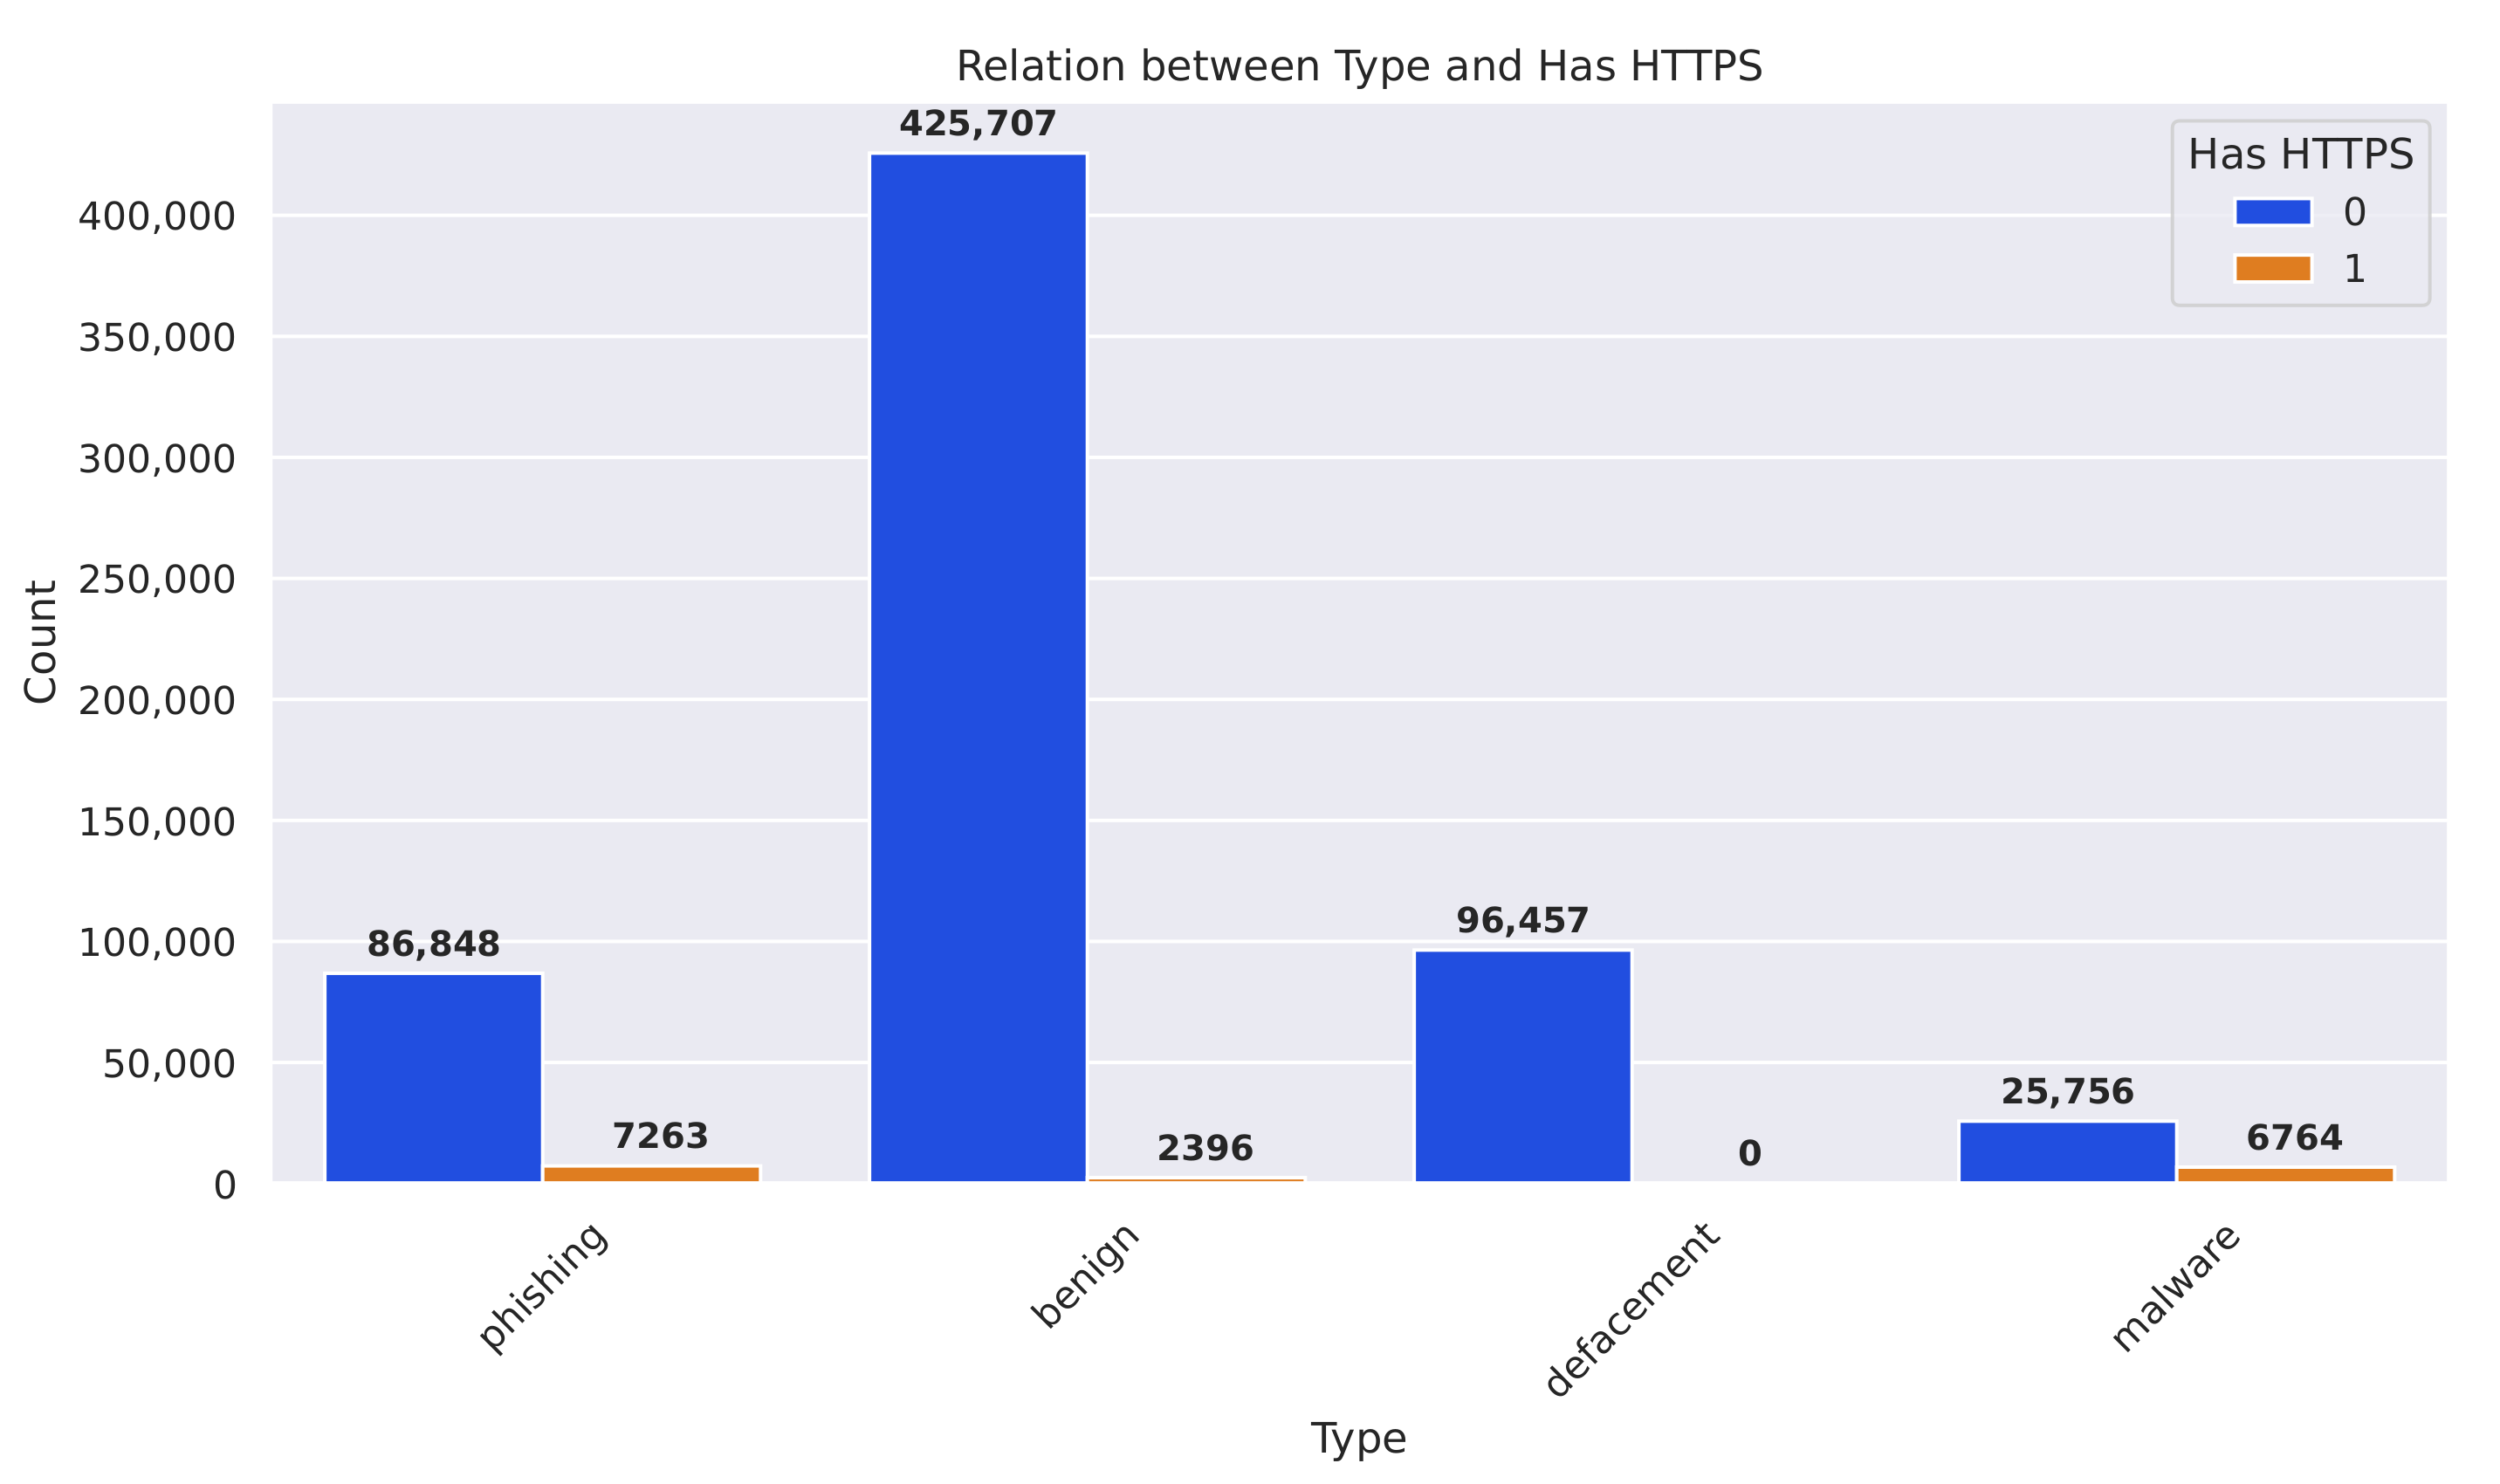
Figure 11 illustrates the relationship between the URL “type” and the presence of HTTPS (“HasHTTPS” = 1 indicates HTTPS, “HasHTTPS” = 0 indicates non-HTTPS). The data reveal several key insights.
Benign URLs: The majority of benign URLs (96,457) utilize HTTPS, while a smaller portion (7263) do not. Defacement URLs: The majority of defacement URLs (25,756) employ HTTPS, with a smaller number (6764) utilizing non-HTTPS. Malware URLs: A significant number of malware URLs (86,848) are HTTPS-enabled, while a smaller proportion (2396) use non-HTTPS. Phishing URLs: The majority of phishing URLs (425,707) utilize HTTPS, while a smaller number (7263) use non-HTTPS.
This analysis highlights the diverse security practices across different URL types. While a significant portion of URLs, regardless of their classification, employ the more secure HTTPS protocol, there is also a notable presence of non-HTTPS usage, particularly for MURL types such as malware and phishing.
Figure 12 shows the relationship between the URL “type” and “Has Shortening Service” (0 or 1). The key observations are:
- 1.
Benign URLs have a significantly higher count when the “Has Shortening Service” is 0, indicating that the majority of benign URLs do not use a URL shortening service.
- 2.
Phishing, defacement, and malware URLs also show a higher count when “Has Shortening Service” is 0, though not as pronounced as the benign URLs.
- 3.
A smaller portion of URLs across the different types have “Has Shortening Service” set to 1, indicating the use of a URL shortening service.
This suggests that URL shortening is less common overall, and benign URLs, in particular, are less likely to utilize a shortening service compared to other URL types.
The in-depth analyses conducted above can indeed serve as strong evidence that our feature engineering efforts for this dataset have been quite effective. Here is how the analyses support the quality of the feature engineering:
- 1.
Comprehensive URL type categorization: The ability to clearly distinguish and quantify different URL types, such as benign, defacement, malware, and phishing, indicates that the feature engineering has captured meaningful and discriminative characteristics to enable accurate URL classification. The granular breakdown of URL types showcases the robustness of the feature engineering process.
- 2.
Alignment with real-world security trends: The observed high prevalence of HTTPS usage among the URLs aligns with the broader industry trend towards increased adoption of secure communication protocols. This alignment between the dataset’s characteristics and real-world security practices validates the relevance and quality of the feature engineering.
- 3.
Potential for targeted security enhancements: The analyses reveal nuanced security behaviors across different URL types, such as the varying HTTPS adoption rates. This level of granularity in feature engineering enables the identification of specific areas for targeted security improvements and the development of more specialized models.
In summary, the comprehensive and insightful analyses presented in the above figures serve as strong evidence that the feature engineering for this dataset has been well designed and is effective. The ability to extract meaningful patterns and security-related characteristics aligns with real-world trends and underscores the quality of the feature engineering process. This, in turn, lays a solid foundation for building robust and reliable models for URL classification, MURL detection, and other security-related applications.
5.2. Performance Analysis of Known-MUDS
This section presents a comprehensive performance analysis of the proposed known-MUDS on the known MURLs. Our goal is to evaluate the ability of the learning models to classify instances of the same type as the training data. The results are detailed in
Table 7. The key insights and information from
Table 7 are as follows:
- 1.
Impact of Optuna: The table clearly separates the proposed algorithms into two categories: “Proposed algorithms without Optuna” and “Proposed algorithms with Optuna”. By comparing the performance metrics between these two categories, we can assess the impact of using Optuna for hyperparameter optimization.
- 2.
Performance improvements: The use of Optuna leads to improved performance across the various metrics for most models. For example, the accuracy of the XGBoost model increases from 96.18% without Optuna to 96.83% with Optuna, a significant improvement. Similar improvements can be seen in the precision, recall, and F1 score of the XGBoost model when Optuna is employed. In order to rigorously compare the performance of the proposed algorithms with and without Optuna optimization, we conducted statistical significance testing using the Wilcoxon signed-rank test. This non-parametric test was chosen due to its ability to handle non-normal distributions and small sample sizes. The test was applied across four key performance metrics: accuracy, precision, recall, and F1 score. The results showed statistically significant differences for all metrics, with p-values of 0.043, indicating that Optuna’s optimization process had a meaningful and consistent impact on improving the model performance. These findings validate the effectiveness of Optuna in enhancing the overall efficiency and accuracy of the proposed system.
- 3.
Computational time: The impact of Optuna on computational time is more mixed. While the training time generally increases due to the additional optimization process, the prediction time can either increase or decrease depending on the model. For the XGBoost model, the prediction time decreases from 0.52 microseconds without Optuna to 1.66 microseconds with Optuna, indicating a slight decrease in inference speed.
- 4.
Trade-offs: The table indicates that using Optuna for hyperparameter optimization can lead to performance improvements, especially in terms of accuracy, precision, recall, and F1 score. However, this improvement comes at the cost of increased training time, as the optimization process adds computational overhead. For example, the training time of the XGBoost model increases from 3.13 s without Optuna to 8.67 s with Optuna.
- 5.
Top-performing model: Focusing on the XGBoost model, we can see that it achieves the best performance among all the proposed algorithms, both with and without Optuna. With Optuna, the XGBoost model reaches an accuracy of 96.83%, precision of 96.78%, recall of 96.83%, and F1 score of 96.79%, outperforming all other models.
- 6.
Comparison with state-of-the-art models: Evaluating the XGBoost model against two recent Random Forest-based models on the same dataset demonstrates the advantages of the data preprocessing and hyperparameter tuning techniques employed. XGBoost achieves an accuracy of 96.83%, while the Random Forest models in the literature reach 96.15%. Additionally, XGBoost outperforms these models in other classification metrics, including precision, recall, and F1 score.
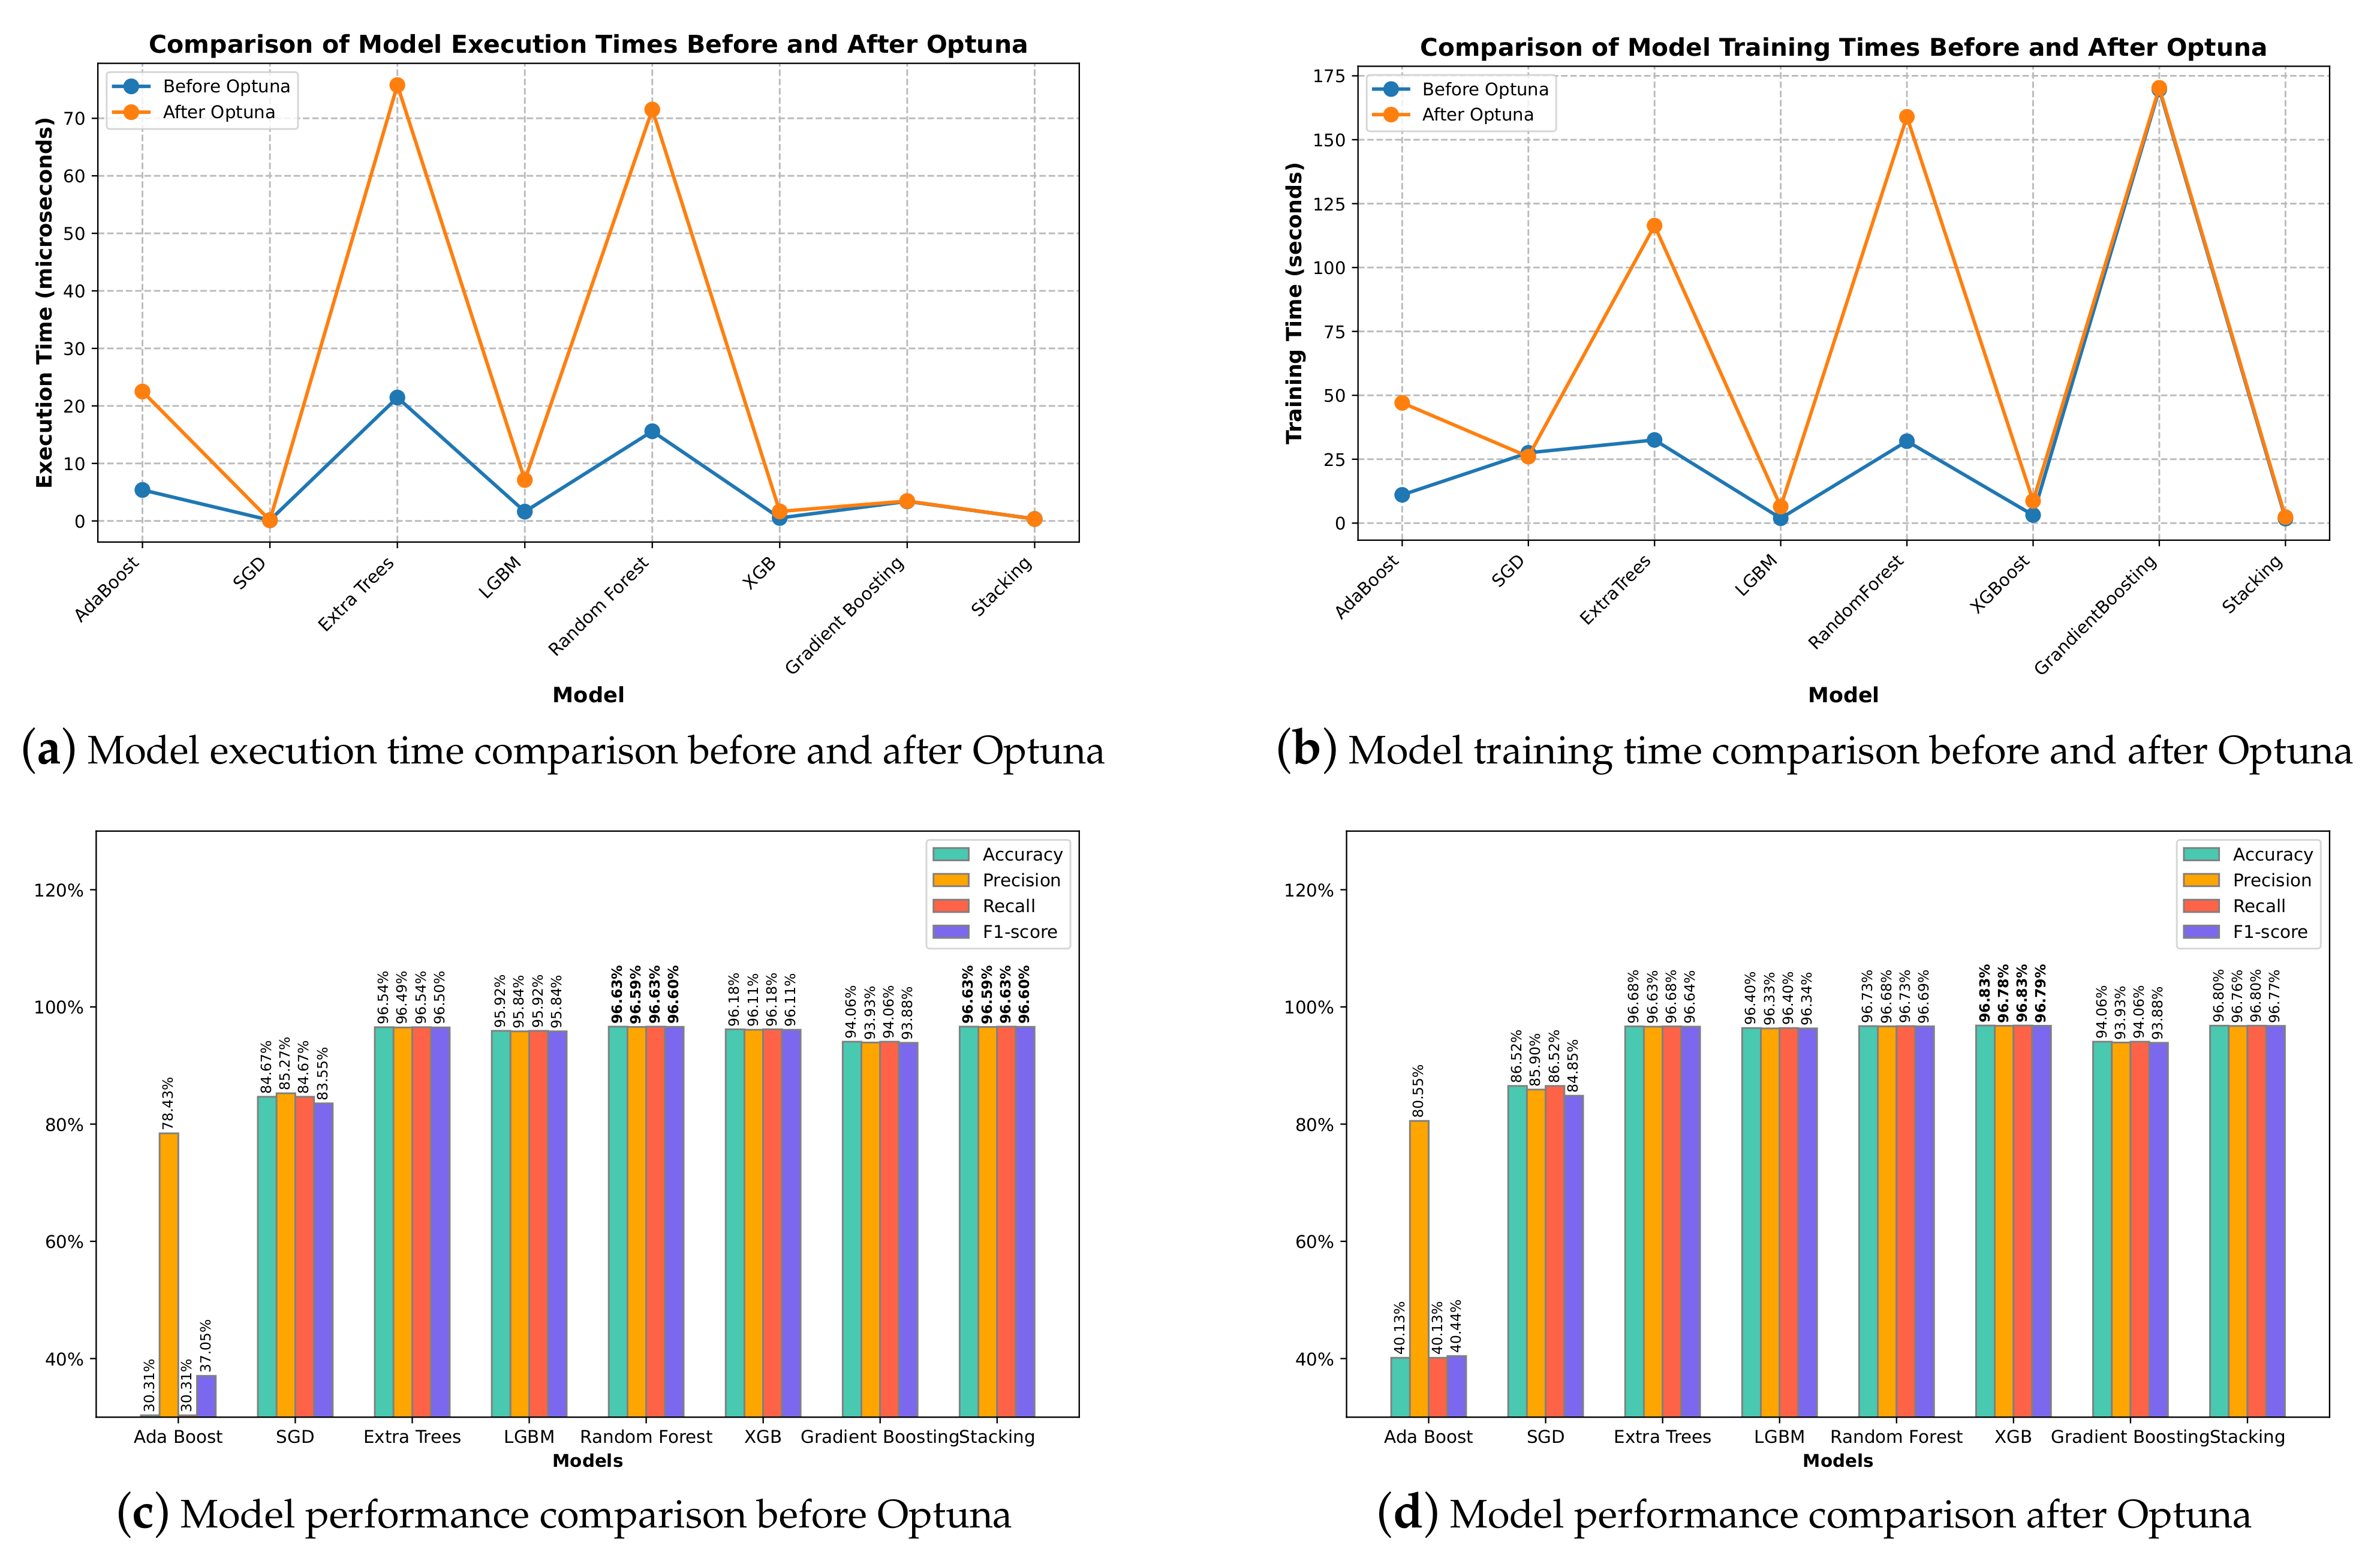
The performance of the eight models before and after Optuna optimization is shown in
Figure 13c and
Figure 13d, respectively.
The execution time comparison of the five machine learning models before and after Optuna in classifying malicious and benign URLs is presented in
Figure 13a. The training time of the five machine learning models in classifying malicious and benign URLs is presented in
Figure 13b.
5.2.1. Model Evaluation and Discussions
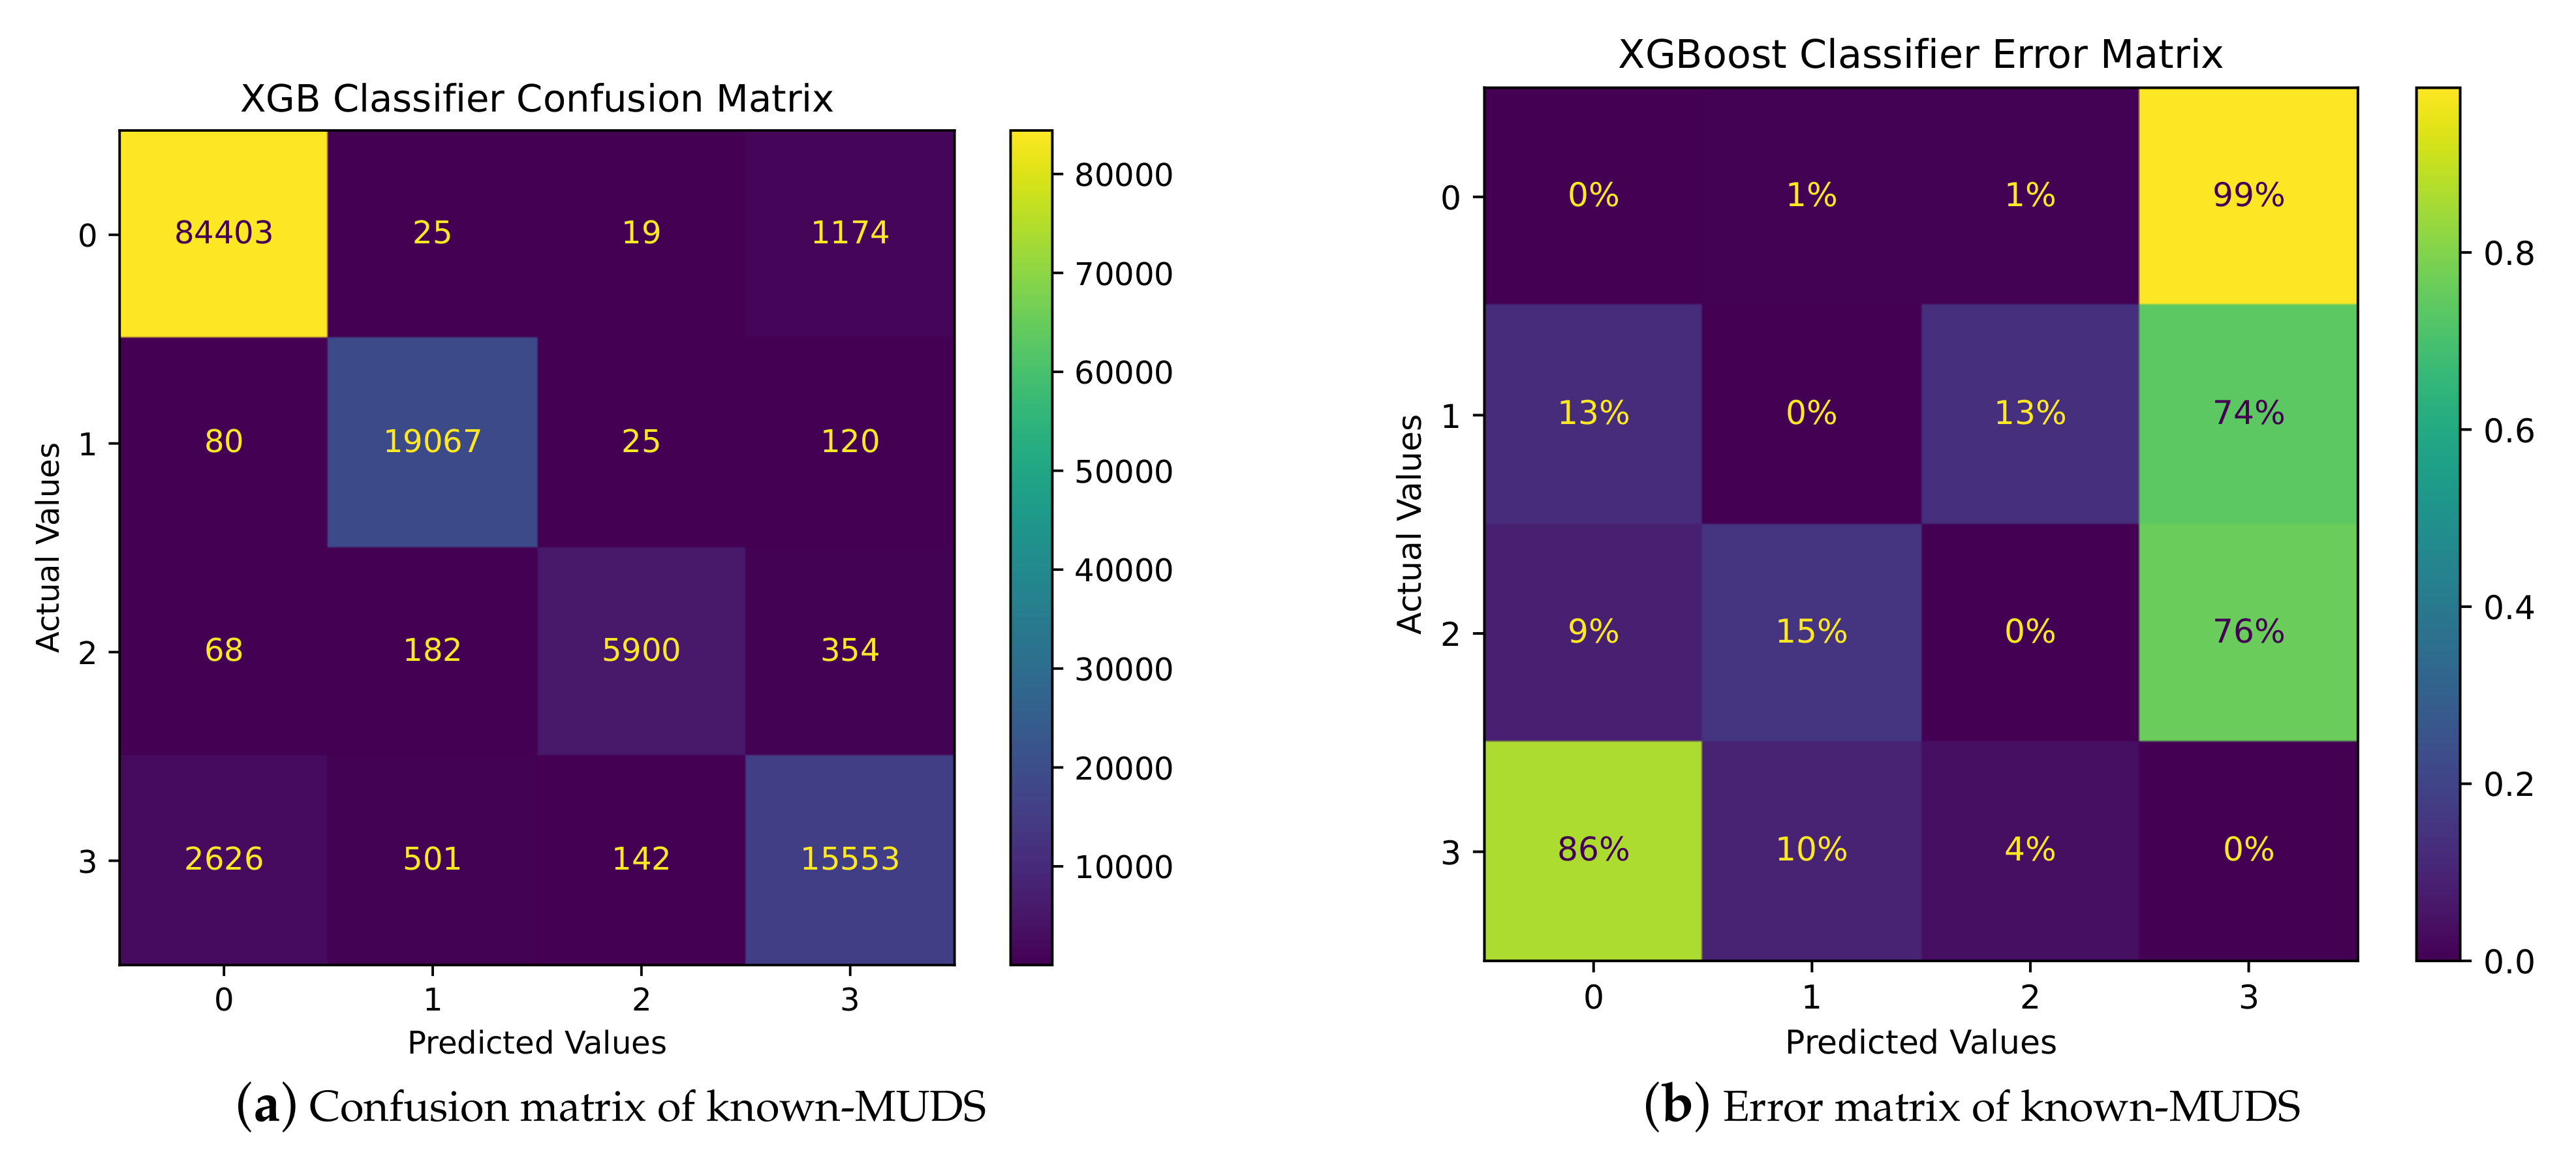
To further investigate the behavior of the best model in the known-MUDS, the multi-class classifier, in detecting known MURLs, we conducted an extensive analysis, presented in
Figure 14. The confusion matrix depicted in
Figure 14a provides a comprehensive overview of the model’s classification performance and its normalized version. Additionally,
Figure 14b focuses on the errors in the confusion matrix.
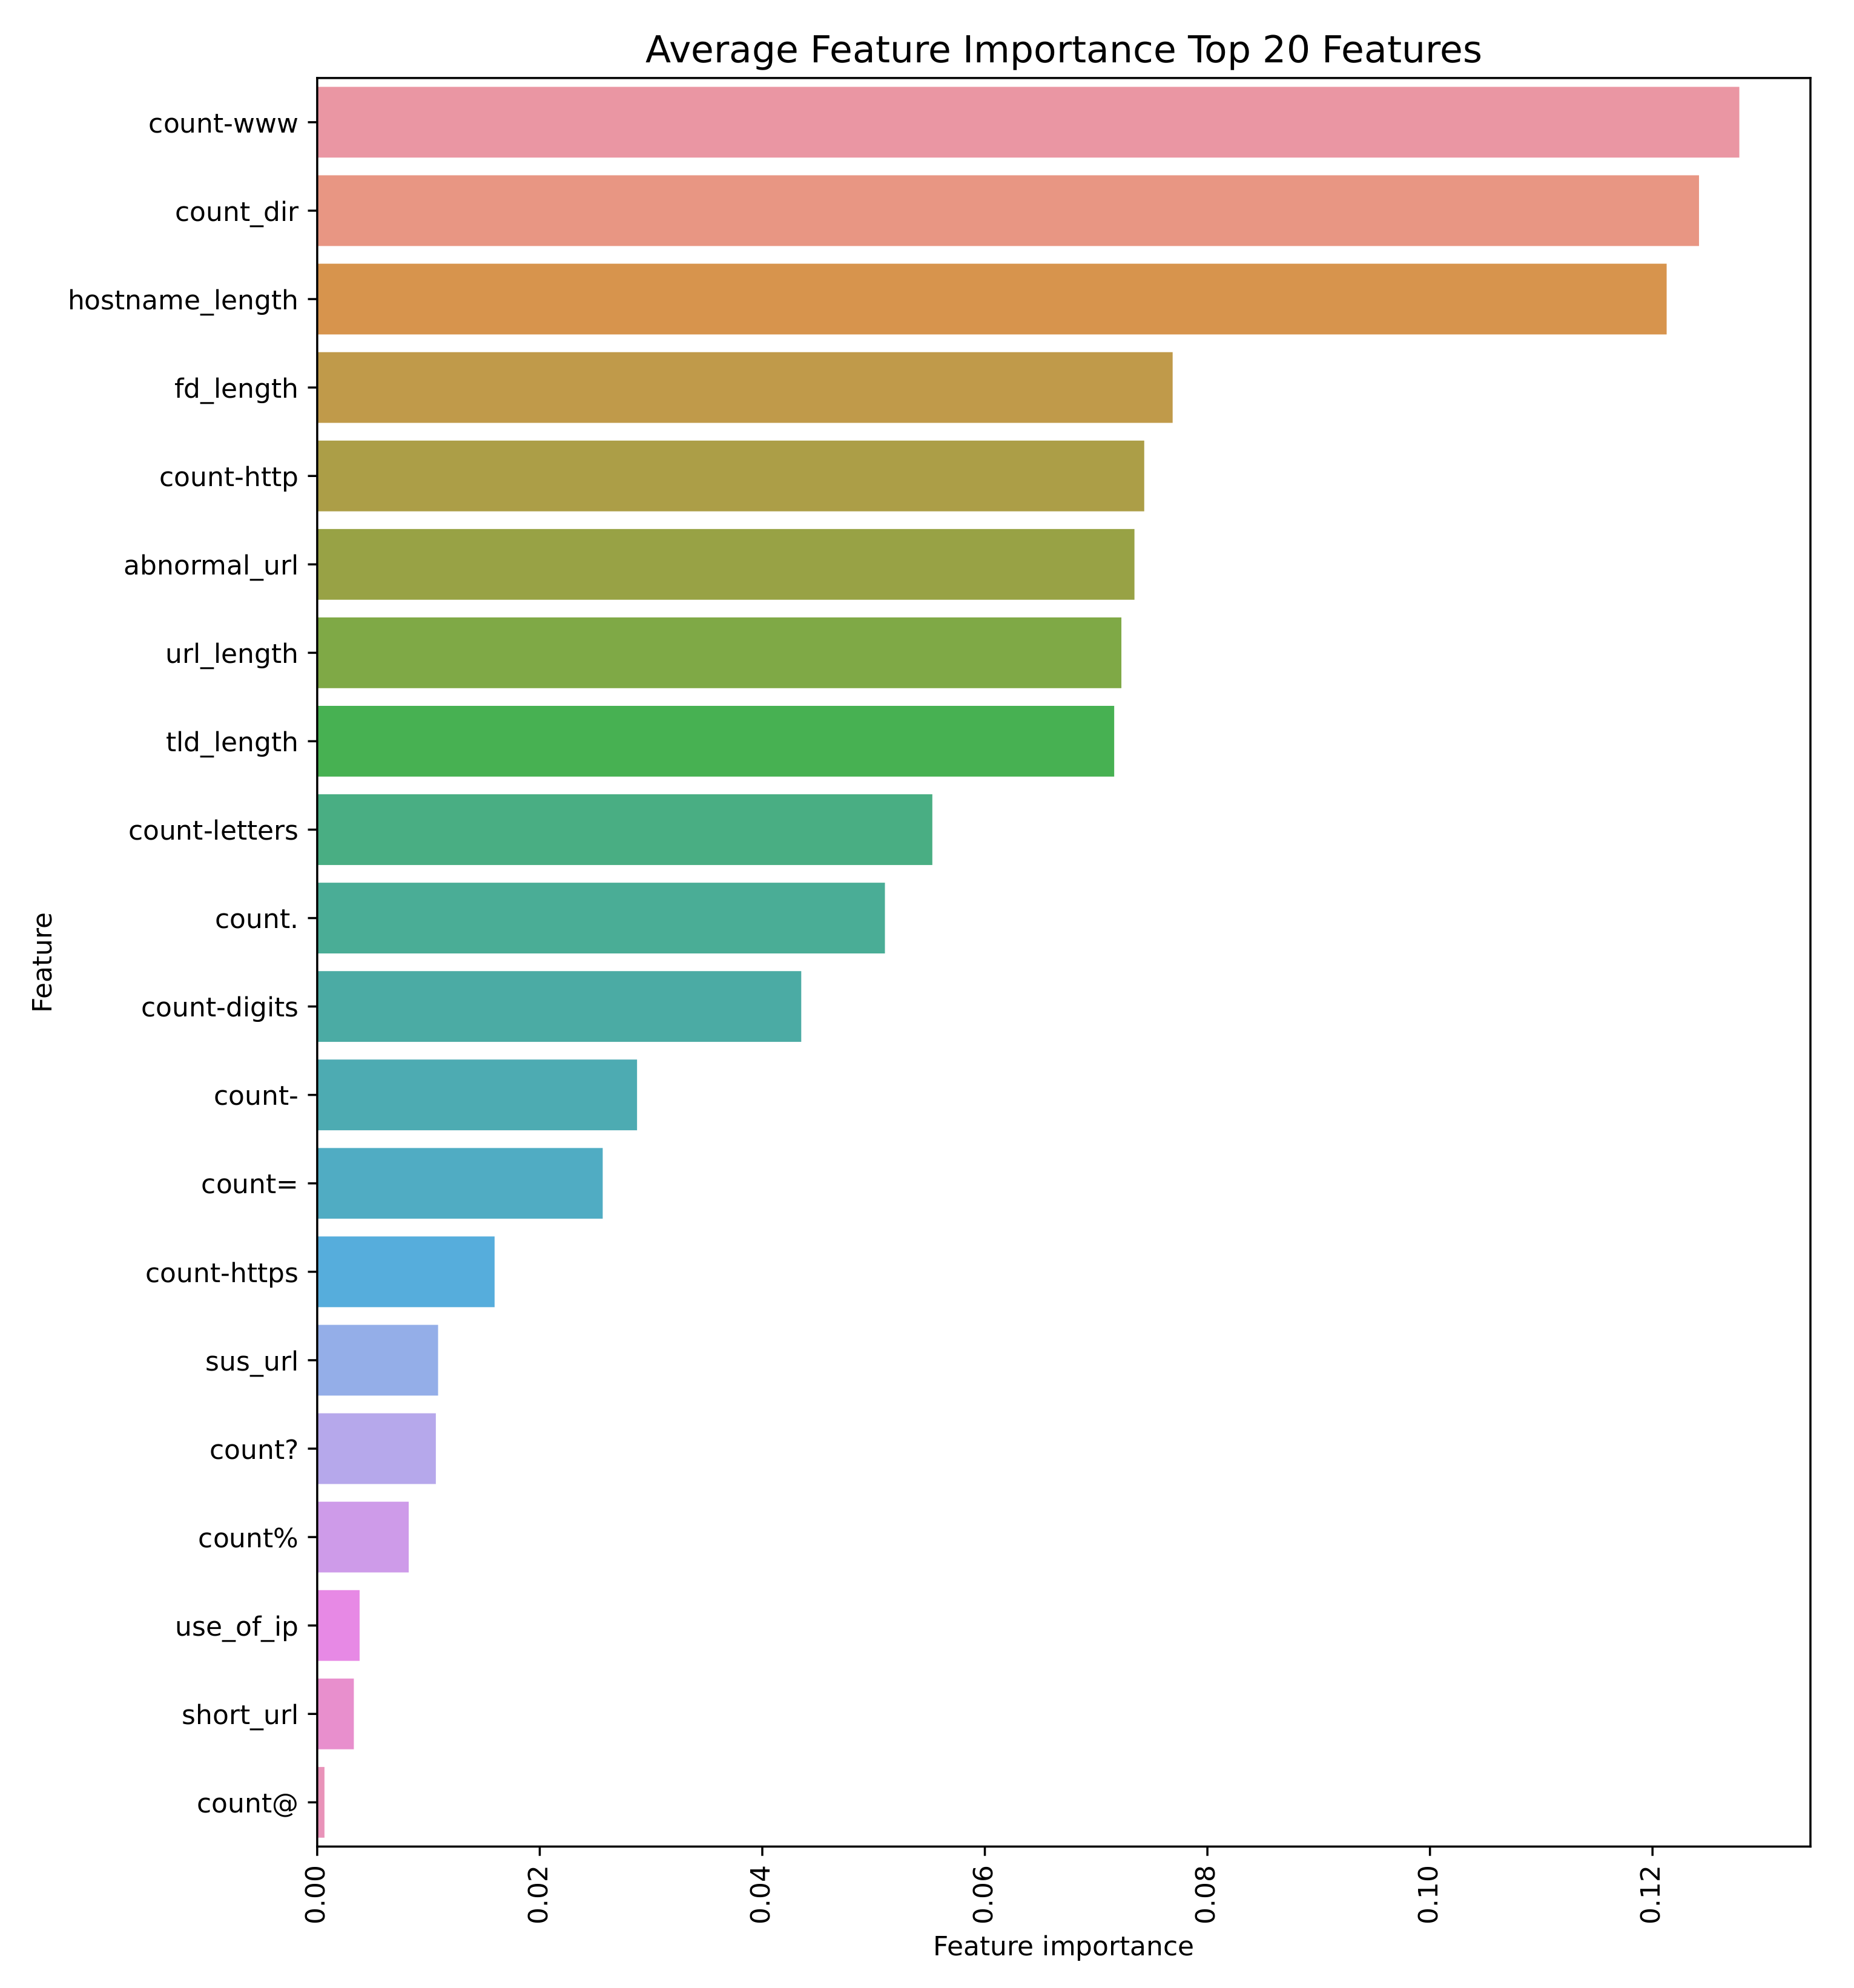
Figure 15 illustrates the average feature importance of the top 20 features within our developed framework. Feature importance serves as a metric that signifies the relative significance of each feature in predicting the target variable or facilitating classifications. In this section, we analyze the top five features.
- 1.
count_www: The frequency of ‘www’ in a URL can serve as a distinguishing characteristic for different types of websites or web structures. Its significant importance suggests that the presence or absence of ‘www’ elements in URLs plays a pivotal role in the model’s predictive capacity.
- 2.
count_dir: This feature likely signifies the complexity or depth of the URL structure based on its directories. Its pronounced importance indicates that the quantity of directories in a URL is a crucial determinant for the model’s decision-making process.
- 3.
hostname_length: The length of the hostname in a URL offers insights into the URL’s intricacy or origin. Its notable importance implies that the hostname’s length significantly impacts the model’s predictions and outcomes.
- 4.
fd_length: The length of the initial directory in a URL path may reveal specific patterns or categories. Its high importance suggests that this feature strongly influences the model’s predictions and analysis.
- 5.
count_http (the number of ‘http’ within the URL): The count of ‘http’ occurrences in a URL can indicate certain URL types or protocols. Its substantial importance highlights that the presence or frequency of ‘http’ is a critical factor in the model’s performance and analysis.
Despite the solid performance of the known-MUDS in detecting known MURLs, many other types exist beyond malware, defacement, and phishing. Cybercriminals frequently develop new MURLs for illicit activities. Therefore, we must thoroughly examine the robustness of the known-MUDS models. The following section presents the robustness of the proposed MUDS against unknown MURLs.
5.2.2. Robustness Study of Known-MUDS
While the current focus has been on effectively detecting known MURLs, it is imperative to prioritize the robustness study of the established known-MUDS. This helps in analyzing the performance of machine learning models against unknown scenarios.
To conduct this crucial robustness study, we simulated zero-day MURLs using various data-splitting techniques. Below, we illustrate the process for simulating “Defacement” as an unknown attack.
- 1.
Filtering dataset: Filters the dataset to include only the classes ‘benign’, ‘phishing’, and ‘malware’ and stores the result in the variable train_df.
- 2.
Extracting ‘benign’ URLs: Extracts the URLs corresponding to the ‘benign’ class from train_df and assigns them to the variable benign_urls.
- 3.
Random sampling: Randomly samples 96457 URLs from benign_urls using a specified random state and stores the result in test_benign_urls.
- 4.
Creating the test set: Creates the test set test_df by selecting rows from the original dataset where the URL is in test_benign_urls or the type is ‘defacement’.
- 5.
Creating the training set: Creates the training set by filtering train_df to exclude the URLs present in test_benign_urls.
As illustrated above, a new test set is created by including defacement URLs and an equal number of benign URLs. A corresponding training set is then formed by removing this test set from the original dataset. Learning algorithms are trained on this training set and tested on the unseen test set. For evaluation, the known-MUDS is considered robust if it accurately classifies benign test instances as “benign” and defacement instances as either “phishing” or “malware”. This process is similarly repeated for the “phishing” and “malware” types.
The detailed robustness results of the known-MUDS are shown in
Table 8. The results reveal that the classifiers’ performance varies across different types of unknown MURLs. Specifically, accuracy remains above 90% for defacement and malware URLs, but the system’s robustness is lower for phishing URLs, with accuracy around 72%. Additionally, the models exhibit minimal improvement when tuned with Optuna. These findings underscore the need for enhancing the performance of the known-MUDS.
Detecting unknown MURLs presents greater challenges compared to known MURLs because classifiers are not trained on these specific class types [
41]. Furthermore, unknown MURLs may differ significantly in nature and characteristics from known MURLs, complicating accurate classification.
To address this challenge, further research and development are crucial to enhance the classifiers’ ability to identify and categorize unknown MURLs accurately. In response, we have utilized a combination of supervised and unsupervised algorithms, specifically CL_K-means and biased classifiers, as potential solutions. Details of this approach are presented in the following sections.
5.3. Performance Analysis of Unknown-MUDS
In this section, we evaluate the performance of the CL_K-means_BC approach for detecting unknown MURLs. We compare it against two benchmarks:
- 1.
Known-MUDS: This refers to using the existing MUDS without modifications to handle unknown attacks. For comparison, we use XGBoost, the top-performing model from our robustness study, as the reference for the known-MUDS. The results are averaged across the three types of unknown MURLs.
- 2.
Supervised binary classifiers: We compare CL_K-means_BC with binary classifiers trained to differentiate between benign and MURLs. For this, a test set is created by simulating one type of unknown MURL alongside an equal number of benign instances. The training set is formed by excluding the test instances from the original dataset and combining all malicious types into one category. The performance results for the binary classifiers, both before and after tuning, are detailed in
Table 9 and
Table 10, respectively.
Table 9 and
Table 10 highlight the impact of hyperparameter optimization on binary classifiers for detecting unknown MURLs.
Before tuning, XGBoost exhibited the highest average accuracy of 87.94%, particularly excelling in defacement (97.05%) and malware (94.74%) detection, but struggled with phishing detection, achieving an accuracy of only 72.03%. Conversely, AdaBoost had an average accuracy of 85.88%, with notable difficulties in phishing detection at 72.53%.
Post-tuning, both XGBoost and AdaBoost showed improvements. AdaBoost_HPO’s average accuracy increased to 86.55%, while XGBoost_HPO achieved an average accuracy of 87.88%, with better performance in phishing detection (72.07%) and malware detection (94.62%). Other classifiers, such as Random Forest_HPO and Gradient Boosting_HPO, also displayed enhanced results, especially in phishing and defacement categories, indicating that hyperparameter tuning effectively improved their overall performance.
Notably, the SGD_HPO classifier stood out, with the highest average accuracy of 88.64%. It demonstrated strong precision and recall for phishing detection (95.70%) and maintained robust performance for defacement detection (94.18%) and malware detection (85.68%). Additionally, SGD_HPO exhibited low processing and training times, underscoring its efficiency. These findings suggest that SGD_HPO is the most effective method for detecting unknown MURLs, offering high accuracy and reliability across various attack types while ensuring efficient computational performance. Consequently, SGD_HPO is utilized in subsequent comparisons against the proposed CL_K-means.
After examining the performance of the known-MUDS and supervised binary classifiers for unknown malicious types, we now present the results for the proposed CL_K-means_BC method.
Table 11 summarizes the performance of CL_K-means and CL_K-means_BC. CL_K-means refers to the proposed method without using two biased classifiers responsible for correcting the detection errors of CL_K-means.
Table 11 indicates that for phishing URLs, CL_K-means_BC achieved an accuracy of 93.04%, indicating its ability to accurately classify a large portion of phishing instances. The precision score of 86.53% demonstrates its capability to correctly identify and label phishing URLs, minimizing false positives. The recall score of 93.04% highlights its effectiveness in capturing a significant number of phishing URLs from the test set. The F1 score of 89.32% combines precision and recall, indicating the overall performance of CL_K-means_BC in identifying phishing URLs. The processing time for phishing URLs was 14.00 ms, while the training time was 2.64 s.
In the case of defacement URLs, CL_K-means_BC achieved superior performance, with an accuracy of 96.10%. It also exhibits a high precision of 95.78%, indicating its ability to accurately identify defacement URLs. The recall score of 96.08% demonstrates its effectiveness in capturing the majority of defacement URLs from the test set. The F1 score of 96.08% further emphasizes the overall performance of CL_K-means_BC in detecting defacement URLs. The processing time for defacement URLs was 6.00 ms, and the training time was 1.05 s.
For malware URLs, CL_K-means_BC achieved an accuracy of 88.47%, demonstrating its ability to accurately classify malware instances. The precision score of 88.47% indicates its capability to correctly identify and label malware URLs. The recall score of 88.55% highlights its effectiveness in capturing a significant number of malware URLs from the test set. The F1 score of 88.51% combines precision and recall, reflecting the overall performance of CL_K-means_BC in detecting malware URLs. The processing time for malware URLs was 14.00 ms, and the training time was 0.89 s.
Overall, the average performance of CL_K-means_BC across all types of unknown MURLs is much superior compared to CL_K-means without the biased classifiers. With an average accuracy of 92.56% and an average F1 score of 91.30%, CL_K-means_BC demonstrates its effectiveness in accurately identifying and classifying different types of unknown MURLs. The average processing time of 11.33 ms further emphasizes its efficiency in real-time applications. The training time for CL_K-means_BC is 1.53 s, indicating that it can be trained effectively within a reasonable time frame.
The performance comparison of the three methods—known-MUDS, supervised binary classifiers, and CL_K-means_BC for unknown MURLs—is summarized in
Table 12. The table clearly demonstrates the superior performance of the proposed CL_K-means_BC method across several evaluation metrics. Specifically, CL_K-means_BC achieves an accuracy of 92.54%, precision of 90.26%, recall of 92.56%, and an F1 score of 91.30%. These results surpass both the best multi-class model (XGB) and the best binary model (SGD), which achieved respective accuracies of 88.19% and 88.64%. The precision and recall scores of CL_K-means_BC also significantly outperform those of the other models, highlighting its effectiveness in correctly identifying both positive and negative instances of MURLs.
The higher accuracy of 92.54% achieved by CL_K-means_BC, compared to 88.19% for the best multi-class model (XGB) and 88.64% for the best binary model (SGD), indicates that CL_K-means_BC is more reliable in correctly classifying unknown MURLs. The precision of CL_K-means_BC is 90.26%, which is superior to that of XGB (91.65%) and SGD (89.20%), suggesting that the proposed method has a lower rate of false positives and is more accurate in identifying actual threats. The recall of 92.56% for CL_K-means_BC is also higher than that of XGB (88.19%) and SGD (88.41%), indicating a better capability of detecting true positives and minimizing false negatives.
The processing time (P-Time) and training time (T-Time) of CL_K-means_BC are competitive, with a P-Time of 11.33 ms and a T-Time of 1.53 s. This only refers to the time of the added biased classifiers to CL_K-means. Although the processing time is higher compared to the binary model (SGD) at 0.11 ms, the training time of 1.53 s demonstrates that the proposed method can be feasibly deployed in real-world scenarios, where timely detection is critical. The efficiency of CL_K-means_BC in terms of both processing and training times underscores its practical applicability despite the slight trade-off in processing speed.
The significant improvements in accuracy, precision, recall, and F1 score achieved by CL_K-means_BC validate its robustness and effectiveness in detecting unknown MURLs. These metrics highlight the method’s potential to improve the overall performance and reliability of MURL detection frameworks. By leveraging CL_K-means_BC, we can achieve a highly accurate and efficient unknown-MUDS, making it a promising approach for addressing the ongoing security challenges posed by evolving cyber threats.
