Article

Platform First-Party Product Entry and Pricing Strategy under Cost Differences and Capacity Constraints

Glorious Sun School of Business and Management, Donghua University, Shanghai 200051, China
*
Author to whom correspondence should be addressed.
J. Theor. Appl. Electron. Commer. Res. 2024, 19(3), 2497-2521; https://doi.org/10.3390/jtaer19030120
Submission received: 8 March 2024 / Revised: 10 August 2024 / Accepted: 15 September 2024 / Published: 22 September 2024

Abstract

:
In the rapidly evolving platform economy, the competition between platform-owned products and third-party offerings is intensifying. This study examines the entry and pricing strategies of dominant e-commerce platforms such as Amazon and JD Mall which sell both platform-owned and third-party products. We use a complete information game model to analyze the strategic interactions between these platforms and third-party sellers, focusing on cost discrepancies and limited entry capabilities, areas previously underexplored. Our key findings include the following: (1) Platforms with dominant power can restrict third-party product pricing. (2) Increased consumer influence by the platform can reduce competition between platform-owned and third-party products. (3) Platforms prioritize high-value-product markets when entry capabilities are limited. (4) Commission-based revenue models are generally more efficient than entry fees. (5) Regulatory bans on hybrid models do not necessarily enhance social welfare; differentiated taxation on various revenue sources may be more effective. This study contributes by developing a comprehensive game-theoretic model to simulate strategic interactions, analyze pricing competition and entry strategies under cost asymmetry and capacity constraints, and provide theoretical guidance for regulatory policies.

1. Introduction

The pervasive expansion of mobile internet, coupled with the recent acceleration of e-commerce growth driven by the COVID-19 pandemic, has positioned online retail platforms such as Amazon, Taobao, and JD.com at the forefront of the supply chain architecture, instigating a profound transformation in the retail industry’s structural dynamics [1]. Initially, these platforms operated under single operational models, focusing either on direct sales of platform-owned merchandise (first-party products) or exclusively facilitating sales by third-party vendors (third-party products). However, they have since evolved into integrated models that synergistically combine both approaches, leading to substantial growth. For instance, Amazon began in 1994 as a direct seller of books and expanded its model in 2000 to incorporate third-party vendors, ultimately becoming the world’s largest online retail platform. By 2024, sales from third-party sellers accounted for approximately 60% of the total paid units on Amazon’s marketplace, underscoring its global reach and influence [2]. This has led to Amazon being recognized as one of the most valuable brands worldwide. Similarly, in Asia, JD.com started with a focus on direct sales of electronics and digital products and transitioned to a comprehensive e-commerce platform in 2010. Today, JD.com is the world’s second-largest online store and the highest-grossing Fortune 500 retail company in China [3]. This paradigm shift in operational strategies has not only spurred the growth of the platform economy but also intensified the competition between platform-owned (first-party) and third-party products. The integrated model adopted by these platforms leverages the strengths of both direct sales and third-party facilitation, creating a dynamic and competitive marketplace that continues to evolve.
The alteration in operational models of these platforms has led to an enhanced diversification of product offerings, more accurately addressing the multifaceted demands of consumers. For instance, Amazon’s appeal lies in its vast product diversity, with 69% of its users citing the wide range of products as their reason for choosing the platform [4]. Currently, Amazon supports over two million active sellers, offering an estimated 353 million product types. In this context, platform-owned products account for approximately 12 million types, with an annual growth rate of 3% [5]. Despite Amazon’s substantial market influence, its product market coverage still encounters limitations. From an operational standpoint, strategic market entry of platform-owned goods becomes imperative, particularly given the constraints on market entry capabilities (limited entry capabilities) and the cost discrepancies between platform-owned and third-party products (cost advantage refers to having lower costs compared to the other party, while cost disadvantage means having higher costs compared to the other party). Thus, this paper aims to explore the market entry and price competition strategies of platform-owned goods amidst these challenges.
Distinctively, compared to traditional enterprises, e-commerce platforms, serving as both service providers and regulators, possess the following unique dominant advantages: (1) Platforms accrue revenues from commission and fees charged to third-party sellers. As per Amazon’s quarterly report, the platform garnered $27.38 billion in commission and service fees from third-party sellers in the second quarter of 2022, representing a 9% year-over-year growth [6]. (2) Platforms can steer consumer purchasing decisions through strategic placements such as priority listings in shopping carts, page rankings, and promotional displays, targeting price-insensitive customers towards specific vendors’ products. This analysis of competition between platform-owned and third-party sellers must therefore consider these platforms’ dominant advantages. Moreover, the dual role of platforms raises concerns over potential abuses of power and fairness, underscoring the importance of examining market regulatory measures for the sustainable development of the platform economy.
Despite the extensive research on platform economics, the strategic interactions between dominant platforms and third-party sellers, particularly concerning cost discrepancies and entry capabilities, remain underexplored. This study aims to fill this gap by investigating the entry and pricing strategies of dominant e-commerce platforms, focusing on these critical aspects. We develop a complete information game model to investigate the strategic interactions between the dominant platform and third-party sellers. This model operates within a market space composed of products with varying profitability (different product values). The analysis is conducted under the constraints of limited entry capabilities and cost differentials. We focus on the entry and price competition game between first-party products and third-party sellers to address three key questions: (1) What are the price competition strategies and equilibrium operational models in the product market of varying values under asymmetric competitive advantages between first-party products and third-party products? (2) What is the market entry strategy for first-party products when entry capabilities are limited? (3) Should the hybrid model be prohibited, and how should the government tax the diverse sources of income for dominant platforms?
This paper’s primary contributions are as follows: (1) It establishes an inelastic demand model within a market composed of a multitude of products with varying profitability. It analyzes the market modes and optimal pricing strategies for each product space under conditions of limited entry capability and differing costs. (2) It examines the impact of a platform’s dominant power on the competition between first-party and third-party products, prompting reflection on the fairness of platform monopolistic power. (3) From the perspective of competition between first-party and third-party products, it offers theoretical support for the survival strategies of third-party sellers on the platform, consumer purchasing decisions, and policy makers’ regulation of platform monopolistic power.
In Section 2, we contextualize our study within the pertinent scholarly discourse. Section 3 delineates the foundational elements of our model and the sequence of the game, setting the stage for a backward induction approach to resolve the game. Subsequently, we unravel the intricacies of the pricing subgame, the entry subgame, and the platform’s fee structure adjustment strategy in Section 4. Section 5 extends the discussion to two critical aspects of policy regulation. The paper discusses the main findings and management implications of this article, as well as its limitations and future prospects in Section 6.

2. Literature Review

This article examines the market entry strategies of dominant platforms in contexts of limited entry capabilities and cost disparities. The literature is categorized into three main areas: (1) selection of platform business models, (2) competition between self-operated and third-party products, and (3) first-party-product market entry strategies.
The first category concerns the selection of platform business models. Traditionally, platforms have acted as “service providers”, mediating between demand and supply without engaging in production, thereby offering value-added services related to transactions and the transfer of goods. However, contemporary platforms serve not only as intermediaries in the supply chain but also as participants and managers of the supply chain [7]. Studies on the factors and mechanisms driving this shift in business models, such as those by Hagiu and Wright [8], suggest that the degree of information asymmetry between platforms and third-party sellers, efficiency comparisons, and product spillover effects are crucial in determining platform business model choices. Research by Abhishek et al. [9] compared agency sales and resale models, highlighting control over pricing as a significant determinant in the choice of business models by online retailers, with a preference for agency sales due to its efficiency and lower retail prices in a competitive environment. Zhang’s [10] analysis of mainstream e-commerce platform operating models concluded that, under equal conditions of third-party-seller count, platform usage fees, and commission rates, a hybrid model surpasses a pure platform model in terms of platform profit. Hagiu and Teh [11] found that platforms opt for a hybrid model when their cost or quality advantage is moderate and prefer a pure first-party model when such advantages are significantly high. Li and Wei [12] observed an increased inclination towards hybrid models among retailers with higher commission rates and potential product demand. These studies typically view the platform’s ability to rent-seek from third-party sellers as a monopolistic power, exploring its impact on the choice of operational models in response to changes in third-party-seller numbers, user demand, and product cost and quality differences. Our paper extends beyond the advantage of charging commission and service fees to third-party sellers, considering another competitive advantage derived from the platform’s dominant power: the ability to guide price-insensitive consumers, thereby influencing purchasing decisions. Chen and Tsai [13] demonstrated that Amazon tends to recommend its branded products over those sold by third-party sellers, significantly impacting the welfare of consumers and third-party sellers. Thus, incorporating this market force into the study of platform business model choices is essential. Moreover, these studies often overlook the strategic implications of cost asymmetry and capacity constraints, which are central to our analysis. Our study builds on this body of work by incorporating cost asymmetry and capacity constraints into the analysis of platform business models. By developing a comprehensive game-theoretic model, we provide new insights into the strategic interactions between dominant platforms and third-party sellers, extending the existing literature’s focus on market dynamics and regulatory impacts.
The second category is the competition between self-operated and third-party products on online platforms. With the rapid growth of e-commerce, online markets exhibit higher competitive dynamics compared to offline markets [14,15]. Research in this area primarily explores price competition, quality competition, and information-sharing strategies between platform-owned products and third-party sellers. In terms of price competition, commission rates are a key area of study. Cao and He [16] found that transaction fees negatively affect the sales efforts of third-party sellers, while platforms benefit from these efforts. Chen et al. [17] analyzed promotional strategies using a three-stage game model, finding that joint promotions lead to higher product prices and promotional efforts than independent promotions, especially when commission rates and cost-sharing ratios are extreme. Strong market expansion effects further enhance the efficacy of joint promotions. For quality competition, Yenipazarli [18] highlighted that product differentiation and fulfillment costs influence manufacturers’ choice between direct sales (1P mode) and platform sales (3P mode). High product differentiation drives manufacturers towards the 3P mode, impacting competitive positioning and quality investments. Xiong et al. [19] examined Amazon’s strategies, discovering that lower commission rates favor the agency model, resulting in higher product quality, while higher rates make wholesale contracts more attractive, also enhancing quality. Regarding information sharing, Bian et al. [20] noted that platforms offering high-quality services prefer the resale model and share more information, whereas in the agency model, suppliers are less inclined to share information, influenced by service information asymmetry. Li and Wu [21] studied dual-channel models and found that different information-sharing strategies significantly affect retail prices and competition. Effective information sharing can increase retail prices, with optimal strategies varying by transaction costs and information value. Sun [22] used a queuing theory model to show that increased information sharing maximizes system throughput as market size grows, and strategy adjustments are needed when customers favor aggregator platforms. Recent studies have further explored these dynamics in light of technological advancements and regulatory changes. For instance, a study by Johnson et al. [23] examined how AI-driven recommendations impact consumer behavior and platform revenues, highlighting the role of machine learning in optimizing product placements and pricing strategies. Another study by Martinez [24] analyzed the effects of recent regulatory changes on e-commerce platforms, focusing on data privacy laws and their implications for platform operations and consumer trust. Previous studies mainly focused on single-product markets. This paper, however, addresses the competition between platform self-operated and third-party sellers across multiple-product markets. Unlike prior research, we examine optimal price competition strategies under conditions where the platform’s self-operated product prices are either higher or not higher than those of third-party products, providing a comparative analysis. These unexplored aspects underscore the necessity of our study to fill existing research gaps.
The third category delves into the strategies and impacts of first-party-product market entry. The literature on product entry and selection, such as [25,26,27], has been expanded in recent studies to include the online platform domain [28,29,30,31,32]. Zhu and Liu [5] used empirical methods to explore Amazon’s private label entry strategy and impact, showing that Amazon’s own brands enter successful product spaces, hindering third-party-seller growth but increasing product demand and reducing consumer shipping costs. Wu and Chamnisampan [33] compared product entry strategies across different competitive markets, examining key factors such as network effects and quality gaps. Jiang et al. [34] studied the dynamic entry decisions of Amazon’s private labels, focusing on demand and seller effort asymmetries, finding that Amazon is motivated to promise not to imitate third-party products to foster investment and profit from commission income. Shopova [35] developed a vertical differentiation model showing that introducing low-quality first-party products and reducing commission for high-quality third-party sellers could increase consumer welfare. Hagiu and Wright [36] explored the implications of allowing Amazon to sell in the same markets as third-party sellers, noting consumer benefits from intense platform competition but also highlighting efficiency losses due to self-preferencing and counterfeit products. Unlike these studies, our article employs an exponential function consistent with the Pareto principle, also known as the 80/20 rule, to simulate the value distribution across the entire product market. The Pareto principle suggests that roughly 80% of effects come from 20% of causes. In our study, this means that a small proportion of high-value products contributes to a large portion of the platform’s revenue, creating a more realistic heterogeneous product space. Our analysis considers constraints on platform entry capabilities and dominant power, examining the market entry strategies and impacts of first-party products.

3. The Model

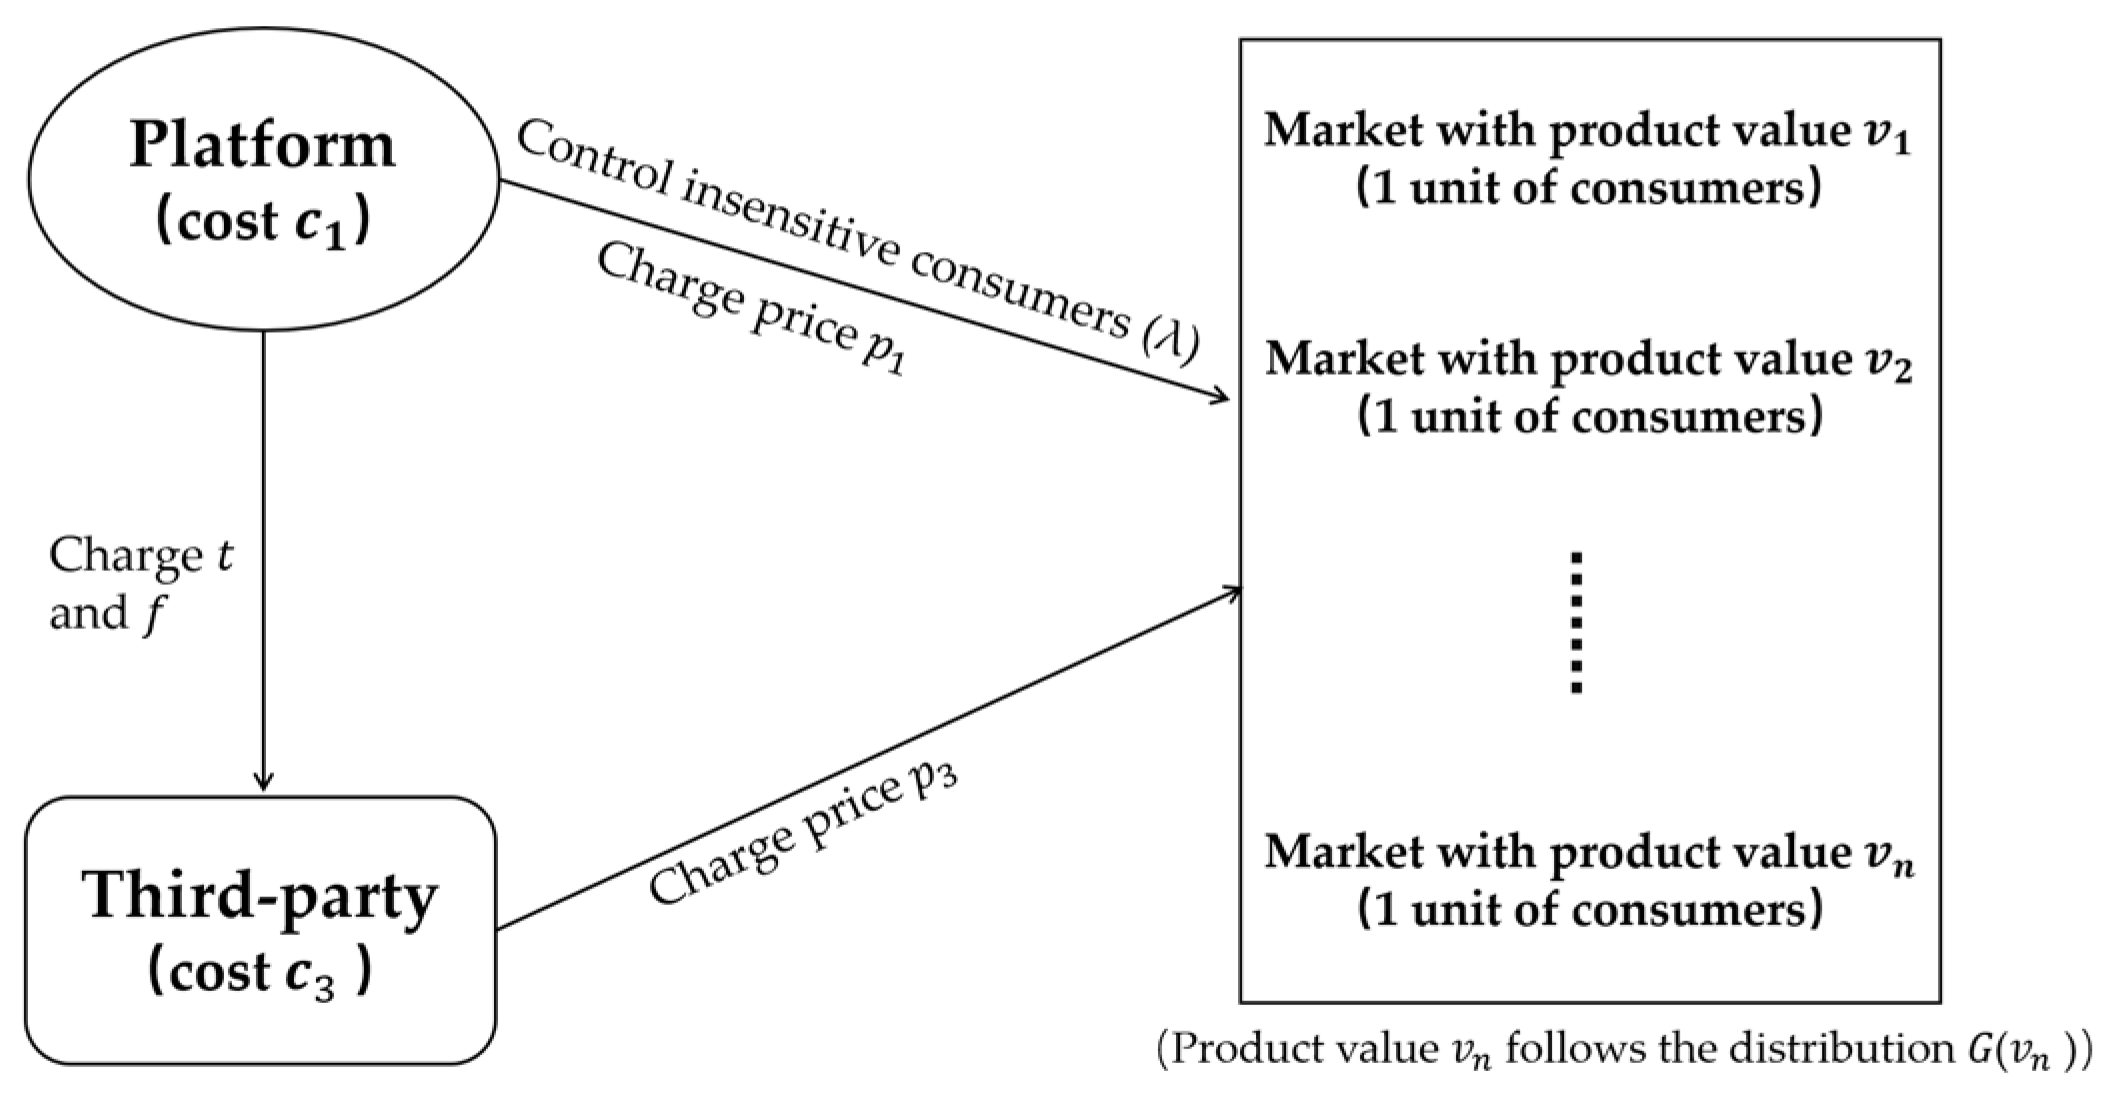
This study explores a multi-product market framework consisting of a platform, third-party sellers, and consumers, as shown in Figure 1. It is posited that the value of products adheres to a specific probability distribution, G ( v ) , with its corresponding probability density function denoted as g ( v ) . Each product type establishes a separate market, within which consumers with unit demand exist. We assume that consumers exhibit inelastic demand, meaning they will only purchase a product if their valuation v exceeds its market price p . This assumption simplifies the analysis by focusing on the decision-making process of consumers with a fixed valuation threshold. Studies (e.g., [5,37]) have shown that in certain product categories, such as essential goods or unique items, consumers’ purchase decisions closely follow this behavior. This assumption affects the model’s predictions by establishing a clear cutoff for consumer purchase decisions, thus streamlining the analysis of competitive strategies. From the supply perspective, product offerings primarily originate from either first-party sales by the platform or third-party sellers. It is assumed that third-party sellers can only vend their products through the platform and that products from both first-party and third-party sources are homogeneous. This assumption is justified because many platform-owned products and third-party products are sourced from the same manufacturers. For example, Amazon’s private label products, such as Amazon Basics, are often produced by third-party manufacturers and then sold under the Amazon brand. Similarly, JD.com’s private label products, such as J.ZAO, are supplied by various third-party manufacturers, with JD.com handling branding and sales. This common sourcing results in products that are similar in quality and features, allowing us to treat them as homogeneous in our model. Furthermore, this simplification is justified because we use a realistic distribution function to represent the entire product market, rather than focusing on individual products. This approach allows us to model the competitive dynamics between platforms and third-party sellers without the additional complexity of product differentiation. Given the cost variations in transportation, inventory, and services, it is presumed that within markets for products valued at v , first-party and third-party products exhibit heterogeneous marginal costs, represented as c 1 and c 3 , respectively. For simplicity in description, subscript 1 is used to identify parameters related to first-party sales, and subscript 3 is used for those related to third-party sellers.
The platform holds distinctive competitive advantages in its competition with third-party sellers, which are manifested in two primary aspects: Firstly, the platform imposes a specific fixed usage fee (entry fee) f and a commission rate t on third-party sellers. Taking JD.com as an example, according to its “2022 Open Platform Category Fee Schedule”, the majority of categories charge third-party sellers a platform usage fee of 1000 yuan per month, with a few categories at 500 yuan per month and some at 0 yuan per month. The technical service fee rate (i.e., the percentage deducted by the platform based on the sales amount of third-party sellers) typically ranges from 5% to 10% [38]. Secondly, the platform can influence the purchasing decisions of price-insensitive consumers by optimizing purchase schemes or modifying search page rankings. Within this model, we assume the proportion of price-insensitive consumers to be λ , who will opt to buy from platform-designated sellers when the product pricing does not exceed v (ensuring non-negative consumer utility), whereas price-sensitive consumers seek the lowest-priced products in the market. Thus, the parameter λ can also be interpreted as the platform’s market competitive advantage derived from its ability to influence consumer purchasing decisions. This study does not account for the costs incurred by the platform in guiding consumer choices.
Due to capacity constraints, first-party sales by the platform are unable to cover all product types in the market, leading to selective entry into certain product segments. The platform’s capability to supply various product types is represented by k [ 0 , 1 ] , where k = 0 signifies the platform’s complete lack of first-party selling capabilities, resulting in only third-party sellers’ products being available on the platform; k = 1 indicates the platform has the capacity to sell all types of products, thus facing no constraints on first-party entry. It is further assumed that these capacity constraints apply solely to the types of products, not their quantities. Although the platform’s own brand may produce some products, in reality, the majority of first-party products are sourced from suppliers, not produced by the platform itself. Hence, the platform’s entry capacity limitations can also be understood as constraints on its ability to find and manage suppliers.
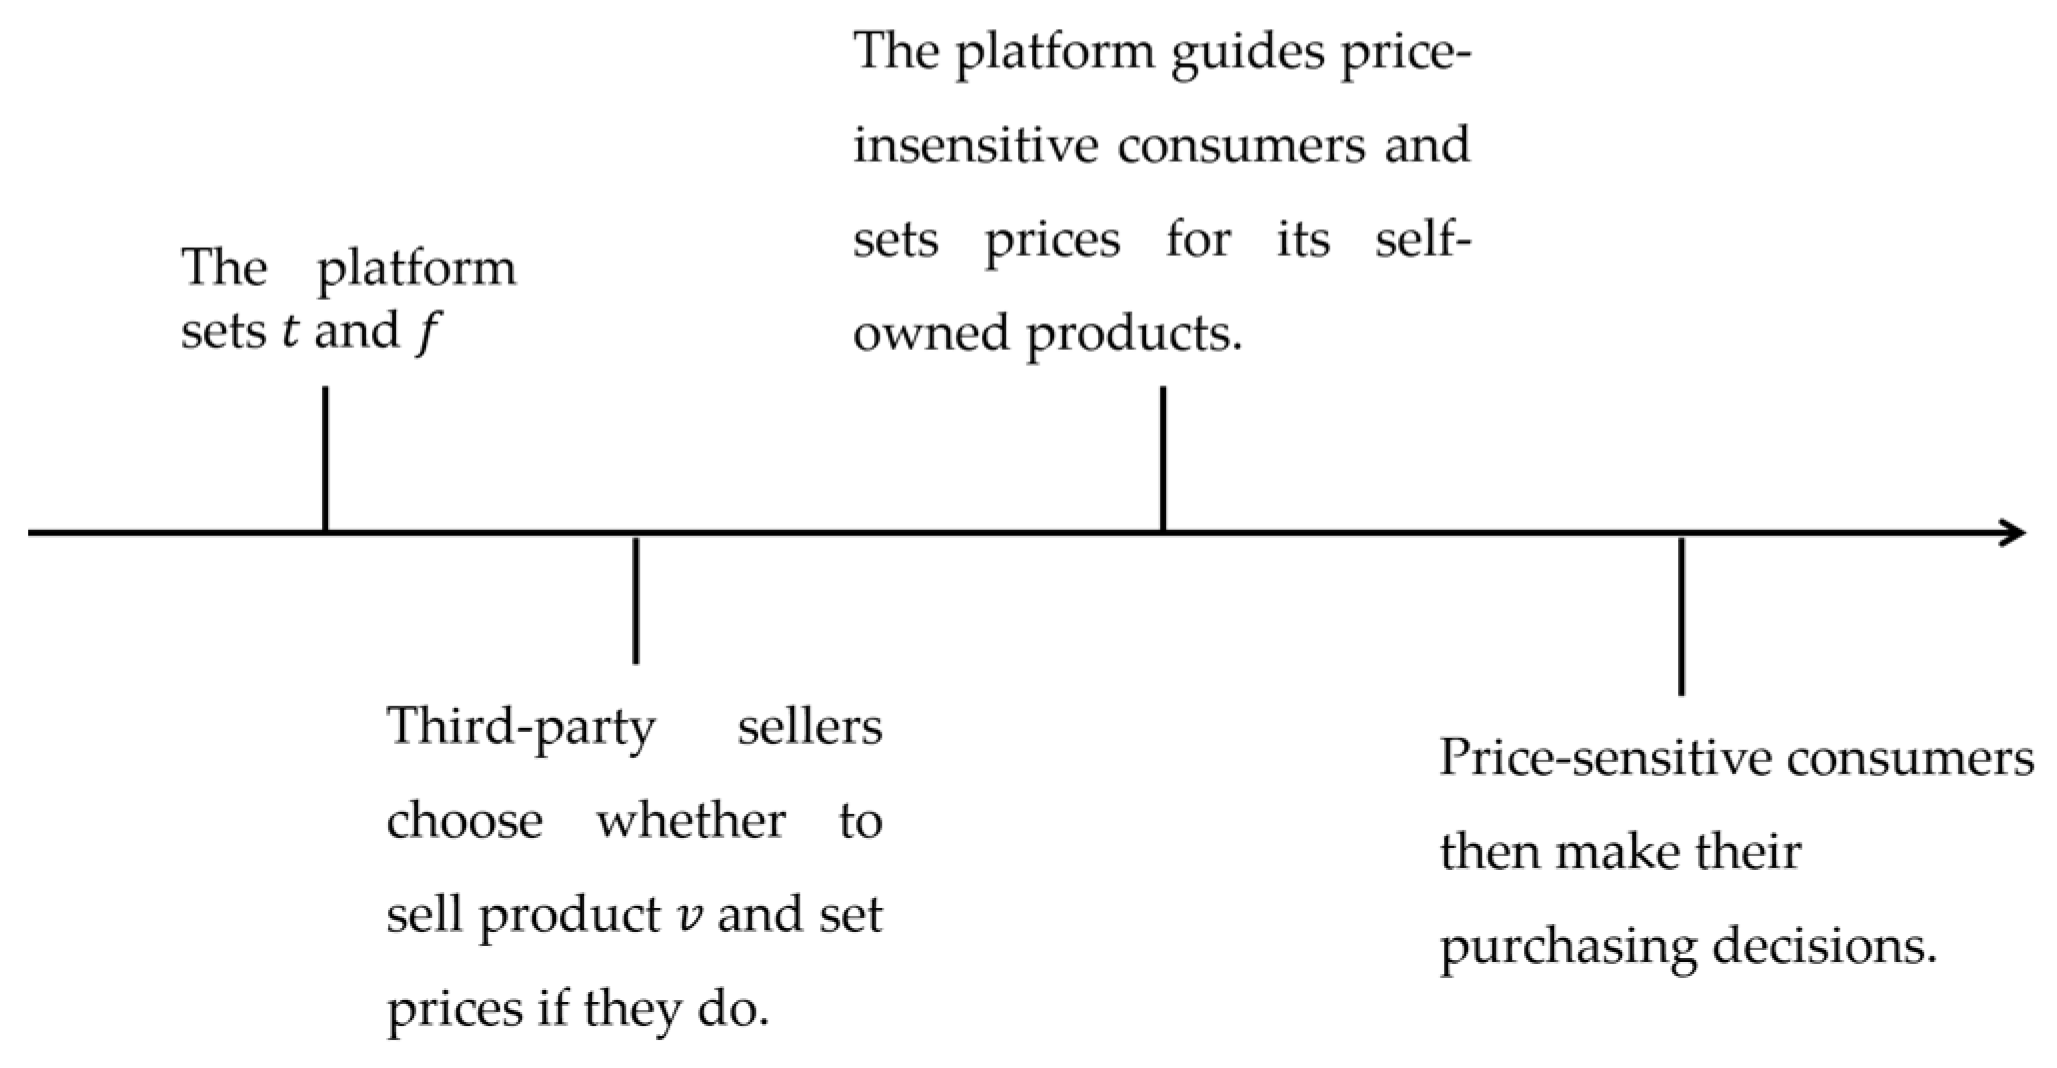
A complete information dynamic game model is constructed, with the sequence of gameplay as follows: Initially, the platform sets the commission rate t and entry fee f for third-party sellers. Following this, third-party sellers, upon receiving this information, decide whether to sell products valued at v on the platform. If a third-party seller opts to join the platform, they then set their product prices. Subsequently, after observing the entry and pricing actions of third-party sellers, the platform, guided by its own entry capacity and the purchasing decisions of price-insensitive consumers, determines which product markets to enter as a first-party seller and sets the prices for these products. Finally, price-sensitive consumers make their purchasing decisions based on the prevailing market conditions. The game sequence diagram of this study is shown in Figure 2, and the model is solved using the method of backward induction.

4. Modelling Analysis

4.1. Pricing Decision

Initially, we explore the pricing strategies for first-party and third-party products in scenarios where the platform faces no entry capability constraints. The product market operated exclusively by the platform’s own merchandise is denoted by r (retailer), where the platform monopolizes the market. To maximize profits, the platform sets the price of its first-party product at v , resulting in a revenue of π 1 r = v c 1 for the platform in this product market.
The product market characterized by sales exclusively through third-party sellers is represented by m (market), where only third-party sellers’ products are available. To maximize their profits, third-party sellers set the product price at v . In this context, the profit for a third-party seller is π 3 m = ( 1 t ) v c 3 f , while the platform’s revenue is π 1 m = t v + f . For the third-party seller’s profit to be positive ( π 3 m 0 ), the value of the product must satisfy v T f + c 3 1 t . These scenarios are summarized in Proposition 1, with all proofs provided in the Appendix A.
Proposition 1.
In a purely first-party scenario, the optimal pricing for first-party products is set at  v , yielding the platform a profit of π 1 r = v c 1 . In a scenario exclusive to third-party sellers, the optimal pricing for their products is also v , resulting in a profit of π 3 m = ( 1 t ) v c 3 f for the third-party sellers, and the platform’s profit is π 1 m = t v + f .
Comparing the pure first-party model with the pure third-party-seller model across various cost scenarios reveals distinct operational modes for different product value ranges. Detailed market operation modes for these different product values are presented in Table 1. The analysis yields the following insights: If third-party sellers’ products do not offer a clear cost advantage over the platform’s own products, third-party sellers might encounter significant market competition on the platform. Conversely, if the platform’s own products do not have a cost advantage, the market opportunity for third-party sellers will be determined by the cost advantage of their products, with a greater cost advantage leading to a larger market space. Additionally, the platform might select its operational model based on the profit margin of the product market, opting to operate first-party in markets with higher profit margins and allowing third-party sellers to independently operate in markets with lower profit margins. Taking JD.com and PDD as examples, although JD.com’s first-party products have higher costs, it focuses on selling higher-value items such as home appliances and digital products. In contrast, PDD, an exclusive third-party-seller platform, primarily features lower-value products.
In markets for high-value products, third-party sellers are motivated to enter markets traditionally dominated by pure first-party sales. We use h (hybrid) to describe a market model where third-party sellers and first-party products coexist and compete within the same product market. In this model, the strategic use of platform dominance and pricing strategies becomes a key competitive tactic. The positioning of first-party products relative to third-party sellers necessitates a differentiated discussion, primarily due to the significant variance in strategies and their impacts across different pricing environments. For instance, the price discrepancies between first-party and third-party products on major e-commerce platforms such as Amazon reflect complex strategic considerations. In certain categories such as electronics and high-end cosmetics, first-party product prices may exceed those of third-party sellers, potentially indicating the platform’s higher control standards for product quality or its desire to enhance its brand image through high-priced offerings [36]. Conversely, in categories such as daily consumer goods, where first-party product prices are lower than those of third-party sellers, the strategy might be aimed at attracting more consumers to increase market share [5]. Additionally, government regulations on e-commerce platforms profoundly affect their pricing strategies. In some cases, to maintain fair market competition, the government may require that prices of first-party products not exceed those of third-party sellers. The Chinese government has implemented measures to ensure a fair competition environment on e-commerce platforms, influencing the pricing of first-party products [39]. Therefore, in a hybrid model, analyzing the pricing strategies for first-party products requires considering scenarios where prices either exceed or do not exceed those of third-party sellers. Next, we will discuss the pricing strategies and underlying mechanisms for both first-party and third-party sellers under these two scenarios.
We first consider the scenario where the price of first-party products does not exceed that of third-party products. When the prices of first-party and third-party products are equal, consumers generally prefer purchasing first-party products. If the price of first-party products is lower than that of third-party products ( p 1 p 3 ), price-sensitive consumers are inclined to buy first-party products to maximize their utility, presenting the platform with the decision of guiding price-insensitive customers to purchase from either its own offerings or third-party sellers. If the platform directs price-insensitive consumers to its own products, the product market evolves into a purely first-party market, where the platform’s profit is π 1 r = p 1 c 1 . Since the platform’s profit is directly related to pricing at this juncture, the price of first-party products will align with that of third-party sellers ( p 1 = p 3 ), maximizing the platform’s profit to π 1 r = p 3 c 1 . However, if the platform channels price-insensitive users to third-party sellers, a hybrid market model emerges, where a proportion λ of consumers purchase from third-party sellers, and ( 1 λ ) purchase first-party offerings. The platform’s revenue is then derived from a combination of commission and entry fees from third-party-seller sales, plus the revenue from first-party products, calculated as π 1 h = ( 1 λ ) ( p 3 c 1 ) + λ ( p 3 t + f ) . This leads to Proposition 2.
Proposition 2.
If the price of a platform’s own products is at or below that of third-party products, a threshold  p 31 = f + c 1 1 t exists. Below this threshold, the platform directs price-insensitive consumers to third-party products, creating a hybrid market, and prefers earning through commission and entry fees. Above p 31 , it guides these consumers to its own products, potentially excluding third-party sellers and establishing a purely first-party market.
From Proposition 2, it is evident that if the price of first-party products does not exceed that of third-party products, the platform’s ability to direct price-sensitive consumers towards specific sellers imposes a constraint on the pricing of third-party-seller products. This phenomenon is based on the fact that the price equilibrium between first-party and third-party products influences consumer purchasing decisions, and the platform can restrict the pricing of third-party products by managing price-insensitive consumers, thereby optimizing its revenue structure. Such pricing control by the platform over third-party sellers benefits consumers in high-value-product markets. Another interesting observation is that under these conditions, the optimal pricing for third-party sellers on the platform depends solely on the cost of first-party products, the commission rate, and the entry fee, and is independent of the cost of third-party products. This indicates that while enforcing a policy where the price of first-party products cannot exceed that of third-party products may lead the platform to direct some traffic to third-party sellers, creating a hybrid market, the platform retains control over the pricing of third-party products, maintaining a position of advantage over third-party sellers on the platform.
Table 2 examines market models and optimal pricing under various cost structures when first-party-product pricing cannot exceed that of third-party products. Analysis of Table 2 indicates that such pricing restrictions on first-party products alter the guidance strategy for price-insensitive consumers in high-value markets, thereby reducing platform revenue in these areas. If first-party pricing must remain below third-party prices, the platform tends towards exclusively selling its own products in high-value markets. However, third-party sellers, motivated by a cost advantage, may enter these markets, leading to a hybrid market model. Specifically, third-party sellers can survive in low-value markets only if the platform cannot achieve cost optimization. If third-party products fail to offer a cost advantage over first-party products, the platform might use its competitive strength to exclude third-party sellers by optimizing its resource allocation, highlighting the importance for third-party sellers to continually enhance their cost structure and efficiency for survival on the platform.
The pricing strategies of third-party sellers in high-value markets are limited by the platform, indicating that focusing on lower-value markets is a prudent choice for their market positioning. This phenomenon also indirectly exposes the imbalances in market competition, presenting challenges to market fairness. For instance, third-party sellers on platforms such as JD.com, who can secure cost advantages through economies of scale and process optimization, can capture larger market shares in competitive niches. E-commerce platforms such as Amazon or JD.com, with logistical and storage advantages, prefer entering markets dominated by third-party products to amplify their market presence. Yet, even without cost advantages, these platforms can maintain stable revenue streams by imposing commission and fees on third-party sellers, such as Amazon’s FBA service, ensuring continuous operation and business stability.
If the pricing of first-party products exceeds that of third-party products ( p 1 > p 3 ), price-sensitive consumers will opt for third-party products. In scenarios where the platform allocates price-insensitive customers to its own products, a hybrid market model emerges. The platform’s revenue then comprises sales income from its own products and commission and entry fees from third-party sellers, expressed as π 1 h = λ ( p 1 c 1 ) + ( 1 λ ) ( p 3 t + f ) . Since π 1 h is directly proportional to p 1 , the platform’s maximum revenue is π 1 h = λ ( v c 1 ) + ( 1 λ ) ( p 3 t + f ) . When the platform directs a proportion λ of users to third-party sellers, first-party products do not sell, leading to a market exclusively for third-party sellers, with the platform’s revenue being π 1 m = p 3 t + f .
Proposition 3.
Assuming t + λ < 1 , if first-party product pricing is higher than third-party product pricing and v f + c 1 1 t + λ t ( c 1 c 3 ) ( 1 t ) ( 1 t λ ) , the optimal pricing for third-party sellers is v f c 1 t , with a profit of π 3 h = 1 λ 1 t v f c 1 t c 3 f . The platform guides price-insensitive consumers to purchase first-party products, creating a hybrid market model. The optimal pricing for first-party products is v , yielding a profit of π 1 h = λ ( v c 1 ) ; when v < f + c 1 1 t + λ t ( c 1 c 3 ) ( 1 t ) ( 1 t λ ) , the optimal pricing for third-party products is v , with a profit of π 3 m = ( 1 t ) v c 3 f . The platform directs price-insensitive consumers to third-party products, establishing an exclusively third-party market model, with the platform’s profit being π 1 m = t v + f .
Proposition 3 identifies a threshold p 32 = v f c 1 t where the platform’s revenue in a hybrid market model equals that in an exclusively third-party-seller market. When third-party product pricing exceeds this threshold, the platform prefers maintaining an exclusively third-party-seller operational model. Conversely, if third-party product pricing falls below this threshold, the platform adopts a high-price strategy for its first-party products targeted at price-insensitive consumers, while price-sensitive consumers gravitate towards third-party sellers, allowing the platform to earn commission and entry fees from this market segment. Thus, with higher-priced first-party products, adjusting the strategy to direct price-insensitive consumers can effectively mitigate competitive pressure from third-party sellers. For third-party sellers, in markets with smaller profit margins, they capture the entire consumer surplus, whereas in markets with larger profit margins, third-party sellers may reduce product prices to gain more market share, resulting in a positive consumer surplus. In a hybrid model, third-party-seller pricing positively correlates with product value, contrasting with Proposition 2, which emphasizes the fixed nature of third-party-seller pricing in a hybrid market.
Table 3 presents the optimal pricing and market operation modes for both the platform and third-party sellers when p 1 > p 3 . The analysis of market models and optimal pricing under various cost conditions indicates that third-party sellers can coexist with first-party products in high-value markets, even in the absence of a cost advantage. This coexistence is facilitated by price-sensitive consumers opting for the more affordably priced third-party products. It is observed that the platform adjusts its strategy for directing price-insensitive consumers based on the price differential between its own and third-party products. If first-party product pricing is at or below third-party product pricing, the platform directs price-insensitive consumers to its own products when third-party pricing is higher; conversely, it guides them towards third-party products when their pricing is lower. However, when first-party product pricing is above that of third-party products, and if third-party pricing is relatively higher, the platform will direct price-insensitive consumers to third-party products; otherwise, it will lead them to its own products. Moreover, when first-party product pricing is above that of third-party products and third-party sellers have a cost advantage, the market space for an exclusively third-party-seller model is broader compared to when first-party product pricing is not above third-party product pricing.
Analyzing the pricing of first-party products and third-party-seller products reveals that the price of first-party products ( p 1 ) either matches that of third-party products ( p 3 ) or reaches the maximum value ( v ). When the platform has a cost advantage and p 1 = p 3 , it allocates price-insensitive consumers to its own products, resulting in a purely first-party market model with the platform’s profit being π 1 r = p 3 c 1 . If the price of first-party products can exceed that of third-party products, the platform also directs price-insensitive consumers to its own products, leading to a hybrid market model. The platform’s profit in this scenario is π 1 h = λ ( v c 1 ) + ( 1 λ ) ( p 3 t + f ) . Comparing the platform’s revenue across these scenarios leads to Proposition 4.
Proposition 4.
When the platform has a cost advantage, it directs price-insensitive consumers to purchase first-party products. If third-party-seller pricing ( p 3 ) exceeds a specific threshold ( p 33 ), the platform opts to sell its own products in that market, setting the optimal price for first-party products at p 3 with profits of π 1 r = p 3 c 1 . If p 3 p 33 , the platform chooses to create a hybrid market model, where the optimal price for first-party products is v , resulting in platform profits of π 1 h = λ ( v c 1 ) + ( 1 λ ) ( t p 33 + f ) . The optimal pricing for third-party sellers is p 3 = p 33 , yielding profits of π 3 h = ( 1 λ ) ( ( 1 t ) p 33 c 3 f ) , where p 33 = λ v + ( 1 λ ) ( f + c 1 ) 1 t ( 1 λ ) .
Proposition 4 explores the strategies employed by a platform with a cost advantage to direct price-insensitive consumers, as well as the pricing strategies for first-party and third-party products across different market models. According to Proposition 4, the platform always prefers guiding price-insensitive consumers to its first-party products when it has a cost advantage, regardless of third-party product pricing. When third-party products are priced higher, the platform’s pricing strategy for its own products aligns with that of third-party products. Under such pricing parity, consumers typically favor first-party products, leading to a hybrid market model, even if third-party products might not achieve sales. As third-party product pricing decreases to the threshold p 33 , first-party product pricing shifts to v , attracting price-sensitive consumers towards third-party products, from which the platform earns commission and entry fees. This pricing strategy shift highlights the platform’s ability to flexibly adjust its pricing strategies based on market conditions to balance its interests with consumer demands and mitigate competition between first-party and third-party sellers.
In scenarios where the platform lacks a cost advantage, the market for high-quality products becomes a hybrid model. The platform must decide whether its first-party product pricing matches or exceeds third-party product pricing. Without a cost advantage, if p 1 = p 3 , the platform directs price-insensitive consumers to third-party products, with its profit being π 1 h 1 = λ ( p 3 t + f ) + ( 1 λ ) ( p 3 c 1 )   p 1 > p 3 . If p 1 > p 3 , the platform assigns price-insensitive consumers to its own products, with its profit being π 1 h 2 = λ ( v c 1 ) + ( 1 λ ) ( p 3 t + f ) . Comparing the platform’s revenue across these scenarios leads to Proposition 5.
Proposition 5.
If first-party products lack a cost advantage yet still enter the market, their price is invariably set at  v . When p 3 > p 34 , the platform steers price-insensitive consumers towards these third-party offerings. The optimal pricing for third-party products is set at v , leading to a profit of π 3 h 1 = λ ( ( 1 t ) v f c 3 ) , while the profit for first-party products is calculated as π 1 h 1 = λ ( v t + f ) + ( 1 λ ) ( v c 1 ) . When p 3 p 34 , the platform influences price-insensitive consumers to purchase its own products. Under these conditions, the optimal pricing for third-party products is p 34 , with their resulting profit being π 3 h 2 = ( 1 λ ) ( ( 1 t ) p 34 f c 3 ) , and the platform’s profit is π 1 h 2 = λ ( v c 1 ) + ( 1 λ ) ( t p 34 + f ) . Here, p 34 = λ v + ( 1 2 λ ) ( f + c 1 ) λ t + ( 1 t ) ( 1 λ ) .
Proposition 5 examines the strategies a platform without a cost advantage uses to direct price-insensitive consumers upon entering the market, alongside the pricing strategies for both first-party and third-party products in a hybrid model. Analyzing the profits of third-party sellers under the two scenarios described in Proposition 5 reveals that the proportion of price-insensitive consumers on the platform plays a crucial role in shaping third-party sellers’ pricing decisions, leading to Corollary 1.
Corollary 1.
If first-party products enter the market without a cost advantage, the optimal pricing strategy for third-party products is set at  p 34 when 0 λ < 0.5 ; for cases where 0.5 < λ 1 , the optimal pricing for third-party sellers shifts to v .
Corollary 1 suggests that an increase in the proportion of price-insensitive consumers leads to higher prices for third-party products. Specifically, as the platform’s influence on consumers increases, it benefits third-party product pricing and can alleviate competition between first-party and third-party products in a hybrid model. This is because an increase in the proportion of price-insensitive consumers on the platform often results in strategies that guide these consumers towards purchasing from third-party sellers. In setting their prices, third-party sellers are more inclined to opt for higher pricing, positively impacting both their own and the platform’s profits.
Table 4 presents the optimal pricing and market operation modes for the platform and third-party sellers, revealing that an increased cost advantage of first-party products leads to a greater market share in exclusive markets. However, the platform opts to leave a portion of the lower-value-product markets to third-party sellers, forming an exclusive third-party-seller model, only when third-party sellers have a significant cost advantage, specifically when c 1 f + c 3 1 t . Conversely, in most scenarios, regardless of whether first-party products have a cost advantage, the platform chooses to enter, resulting in either an exclusive first-party model or a hybrid market model. When first-party products have a cost advantage, the presence of third-party products limits the pricing of first-party products within the low-value product range [ f + c 3 1 t , f + c 3 1 t + ( 1 λ ) ( c 3 c 1 ) λ ) . When the platform lacks a cost advantage, its first-party product pricing remains unaffected by the entry of third-party sellers. This is due to the platform’s ability to guide price-insensitive consumers and its power to charge commission and entry fees from third-party sellers, allowing it to optimize its revenue structure under various scenarios. Taking JD.com as an example, its premium logistics services lead to higher costs for its first-party products, typically resulting in pricing above that of third-party products. Currently, JD.com opts to enter only high-value markets, leaving lower-value markets to third-party sellers. However, JD.com’s recent announcement of expanding into all product categories indicates the platform’s desire to enter more product spaces.

4.2. Market Entry Strategy

Our previous analysis discussed the operational modes of first-party products in various cost scenarios without entry capability restrictions. However, in reality, first-party products cannot cover all types of products in the market. This section delves into the entry strategies of the platform and third-party sellers under limited first-party entry capabilities and their implications.
Assuming all product markets initially operate under an exclusive third-party model, where only third-party sellers participate in sales, in this model, third-party sellers enter a product market only if it is profitable ( π 3 m 0 ), i.e., they enter an exclusive third-party market only when the product value meets or exceeds a threshold value v v T = f + c 3 1 t . Once first-party products enter a market, it transitions to a hybrid model. Similarly, third-party sellers will continue selling in a hybrid market only if their profits satisfy π 3 h 0 .
Corollary 2.
Third-party sellers choose to enter the market when the product value satisfies  v v T .
Corollary 2 indicates that the platform’s product scale is influenced by the commission rate and entry fee. Specifically, the platform’s product space is maximized when no commission or entry fee is charged ( t = 0 , f = 0 ). Conversely, higher commission rates or entry fees may constrict market space, potentially leaving no products for sale on the platform. High commission or entry fees raise the entry barrier for third-party sellers, dampening their enthusiasm to participate. Notably, the threshold product value v T for third-party market entry is unaffected by platform entry. As v T decreases, the variety of products offered by third-party sellers in the market increases, leading to an expansion in product market scale.
The platform can earn revenue by charging active third-party sellers commission and entry fees, but the entry of first-party products encroaches upon the market demand for original third-party products. Before entering the market, the platform must compare two types of income: direct sales revenue from first-party products and the reduced commission and entry fee income from third-party sellers due to the entry of first-party products. The boundary condition for first-party-product market entry can be derived as v v M = f + c 1 1 t .
Corollary 3.
Given the capability to enter, the platform will only venture into third-party sellers’ product markets when  v v M = f + c 1 1 t .
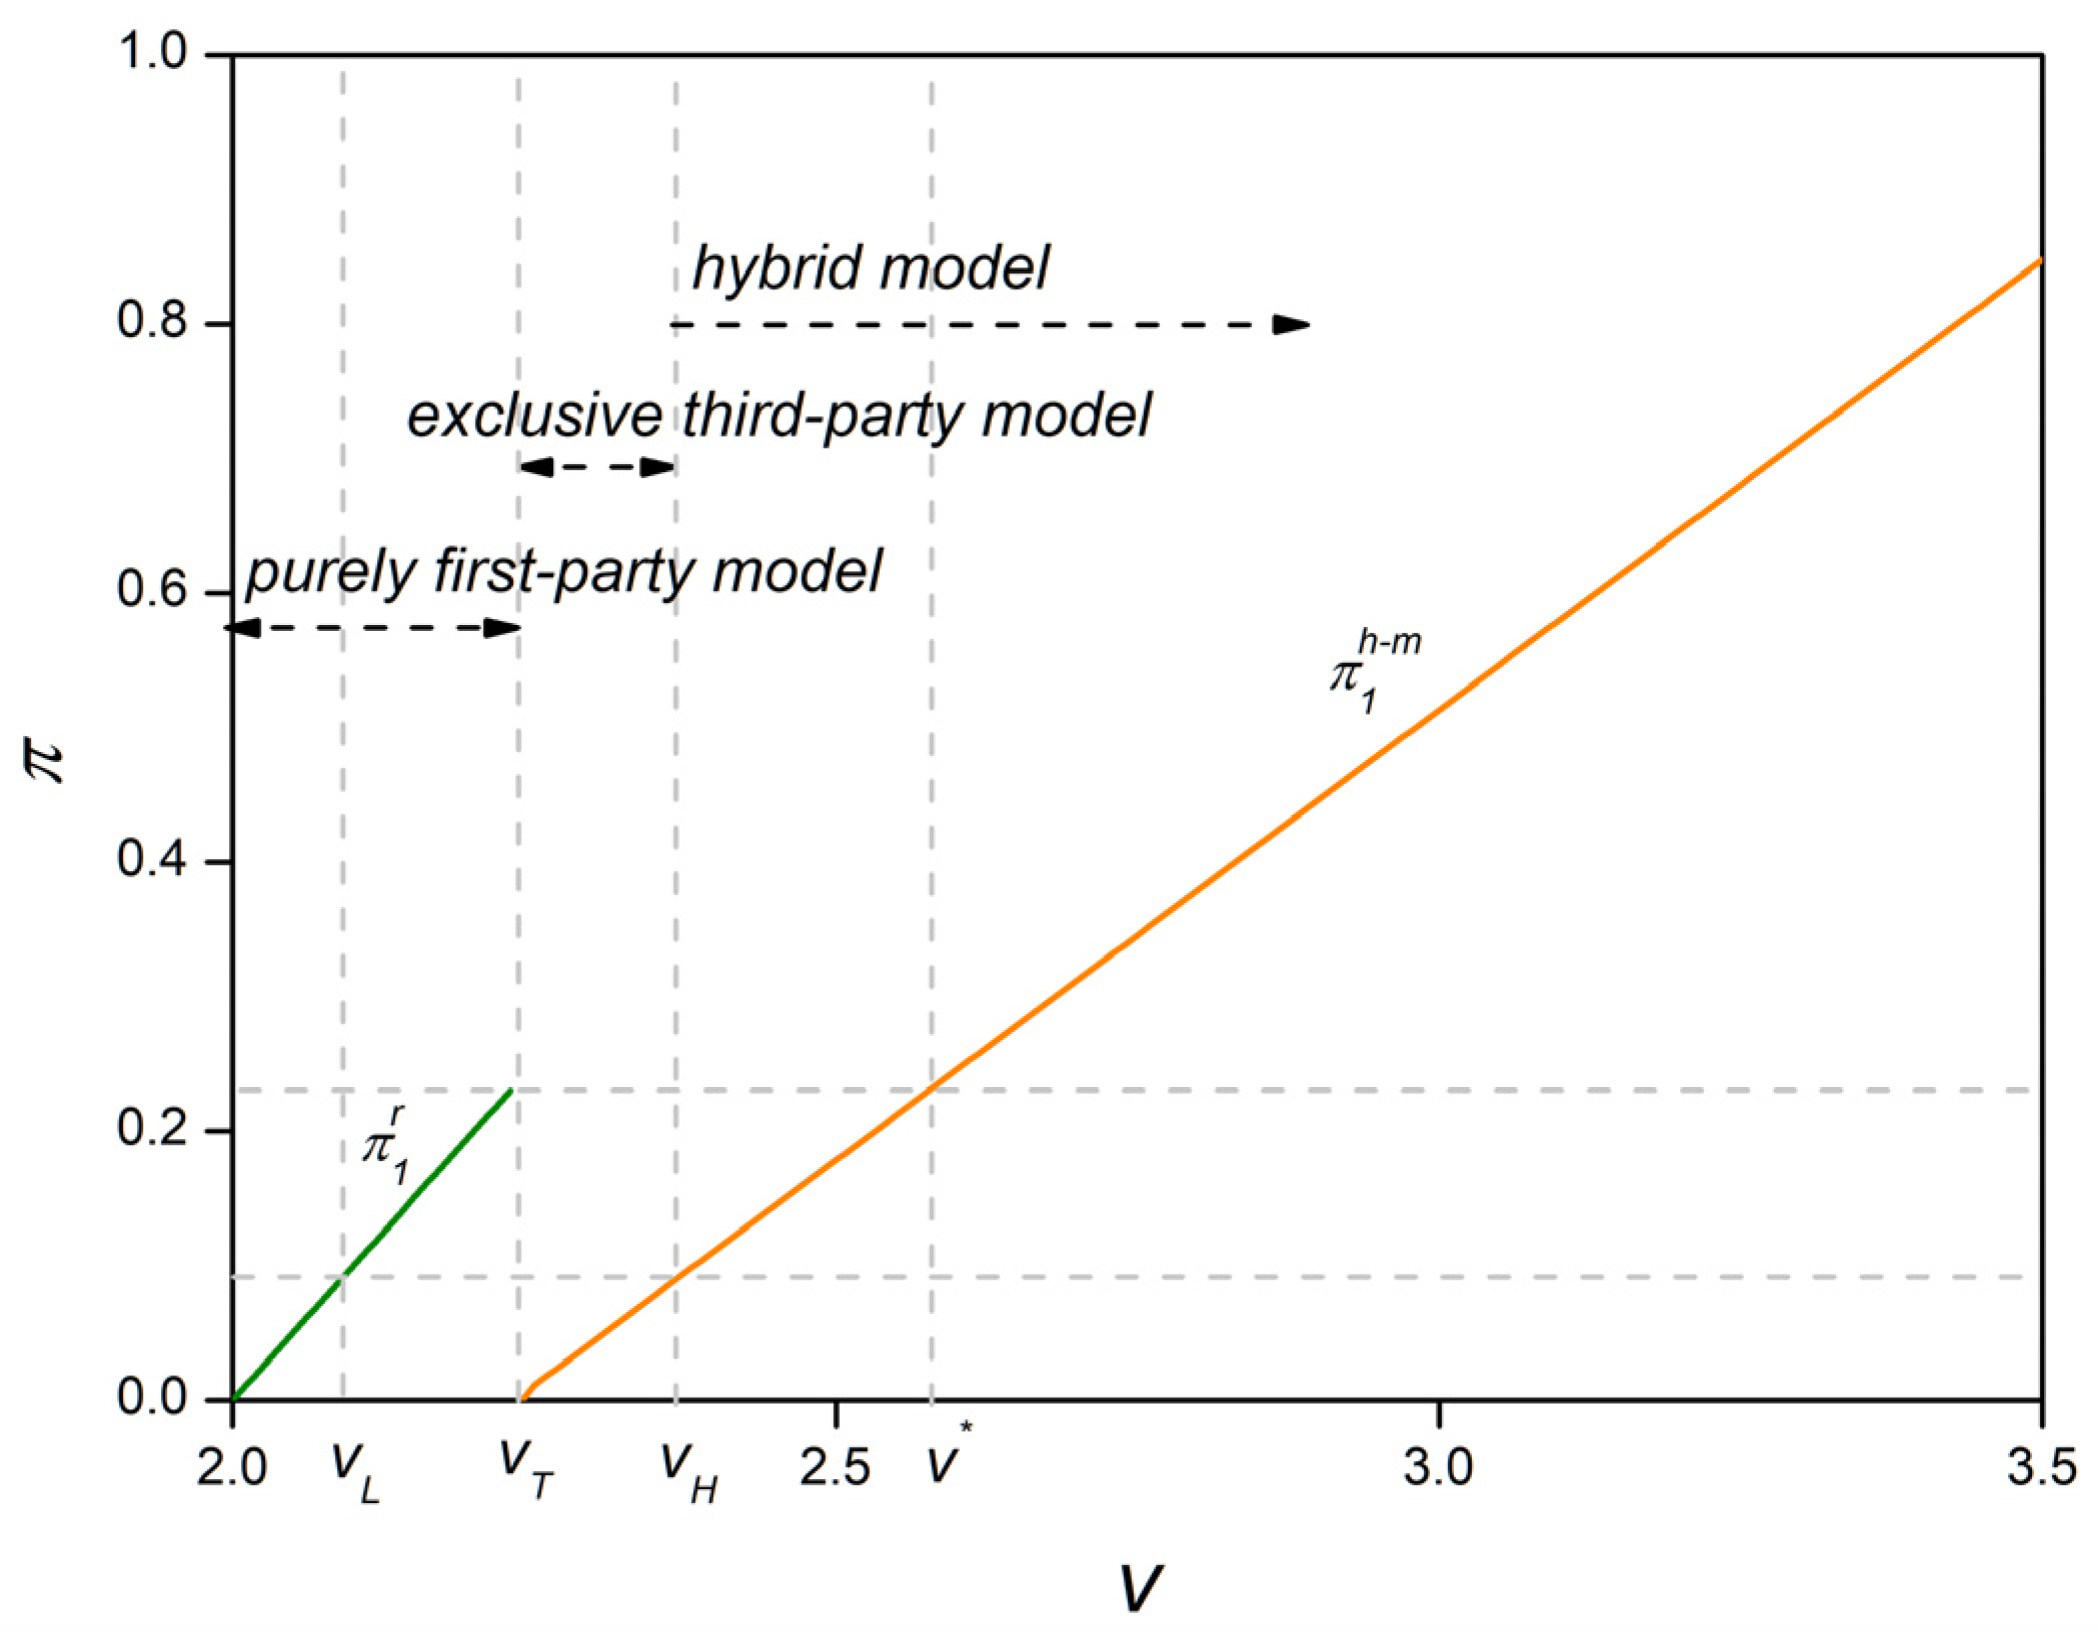
Assuming no cost difference between first-party and third-party products ( c 1 = c 3 = c ) and more than half of the consumers are price-insensitive ( 1 2 < λ 1 ) , with unrestricted entry capability for first-party products, the market operates under a pure first-party model in the range [ c , v T ) and shifts to a hybrid model for [ v T , + ) . In the hybrid model, the marginal profit for first-party products entering the market is Δ π 1 h m = λ ( v c ) + ( 1 λ ) ( p 3 t + f ) t v f , where p 3 = λ v + ( 1 λ ) ( f + c ) 1 t ( 1 λ ) . It is observed that Δ π 1 h m v > 0 always holds, indicating that the higher the product value (and thus the larger the profit margin), the more incentivized the platform is to enter the product market. The motivation for platform entry diminishes as t and f increase, suggesting that when the platform can obtain higher commission and entry fees from third-party sellers, it lacks the incentive to enter the product market. Since Δ π 1 h m v > 0 and π 1 r v > 0 , indicating higher product values yield greater platform profits, the platform prioritizes its limited entry capability towards markets with higher product values. There exists a critical point v * v T such that Δ π 1 h m ( v * ) = π 1 r ( v T ) .
Corollary 4.
With limited entry capability, the platform prioritizes high-value-product markets ( v > v * > v T ). Only when surplus entry capability exists does it consider entering markets with v < v * .
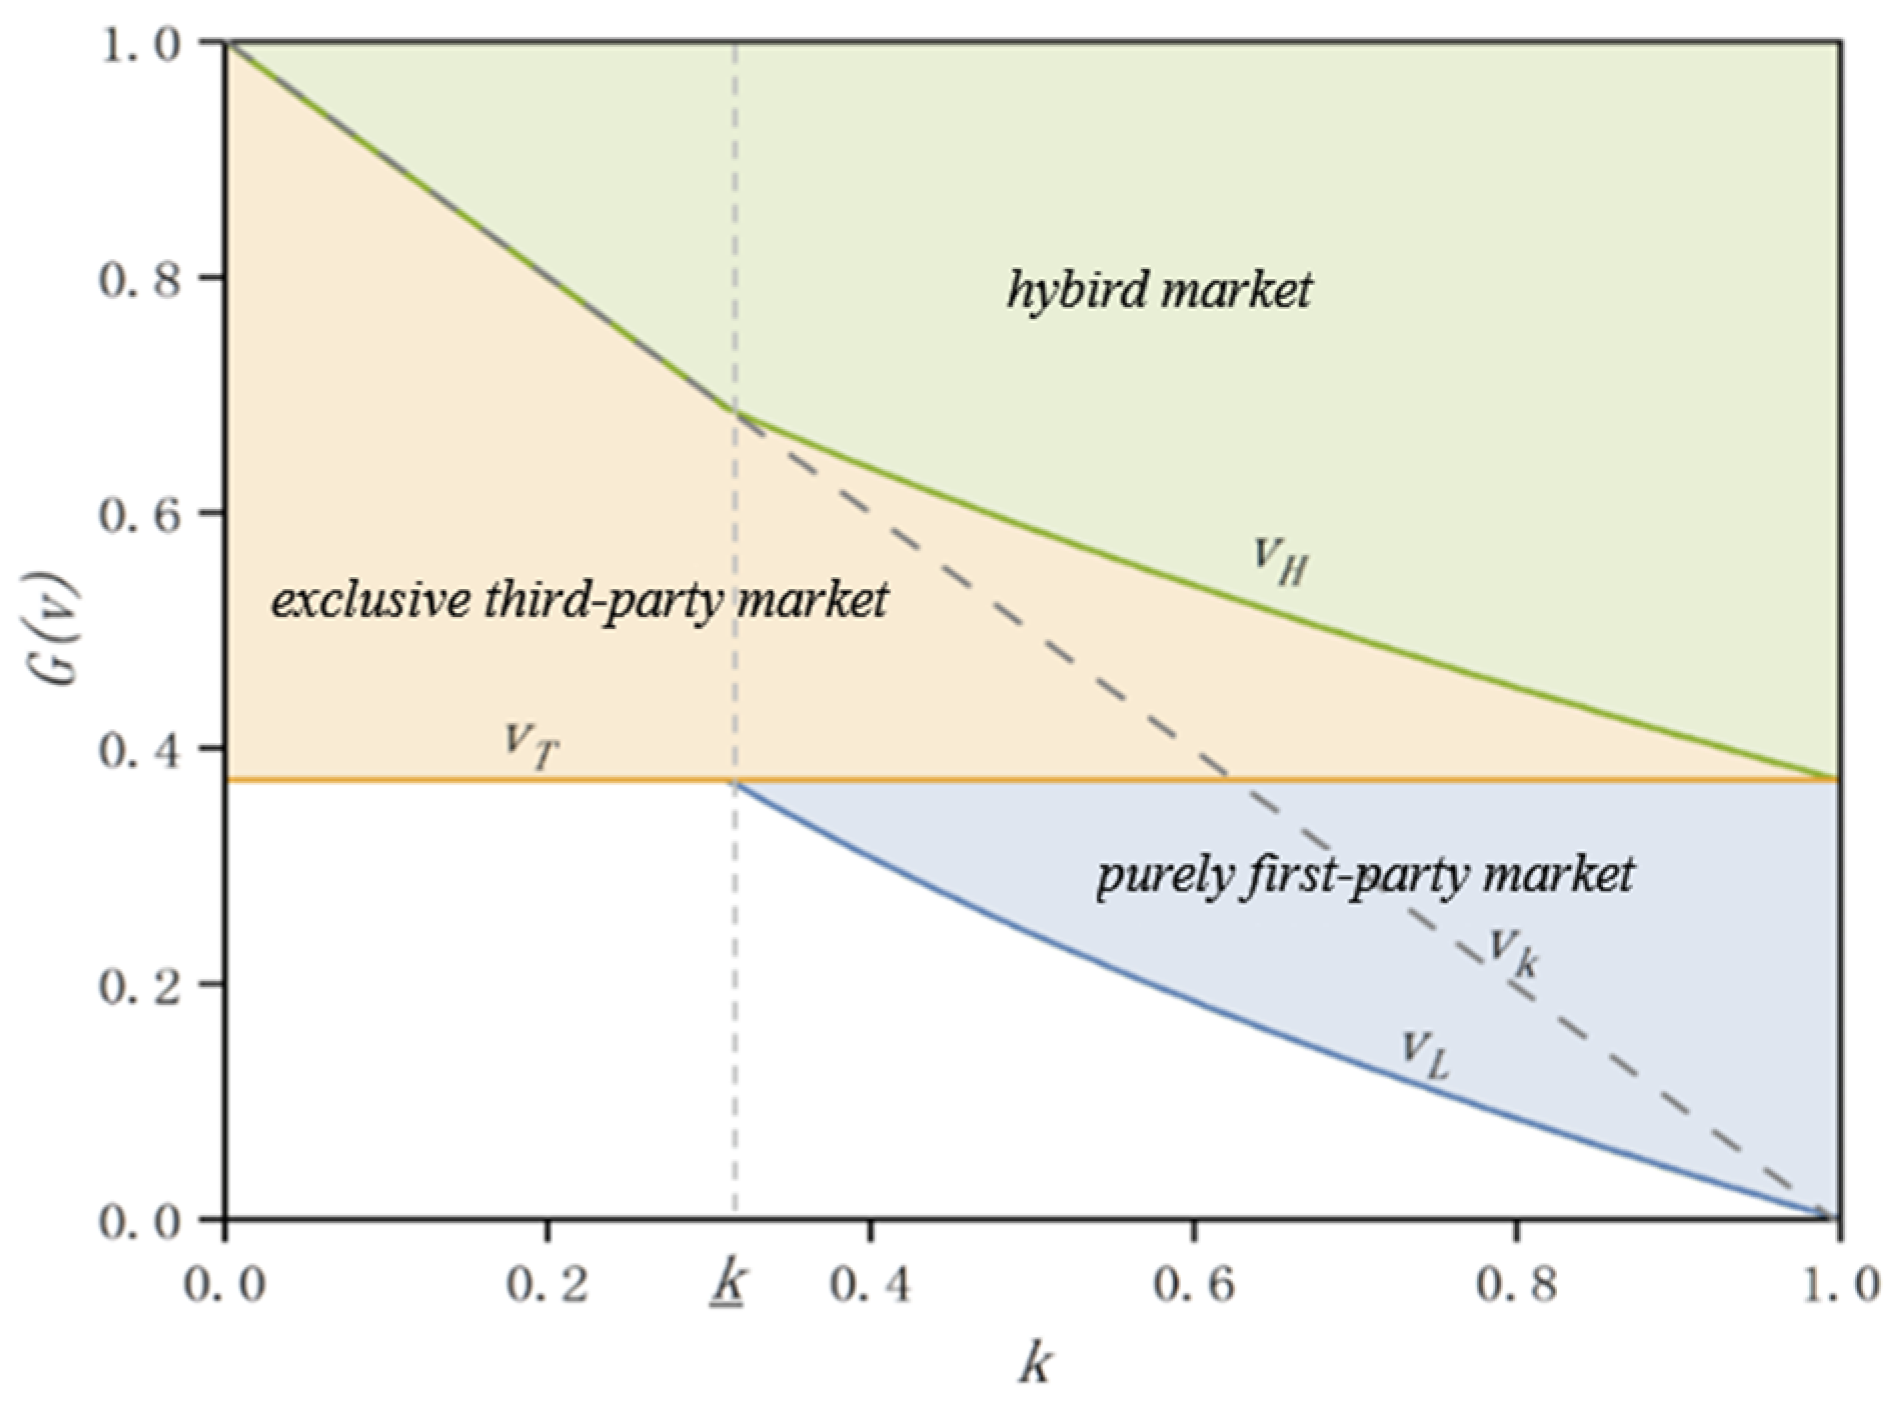
Defining the critical entry capability as k ̱ = 1 G ( v * ) , when the platform’s entry capability k k ̱ , it aims for maximum profit by allocating all available entry capability to high-value markets ( v > v * ). The lowest-value market the platform enters is determined by v k = G 1 ( 1 k ) . As shown in Figure 3, when platform entry capability k > k ̱ , not only can the platform enter high-value markets, but it also has the excess capability to enter lower-value markets. The platform then faces the decision of entering hybrid model markets within v T < v < v * or exclusively first-party markets with < v T . Defining c 1 v L < v T and v T v H < v * such that Δ π 1 h m ( v H ) = π 1 r ( v L ) equates the marginal profits from entering a purely first-party market at v L and the marginal profits from entering a hybrid market at v H , assuming a product value distribution G ( v ) = 1 e ( v c ) γ , where c is the cost (ignoring cost differences between first-party and third-party products) and γ > 0 . The rationale for utilizing this exponential distribution is that it not only captures the entire spectrum of heterogeneous product spaces but also ensures that a small fraction of high-value products generate the majority of sales revenue. This aligns with real-world observations and adheres to the 80/20 rule (the Pareto principle). Combining Δ π 1 h m ( v H ) = π 1 r ( v L ) with 1 G ( v L ) [ G ( v H ) G ( v L ) ] = 1 yields:
v L = γ c 1 [ 1 t + t 2 ( 1 λ ) ] + [ t ( 1 λ ) λ ] [ ( 1 t ) ( ln k ) γ c 3 ] γ ( 1 t ) 2 + [ 1 + t ( 1 t ) ] λ γ
v H = f γ [ 1 + λ + t ( t 2 + λ t λ ) ] ( 1 t ) ( 1 t + t λ ) ln k + γ c 1 ( 1 t ) ( t λ t + λ ) + γ c 3 ( 1 t + t λ ) γ ( 1 t ) 3 + [ 1 + t 2 ( 2 t ) ] λ γ
Proposition 6.
Under varying levels of entry capability, the platform’s market dynamics are as follows:
  • Scenario I: When the platform has limited entry capability ( k k ̱ ), markets within the range [ v T , v k ] operate under an exclusive third-party-seller model, and markets in the range [ v k , + ] adopt a hybrid model.
  • Scenario II: With moderate entry capability  k ̱ < k < 1 , markets in the range  [ c , v T ]  are purely first-party, those within  [ v T , v H ]  are exclusively third-party, and markets extending from  [ v H , + ]  function as hybrid models.
  • Scenario III: When the platform’s entry capability is unrestricted ( k = 1 ), markets ranging from  [ c , v T ]  are purely first-party, while those in the range  [ v T , + ]  transition to a hybrid model.
Figure 4 illustrates the operational modes of product markets under different levels of entry capability. In an extremely limited entry capability scenario ( k k ̱ ), the market exhibits characteristics of Scenario I, where the platform prioritizes entry into higher-value markets, leaving the long-tail markets to third-party sellers. As the platform’s entry capability increases, the proportion of markets operating exclusively under third-party sellers decreases, while the share of hybrid model markets gradually increases. In Scenario II, with moderate entry capability ( k ̱ < k < 1 ), the platform competes in high-value-product markets with third-party sellers and ventures into markets not yet reached by third-party sellers for direct sales. The composition of the platform’s revenue shifts towards a higher proportion from direct sales of first-party products, with a relative decrease in commission and fees from third-party sellers. Scenario III reflects the market mode when the platform has unrestricted entry capability, entering all markets occupied by third-party sellers and those not reached by them, transforming all exclusive third-party-seller markets into hybrid model markets.
From this analysis, it is clear that the platform’s operational strategy is closely linked to its entry capability. When choosing which product categories and models to enter, the platform must weigh its entry capability. Research by Zhu and Liu [5] shows that Amazon continuously enters product spaces dominated by third-party sellers, with the products entered by Amazon having excellent customer reviews and high sales volumes. This aligns with our study’s findings on the platform’s entry strategy for high-value-product markets. Moreover, the platform’s entry reduces the proportion of markets operating under an exclusive third-party-seller model, intensifying competition between the platform and third-party sellers. A greater entry capability allows the platform to venture into markets not covered by third-party sellers, expanding its product assortment. The choice of operational mode under limited entry capability, as discussed in this study, adds to the understanding of long-tail theory by examining the drivers behind retailers introducing lower-value products, complementing research by Bar-Isaac et al. [40], Yang [41], and Hervas-Drane [42].

4.3. Fee Structure Adjustment Strategy

The preceding analysis underscores the significant impact of the commission and entry fees the platform charges third-party sellers. This section focuses on the platform’s strategy for adjusting the commission rate ( t ) and entry fee ( f ) under various cost scenarios. Assuming the platform’s optimal commission rate and entry fee are ( t * , f * ) , a decrease in the entry fee by ε > 0 results in a new entry fee f = f * ε > 0 . There exists a pair ( t , f ) such that the threshold value v T ( t , f ) = v T ( t * , f * ) , keeping the third-party seller’s entry strategy unchanged. It follows that t = t * + ε ( 1 t * ) f * + c 3 , implying t > t * . The platform’s shift from ( ( t * , f * ) to ( t , f ) indicates a reduction in the entry fee charged to third-party sellers and an increase in the commission rate on their sales revenue. This change in the platform’s fee structure affects its revenue in exclusively third-party and hybrid model markets ( π 1 m and π 1 h ) but not in purely first-party markets ( π 1 r ).
In exclusively third-party markets, the platform’s revenue change from ( t * , f * ) to ( t , f ) is π 1 m ( t , f ) π 1 m ( t * , f * ) = ε [ v ( 1 t * ) ( f * + c 3 ) ] f * + c 3 . Given v v T = f + c 3 1 t , it follows that π 1 m ( t , f ) π 1 m ( t * , f * ) always holds, meaning reducing the entry fee ( f ) and increasing the commission rate ( t ) on third-party sales enhances the platform’s revenue in exclusively third-party markets.
After the platform changes its fee structure from ( t * , f * ) to ( t , f ) , the revenue change in the hybrid market model is given by π 1 h ( t , f ) π 1 h ( t * , f * ) . Setting π 1 h ( t , f ) π 1 h ( t * , f * ) = 0 allows for the derivation of v = f * + c 3 1 t * + ( 1 λ ) ( c 3 c 1 ) λ . When the platform has a cost advantage ( c 1 < c 3 ) , reducing the entry fee ( f ) and increasing the commission rate ( t ) on third-party sales results in a decrease in platform revenue within the range [ f * + c 3 1 t * , f * + c 3 1 t * + ( 1 λ ) ( c 3 c 1 ) λ ) ; however, the platform’s revenue increases in the range [ f * + c 3 1 t * + ( 1 λ ) ( c 3 c 1 ) λ , + ) . If the platform does not have a cost advantage ( c 1 > c 3 ) , then the platform’s revenue increases across the range [ f * + c 3 1 t * , + ) .
Proposition 7.
In exclusively third-party-seller markets, the platform charges a commission rate but no entry fee. In hybrid markets, if first-party products lack a cost advantage, the platform does not charge third-party sellers an entry fee; if first-party products have a cost advantage, the platform charges an entry fee in low-value hybrid markets but only charges a commission in other product ranges.
Proposition 7 indicates that, in most cases, a commission system based on third-party sales revenue is more efficient than charging entry fees, leading platforms to reduce or even eliminate entry fees for third-party sellers. This is because platforms can achieve significant revenue from high-value goods markets by extracting a commission on sales revenue. However, in markets with relatively low product values, especially where the platform has a significant cost advantage, platforms prefer charging entry fees to third-party sellers to enhance revenue due to the lower profit margins of such products. According to Alibaba’s 2021 platform operation environment report [43], Alibaba is working to simplify the merchant entry process and reduce entry costs to improve business efficiency, aligning significantly with our research findings.
5. Extension

5.1. Policy Regulation: Should Hybrid Models Be Prohibited?

As the platform economy rapidly evolves, issues of unfair competition and regulatory concerns have become increasingly prominent. A primary concern for regulators is the legitimacy of platforms’ dual roles, raising the possibility that prohibiting hybrid models may be necessary. While hybrid models dominate the market landscape in real-world business environments, the Indian government has explicitly banned Amazon from selling its own branded products on its platform. Research by Anderson and Defolie [7] suggests that hybrid models are inherently anti-competitive, leading to reduced third-party-seller participation and increased consumer prices post-market entry by first-party products. Contrarily, this paper, through the development of an inelastic demand model, delves into the impact of hybrid models from the perspective of total social welfare, arriving at conclusions that partially diverge from those of Anderson and Defolie [7].
In this model, total consumer surplus is defined as: C S = ( 1 λ ) v H + ( v p 3 ) g ( v ) d v , representing the surplus derived from the difference between the value and selling price of third-party products in hybrid markets, as well as the extent of product space. In markets exclusively managed by first-party or third-party sellers, consumer surplus equals zero. The total revenue for all third-party sellers in the market is: Π 3 = v T v H π 3 m g ( v ) d v + v H + π 3 h g ( v ) d v , the sum of third-party-seller revenues in exclusively third-party and hybrid markets. Market conditions under entry capability restrictions lead to the outlined platform total revenues across the three scenarios. With limited entry capability ( k k ̱ ), the platform’s total revenue is Π 1 I = v T v k π 1 m g ( v ) d v + v k + π 1 h g ( v ) d v . With moderate entry capability ( k ̱ < k < 1 ) , the platform’s total revenue is Π 1 I I = v L v T π 1 r g ( v ) d v + v T v H π 1 m g ( v ) d v + v H + π 1 h g ( v ) d v . Without entry capability restrictions ( k = 1 ), the platform’s total revenue is Π 1 I I I = c 1 v T π 1 r g ( v ) d v + v T + π 1 h g ( v ) d v .
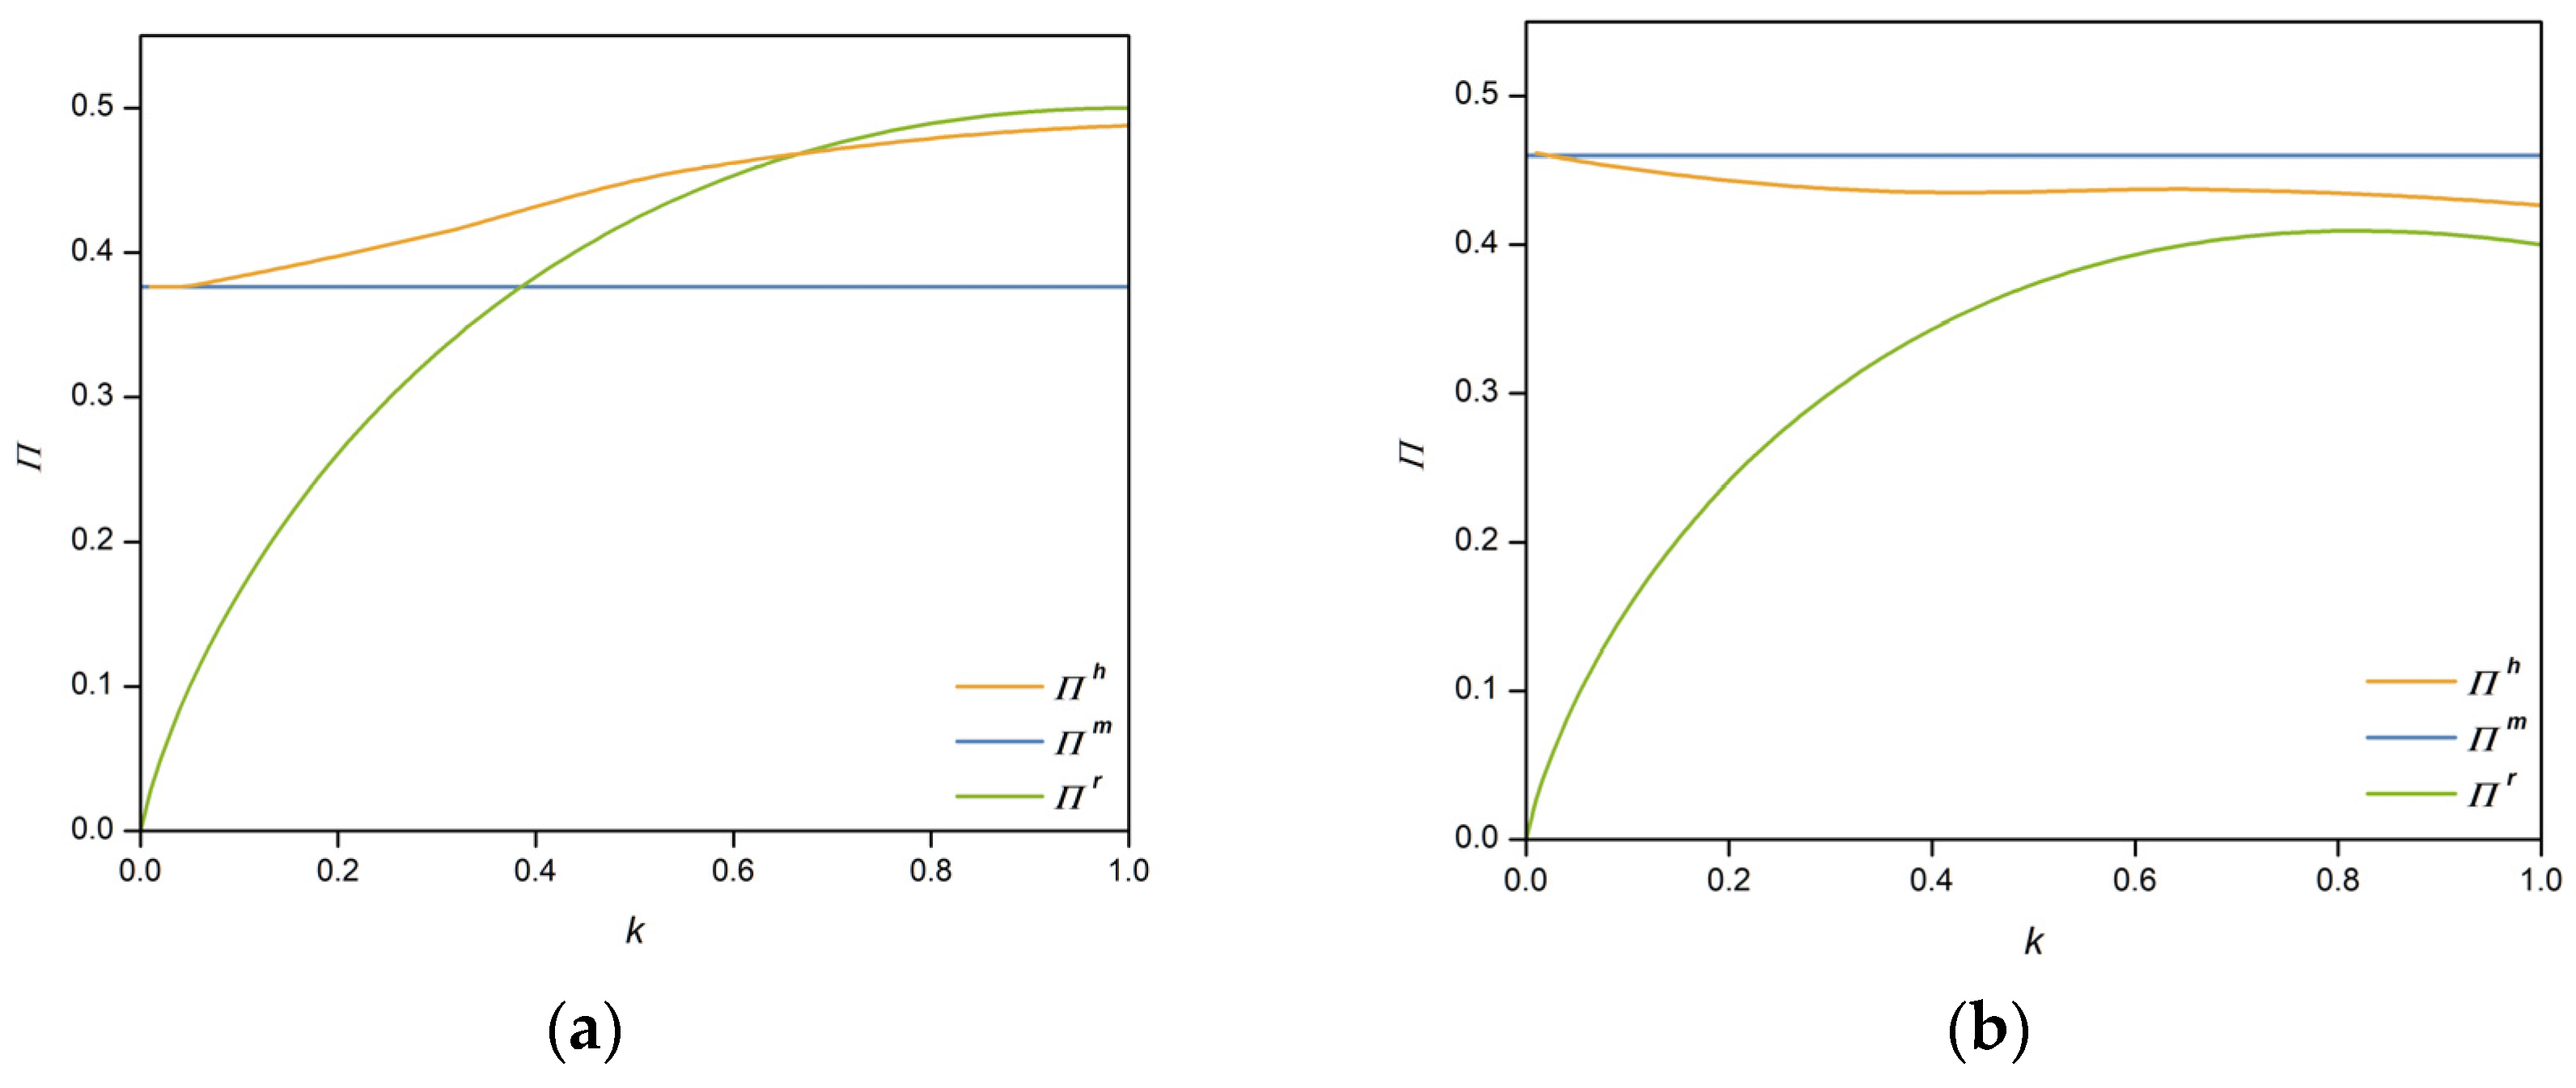
Prohibiting hybrid models in the market would limit platforms to operating exclusively as either third-party sellers or first-party platforms. Should the platform opt for the exclusive third-party-seller model, total social welfare is Π m = v T + ( v c 3 ) g ( v ) d v . Choosing to operate as an exclusive first-party platform, social welfare is Π r = v M + ( v c 1 ) g ( v ) d v . Figure 5a,b compare total social welfare across the three models as a function of platform entry capability, with and without cost advantages ( c 1 < c 3   a n d   c 1 > c 3 ), leading to Proposition 8.
Proposition 8.
Prohibiting the existence of hybrid models in the market could negatively impact consumer welfare. If hybrid models were banned, platforms with a cost advantage would opt for an exclusive third-party-seller model with limited entry capability and switch to an exclusive first-party model with greater entry capability; such prohibition might initially decrease then eventually increase total social welfare. If the platform lacks a cost advantage, total social welfare under an exclusive third-party-seller model could surpass that of a hybrid model, which in turn exceeds the welfare under an exclusive first-party model, suggesting that banning hybrid models could enhance total social welfare.
Proposition 8 suggests that prohibiting hybrid models could disadvantage consumer welfare and, in certain scenarios, negatively affect total social welfare. Under an exclusive first-party model, third-party sellers’ profits drop to zero. Limitations on platform entry capability also lead to reduced product diversity, hence platform entry can increase total social welfare. However, as the entry capability of cost-advantaged platforms increases, hybrid markets may decrease total social welfare compared to exclusive first-party models. In exclusive third-party-seller markets, entry by cost-advantaged first-party products can break existing oligopolies, increasing market competition, diversifying product offerings, and enhancing consumer surplus. When first-party products do not have a cost advantage, it is advisable to prohibit platform entry into exclusive third-party-seller markets, encouraging platforms to operate under an exclusive third-party model rather than an exclusive first-party or hybrid model. Thus, regulatory measures that outright prohibit hybrid models are not advisable. When first-party products have a cost advantage, and the platform’s entry capability is moderate to low, the government should not prohibit product markets from adopting hybrid models.

5.2. Policy Regulation: How Should Taxes Be Levied on Platform Revenues?

Since 2019, France has implemented a 3% digital services tax (DST) targeting revenues from digital interface services, advertising services based on user data, and the transmission of user data. This tax applies to all digital service revenues generated by platforms, including direct advertising and user data services offered by the platforms themselves. Companies with annual global revenues exceeding €750 million and French revenues exceeding €25 million are subject to this tax. The objective is to ensure that technology companies generating substantial income in the French market pay appropriate taxes, thereby increasing the tax rate on self-operated revenues [44].
In contrast, Canada’s DST specifically targets third-party revenues from online marketplace services. This includes service fees collected by platforms from third-party sellers, such as fees for advertising space and data transmission services provided to these sellers. Specifically, Canada’s digital services tax encompasses revenues generated from transactions conducted by third-party merchants on the platform, which may involve the supply of physical goods or purely digital services. The Canadian DST also includes a CAD 20 million exemption threshold for these third-party revenues, with only the portion exceeding this amount being taxable [45].
The approach to DST varies across countries, leading to ongoing debate over the taxation of platform sales revenues [46]. We categorize platform sales revenues into self-operated sales and revenues generated from services provided to third-party sellers. Using the established model, we will examine the impact of differential taxation on these revenues under conditions of asymmetric costs and varying entry capabilities. This analysis aims to elucidate the implications of differentiated tax policies on platform-generated income.
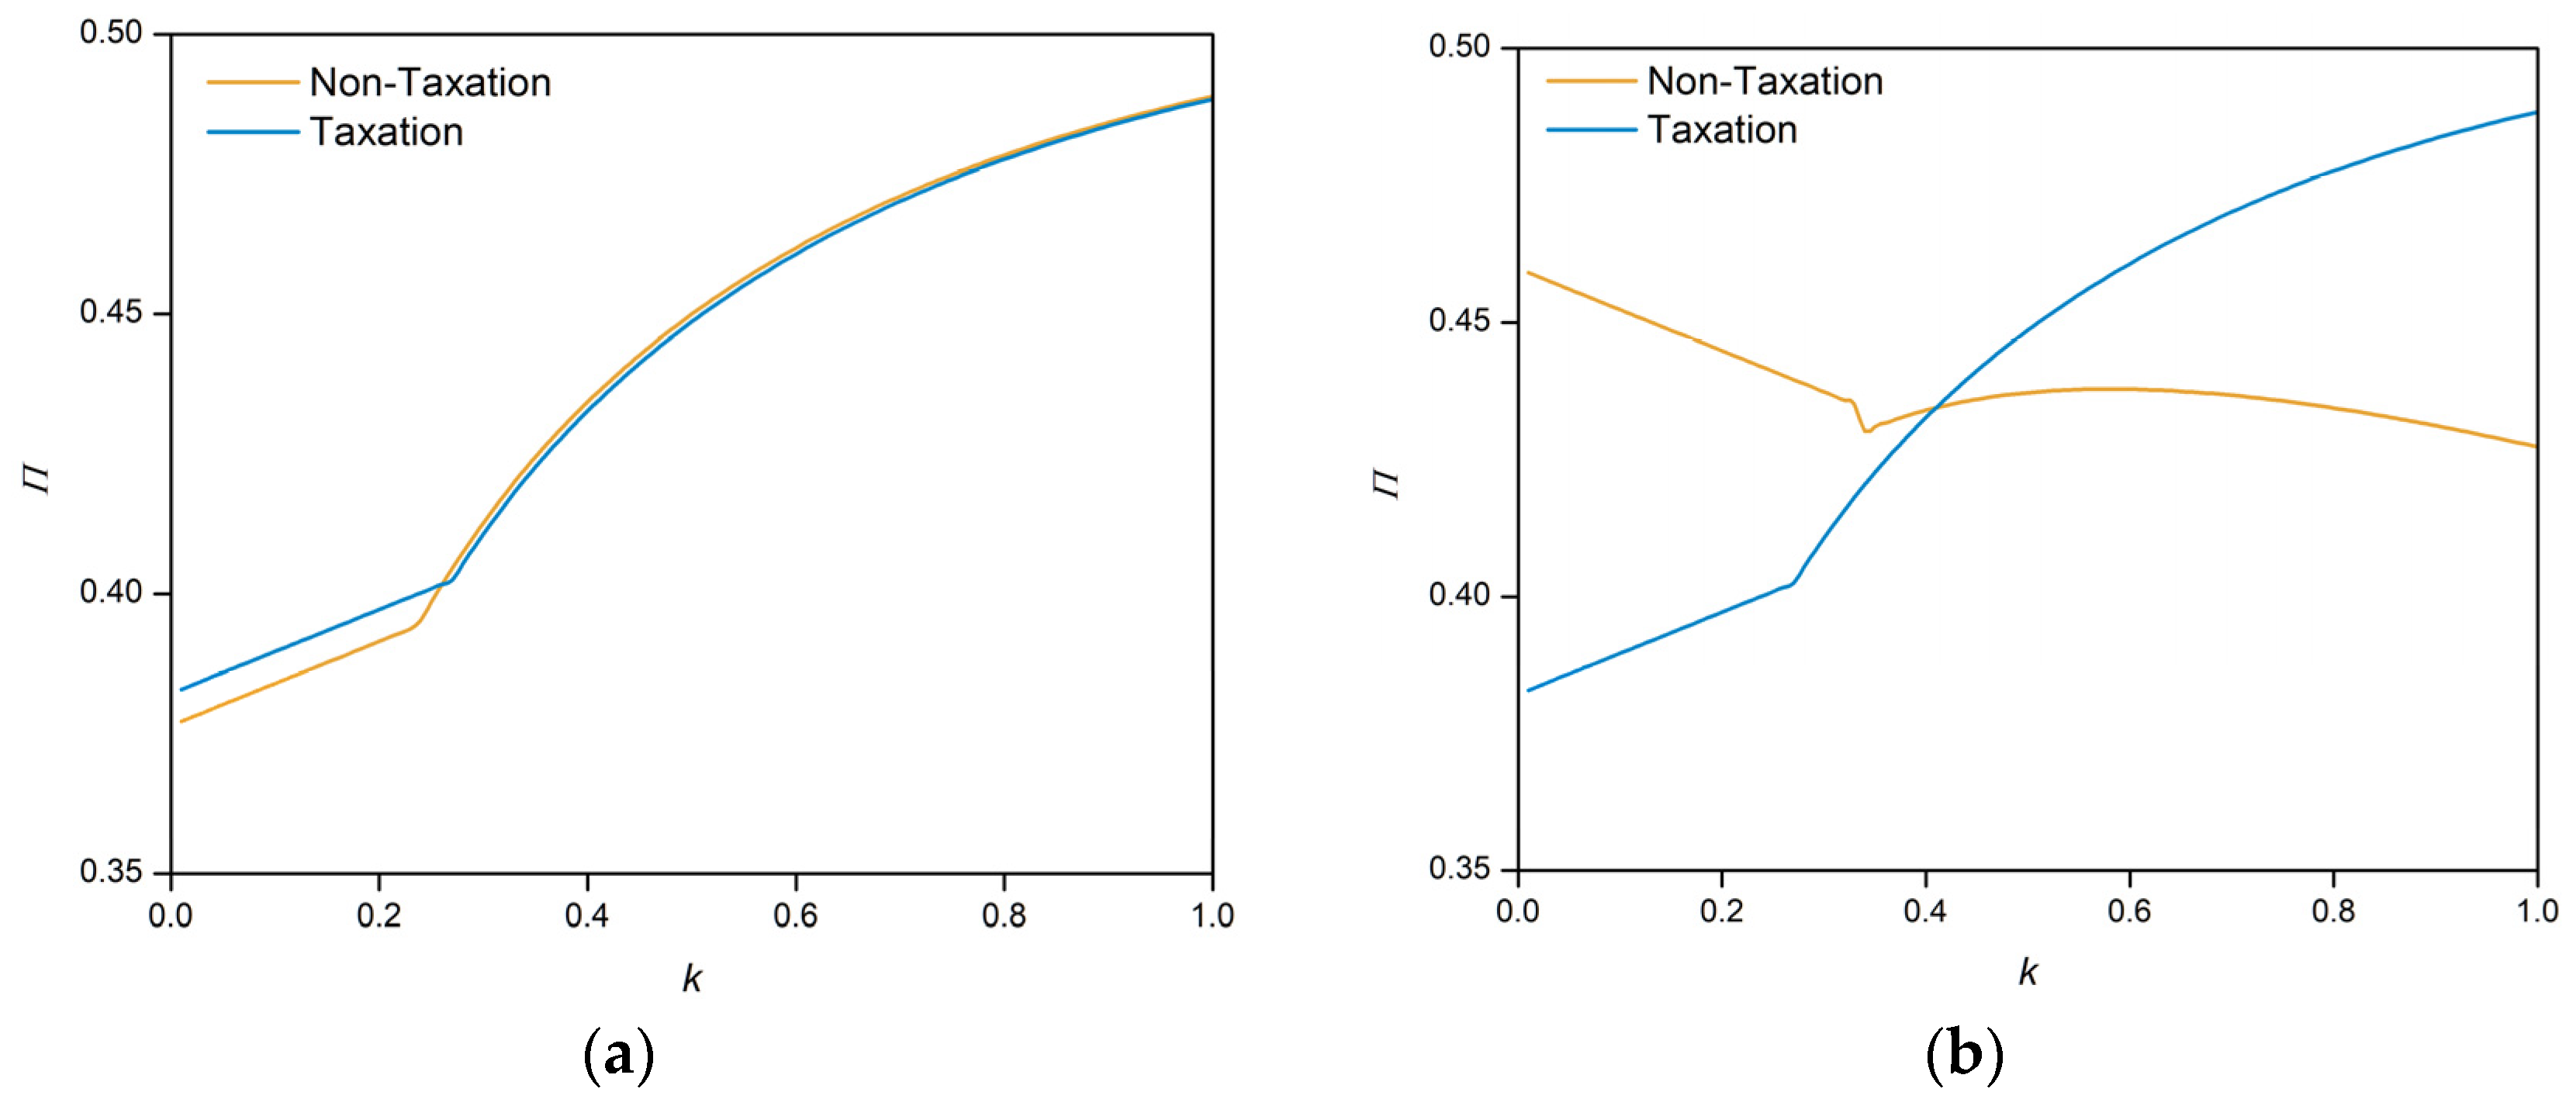
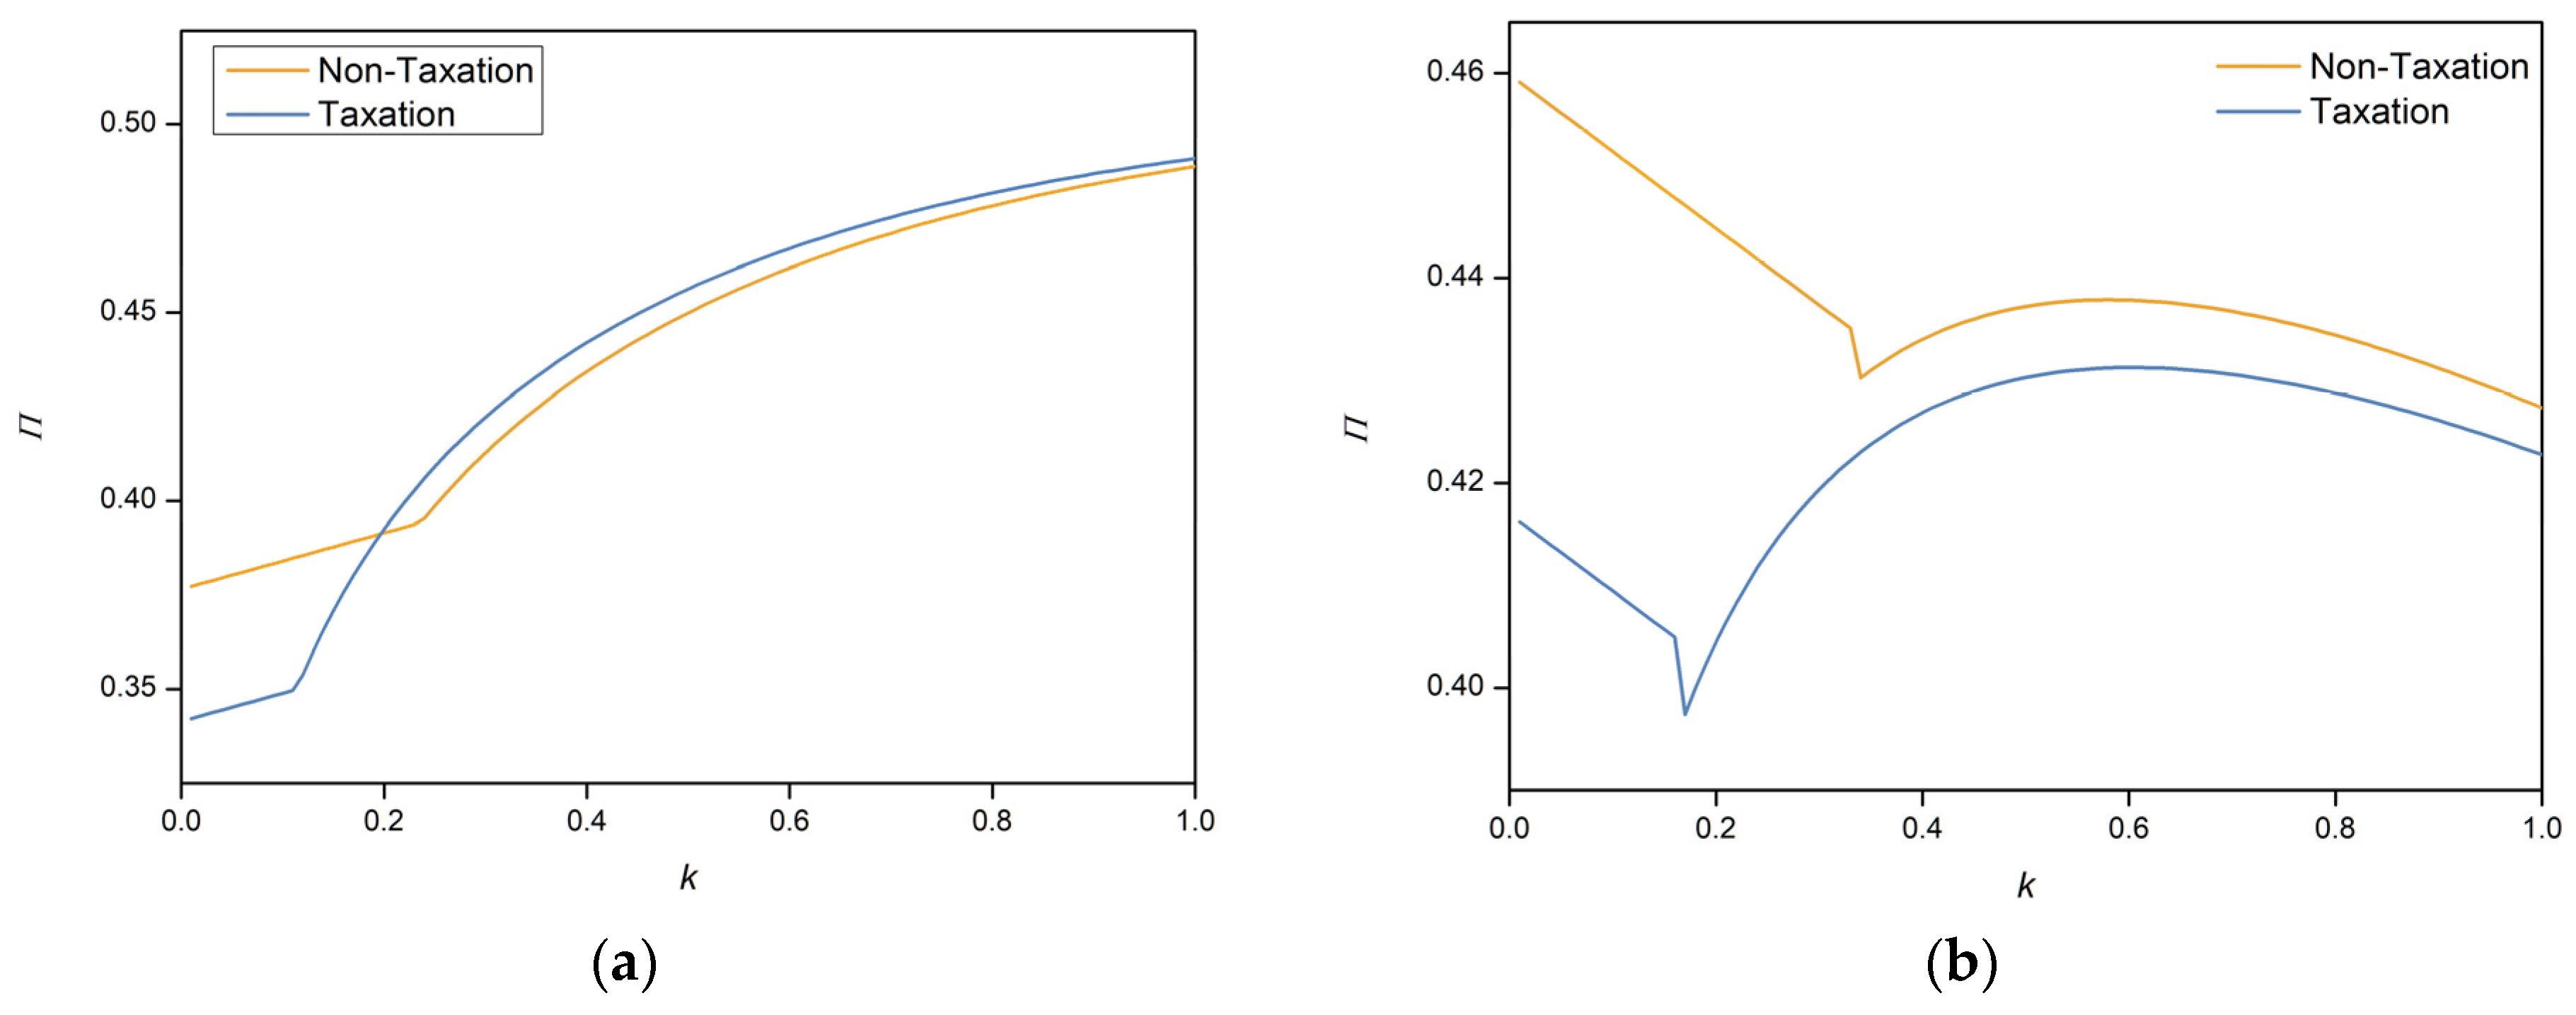
Assuming the government levies a tax at a rate of w 1 on the income the platform obtains from commission and entry fees, in a hybrid model, the platform’s revenue becomes π 1 h ( t a x ) = λ ( v c 1 ) + ( 1 w 1 ) ( 1 λ ) ( t p 3 t a x + f ) . From the analysis in Section 4.1, it follows that the optimal pricing for third-party sellers is p 3 t a x = λ v + ( 1 λ ) c 1 + ( 1 λ ) ( 1 w 1 ) f 1 t ( 1 λ ) ( 1 w 1 ) . Setting π 1 h ( t a x ) t = 0 yields the platform’s optimal commission rate t * ( w 1 ) , and deriving t * ( w 1 ) with respect to w 1 gives: t * w 1 = ( λ 1 ) { v + 2 f ( 1 λ ) ( 1 w 1 ) + t v λ ( 1 w 1 ) ( 1 λ ) + c 1 ( 1 λ ) [ 1 + t ( 1 w 1 ) ( 1 λ ) ] } [ 1 t ( 1 λ ) ( 1 w 1 ) ] 3 < 0 . Since t * w 1 < 0 , p 3 t a x < p 33 , and π 1 h ( t a x ) < π 1 h , increasing the tax rate on platform commission and entry fees makes the platform more reliant on revenue from direct sales. The increase in w 1 leads to a decrease in the commission rate for third-party products, the price of third-party products on the platform, and the platform’s revenue in a hybrid model. Figure 6a,b show the changes in total social welfare following the government’s taxation of the platform, both when the platform has a cost advantage and when it does not. It is evident that when the platform has a cost advantage with limited entry capability, or when the platform lacks a cost advantage but has greater entry capability, taxing the platform’s commission and entry fees can contribute to enhancing total social welfare.
Assuming the government levies a tax at the rate of w 2 percent on the sales revenue of first-party products, similarly, in a hybrid model, the optimal pricing for third-party sellers is given by p 3 t a x = ( 1 w 2 ) ( c 1 λ c 1 + λ v ) + ( 1 λ ) f ( 1 w 2 ) t ( 1 λ ) . Substituting p 3 t a x into the platform’s revenue equation for the hybrid model and differentiating with respect to the commission rate t yields the platform’s optimal commission rate t * ( w 2 ) . Further differentiating t * ( w 2 ) with respect to w 2 results in: t * w 2 = ( 1 λ ) 2 { f [ ( 1 w 2 ) t ( 1 λ ) ] + 2 t v λ ( 1 w 2 ) + 2 t c 1 ( 1 w 2 ) ( 1 λ ) } [ ( 1 w 2 ) t ( 1 λ ) ] 3 . Clearly, t * w 2 > 0 , indicating that as the tax rate on sales revenue of first-party products increases, the platform is more inclined towards the third-party-seller model. The increase in w 2 leads to the platform raising the commission rate charged to third-party sellers. France recently imposed a 3% digital services tax on revenues generated from user data operations, digital advertising, and online platform sales by large corporations. In response to this tax implementation, Amazon France has decided to increase the fees charged to vendors using its online marketplace. Effective from 1 October 2019, Amazon will raise the commission rate for businesses selling products on its French platform by 3% [47]. Figure 7a,b illustrate changes in total social welfare following taxation and non-taxation of first-party product sales revenue by the government, both when the platform has and does not have a cost advantage. From Figure 7a,b, it can be deduced that the government should tax the sales revenue of first-party products of platforms with a cost advantage when they possess significant entry capability.

6. Conclusions

In the contemporary business landscape, the operational domain of hybrid models has expanded beyond traditional e-commerce platforms to encompass various online platforms. For instance, the Apple Store supplies not only apps developed by Apple itself but also those created by third-party developers, offering consumers a wider range of choices. The entry of platform-owned products has significantly impacted the operational modes of product markets, sparking price competition between first-party and third-party sellers. As both the manager of a sales channel for third-party sellers and a participant in the competitive market, platforms exhibit a notable imbalance in their competitive position against third-party sellers. Moreover, the differential in marginal costs across different product markets between platform-owned and third-party products affects the marginal profits of market participants. Although platforms have comprehensive access to all information within third-party-seller markets, limitations in entry capability prevent platforms from entering all product categories, thereby influencing the operational modes of product markets. Considering these market dynamics, this study developed an inelastic demand model that accounts for platform entry capability restrictions. It delves into the entry decisions of leading platforms facing markets of varying product values, compares the optimal pricing strategies of first-party and third-party sellers under different marginal costs, and evaluates the reasonableness of regulatory policies related to hybrid platforms.

6.1. Main Findings

Our research reveals several nuanced findings regarding the dynamics of pricing and market entry strategies within hybrid model markets, diverging from traditional supply chain pricing mechanisms. Firstly, in hybrid markets, the pricing of third-party products on platforms is decoupled from the cost of the products themselves. Table 1, Table 2, Table 3 and Table 4 summarize the operational modes for different product value ranges, illustrating the impact of cost advantages on market competition. The ability to influence price-insensitive consumers and the power to levy commission and fees on third-party sellers shape the pricing strategies for third-party products within the hybrid model. When the platform’s own product prices do not exceed those of third-party sellers, the price equilibrium between platform-owned and third-party products influences consumer purchasing decisions. The platform can restrict third-party product pricing by managing price-insensitive consumers, thereby optimizing its revenue structure. Additionally, the commission and fees imposed on third-party sellers impact their profits, leading them to adjust their prices accordingly to remain competitive while covering the additional costs. However, as the platform’s influence on consumers increases, it paradoxically benefits the pricing of third-party products, thereby mitigating competition between first-party products and third-party products to some extent. This happens because when the proportion of price-insensitive consumers on the platform increases, the platform often adopts strategies to direct these consumers towards third-party sellers. As a result, third-party sellers are more inclined to set higher prices, which positively impacts both their own and the platform’s revenues. This dynamic benefits the pricing of third-party products and mitigates competition between first-party and third-party products to some extent.
Secondly, when platforms decide on the categories of products to enter the market, they must allocate their entry capabilities judiciously. With very limited entry capabilities, platforms prioritize entering markets for high-value products. As entry capabilities expand, platforms are faced with the decision of whether to enter markets for higher-value third-party sellers or to focus on lower-value markets with exclusive self-operations. Contrary to intuition, when the platform does not have a cost advantage, first-party products adopt a high-price strategy. This pricing is unaffected by the entry of third-party sellers into the market because the platform can leverage its influence over price-insensitive consumers and its ability to impose commission and fees on third-party sellers. These mechanisms allow the platform to maintain stable and optimized revenue streams regardless of third-party-seller competition.
In terms of revenue model efficiency, imposing commission based on third-party sellers’ sales revenue is generally more effective than charging entry fees in most scenarios. This finding is consistent with the existing literature on platform economics [37]. If first-party products have a cost advantage, charging entry fees in low-value hybrid model markets is advantageous, but opting for commission in other product segments is a better strategy. Lastly, prohibiting the hybrid model does not universally enhance societal welfare. In scenarios where first-party products have a cost advantage and limited entry capabilities, governments should permit the existence of the hybrid model. Furthermore, governments should levy higher taxes on commission and entry fees when platforms have a cost advantage and limited entry capabilities or tax the sales revenue of first-party products more when platforms possess significant entry capabilities. When platforms lack a cost advantage, imposing higher taxes on commission and entry fees as the platform’s entry capabilities increase can enhance societal welfare.

6.2. Management Insights

The managerial implications of this article are highlighted in several key insights. Initially, it clarifies the market positioning of products on exclusively first-party platforms versus those on purely third-party platforms. Products on the former are positioned in the high-value-product market, whereas those on the latter are aimed at relatively lower-value-product markets.
Additionally, the article elaborates on strategies to guide price-insensitive consumers under cost disparity conditions and the pricing strategies in various scenarios. Specifically, when the platform has a cost advantage, it tends to direct price-insensitive consumers towards first-party products regardless of third-party product pricing. The pricing strategy for first-party products aligns with third-party product prices when they are high but shifts to a high-price strategy when third-party prices drop to a threshold ( p 33 ). This threshold, p 33 , is determined by the equation p 33 = λ v + ( 1 λ ) ( f + c 1 ) / 1 t 1 λ . The range for this threshold is dictated by the values of λ (the proportion of price-insensitive consumers), v (product value),   f (entry fee), c 1 (cost of first-party products), and t (commission rate). The upper limit of this threshold occurs when λ approaches 1, and the lower limit is determined by the combination of f , c 1 , and t . If first-party products lack a cost advantage and enter the market, their price is constant. The platform directs price-insensitive users towards third-party products when their pricing exceeds a specific threshold, and vice versa.
Furthermore, it discusses the entry strategy of first-party products under limited platform entry capabilities. When the platform’s entry capability is extremely restricted, it prioritizes entering markets with higher product values, leaving the long-tail markets to third-party sellers. With moderate entry capabilities, the platform competes in high-value-product markets with third-party sellers while also venturing into markets untouched by third parties for direct sales.
Moreover, survival strategies for third-party sellers on the platform are outlined. A cost advantage enables third-party sellers to secure more exclusive markets. If the platform holds both cost and price advantages, third-party sellers find no foothold in the market. Conversely, without a price advantage from the platform, third-party sellers can coexist in high-value-product markets, leading to a mixed-model product market.
Finally, guidance for consumer purchasing decisions suggests that choosing third-party products in a mixed model on the platform yields the highest utility when buying products.

6.3. Limitations and Future Directions

The limitations of this study are primarily manifested in the following aspects: Firstly, despite the extensive literature on the competition between different retail channels, this research still assumes that third-party sellers cannot sell products to consumers through channels outside the platform. Secondly, the online platforms considered due to their significant market power and exclusive customer base exhibit inelastic market demand. Future research could explore the impact of competition among different sellers within the same product market under conditions of demand elasticity on bilateral platforms. Additionally, the complementarity and substitutability between first-party and third-party products, as well as the effects of platform network, were not considered in our model. Future research could delve deeper into these aspects by incorporating these characteristics. Moreover, this study assumes the marginal costs of first-party and third-party products as independent variables, overlooking the correlation between a product’s marginal cost and its value. Future research could consider introducing other forms of marginal costs, such as assuming c i = 1 2 v 2 , ( i = 1 , 3 ) . Lastly, future research should investigate long-term dynamic interactions, incorporating technological advancements and regulatory changes with empirical validation from real-world e-commerce data to substantiate theoretical findings.

Author Contributions

Conceptualization, H.C. and Q.X.; methodology, H.C. and Q.X.; software, H.C.; validation, H.C. and Q.X.; formal analysis, H.C.; investigation, H.C.; writing—original draft preparation, H.C.; writing—review and editing, H.C.; project administration, Q.X.; funding acquisition, Q.X. All authors have read and agreed to the published version of the manuscript.

Funding

This work was supported by the National Social Science Fund of China (Grant No. 21BGL014).

Institutional Review Board Statement

Not applicable.

Informed Consent Statement

Not applicable.

Data Availability Statement

Data are contained within the article.

Conflicts of Interest

The authors declare no conflicts of interest.

Appendix A

Proof of Proposition 2.
Let us assume the change in platform revenue when directing price-insensitive consumers to either third-party sellers or first-party sales is Δ π 1 h r . Then, Δ π 1 h r = π 1 h π 1 r = ( 1 λ ) ( p 3 c 1 ) + λ ( p 3 t + f ) p 3 + c 1 . Setting π 1 h r = 0 , we find p 3 = p 31 = f + c 1 1 t . This means that when the price of third-party products is p 31 , the platform is indifferent between directing price-insensitive consumers to third-party sellers or selling the products itself. When the pricing of third-party sellers p 3 p 31 , it results in π 1 h π 1 r , indicating the platform prefers to earn commission and entry fees. When the price of third-party products exceeds p 31 , the platform induces price-insensitive users to purchase its own products, effectively excluding third-party sellers from the market, resulting in an exclusive first-party model. □
Proof of Proposition 3.
The change in platform revenue from transitioning between a hybrid model and an exclusive third-party-seller model can be defined as Δ π 1 h m = π 1 h π 1 m = λ ( v c 1 ) + ( 1 λ ) ( p 3 t + f ) p 3 t f . When Δ π 1 h m = 0 , a threshold p 32 = v f c 1 t exists. At this third-party product price of p 32 , the platform’s revenue from the hybrid market equals that from an exclusive third-party-seller market. If the third-party product’s price p 3 > p 32 , the platform prefers to maintain an exclusive third-party-seller market, where the optimal pricing for third-party sellers is v , and their optimal profit is π 3 m = ( 1 t ) v c 3 f . When the third-party product’s price is lower, p 3 p 32 , the platform sells to price-insensitive users at a higher price p 1 = v , leaving price-sensitive consumers to third-party sellers, from whom it collects commission and entry fees, resulting in the third-party sellers’ maximum profit being π 3 h = ( 1 λ ) [ ( 1 t ) p 32 c 3 f ] . Comparing these scenarios shows the following: when f + c 1 1 t + λ t ( c 1 c 3 ) ( 1 t ) ( 1 t λ ) , third-party sellers choosing p 3 p 32 earn greater profits, making p 32 their optimal price, and yielding an optimal profit of ( 1 λ ) [ ( 1 t ) p 32 c 3 f ] ; when v < f + c 1 1 t + λ t ( c 1 c 3 ) ( 1 t ) ( 1 t λ ) , third-party sellers earn more by choosing p 3 > p 32 , with their optimal pricing being v and optimal profit being ( 1 t ) v c 3 f . □
Proof of Proposition 4.
Let π 1 h r = λ ( v c 1 ) + ( 1 λ ) ( p 3 t + f ) p 3 c 1 . When Δ π 1 h r = 0 , it yields p 3 = p 33 = λ v + ( 1 λ ) ( f + c 1 ) 1 t ( 1 λ ) . This means, at third-party product price p 33 , the platform’s revenue is equal in both hybrid and exclusive first-party modes. If p 3 > p 33 , then π 1 h < π 1 r , indicating a market with exclusively third-party sellers, where the optimal price for first-party products is v , resulting in platform revenue π 1 r = v c 1 . If p 3 p 33 , then π 1 h π 1 r , denoting a hybrid market mode, where the optimal price for first-party products is v , leading to platform revenue π 1 h = λ ( v c 1 ) + ( 1 λ ) ( t p 33 + f ) . The optimal pricing for third-party sellers is p 3 = p 33 , with revenue π 3 h = ( 1 λ ) [ ( 1 t ) p 33 c 3 f ] . □
Proof of Proposition 5.
Let Δ π 1 h 1 h 2 = π 1 h 1 π 1 h 2 = λ ( v t + f ) + ( 1 λ ) ( v c 1 ) λ ( v c 1 ) ( 1 λ ) ( t p 34 + f ) . When Δ π 1 h 1 h 2 = 0 , a threshold exists p 34 = λ v + ( 1 2 λ ) ( f + c 1 ) λ t + ( 1 t ) ( 1 λ ) . Thus, at third-party product price p 34 , the platform’s revenue is the same between two hybrid market conditions. If third-party product pricing p 3 > p 34 , the platform’s strategy is to match the price of third-party products and allocate price-insensitive consumers to third-party sellers. For third-party sellers to maximize profit, the optimal price is v , with revenue π 3 h 1 = ( 1 t ) v c 3 f . The platform’s optimal pricing is v , resulting in revenue π 1 h 1 = λ ( v t + f ) + ( 1 λ ) ( v c 1 ) . If third-party product pricing p 3 p 34 , the platform’s strategy is to set prices at v and allocate price-insensitive consumers to first-party sales, resulting in platform revenue π 1 h 2 = λ ( v c 1 ) + ( 1 λ ) ( t p 34 + f ) , and the optimal pricing for third-party sellers is p 34 , with maximum revenue π 3 h 2 = ( 1 λ ) [ ( 1 t ) p 34 f c 3 ] . □
Proof of Corollary 1.
By comparing the two scenarios in Proposition 5, we define Δ π 3 h 1 h 2 = π 3 h 1 π 3 h 2 = ( 1 t ) v c 3 f ( 1 λ ) [ ( 1 t ) p 34 f c 3 ] . Solving this equation reveals the following: when 0 λ < 1 2 , if v f + c 3 1 t + ( 1 λ ) ( c 3 c 1 ) λ t , then π 3 h 1 π 3 h 2 , indicating that third-party sellers achieve greater revenue when pricing their products at v , with the platform also setting its own product pricing at v . If > f + c 3 1 t + ( 1 λ ) ( c 3 c 1 ) λ t , then π 3 h 1 < π 3 h 2 , suggesting that third-party sellers realize greater revenue when pricing at p 34 , with the platform similarly setting its pricing at v . Third-party sellers will only enter the market if v f + c 3 1 t , thus when 0 λ < 1 2 , the optimal pricing for third-party products is p 34 , with the platform’s optimal pricing set at v . For 1 2 < λ 1 , if v f + c 3 1 t + ( 1 λ ) ( c 3 c 1 ) λ t , then π 3 h 1 π 3 h 2 , indicating that third-party sellers achieve greater revenue when pricing at p 34 , with the platform also setting its pricing at v . Conversely, if > f + c 3 1 t + ( 1 λ ) ( c 3 c 1 ) λ t , then π 3 h 1 > π 3 h 2 , suggesting that third-party sellers achieve greater revenue when pricing at v , with the platform also opting to price its products at v . Third-party sellers will only enter the market if v f + c 3 1 t ; thus, when 1 2 < λ 1 , both third-party sellers and the platform’s optimal pricing is set at v . □

References

  1. Chen, H.; Xu, Q. Strategies for dynamic pricing competition between differentiated sellers: Considering platform fees and strategic consumers. Manag. Decis. Econ. 2024, 45, 608–623. [Google Scholar] [CrossRef]
  2. Statista. Amazon—Statistics & Facts. 2024. Available online: https://www.statista.com/topics/846/amazon/ (accessed on 14 July 2024).
  3. Statista. JD.com Inc.—Statistics & Facts. 2024. Available online: https://www.statista.com/topics/8743/jdcom-inc/ (accessed on 14 July 2024).
  4. Statista. Reasons for Internet Users in the United States to Shop on Amazon. 2020. Available online: https://www.statista.com/statistics/670499/us-amazon-usage-reason/ (accessed on 14 July 2024).
  5. Zhu, F.; Liu, Q. Competing with complementors: An empirical look at Amazon. com. Strateg. Manag. J. 2018, 39, 2618–2642. [Google Scholar] [CrossRef]
  6. Marketplace Pulse. Amazon Third-Party Seller Services Sales. 2024. Available online: https://www.marketplacepulse.com/stats/amazon/amazon-third-party-seller-services-sales-106 (accessed on 14 July 2024).
  7. Anderson, S.P.; Bedre-Defolie, Ö. Hybrid Platform Model. Soc. Sci. Res. Netw. 2021. [Google Scholar] [CrossRef]
  8. Hagiu, A.; Wright, J. Marketplace or Reseller? Manag. Sci. 2015, 61, 184–203. [Google Scholar] [CrossRef]
  9. Abhishek, V.; Jerath, K.; Zhang, Z.J. Agency Selling or Reselling? Channel Structures in Electronic Retailing. Manag. Sci. 2016, 62, 2259–2280. [Google Scholar] [CrossRef]
  10. Zhang, K. Business models of hybrid E-commerce platforms: The number of third-party. J. Manag. Sci. China 2019, 22, 110–126. [Google Scholar] [CrossRef]
  11. Hagiu, A.; Teh, T.; Wright, J. Should Platforms Be Allowed to Sell on Their Own Marketplaces? RAND J. Econ. 2022, 53, 297–327. [Google Scholar] [CrossRef]
  12. Li, P.; Wei, H. Reseller, marketplace, or hybrid: Business model of retailers. J. Manag. Sci. China 2018, 21, 50–75. [Google Scholar] [CrossRef]
  13. Chen, N.; Tsai, H. Steering via Algorithmic Recommendations. Soc. Sci. Res. Netw. 2019. [Google Scholar] [CrossRef]
  14. Gerpott, T.J.; Berends, J. Competitive pricing on online markets: A literature review. J. Revenue Pricing Manag. 2022, 21, 596. [Google Scholar] [CrossRef]
  15. Chen, H.; Xu, Q. Impact of Exclusive Choice Policies on Platform Supply Chains: When Both Same-Side and Cross-Side Network Effects Exist. J. Theor. Appl. Electron. Commer. Res. 2024, 19, 1185–1205. [Google Scholar] [CrossRef]
  16. Cao, K.; He, P. The competition between B2C platform and third-party seller considering sales effort. Kybernetes 2016, 45, 1084–1108. [Google Scholar] [CrossRef]
  17. Chen, J.; Feng, N.; Feng, H.; Zhang, H. Independent or joint promotion? Promotional strategies for self-operated and third-party products on e-commerce platforms. Syst. Eng. Theory Pract. 2024, 44, 969–985. [Google Scholar] [CrossRef]
  18. Yenipazarli, A. The marketplace dilemma: Selling to the marketplace vs. selling on the marketplace. Nav. Res. Logist. 2021, 68, 761–778. [Google Scholar] [CrossRef]
  19. Xiong, H.; Chen, Y.J.; Hsiao, L. Developing a store brand or collecting a commission: Amazon’s choice and quality decision. Nav. Res. Logist. 2024, 71, 800–815. [Google Scholar] [CrossRef]
  20. Bian, Y.; Wang, H.; Yan, S.; Han, X. Platform channel strategy of selling format: Effect of asymmetric service information. Transp. Res. Part E Logist. Transp. Rev. 2024, 185, 103508. [Google Scholar] [CrossRef]
  21. Li, P.; Wu, B. Information-sharing strategy in a two-stage hybrid platform under co-opetition background. Expert Syst. Appl. 2024, 255, 124642. [Google Scholar] [CrossRef]
  22. Sun, K. Strategic responses to the aggregator platform: Pricing and information sharing. J. Retail. Consum. Serv. 2024, 79, 103874. [Google Scholar] [CrossRef]
  23. Johnson, J.P.; Rhodes, A.; Wildenbeest, M. Platform design when sellers use pricing algorithms. Econometrica 2023, 91, 1841–1879. [Google Scholar] [CrossRef]
  24. Ribera Martínez, A. The circularity of consent in the DMA: A close look into the prejudiced substance of articles 5(2) and 6(10). Riv. Concorrenza Mercato 2022, 29, 191–212. [Google Scholar] [CrossRef]
  25. Spence, M. Product Selection, Fixed Costs, and Monopolistic Competition. Rev. Econ. Stud. 1976, 43, 217. [Google Scholar] [CrossRef]
  26. Dixit, A.; Stiglitz, J.E. Monopolistic Competition and Optimum Product Diversity. Am. Econ. Rev. 1977, 67, 302–304. [Google Scholar] [CrossRef]
  27. Mankiw, N.G.; Whinston, M.D. Free Entry and Social Inefficiency. RAND J. Econ. 1986, 17, 48. [Google Scholar] [CrossRef]
  28. D’Aspremont, C.; Ferreira, R.D.S. Oligopolistic vs. Monopolistic Competition: Do Intersectoral Effects Matter? Econ. Theory 2015, 62, 299–324. [Google Scholar] [CrossRef]
  29. Bertoletti, P.; Etro, F. Preferences, Entry, and Market Structure. RAND J. Econ. 2016, 47, 792–821. [Google Scholar] [CrossRef]
  30. Bertoletti, P.; Etro, F. Monopolistic Competition When Income Matters. Econ. J. 2016, 127, 1217–1243. [Google Scholar] [CrossRef]
  31. Etro, F. Product Selection in Online Marketplaces. J. Econ. Manag. Strategy 2021, 30, 614–637. [Google Scholar] [CrossRef]
  32. Etro, F. Hybrid Marketplaces with Free Entry of Sellers. Rev. Ind. Organ. 2022, 62, 119–148. [Google Scholar] [CrossRef]
  33. Wu, C.H.; Chamnisampan, N. Platform Entry and Homing as Competitive Strategies under Cross-Sided Network Effects. Decis. Support Syst. 2021, 140, 113428. [Google Scholar] [CrossRef]
  34. Jiang, B.; Jerath, K.; Srinivasan, K. Firm Strategies in the “Mid Tail” of Platform-Based Retailing. Mark. Sci. 2011, 30, 757–775. [Google Scholar] [CrossRef]
  35. Shopova, R. Private Labels in Marketplaces. Soc. Sci. Res. Netw. 2021. [Google Scholar] [CrossRef]
  36. Hagiu, A.; Wright, J. Platforms and the Exploration of New Products. Manag. Sci. 2020, 66, 1527–1543. [Google Scholar] [CrossRef]
  37. Hervas-Drane, A.; Shelegia, S. Retailer-Led Marketplaces. Soc. Sci. Res. Netw. 2022. [Google Scholar] [CrossRef]
  38. JD.com. JD Platform Rules. 2024. Available online: https://rule.jd.com/rule/ruleDetail.action?ruleId=638209647311982592&btype=1 (accessed on 14 July 2024).
  39. The Supreme People’s Procuratorate of the People’s Republic of China. 2021. Available online: https://www.spp.gov.cn/spp/zdgz/202104/t20210419_516009.shtml (accessed on 14 July 2024).
  40. Bar-Isaac, H.; Caruana, G.; Cuñat, V. Search, Design, and Market Structure. Am. Econ. Rev. 2012, 102, 1140–1160. [Google Scholar] [CrossRef]
  41. Yang, H. Targeted Search and the Long Tail Effect. RAND J. Econ. 2013, 44, 733–756. [Google Scholar] [CrossRef]
  42. Hervas-Drane, A. Recommended for You: The Effect of Word of Mouth on Sales Concentration. Int. J. Res. Mark. 2015, 32, 207–218. [Google Scholar] [CrossRef]
  43. Alibaba Group. 2021 Platform Operation Environment Report. 2021. Available online: http://www.aliresearch.com/ch/information/informationdetails?articleCode=212384757261144064&type=%E6%96%B0%E9%97%BB (accessed on 14 July 2024).
  44. American Action Forum. Digital Services Taxes: A Primer. 2024. Available online: https://www.americanactionforum.org/insight/digital-services-taxes-a-primer/ (accessed on 14 July 2024).
  45. Government of Canada. Digital Services Tax Act. 2021. Available online: https://www.canada.ca/en/department-finance/news/2021/12/digital-services-tax-act.html (accessed on 14 July 2024).
  46. Tax Foundation. Digital Tax in Europe 2024. 2024. Available online: https://taxfoundation.org/data/all/eu/digital-tax-europe-2024/ (accessed on 14 July 2024).
  47. Tax Foundation. Amazon and France’s Digital Tax. 2024. Available online: https://taxfoundation.org/blog/amazon-france-digital-tax/ (accessed on 14 July 2024).
Figure 1. Diagram of the model with unlimited platform capacity.
Jtaer 19 00120 g001
Figure 2. Game sequence diagram.
Jtaer 19 00120 g002
Figure 3. The marginal profits for the platform entering various product markets, with specific parameter values set as γ = 2 , c 1 = 2 ,   c 3 = 2 ,   λ = 0.75 ,   t = 0.1 ,   f = 0.01 .
Jtaer 19 00120 g003
Figure 4. The equilibrium states of product markets based on differing levels of entry capability.
Jtaer 19 00120 g004
Figure 5. Changes in total social welfare across three models: (a) c 1 < c 3 ; (b) c 1 > c 3 .
Jtaer 19 00120 g005
Figure 6. Total social welfare with and without taxation under different cost advantages: (a) c 1 < c 3 ; (b) c 1 > c 3 .
Jtaer 19 00120 g006
Figure 7. Total social welfare with and without taxation under different cost advantages: (a) c 1 < c 3 ; (b) c 1 > c 3 .
Jtaer 19 00120 g007
Table 1. Pure platform self-operation mode vs. pure third-party-seller mode.
c v p 1 p 3 Operation Mode
c 1 c 3 [ c 1 , + ) v 0 r
c 3 c 1 < f + c 3 1 t [ c 1 , f + c 3 1 t ) [ f + c 1 1 t , + ) v 0 r
[ f + c 3 1 t , f + c 1 1 t ) 0 v m
c 1 f + c 3 1 t [ f + c 3 1 t , f + c 1 1 t ) 0 v m
[ f + c 1 1 t , + ) v 0 r
Note: An optimal price of 0 indicates that the seller does not enter the market.
Table 2. Optimal pricing and market operation modes for the platform and third-party sellers when p 1 p 3 .
c v p 1 p 3 Operation Mode
c 1 c 3 [ c 1 , + ) v 0 r
c 3 c 1 < f + c 3 1 t [ c 1 , f + c 3 1 t ) v 0 r
f + c 3 1 t , f + c 1 1 t 0 v m
f + c 1 1 t , + p 31 p 31 h
c 1 f + c 3 1 t [ f + c 3 1 t , f + c 1 1 t ) 0 v m
[ f + c 1 1 t , + ) p 31 p 31 h
Table 3. Optimal pricing and market operation modes for the platform and third-party sellers when p 1 > p 3 .
c v p 1 p 3 Operation Mode
c 1 c 3 [ c 1 , + ) v 0 r
c 3 c 1 < f + c 3 1 t [ c 1 , f + c 3 1 t ) v 0 r
f + c 3 1 t , f + c 1 1 t + λ t ( c 1 c 3 ) ( 1 t ) ( 1 t λ ) 0 v m
f + c 1 1 t + λ t ( c 1 c 3 ) ( 1 t ) ( 1 t λ ) , + v p 32 h
c 1 f + c 3 1 t f + c 3 1 t , f + c 1 1 t + λ t ( c 1 c 3 ) ( 1 t ) ( 1 t λ ) 0 v m
f + c 1 1 t + λ t ( c 1 c 3 ) ( 1 t ) ( 1 t λ ) , + v p 32 h
Table 4. Optimal pricing and market operation modes for the platform and third-party sellers.
c v p 1 p 3 Operation Mode
c 1 c 3 [ c 1 , f + c 3 1 t + ( 1 λ ) ( c 3 c 1 ) λ ) v 0 r
f + c 3 1 t + ( 1 λ ) ( c 3 c 1 ) λ , + v p 33 h
c 3 c 1 < f + c 3 1 t [ c 1 , f + c 3 1 t ) v 0 r
f + c 3 1 t , + v p 34 h 0 λ < 0.5
v v h 0.5 < λ 1
c 1 f + c 3 1 t f + c 3 1 t , c 1 0 v m
[ c 1 , + ) v p 34 h 0 λ < 0.5
v v h 0.5 < λ 1
Disclaimer/Publisher’s Note: The statements, opinions and data contained in all publications are solely those of the individual author(s) and contributor(s) and not of MDPI and/or the editor(s). MDPI and/or the editor(s) disclaim responsibility for any injury to people or property resulting from any ideas, methods, instructions or products referred to in the content.