Abstract
This paper develops a duopoly model for user-generated content (UGC) platforms, which compete for consumers and content producers in two-sided markets characterized by network externalities. Each platform has the option to invest in a content quality assurance (CQA) system and determine the level of advertising. Our model reveals that network effects are pivotal in shaping the platforms’ optimal strategies and user behavior, specifically in terms of single vs. multi-homing. We find that when network effects for producers are weak, consumers tend to engage in multi-homing while producers prefer single-homing. Conversely, strong network effects lead to the opposite behavior. Furthermore, our model demonstrates that user behavior and network effects dictate whether a platform is incentivized to incorporate advertisements and/or invest in CQA. Generally, weak network effects prompt a platform to invest in a CQA system, unless both consumers and producers engage in multi-homing. Our model’s results highlight the importance for platform companies to evaluate the extent of network effects on their platform in order to anticipate user behavior, which subsequently informs the optimal CQA and advertising strategy.
JEL Classification:
C72; D85; L14
1. Introduction
User-generated content (UGC) platforms represent a significant category of media platforms that primarily host content created by content producers [1,2]. On UGC platforms, content producers upload their self-produced content, which is then accessed by consumers. With the advancement of communication technology, UGC platforms, such as YouTube, Twitch, and TikTok, have experienced rapid growth in recent years. For instance, YouTube’s user base has expanded from 0.8 billion in 2012 to 2.6 billion in 2021, making it the second-most popular social media platform behind Facebook. Boasting over 122 million active daily users worldwide, YouTube witnesses more than 1 billion hours of video consumption daily [3], solidifying UGC platforms as essential channels for information and entertainment consumption.
UGC platforms exhibit typical characteristics of two-sided markets [4]. For instance, YouTube, Twitch, and TikTok facilitate interactions between content producers and consumers, while cross-network effects drive the economics of such platforms. Each additional participant on one side of the platform influences the platform’s appeal to participants on the other side, and vice versa. Numerous researchers have explored the concept of cross-side network effects within two-sided markets. Notably, refs. [5,6,7] have emphasized the significance of these effects. They highlight that cross-side network effects are central to understanding how the returns on one side of a two-sided market are related to the participation size on the other side of the platform. As content producers generate more content on a platform, the platform becomes increasingly attractive to consumers. Conversely, a larger consumer base on a platform enhances its appeal to content producers.
Advertising serves as a primary revenue source for UGC platforms. For instance, in Q1 2022, YouTube’s worldwide advertising revenues reached USD 6.9 billion [8]. Advertising revenue relies on the number of active users who visit the platform and engage with its content. As consumers gravitate towards high-quality content and advertisers are sensitive to inappropriate material, UGC platforms must prioritize ensuring that content produced by content creators is both high-quality and suitable. To address this challenge, some platforms have begun implementing content quality assurance (CQA) systems. For example, in December 2017, YouTube’s CEO announced that the platform would employ over 10,000 individuals to review content and train algorithms in response to several companies removing ads from YouTube following the appearance of child abuse videos online. These content reviewers, with the assistance of machine-learning algorithms, remove videos that are sensitive, vulgar, inappropriate, or disseminate misinformation [9]. Generally, CQA systems help eliminate content that fails to meet quality and ethical standards by reducing the presence of low-quality content producers on the platform. The objective is to enhance consumer loyalty and boost platform revenues. However, the implementation and maintenance of CQA systems can be costly due to labor, module development, and maintenance expenses.
Prior research within the digital content industry has delved into multiple dimensions, one of which is incentivizing content producers to generate high-quality material. For instance, [10] have scrutinized various compensation mechanisms aimed at online content creators, while [11] have examined the role of intrinsic and status-based motivations in encouraging content producers to create high-quality work. The effects of competition and entry in multi-sided markets have been examined by [12], while the role of advertising in media markets has been explored by [13,14]. Research on platform competition for advertisers and users has been conducted by [15], and the dynamics of two-sided markets have been extensively studied by [5,6]. The importance of consumer multi-homing for market performance has been analyzed by [16], and the strategies of media platforms in content provision have been explored by [17]. Studies on specialized advertising media and product market competition have been conducted by [18], and the impact of network neutrality on the Internet has been investigated by [19]. This paper builds on these existing studies by focusing on the implementation and maintenance of content quality assurance (CQA) systems, a critical aspect in ensuring that content produced by content creators is both high-quality and suitable.
Considering the significant role UGC platforms play in the digital content industry and their reliance on high-quality content, it is crucial to understand the conditions under which UGC platforms should implement a CQA system and how network effects impact the optimal strategy and user behavior. To examine these issues, we develop a simple duopoly Hotelling model [20] with cross-network effects. This model involves two UGC platforms competing for consumers on one side of the market and content producers on the other side. The network effects connect both sides of the market, creating a mutual influence. Each UGC platform has two variables to consider: the investment in a CQA system and the level of advertising on the platform. We will be examining four different user behaviors, which include consumers and content producers on both sides of the UGC platform. (Drawing on the study by [21], this paper categorizes both consumers and content producers of UGC platforms as “users” within the context of these platforms). These behaviors include single-homing on both sides, multi-homing on the consumer side only, multi-homing on the content producer side only, and multi-homing on both sides. Users either join one platform, called “single-homing”, or users join both platforms, called “multi-homing” [22]. For example, consumers may access both YouTube and Twitch to watch videos, and content producers may upload their self-made content on both platforms at the same time.
Our analysis reveals that cross-network effects significantly influence (i) the platform’s optimal strategy and (ii) user behaviors. Specifically, we find that when network effects from the consumer to the producer side are weak, consumers are multi-homing, and producers are single-homing. Conversely, when these network effects are strong, consumers are single-homing, and producers are multi-homing. Furthermore, our model demonstrates that user behavior (single- vs. multi-homing) and network effects dictate whether a platform has incentives to place ads and/or invest in a CQA system. Generally, weak network effects prompt a platform to invest in a CQA system, except when consumers and producers are multi-homing. Our model’s results suggest the necessity for platform companies to evaluate the magnitude of network effects on their platform to anticipate user behavior (single- versus multi-homing), ultimately determining the optimal CQA and advertising strategy.
Our paper offers both theoretical and practical contributions. Theoretically, we enhance the existing literature on (i) operational strategies on media platforms, (ii) the impact of user participation decisions in platform competition, and (iii) platform performance investments. Practically, our findings provide guidance for platform company managers on developing bilateral strategies, adjusting the proportion of users with different participation options, and determining the conditions under which investing in a CQA system makes sense in order to reduce operating costs, optimize profits, and maintain sustainable market development.
The rest of the paper is organized as follows. Section 2 provides additional related literature. Section 3 introduces the model, complete with notation and primary assumptions. Section 4 details the results for various user behaviors and compares the different scenarios. Section 5 employs numerical analyses to validate and expand upon the findings. Lastly, Section 6 highlights potential extensions and provides a conclusion to the paper.
2. Additional Literature
Our work primarily relates to the following three areas in the existing literature.
2.1. Media Platform Operational Strategies
Pricing strategies: As a form of media platform development, there are many similarities between research related to UGC platforms and that related to media platforms, where platforms can charge both advertisers and consumers directly [5,17,23]. For media platforms, ref. [24] conducted an in-depth analysis of the impact of network externalities on content pricing within digital platforms. They found that platforms often strategically lower prices for low-quality content to attract more viewers, recognizing that increased viewership can enhance the platform’s overall appeal and generate additional revenue through advertising. This approach reflects a nuanced understanding of how content quality, pricing, and network effects influence user behavior and platform success.
Ref. [25], on the other hand, took a broader view of content pricing strategies, investigating how platforms charge consumers for content subscriptions. Their research considered various market structures, including both monopoly and competitive scenarios. They discovered that platforms’ pricing strategies for content subscriptions remain consistent, whether they operate in a monopoly or face competition. This finding suggests that the decision to charge for content is driven more by the intrinsic value of the content and the platform’s overall business model than by the competitive landscape. Together, these studies provide valuable insights into the complex interplay between content quality, pricing strategies, and market dynamics, contributing to a more comprehensive understanding of how platforms can optimize their revenue streams.
Advertising models: Scholars such as [18] constructed an informative advertising and price competition model, finding that when platforms are free to consumers, advertisers place more ads, and the platform’s price per ad placement increases. This insight has implications for platforms seeking to maximize advertising revenue. Ref. [26] determined that the smaller the variation in video quality offered by media platforms, the more advertisements will be placed. Ref. [15] demonstrated that heterogeneity in consumer preferences for platforms affects the level of advertising placement by advertisers. UGC platforms often profit from consumers through ad placement, a common business model in platforms such as YouTube and TikTok. Our research builds on existing studies and focuses on ad placement decisions in UGC platforms. Refs. [13,14] further explored advertising pricing models in media markets, examining lump-sum versus per-consumer charges and the effects of introducing advertising in pay TV. Their work provides insights into how platforms can strategically price advertising to maximize revenue.
2.2. Impact of User Participation Decisions in Platform Competition
This area explores how users engage with one or multiple platforms. Single-homing occurs when users engage with only one platform, whereas multi-homing typically refers to partial multi-homing, which involves users participating in two or more platforms concurrently. Ref. [6] discussed users’ motivation for multi-homing, stemming from their desire for better network externalities, while [12] studied the effects of cross-network effects and multi-homing on competition and consumer behavior. Ref. [27] explored competitive bottlenecks, leading to multi-homing for sellers and single-homing for buyers.
Ref. [16] used a classical product differentiation loop model to describe the advertising investment problem in media markets with multi-homing of users. They showed that media platforms can only charge value-added prices to advertisers but not more to consumers, shedding light on pricing strategies in multi-homing scenarios. Ref. [28] have explored platform competition in specific markets such as video game consoles, examining how platforms strategically position themselves in the market. Their research merges both same-side and cross-side network effects to compare equilibrium results, shedding light on how platforms can leverage network externalities to gain competitive advantages. By analyzing the interplay between platform owners, game developers, and consumers, they provide a nuanced understanding of the dynamics that shape platform competition. Their findings offer valuable insights into how platforms can optimize their strategies to attract both developers and consumers, contributing to the broader literature on platform economics and competition.
2.3. Platform Performance Investments
This area focuses on investments in value-added services, innovation incentives, and the overall performance of the platform. Ref. [29] studied additional value-added service investment and pricing strategies for one side of a bilateral platform and found that the relative strength of the cross-side network effect measured the relative “importance” of the two sides, with the platform subsidizing the price of the more “important” side in real time to attract more users to the other side. Ref. [30] considered the impact of cross-side network effects and value-added services on the utility of manufacturers and suppliers joining the platform and found that as supplier cross-side network effects increase, the platform can increase the level and price of value-added services for manufacturers and suppliers.
Ref. [31] investigated the conditions for innovation incentives by platforms under the influence of network effects in the presence of bilateral platforms with multi-homing of consumers and service providers and showed that subsidies to consumers were more effective in increasing the level of quality and technological innovation of platforms. Ref. [32] studied multi-homing on both sides using the platform’s subsidy policy and argued that when both sides use multi-homing, the common strategic proposal to subsidize one side in order to maximize the total profit may be limited.
In the existing studies, the platform’s service investments all bring positive utility to users on one side, while CQA investments not only bring positive utility to users on one side but also generate negative utility to users on the other side, which makes the platform’s investment strategy more complicated.
3. Model Setup
Based on the Hotelling model, we construct a duopoly model of platform competition. We consider two UGC platforms (denoted by subscript ) that compete for two types of users: consumers (denoted by subscript c) and content producers (denoted by subscript p). Consumers and content producers, who are of mass one, are uniformly distributed along the unit interval. The two competing platforms are situated at the extremes of the interval with platform A located at 0 and platform B located at 1. We consider the Hotelling model with linear transport costs per unit of length, which are denoted by and for consumers and producers, respectively. Hence, the two platforms are horizontally differentiated from the perspective of the users, and the parameter t can be interpreted as the differentiation parameter [33,34]. A lower value of t means that the platforms are perceived as closer substitutes by the users. Each platform has two strategic variables at its disposal: the level of advertising and the level of CQA.
Consumers can enjoy the platforms’ content for free, where represents the consumers’ intrinsic value from consuming content on the platform [13,19], but they have to watch the ads embedded in the content of the platform. We denote the amount of advertising placed on platform i by a with . We assume that consumers dislike ads and watching ads will thus induce a negative utility. A potential negative externality derived from ads could be that consumers want to watch videos, not advertisements. For further discussion of this aspect, see [35,36,37].
The parameter describes the extent to which consumers dislike advertising because each advertisement produces a perceived nuisance cost of by the consumers. We based our choice for the parameter on previous empirical studies that have explored consumer attitudes toward advertising. Specifically, we drew inspiration from the work of [38], who empirically assessed readers’ attitudes toward advertising in various magazine segments. Their findings demonstrate that attitudes toward advertising depend on the nature and informativeness of the advertisements, a concept we aimed to capture with our chosen value for .
Moreover, we assume that advertising generates revenue for the platform, and the parameter captures how much revenue a platform can generate per ad a. We assume that the advertising market is competitive and that the advertising price is exogenously given. The parameter r can be interpreted as a measure of the effectiveness of advertising. For tractability, we assume a linear specification of advertising revenue [14].
The level of CQA on platform i is denoted by with . We assume that implementing and maintaining a CQA system is costly, with the cost given by the convex cost function with . These costs can be interpreted as labor, module development, and maintenance costs for the CQA system. We assume that the level of CQA induces a disutility for the content producers but a utility for the consumers. On the one hand, a CQA system raises the quality standard on the platform, which can be interpreted as additional costs for the content producers. On the other hand, consumers benefit through an improved quality of the content on the platform.
The parameter describes the extent to which consumers value high-quality content on a platform. For the parameter , we referred to the existing literature on content quality and user engagement. Studies by [28,39] have explored the relationship between content quality and consumer behavior in different platform contexts. These works provided valuable insights into how consumers perceive and value high-quality content, guiding our choice for the parameter .
Furthermore, we assume that network effects operate from one market side to the other on the platform. Specifically, the more consumers are on the platform, the more attention content producers receive for posting content; similarly, the more content producers are present on the platform, the more content is on the platform from which consumers can choose. Therefore, we assume that positive cross-network effects operate between consumers and producers, which means that consumers’ access to the platform brings additional utility to producers, and producers’ access to the platform brings additional utility to consumers. We denote the cross-network effects that operate from the consumer market to the producer market by and the effects that operate from the producer market to the consumer market by . We also refer to as the network effects obtained by producers and to as the network effects obtained by consumers [40].
Finally, by denoting the number of consumers on platform i by and the number of content producers on platform i by , we can derive the profit function of platform i as follows:
with .
Table 1 provides a summary of the notation used in our model.

Table 1.
Notation for parameters and decision variables.
4. Equilibrium Analysis
In this section, we derive the equilibrium outcomes. Given that users can choose to access one platform (“single-homing”) or two platforms (“multi-homing”), we distinguish the following four scenarios (we use abbreviations to refer to the different scenarios where the first letter represents the consumers and the second letter the content producers):
- Consumers and content producers are both single-homing (S-S scenario).
- Consumers are multi-homing, and producers are single-homing (M-S scenario).
- Consumers are single-homing, and producers are multi-homing (S-M scenario).
- Consumers and content producers are both multi-homing (M-M scenario).
For each of the four scenarios, we determine the optimal platform strategy by assuming that both platforms simultaneously choose the level of advertising and the level of CQA investment with the objective of maximizing their own profits. We then compare the four scenarios to determine the conditions under which consumers and content producers choose single-homing and multi-homing, respectively.
4.1. Single-Homing on Both Sides
We start our analysis by considering the scenario in which consumers and content producers are both single-homing (S-S scenario). Figure 1 illustrates this scenario.
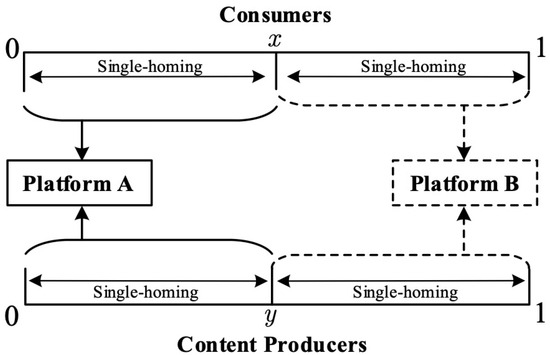
Figure 1.
User structure of the platforms in the S-S scenario.
As shown in Figure 1, both users only access one platform. For consumers and content producers, there is a unique point on the Hotelling line denoted by x and y, respectively, for which the users are indifferent between choosing platform A or B. All users that are located on the left of the indifference points x and y decide to join platform A, and all users located on the right of x and y will join platform B.
The utility obtained by the consumer on platform is thus given by
where V denotes the consumer’s intrinsic value from the content on platform i, and measures the level of consumers’ disutility from ads. The term reflects the increase in consumer utility through network effects derived from the presence of content producers on the other market side. The more content producers are present on the platform, the higher the increase in utility. As mentioned above, the level of CQA on the platform increases consumer utility by , and and denote the cost of consumer preference.
The utility that content producers derive from platform is
where characterizes the increase in utility of the content producers through cross-network effects derived from the presence of consumers on the other market side. As above, the more consumers are present on the platform, the higher the increase in utility. The disutility induced by the level of CQA is given by , and the preference costs of the content producer are and .
We can obtain the indifference points of consumers and producers from the conditions of and , respectively. Therefore, from Equations (2)–(5), the number of consumers and content producers on platform i can be derived as
with and .
To ensure non-negative demand functions, we assume throughout the subsequent analysis that the cross-network externality parameters are small compared to the differentiation parameters, i.e., [7,27,31].
By substituting the demand functions (6) and (7) into the profit function (1) and solving the maximization problem, we derive the equilibrium in the following proposition.
Proposition 1.
- (i)
- The equilibrium exists and is unique if the consumers’ disutility from advertising is sufficiently large with .
- (ii)
- In equilibrium, the level of advertising on platform i is given byand the level of CQA investment on platform i is
- (iii)
- In equilibrium, the number of consumers and producers on platform i is
Proof.
See Appendix A. □
Part (i) of Proposition 1 shows the condition for the existence and uniqueness of an equilibrium in the S-S scenario: the consumers’ disutility from advertising must be sufficiently large with .
Part (ii) presents the equilibrium level of advertising and CQA investment. We derive that the platform will always place ads, i.e., since . However, to ensure that the platform invests in CQA, i.e., , the cross-network effect obtained by consumers must be sufficiently weak with . Weaker cross-network effects from producers to consumers diminish utility for the consumers and thus reduce their demand. To counterbalance this effect, the platform has incentives to make CQA investments in this case.
Part (iii) shows that consumers and producers on platform i share the market equally since the S-S scenario is fully symmetric.
Next, we examine how cross-network externalities ( and ) and the sensitivity coefficient regarding the CQA investment impact the equilibrium solution of the platform.
Corollary 1.
- (i)
- As the cross-network effects obtained by consumers increase, both the CQA investment and the level of advertising decrease, i.e.,
- (ii)
- As the cross-network effects obtained by producers increase, the CQA investment is not affected, but the level of advertising decreases, i.e.,
- (iii)
- As consumers’ sensitivity γ to CQA investment increases, the CQA investment increases, but the level of advertising is not affected, i.e.,
Proof.
See Appendix A. □
Parts (i) and (ii) of Corollary 1 reflect the fact that as the cross-network effect of producers on consumers increases, platforms reduce the level of CQA investment. The increase in network effects obtained by consumers increases consumer utility and thus diminishes incentives for platforms to attract consumers through CQA investments, which induces the platforms to reduce the level of CQA investment. As the cross-network effects obtained by either consumers or producers increase, the platform reduces the level of advertising since there is no incentive for the platform to increase CQA investment due to the increase in network effects obtained by consumers or producers, and, in order to remain attractive to consumers, the platform needs to reduce the level of advertising.
Part (iii) of Corollary 1 reflects that the increase in the sensitivity to CQA investment by consumers increases the incentives for platforms to increase CQA investment, as this enhances the utility of CQA investment to consumers and increases the attractiveness of platforms to consumers.
4.2. Multi-Homing Consumers and Single-Homing Producers
Figure 2 illustrates the user structure of the platforms when multi-homing occurs only on the consumer side (M-S scenario).
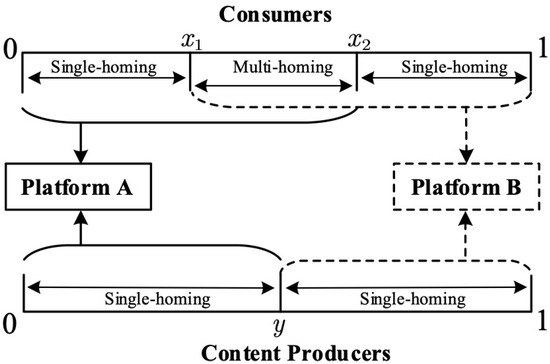
Figure 2.
User structure of the platforms in the M-S scenario.
In this scenario, there exists a proportion of consumers who join both platforms to enjoy their content. Due to the presence of multi-homing consumers, total consumer demand exceeds 1, i.e., . As shown in Figure 2, there are two indifference points on the consumer’s Hotelling line: the marginal consumer, who is indifferent between joining only platform A (single-homing) and joining both platforms (multi-homing), is located at . Similarly, the marginal consumer, who is indifferent between joining only platform B (single-homing) and joining both platforms (multi-homing) is located at .
The utility of a single-homing consumer joining platform i is the same as in the S-S scenario given by Equations (2) and (3). The utility of a multi-homing consumer can be expressed as
The two indifference points for consumers and can be obtained from and . From Figure 2, we can observe that all consumers located on the left of join platform A and all consumers located on the right of join platform B.
The demand functions of consumers on platforms A and B are thus given by
As in the S-S scenario, the utility of a single-homing producer joining platform i is the same as in Equations (4) and (5). Thus, the indifference point for producers joining platform A or B can be expressed in the M-S scenario as
All producers located on the left of y will join platform A, and all producers located on the right of y will join platform B so that the producers’ demand functions are given by
Combining (9)–(13), we can derive the number of consumers and content producers on platforms A and B. By substituting these demand functions into the profit function (1) and solving the corresponding maximization problem, we derive the following proposition.
Proposition 2.
- (i)
- The equilibrium exists and is unique if the consumers’ disutility from advertising is sufficiently large with .
- (ii)
- In equilibrium, the level of advertising on platform i is given byand the CQA investment on platform i is
- (iii)
- In equilibrium, the number of consumers on platform i isand the number of producers on platform i is
Proof.
See Appendix A. □
Similar to the S-S scenario, Part (i) of Proposition 2 shows that the disutility that consumers obtain from advertising must be sufficiently large with to ensure the existence and uniqueness of an equilibrium.
From Part (ii), we can derive that the platforms will always advertise, i.e., because . Moreover, the platforms will invest in CQA if the network effects obtained by consumers and producers are sufficiently weak, i.e.,
In addition, Proposition 2 shows that, unlike in the S-S scenario, the equilibrium strategy of the platform in the M-S scenario is affected by both the cross-network effects of bilateral users and the sensitivity coefficient of CQA investments, which is formally derived in the following corollary.
Corollary 2.
- (i)
- The cross-network effects obtained by consumers have an ambiguous effect on both the CQA investment and the level of advertising, i.e.,
- (ii)
- The cross-network effects obtained by producers have an ambiguous effect on both the CQA investment and the level of advertising, i.e.,
- (iii)
- As consumers’ sensitivity γ to CQA investment increases, both the CQA investment and the level of advertising increase, i.e.,
Proof.
See Appendix A. □
Parts (i) and (ii) of Corollary 2 reflect the different nature of the M-S and S-S scenarios. In the M-S scenario, the CQA investment of the platform is affected by both types of cross-network effects and . Specifically, as the cross-network effects obtained by consumers increase, the level of CQA investment on platforms increases when the platform’s unit ad price r is below a certain threshold and the consumer’s CQA investment sensitivity coefficient is above a certain threshold . This means that platforms will increase their CQA investment level with the increase in when the profitability of the platform’s advertising is low, and the CQA investment made by the platform can bring more efficient use to consumers. As the cross-network effects obtained by producers increase, the CQA investment of the platform will increase when the CQA investment sensitivity coefficient of consumers is above a certain threshold .
In the M-S scenario, the platform’s advertising level is also affected by both types of network effects and , but the effect is non-monotonic in this case. Specifically, when one of the platform’s unit ad price and consumer sensitivity to CQA investment is above a certain threshold and the other is below a certain threshold ( and ), the level of advertising increases as the network effects obtained by consumers increases. When both r and are above a certain threshold (), the level of advertising increases when the network effects obtained by the producers increases.
Part (iii) shows that in the scenario where consumers are multi-homing, platforms will have an additional incentive to increase CQA investments to attract more consumers if consumers’ preferences for high-quality content increase. As a result, the overall number of consumers accessing the platform increases and, at the same time, platforms will engage in more advertising to generate more revenue.
4.3. Single-Homing Consumers and Multi-Homing Producers
Figure 3 shows the user structure of the platforms when multi-homing occurs only on the producer side (S-M scenario).
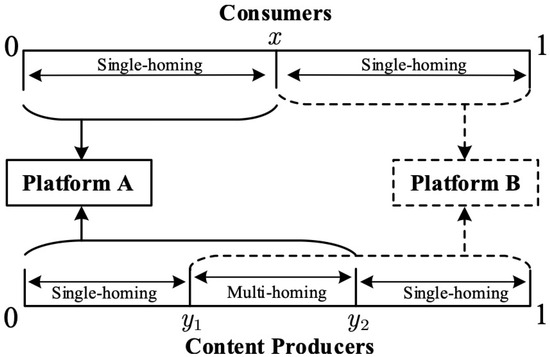
Figure 3.
User structure of the platforms in the S-M scenario.
As shown in Figure 3, consumers only join one platform, and the utility gained by joining either platform A or B is the same as for consumers in the S-S scenario given by Equations (2) and (3). The location of the consumer, who is indifferent between joining platform A or B can be expressed in the S-M scenario as
All consumers located on the left of x will join platform A, and all consumers located on the right of x will join platform B.
In the S-M scenario, there exists a proportion of producers who join both platforms to provide content. As shown in Figure 3, the marginal producer, who is indifferent between joining only platform A (single-homing) and joining both platforms (multi-homing) is located at . Similarly, the marginal producer, who is indifferent between joining only platform B (single-homing) and joining both platforms (multi-homing) is located at .
The utility of single-homing producers joining platform i is the same as in the S-S scenario given by Equations (4) and (5). The utility of multi-homing producers can be expressed as
The two indifferent points and of the producers can be derived from and .
From Figure 3, we can observe that all producers located on the left of join platform A and all consumers located on the right of join platform B. The demand function of producers on platforms A and B can thus be derived as
To ensure the existence of multi-homing producers, i.e., , we assume that .
We can derive the number of consumers joining platforms A and B as
By combining (15)–(19), we can obtain the number of consumers and content producers of platforms A and B. By substituting these demand functions into the profit function (1) and solving the corresponding maximization problem, we derive Proposition 3.
Proposition 3.
- (i)
- The equilibrium exists and is unique if the consumers’ disutility from advertising is sufficiently large with .
- (ii)
- In equilibrium, the level of advertising on platform i is given byand the CQA investment on platform i is
- (iii)
- In equilibrium, the number of consumers on platform i isand the number of producers on platform i is
Proof.
See Appendix A. □
The condition that ensures the existence of an equilibrium is the same as in the S-S scenario. Moreover, as in the S-S scenario, the platform will always place ads, i.e., since In addition, the platform invests in CQA, i.e., if the cross-network effects obtained by consumers are sufficiently weak with .
In the S-M scenario, the duopoly platforms have their own single-homing producers and share the multi-homing producers in the market, while dividing the consumers equally. In this scenario, the platform’s equilibrium advertising and CQA investment levels are the same as in the S-S scenario, but the platform has a larger number of producers, which leads to Corollary 3.
Corollary 3.
- (i)
- As the cross-network effects obtained by consumers increase, both the CQA investment and the level of advertising decrease, i.e.,
- (ii)
- As the cross-network effects obtained by producers increase, the CQA investment is unaffected, but the level of advertising decreases, i.e.,
- (iii)
- As consumers’ sensitivity γ to CQA investment increases, the CQA investment increases, but the level of advertising is unaffected, i.e.,
Proof.
See Appendix A. □
Corollary 3 shows that the cross-network effects and consumers’ sensitivity coefficients of CQA investment have the same effect on the level of platform advertising and CQA investment in the S-M scenario as in the S-S scenario. As consumers’ sensitivity to CQA investment increases, platforms will increase CQA investment, which will increase costs for producers and cause a decline in the number of producers.
4.4. Multi-Homing on Both Sides
Figure 4 shows the user structure of the platforms when multi-homing occurs on both market sides (M-M scenario).
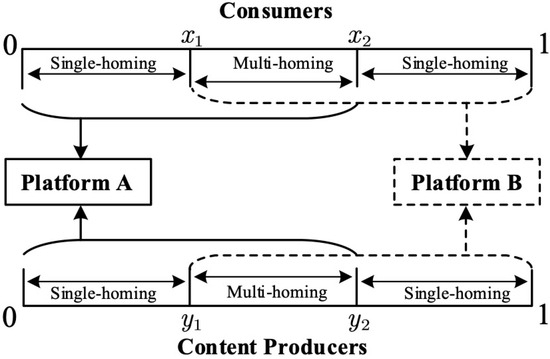
Figure 4.
User structure of the platforms in the M-M scenario.
As shown in Figure 4, consumers and content producers join both platforms. The utility functions of consumers and producers who join both platforms are the same as in Equations (8) and (14) from which we can derive the demand functions of consumers and producers on platforms A and B. By substituting these demand functions into the profit function (1) and solving the corresponding maximization problem, we derive Proposition 4.
Proposition 4.
- (i)
- The equilibrium exists and is unique if the consumers’ disutility from advertising is sufficiently large with .
- (ii)
- In equilibrium, the level of advertising on platform i is given byand the level of CQA investment on platform i is
- (iii)
- In equilibrium, the number of consumers on platform i isand the number of producers on platform i is
Proof.
See Appendix A. □
Part (i) shows that consumers’ disutility from advertising must satisfy to ensure the existence of an equilibrium solution.
From Part (ii), we can derive that the platform invests in CQA, i.e.,
As a consequence, the platform will make CQA investments in the M-M scenario only when the cross-network effects and are both sufficiently large. Moreover, the conditions and ensure that the platform will always place ads, i.e., .
In the M-M scenario, multi-homing users are on both sides of the platform. The equilibrium strategy of the platform is affected by both types of cross-network effects and the sensitivity coefficient of CQA investment. We summarize these results in Corollary 4.
Corollary 4.
- (i)
- As the cross-network effects obtained by consumers increase, both the CQA investment and the level of advertising level decrease, i.e.,
- (ii)
- The cross-network effects obtained by producers have an ambiguous effect on both the CQA investment and the level of advertising, i.e.,
- (iii)
- As consumers’ sensitivity γ to CQA investment increases, both the CQA investment and the level of advertising decrease, i.e.,
Proof.
See Appendix A. □
Part (i) reflects that as the cross-network effects obtained by consumers increase when multi-homing exists for both users, the level of CQA investment and advertising on the platform decrease accordingly, which is the same result as in Corollaries 1 and 3.
Part (ii) reflects that as the cross-network effects obtained by producers increase, the CQA investment on the platform increases when the platform’s unit advertising revenue r is above the threshold . The conditions that need to be satisfied for the platform’s advertising level to increase with , in addition to r being above or below the threshold , require to be below or above the threshold .
Part (iii) shows that CQA investments as well as the level of advertising on the platform decrease when the consumers’ sensitivity to CQA investment increases.
4.5. Comparison
In this section, we compare the four scenarios and determine the conditions under which users have preferences for single-homing and multi-homing, respectively. We derive the following proposition.
Proposition 5.
- (i)
- Consumers are multi-homing and producers are single-homing (M-S scenario) if the network effects obtained by producers are sufficiently weak, i.e.,
- (ii)
- Consumers are single-homing and producers are multi-homing (S-M scenario) if the network effects obtained by consumers are sufficiently strong, i.e.,
- (iii)
- Consumers and producers are multi-homing (M-M scenario) if the network effects obtained by consumers are sufficiently weak and the network effects obtained by producers are sufficiently strong, i.e.,
- (iv)
- In all other scenarios, consumers and producers are single-homing (S-S scenario).
Proof.
See Appendix A. □
Proposition 5 characterizes the conditions under which consumers and producers choose to join platform A, platform B, or both platforms. We find that the user’s decision depends on the strength of the cross-network effects. Part (i) shows that in the case of sufficiently weak cross-network effects obtained by producers, platforms can reduce the level of advertising to attract more consumers to the platform to maintain the number of producers on the platform, and, thus, consumers have incentives to join both platforms. When, on the other hand, the cross-network effects obtained by consumers are strong (Part ii), the platforms provide less CQA investment, which reduces the negative utility of producers and thus increases incentives for producers to choose multi-homing. Part (iii) illustrates the case of multi-homing on both market sides: When the cross-networking effects obtained by consumers are weak, platforms realize more CQA investments, which makes them more attractive to consumers and less attractive to producers. At the same time, when the cross-network effects obtained by producers are strong, the larger number of consumers implies that producers can obtain greater cross-network utility, which increases the platform’s attractiveness for the producers. The simultaneous occurrence of these two conditions results in multi-homing behavior for both sides of users.
5. Numerical Analysis
In this section, we conduct several numerical analyses that enable us to illustrate our results graphically. In Figure 5, we examine the impact of the cross-network effects on the platforms’ CQA investment levels in the four scenarios. The parameters are set to , , , , , and .
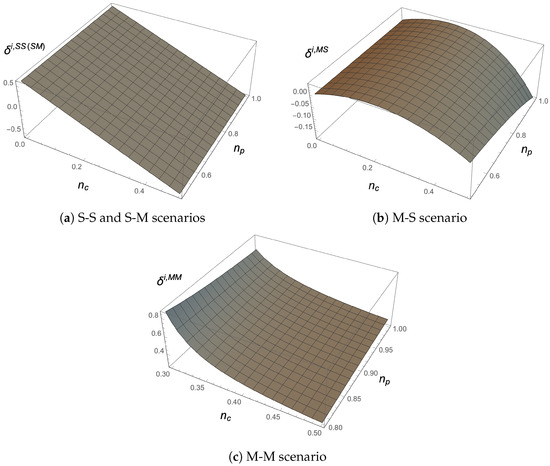
Figure 5.
Impact of network effects on CQA investments.
Figure 5a confirms that in the S-S and S-M scenarios, the platforms’ CQA investments decrease monotonically with the cross-network effects obtained by consumers, but they are not affected by the cross-network effects obtained by producers. Figure 5b reflects the non-monotonic effect of and on the CQA investment of the platforms in the M-S scenario. Specifically, the figure shows that the CQA investments of the platforms first increase and then decrease as increases. Figure 5c shows that in the M-M scenario, the CQA investments of the platforms are monotonically decreasing with . The effect of on the CQA investments of the platforms is non-monotonic. These results are consistent with Corollaries 1–4.
Figure 6 extends our results by examining the impact of the sensitivity coefficient and the cross-network effects obtained by the respective users on the users’ demand. In particular, the impact on consumer demand is illustrated in panels (a) and (c), while producer demand is displayed in panels (b) and (d). The parameters are set to , , , , and .
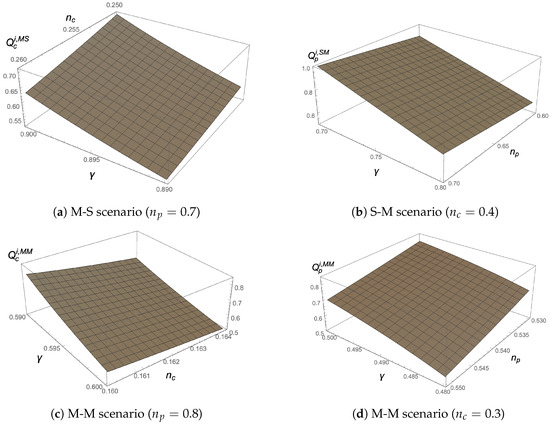
Figure 6.
Impact of network effects and sensitivity coefficient of CQA on user demand.
Figure 6 shows that in the M-S scenario, the platforms attract more consumers if the sensitivity coefficient increases and the network effects obtained by consumers decreases (Figure 6a), whereas, in the S-M scenario, the platforms attract fewer producers if the sensitivity parameter increases and the network effects obtained by producers decreases (Figure 6b). In the M-M scenario, a higher sensitivity coefficient decreases demand on the consumer side (Figure 6c) but increases demand on the producer side (Figure 6d). The opposite is true for stronger network effects.
6. Conclusions
Media platforms facilitate interaction between two or more market sides, with user-generated content (UGC) platforms being a notable category that primarily hosts content produced by content creators. Network externalities characterize competition among UGC platforms since participants on one side of the platform derive significant utility from participants on the other market side(s) [5,7]. We developed a model to analyze the competition between two UGC platforms to enhance our understanding of such platform competitions.
In our model, each platform can choose its level of investment in a content quality assurance (CQA) system and its level of advertising. CQA investment is an essential tool for improving the quality of user-generated content on UGC platforms. However, cross-network effects complicate the situation, as the operational strategies of the platforms and bilateral user engagement decisions are no longer independent: investing in CQA systems may benefit consumer attraction but place an additional burden on content producers. This is an essential difference between our paper and studies such as [29,31] that only consider investments that impact users on one side. In contrast, CQA investments in this paper will simultaneously impact users on both sides.
Our findings indicate that network effects are crucial in determining the platforms’ optimal strategies regarding CQA investment and advertising levels and user behavior (single- vs. multi-homing). First, our research has identified distinct patterns in user behavior related to network effects. Specifically, when network effects for producers are weak, consumers tend to use multiple platforms (multi-home), and producers prefer to use only one platform (single-home). In contrast, when network effects for consumers are strong, consumers are more likely to single-home, and producers are inclined to multi-home. These findings reveal a complex interplay between network effects and user behavior, where the strength of network effects for different user groups (consumers and producers) influences their platform choices. Understanding these dynamics is essential for platforms as they navigate the competitive landscape of UGC platforms. The tendency of users to single-home or multi-home has direct implications for platform strategies, including content curation, advertising, and user engagement.
Second, our research indicates that platforms will invest in CQA if the network effects for consumers are weak, except when consumers and producers join multiple platforms. This result highlights the importance of CQA as a strategic investment to ensure content quality and user satisfaction. Thus, the decision to invest in CQA is not merely a quality control measure but a strategic response to the platform’s network dynamics. When network effects are not strong enough to retain users, CQA investment becomes vital to attract and keep users engaged. Ensuring content quality can enhance the platform’s reputation, increase user trust, and foster a more vibrant and engaged community. It also helps in compliance with legal and regulatory requirements related to content moderation.
Based on our results, we can derive several recommendations for UGC platforms:
(i) Platforms should invest in data analytics to understand consumers’ and producers’ preferences and behaviors. This includes identifying the factors that influence their tendency to single-home or multi-home. Based on the insights gained from user behavior analysis, platforms can tailor their content and advertising strategies to align with user preferences. For example, if consumers are likely to multi-home, platforms may need to offer unique content or features that differentiate them from competitors.
(ii) Platforms should continuously monitor the strength of network effects and adjust strategies accordingly [41]. If network effects for producers become stronger, platforms may need to shift their focus to attract and retain more consumers, and vice versa.
(iii) Platforms should design and implement robust CQA systems that include both automated algorithms and human review [42]. Automation can efficiently handle large volumes of content, while human judgment ensures nuanced understanding and interpretation of quality standards. This ensures that content meets quality standards, adheres to community guidelines, and meets legal requirements.
(iv) Platforms should engage content creators in the quality assurance process, providing them with clear guidelines, feedback, and support to enhance content quality. Collaboration fosters a sense of ownership and alignment with platform standards. Moreover, platforms should clearly communicate the platform’s quality standards, moderation policies, and CQA processes to content creators and consumers. Transparency fosters trust and helps users understand what to expect from the platform.
(v) Platforms should implement mechanisms to gather and analyze user feedback on content quality. User feedback is a valuable source of insights for continuous improvement and alignment with user expectations.
In summary, maximizing profits and improving content quality requires a multifaceted approach that considers content pricing, advertising optimization, quality assurance collaboration, and innovation. Balancing the interests of content creators and consumers demands a thoughtful strategy that fosters collaboration, feedback, incentives, transparency, and continuous monitoring. Together, these strategies contribute to a thriving UGC platform that aligns with the interests of all stakeholders and positions the platform for long-term success in a competitive market.
While specific in its focus, our research on UGC platforms offers insights and principles that can be applied to a broader context, encompassing various two-sided markets and regulatory considerations [43]. The dynamics of network effects, user behavior, and platform competition explored in our research can be applied to online marketplaces, such as Amazon and eBay [44]. Understanding how buyers and sellers interact and how pricing and quality assurance strategies influence behavior can inform more effective marketplace management. Similarly, our findings on content quality, user engagement, and advertising strategies can be translated to social media platforms, such as Facebook and Twitter, where the balance between content relevance, user experience, and monetization is a universal challenge in two-sided platforms. Our research also shows how network effects can lead to platform dominance, where a single platform captures a significant market share. This has implications for antitrust regulation, as regulators must consider how network effects influence competition and market entry. Insights into platform competition, pricing strategies, and user behavior can inform regulatory strategies that promote fair competition, protect consumer interests, and foster innovation [45]. Understanding the nuanced dynamics of two-sided markets is essential for effective regulation [46].
Furthermore, our exploration of CQA has broader implications for content moderation and platform governance [42]. How platforms balance quality control, freedom of expression, and legal compliance is a universal challenge in the digital age. Insights into user behavior and platform strategies must also be considered in the context of data privacy and security [47]. Ethical handling of user data and transparent communication are vital for trust and sustainability [48].
Our model presents several limitations, primarily due to the simplifying assumptions we have incorporated. For example, we have assumed that the return on advertising (or advertising price) is exogenously determined, and advertisers face no restrictions on the amount of advertising space they can purchase at this price. This contrasts with real-world scenarios where advertisers often encounter constraints in the volume of advertising they can secure, leading to complex interactions with consumers and producers. Another limitation is our assumption that the two UGC platforms are symmetric, overlooking potential asymmetries between platforms, such as variations in service cost, quality, or consumers’ intrinsic value for content. Furthermore, in platforms such as YouTube, the producer’s revenue is derived from the platform’s share of advertising revenue, a factor not considered in our model. Future research could explore these aspects, allowing for heterogeneity and vertical differentiation between platforms to provide a more nuanced understanding of platform CQA investment strategies and reflect a more realistic setting.
In summary, our model serves as a basic framework for further analysis of UGC platform competition in two-sided markets. There is a wide range of potential applications and model extensions. The challenges surrounding UGC platform competition remain a fertile and vital area of inquiry for economics, business, and management.
Author Contributions
Conceptualization, X.Z., M.L. and H.M.D.; methodology, X.Z. and M.L.; software, X.Z. and M.L.; writing—original draft preparation, X.Z. and M.L.; writing—review and editing, X.Z., M.L. and H.M.D.; supervision, M.L. and H.M.D. All authors have read and agreed to the published version of the manuscript.
Funding
This research received no external funding.
Institutional Review Board Statement
Not applicable.
Informed Consent Statement
Not applicable.
Conflicts of Interest
The authors declare no conflict of interest.
Appendix A. Proofs
Appendix A.1. Proof of Proposition 1
In the following, we derive the proof of Proposition 1 in the S-S scenario.
Part (i): The maximization problem of platform i is given by
By substituting the demand function given by Equation (6) into the profit function, we derive the first-order partial derivatives of with respect to and as follows:
From the second-order derivatives of with respect to and , we derive the Hessian matrix as
To ensure the existence and uniqueness of an equilibrium, the Hessian matrix must be a negative definite matrix. Thus, all the leading principal minors of even order must be positive and all leading principal minors of odd order must be negative, which translates into the following conditions:
We derive that these conditions are satisfied if
Part (ii): To derive the optimal level of advertising and the optimal level of CQA investment we solve the above system of first-order conditions for and . We derive
Appendix A.2. Proof of Corollary 1
To verify the comparative statics results of Corollary 1, based on the equilibrium solution of Proposition 1, we derive
Appendix A.3. Proof of Proposition 2
Given that the derivation of the equilibrium solution for Proposition 2 (M-S scenario) is similar to Proposition 1 (S-S), we will not repeat the calculations here.
From the second-order derivatives of with respect to and , we derive the Hessian matrix as
To ensure that is a negative definite matrix, the following conditions must be satisfied:
We derive that these conditions are satisfied if
Appendix A.4. Proof of Corollary 2
Part (i): From the equilibrium solution of Proposition 2, we calculate
and derive
with
Similarly, we calculate
and derive that
with
Part (ii): From the equilibrium solution of Proposition 2, we calculate
and derive that
Similarly, we compute
and derive that
Part (iii): From the equilibrium solution of Proposition 2, we obtain
and can show that
Moreover, we compute
Appendix A.5. Proof of Proposition 3
From the second-order derivatives of with respect to and , we derive the Hessian matrix as
and we see that . Thus, similar to the S-S scenario, the Hessian matrix in the S-M scenario is negative definite if
Appendix A.6. Proof of Corollary 3
Part (i): From the equilibrium solution of Proposition 3, we derive
Part (ii): We compute
Part (iii): We calculate that
Appendix A.7. Proof of Proposition 4
From the second-order derivatives of with respect to and , we derive the Hessian matrix as
Similarly, is a negative definite matrix if the following conditions are satisfied:
We derive that these conditions are satisfied if
Appendix A.8. Proof of Corollary 4
Part (i): From the equilibrium solution of Proposition 4, we derive that
and
From the condition in Proposition 4 that ensures a negative definite matrix, we derive that and compute
Part (ii): Similarly, we calculate
and derive
Moreover, we compute that
and derive that
with
Part (iii): We derive that
Appendix A.9. Proof of Proposition 5
Part (i): To show that consumers are multi-homing and producers are single-homing (M-S scenario) when cross-network effects obtained by producers are sufficiently weak, we proceed as follows. From Proposition 2, we know that the number of consumers on platform i is given by
If , then there are consumers who have chosen to use both platforms, i.e., there are multi-homing consumers. We derive that
Part (ii): For the producers, we can derive a similar condition to ensure that there producers, who have chosen to join both platforms. Specifically, we compute that
Part (iii): Consumers and producers are multi-homing if
and
We derive that
References
- Daugherty, T.; Eastin, M.S.; Bright, L. Exploring Consumer Motivations for Creating User-Generated Content. J. Interact. Advert. 2008, 8, 16–25. [Google Scholar] [CrossRef]
- Saura, J.R.; Reyes-Menéndez, A.; Dematos, N.; Correia, M.B. Identifying Startups Business Opportunities from UGC on Twitter Chatting: An Exploratory Analysis. J. Theor. Appl. Electron. Commer. Res. 2021, 16, 1929–1944. [Google Scholar] [CrossRef]
- GlobalMediaInsight. YouTube User Statistics 2022. 2022. Available online: https://www.globalmediainsight.com/blog/youtube-users-statistics (accessed on 1 November 2022).
- Luca, M. User-Generated Content and Social Media. In Handbook of Media Economics; Elsevier: Amsterdam, The Netherlands, 2015; Volume 1, pp. 563–592. [Google Scholar]
- Rochet, J.C.; Tirole, J. Platform Competition in Two-Sided Markets. J. Eur. Econ. Assoc. 2003, 1, 990–1029. [Google Scholar] [CrossRef]
- Rochet, J.C.; Tirole, J. Two-Sided Markets: A Progress Report. RAND J. Econ. 2006, 37, 645–667. [Google Scholar] [CrossRef]
- Armstrong, M. Competition in Two-Sided Markets. RAND J. Econ. 2006, 37, 668–691. [Google Scholar] [CrossRef]
- Statista. YouTube: Global Advertising Revenues as of Q1 2022. 2022. Available online: https://www.statista.com/statistics/289657/youtube-global-quarterly-advertising-revenues (accessed on 1 November 2022).
- CNET. YouTube Plans More People, Better Algorithms Policing Content. 2017. Available online: https://www.cnet.com/tech/tech-industry/youtube-to-beef-up-staff-algorithms-policing-content/ (accessed on 1 November 2022).
- Jain, S.; Qian, K. Compensating Online Content Producers: A Theoretical Analysis. Manag. Sci. 2021, 67, 7075–7090. [Google Scholar] [CrossRef]
- Toubia, O.; Stephen, A.T. Intrinsic vs. Image-Related Utility in Social Media: Why Do People Contribute Content to Twitter? Mark. Sci. 2013, 32, 368–392. [Google Scholar] [CrossRef]
- Tan, G.; Zhou, J. The Effects of Competition and Entry in Multi-Sided Markets. Rev. Econ. Stud. 2021, 88, 1002–1030. [Google Scholar] [CrossRef]
- Dietl, H.; Lang, M.; Lin, P. Advertising Pricing Models in Media Markets: Lump-sum versus per-Consumer Charges. Inf. Econ. Policy 2013, 25, 257–271. [Google Scholar] [CrossRef]
- Dietl, H.; Lang, M.; Lin, P. The Effects of Introducing Advertising in Pay TV: A Model of Asymmetric Competition between Pay TV and Free TV. BE J. Theor. Econ. 2022. [Google Scholar] [CrossRef]
- Reisinger, M. Platform Competition for Advertisers and Users in Media Markets. Int. J. Ind. Organ. 2012, 30, 243–252. [Google Scholar] [CrossRef]
- Anderson, S.P.; Foros, Ø.; Kind, H.J. The Importance of Consumer Multihoming (Joint Purchases) for Market Performance: Mergers and Entry in Media Markets. J. Econ. Manag. Strategy 2019, 28, 125–137. [Google Scholar] [CrossRef]
- Amaldoss, W.; Du, J.; Shin, W. Media Platforms’ Content Provision Strategies and Sources of Profits. Mark. Sci. 2021, 40, 527–547. [Google Scholar] [CrossRef]
- Esteban, L.; Hernández, J.M. Specialized Advertising Media and Product Market Competition. J. Econ. 2012, 106, 45–74. [Google Scholar] [CrossRef]
- Economides, N.; Tåg, J. Network Neutrality on the Internet: A Two-Sided Market Analysis. Inf. Econ. Policy 2012, 24, 91–104. [Google Scholar] [CrossRef]
- Hotelling, H. Stability in competition. Econ. J. 1929, 39, 41–57. [Google Scholar] [CrossRef]
- Zailskaite-Jakste, L.; Minelgaite, I. Consumer engagement behavior perspective in social media: Mediating role and impact on brand equity. J. East. Eur. Cent. Asian Res. 2021, 8, 160–170. [Google Scholar] [CrossRef]
- Ihlström Eriksson, C.; Åkesson, M.; Lund, J. Designing Ubiquitous Media Services-Exploring the Two-Sided Market of Newspapers. J. Theor. Appl. Electron. Commer. Res. 2016, 11, 1–19. [Google Scholar] [CrossRef]
- Prasad, A.; Mahajan, V.; Bronnenberg, B. Advertising versus Pay-per-View in Electronic Media. Int. J. Res. Mark. 2003, 20, 13–30. [Google Scholar] [CrossRef]
- Shi, Z.; Zhang, K.; Srinivasan, K. Freemium as an Optimal Strategy for Market Dominant Firms. Mark. Sci. 2019, 38, 150–169. [Google Scholar]
- Barros, P.P.; Kind, H.J.; Nilssen, T.; Sørgard, L. Media Competition on the Internet. BE J. Econ. Anal. Policy 2005, 4, 1–20. [Google Scholar] [CrossRef]
- Kind, H.J.; Nilssen, T.; Sørgard, L. Business Models for Media Firms: Does Competition Matter for How They Raise Revenue? Mark. Sci. 2009, 28, 1112–1128. [Google Scholar] [CrossRef]
- Armstrong, M.; Wright, J. Two-Sided Markets, Competitive Bottlenecks and Exclusive Contracts. Econ. Theory 2007, 32, 353–380. [Google Scholar] [CrossRef]
- Chellappa, R.K.; Mukherjee, R. Platform Preannouncement Strategies: The Strategic Role of Information in Two-Sided Markets Competition. Manag. Sci. 2021, 67, 1527–1545. [Google Scholar] [CrossRef]
- Dou, G.; He, P.; Xu, X. One-Side Value-Added Service Investment and Pricing Strategies for a Two-Sided Platform. Int. J. Prod. Res. 2016, 54, 3808–3821. [Google Scholar] [CrossRef]
- Zhang, X.; Sui, R.; Dan, B.; Guan, Z. Bilateral Value-Added Services and Pricing Strategies of the Third-Party Platform Considering the Cross-Network Externality. Comput. Ind. Eng. 2021, 155, 107196. [Google Scholar] [CrossRef]
- Jung, D.; Kim, B.C.; Park, M.; Straub, D.W. Innovation and Policy Support for Two-Sided Market Platforms: Can Government Policy Makers and Executives Optimize Both Societal Value and Profits? Inf. Syst. Res. 2019, 30, 1037–1050. [Google Scholar] [CrossRef]
- Bakos, Y.; Halaburda, H. Platform Competition with Multihoming on Both Sides: Subsidize or Not? Manag. Sci. 2020, 66, 5599–5607. [Google Scholar] [CrossRef]
- Bel, G.; Calzada, J. Access pricing to a digital broadcasting platform. J. Media Econ. 2007, 20, 29–53. [Google Scholar] [CrossRef][Green Version]
- Calzada, J.; Valletti, T.M. Network competition and entry deterrence. Econ. J. 2008, 118, 1223–1244. [Google Scholar] [CrossRef]
- Becker, G.S.; Murphy, K.M. A Simple Theory of Advertising as a Good or Bad. Q. J. Econ. 1993, 108, 941–964. [Google Scholar] [CrossRef]
- Depken II, C.A.; Wilson, D.P. Is Advertising a Good or a Bad? Evidence from US Magazine Subscriptions. J. Bus. 2004, 77, S61–S80. [Google Scholar] [CrossRef]
- Reisinger, M.; Ressner, L.; Schmidtke, R. Two-Sided Markets with Pecuniary and Participation Externalities. J. Ind. Econ. 2009, 57, 32–57. [Google Scholar] [CrossRef]
- Kaiser, U.; Song, M. Do media consumers really dislike advertising? An empirical assessment of the role of advertising in print media markets. Int. J. Ind. Organ. 2009, 27, 292–301. [Google Scholar] [CrossRef][Green Version]
- Dietl, H.; Duschl, T.; Franck, E.; Lang, M. A contest model of a professional sports league with two-sided markets. Jahrb. Natl. Stat. 2012, 232, 336–359. [Google Scholar] [CrossRef][Green Version]
- Grossmann, M.; Lang, M.; Dietl, H.M. A Dynamic Contest Model of Platform Competition in Two-Sided Markets. J. Theor. Appl. Electron. Commer. Res. 2021, 16, 2091–2109. [Google Scholar] [CrossRef]
- Farrell, J.; Klemperer, P. Coordination and lock-in: Competition with switching costs and network effects. Handb. Ind. Organ. 2007, 3, 1967–2072. [Google Scholar] [CrossRef]
- Gillespie, T. Custodians of the Internet: Platforms, Content Moderation, and the Hidden Decisions that Shape Social Media; Yale University Press: New Haven, CT, USA, 2018. [Google Scholar]
- Rysman, M. The economics of two-sided markets. J. Econ. Perspect. 2009, 23, 125–143. [Google Scholar] [CrossRef]
- Hagiu, A.; Wright, J. Multi-sided platforms. Int. J. Ind. Organ. 2015, 43, 162–174. [Google Scholar] [CrossRef]
- Edelman, B.G.; Geradin, D. Efficiencies and regulatory shortcuts: How should we regulate companies like Airbnb and Uber. Stanf. Technol. Law Rev. 2015, 19, 293. [Google Scholar] [CrossRef]
- Evans, D.S.; Schmalensee, R. The Antitrust Analysis of Multi-Sided Platform Businesses; Technical Report; National Bureau of Economic Research: Cambridge, MA, USA, 2013. [Google Scholar]
- Solove, D.J. A taxonomy of privacy. Univ. Pa. Law Rev. 2005, 154, 477. [Google Scholar] [CrossRef]
- Cohen, J.E. Configuring the Networked Self: Law, Code, and the Play of Everyday Practice; Yale University Press: New Haven, CT, USA, 2012. [Google Scholar]


Disclaimer/Publisher’s Note: The statements, opinions and data contained in all publications are solely those of the individual author(s) and contributor(s) and not of MDPI and/or the editor(s). MDPI and/or the editor(s) disclaim responsibility for any injury to people or property resulting from any ideas, methods, instructions or products referred to in the content. |
© 2023 by the authors. Licensee MDPI, Basel, Switzerland. This article is an open access article distributed under the terms and conditions of the Creative Commons Attribution (CC BY) license (https://creativecommons.org/licenses/by/4.0/).