Article

A Hyper-Personalized Product Recommendation System Focused on Customer Segmentation: An Application in the Fashion Retail Industry

by
Emre Yıldız
1,
Ceyda Güngör Şen
2 and
Eyüp Ensar Işık
2,*
1
Department of IT System Development, Colin’s Erk Marketing and Clothing Industry and Trade Inc., İstanbul 34396, Turkey
2
Department of Industrial Engineering, Yildiz Technical University, İstanbul 34220, Turkey
*
Author to whom correspondence should be addressed.
J. Theor. Appl. Electron. Commer. Res. 2023, 18(1), 571-596; https://doi.org/10.3390/jtaer18010029
Submission received: 19 January 2023 / Revised: 22 February 2023 / Accepted: 9 March 2023 / Published: 11 March 2023

Abstract

:
Providing the right products, at the right place and time, according to their customer’s preferences, is a problem-seeking solution, especially for companies operating in the retail industry. This study presents an integrated product RS that combines various data mining techniques with this motivation. The proposed approach consists of the following steps: (1) customer segmentation; (2) adding the location dimension and determining the association rules; (3) the creation of product recommendations. We used the RFM technique for customer segmentation and the k-means clustering algorithm to create customer segments with customer-based RFM values. Then, the Apriori algorithm, one of the association rule mining algorithms, is used to create accurate rules. In this way, cluster-based association rules are created. Finally, product recommendations are presented with a rule-based heuristic algorithm. This is the first system that considers customers’ demographic data in the fashion retail industry in the literature. Furthermore, the customer location information is used as a parameter for the first time for the clustering phase of a fashion retail product RS. The proposed systematic approach is aimed at producing hyper-personalized product recommendations for customers. The proposed system is implemented on real-world e-commerce data and compared with the current RSs used according to well-known metrics and the average sales information. The results show that the proposed system provides better values.

1. Introduction

The rapid development of technology and its cheaper and widespread use cause the increase of data in electronic media daily. How these stored data will be interpreted, how and where they will be used, and how to access information are fundamental problems. Such problems lead to the emergence and development of new fields of study. Recommendation Systems (RS) is a new field of study that was put forward in parallel with these developments [1,2,3,4,5].
RSs are information filtering technology that predicts users’ interest and appreciation for an object they have never encountered before, using past interest and appreciation data on products (music, books, movies, etc.) [6,7,8]. RSs are currently being used actively in many sectors, especially in the retail industry. They enable customers to have personalized experiences by offering the right product to the right customer at the right time [1,9,10]. However, the most critical question always arises before the practitioners which product will be recommended to which customer. In this context, no RS application in the literature considers customer demographic data in the fashion retail industry. This situation, that is, the fact that the customer location information was not used as a segmentation parameter in the studies, constitutes the motivation of this study.
The use of demographic information on customers in RSs, especially in the clothing field, may be beneficial in terms of the accuracy of the recommendations. Hyper-personalized systems can be provided by adding information such as the region where the purchase is made or data presenting the customer demographics to the RS [11]. Hyper-personalized systems have uses in the retail field [12]. However, its use in the fashion retail industry is limited [13,14]. Existing studies focus on points different from RS and do not use customer location information.
To fill this gap in the literature, this study aims to create a hyper-personalized RS that includes the stages of a basket analysis with the Association Rule Mining (ARM) technique after customers are divided into clusters with RFM segmentation and geolocation data. For this purpose, an RS is established and tested on the actual data of a company operating in the fashion retail industry.
The remainder of this paper is organized as follows. In Section 2, RSs and some techniques used for them are explained, and the studies conducted in the literature are summarized and evaluated. In Section 3, the established RS model is described, and the techniques and methods used within the scope of this model are also explained in the same section. In Section 4, the implementation steps made within the scope of the defined model are presented, and the results of the implementation made within this scope are evaluated. Section 5 includes the general evaluation of the study and recommendations for future studies with the results.

2. Related Work

This section gives general information about the RS and Collaborative Filtering (CF) approach, and studies on the subject are examined.

2.1. Recommendation Systems

RSs are a phenomenon that has been frequently encountered by individuals recently. In their daily lives, people are faced with the decisions of how to spend their time and money at many stages of their lives and which choice will be better for their future. Traditionally, individuals either consult experts in such a decision stage, receive support from third-party software, use the internet, or simply follow the crowd [15]. Since these recommendations are not specific to the person, they often do not work. Here, RSs are a new tool developed to minimize these negativities. RSs are software tools and techniques that enable the recommendation of “objects” that may be of most interest to targeted/designated users [16].
Recommendations and predictions are presented as a result of the RS studies. Evaluation criteria measure the quality of the methods, approaches, and algorithms used to generate these recommendations and predictions. Evaluation criteria enable the comparison of the recommendation lists made by different methods for the same data set and facilitate the selection. Various evaluation measures are frequently used in the literature. These include metrics that measure the accuracy of predictions, such as Mean Absolute Error (MAE), Root of Mean Square Error (RMSE), Normalized Mean Average Error (NMAE), or coverage, such as Precision, Recall, and F1 [17].
RSs assist the customer in product selection, especially in systems or processes where the product range is wide [18]. With increasingly widespread e-commerce sites, the number of users and the amount of data to be managed is increasing. Here, it is difficult to predict the customer’s interest in the big data generated. RSs save the producer from excessive time and labor loss in such cases. In addition to this benefit, RSs provide more diverse product sales and increase customer trust and loyalty.
The RS’s basic flowchart is shown in Figure 1. Here, the User represents many users whose characters, interests, and requests are different. User Profile means the user’s likes, requests, and demographic information, requested during the first registration or obtained using various methods based on the user’s attitudes over time. The User–Item Matrix is the matrix that reflects the users’ opinions about the content in the system. The user fills the item matrix, and the information in this matrix can be requested from the user in different forms (numerical evaluation, verbal evaluation, binary, etc.) [19]. Item information represents the products’ contents, years of manufacture, types, etc.
The development of RS in modern terms has taken place in the last 25 years. RS’s origins go back to a global discussion/exchange system called Usenet [20]. From this system in the late 1970s until 1992, a limited number of studies were conducted, mostly on content filtering.
The primary growth in the literature started at the end of the 1990s. Establishing and publishing the first collaborative RS in Xerox’s research center in Palo Alto in 1992 is the modern beginning of the RS’s literature.
With the widespread use of internet technologies and the development of hardware technologies, there has been an increase in recent studies conducted, thanks to the technological relaxation in data processing. In a search in academic databases with the keyword “recommender system”, there are 1531 records between 1969 and 2005, while there are 30,945 records since 2005. This alone is enough to show the growth momentum in the literature. RSs are generally classified according to their estimation approach [21]. As seen in Figure 2, dividing the RS studies into four main categories is possible.
RSs with a content-based approach are considered one of the topics that are the beginning of information processing [22]. Unlike today’s systems that ignore content information [23], the use of content information has proven to be very helpful in processing and accessing information [24]. User profile and product feature databases are used in content-based approaches. If there is not enough information about the user’s profile, the user’s profile is created using the products that this user has rated in the past. Later, products suitable for this profile are recommended to the user [25,26]. In content-based systems, a result is obtained by comparing the user profile vector and the product properties vector.
The basic flowchart of the content-based approach is given in Figure 3. As can be seen here, if the user does not have a profile created before, the profile of the user is created using the product profile and user-item matrix information.
A new trend began when Goldberg et al. [27] introduced the collaborative approach (CF) as an alternative to the content-based approach [23]. Applications of this technique, new at that time, became popular in product recommendations and achieved commercial success [28].
CF algorithms work according to the logic that similar users have similar interests [29]. Recommendations are made to the user with the data obtained from the active user’s past information and other users’ past information. The more a user’s past evaluations of the products overlap with the previous evaluations of the active user, the more similar that user is to the active user. Users with high similarity with the active user play an active role in determining the interest of the active user in the product in question.
Collaborative RSs can be divided into two general groups [30]: Model-based and Memory-based algorithms. Model-based algorithms create a model using the user-item evaluation matrix when the user is not in the system (offline). When the user logs into the system, they offer recommendations to the user using this previously installed model. Memory-based algorithms generate recommendations for the user by using the entire user-item evaluation matrix while the user is in the system (online).
Like all intelligent systems, RSs use different forms of information [31]. Collaborative approaches only use user reviews for products, while content-based approaches use user profiles and product attribute information. However, there are points where both are advantageous and disadvantageous. Therefore, choosing these approaches may not be the best option in many cases. In knowledge-based approaches developed to fill this gap, users are asked to enter information about the object they want to access. The entered data is converted into product recommendations through Knowledge Bases. This information includes rules for simulating objects and similarity functions.
Hybrid approaches occur when combining two or more recommendation techniques to achieve better performance or overcome problems and constraints one cannot overcome [32]. While RSs with a content-based approach generally operate on product features and textual content, systems with a collaborative approach benefit from user similarities through the user–item evaluation matrix. In RSs with a knowledge-based approach, calculations are made based on the information about the objects; however, each approach encounters problems such as cold start, data sparseness, not working reasonably, etc., in practice. For this reason, many researchers are offered hybrid approaches by combining two or more methods to overcome such problems. Sometimes, hybrid approaches are chosen not to overcome a problem but to increase the algorithm’s accuracy.

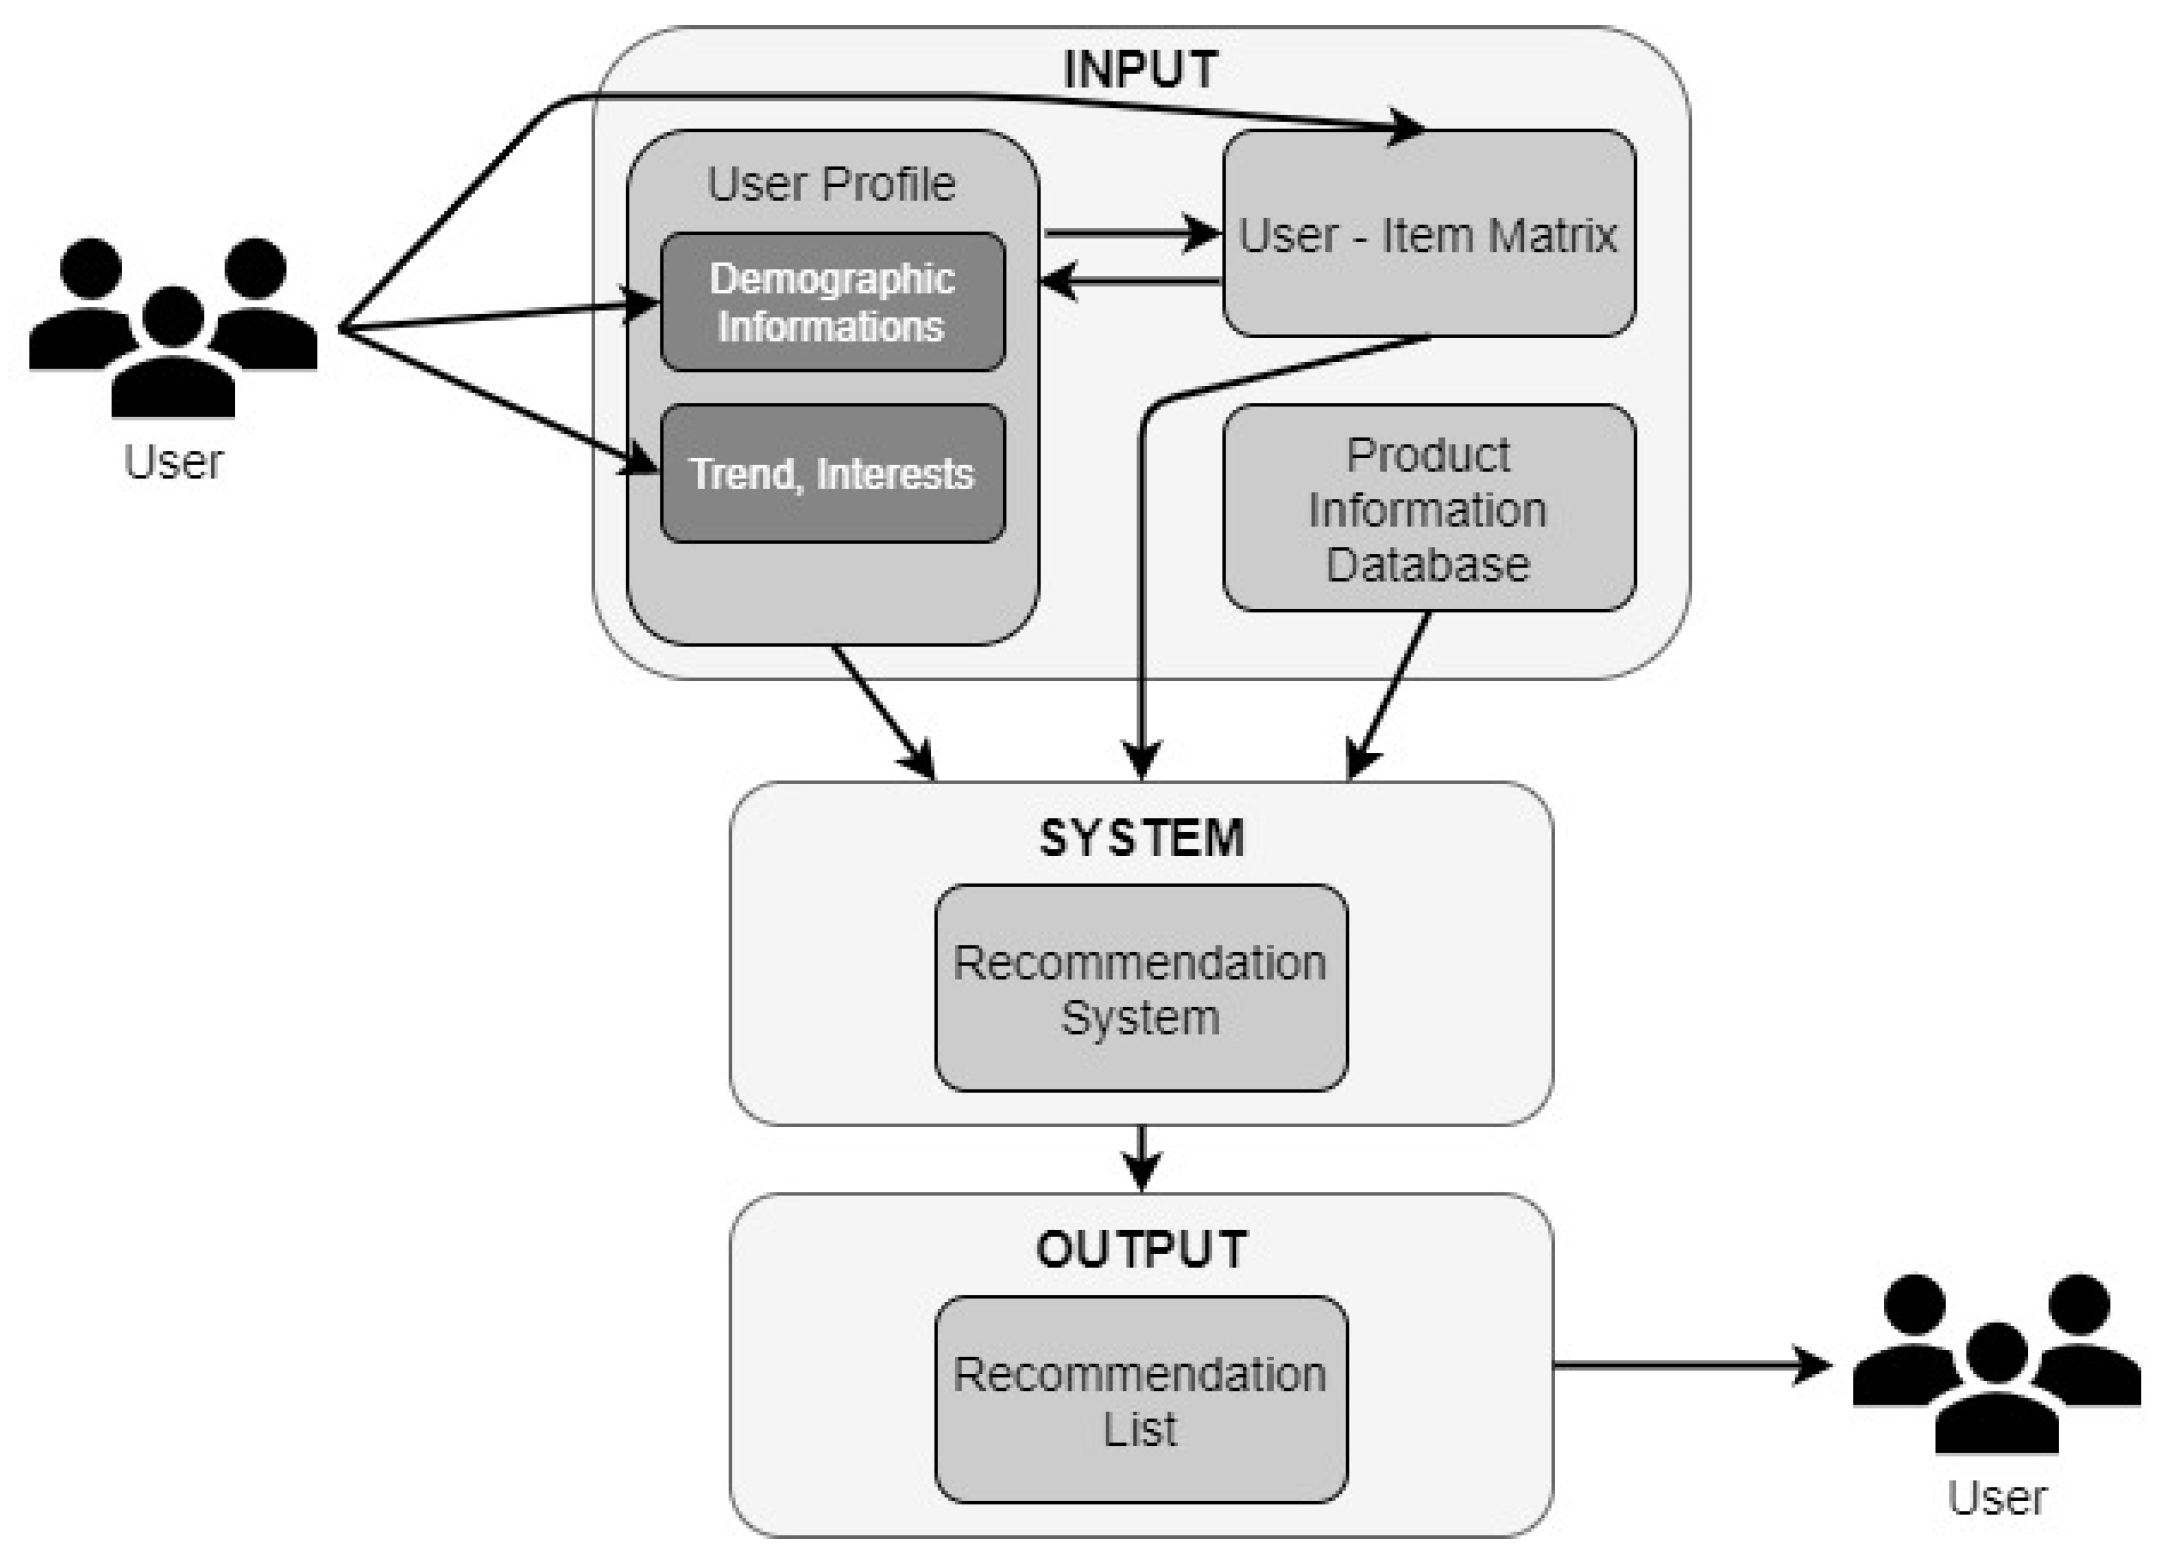
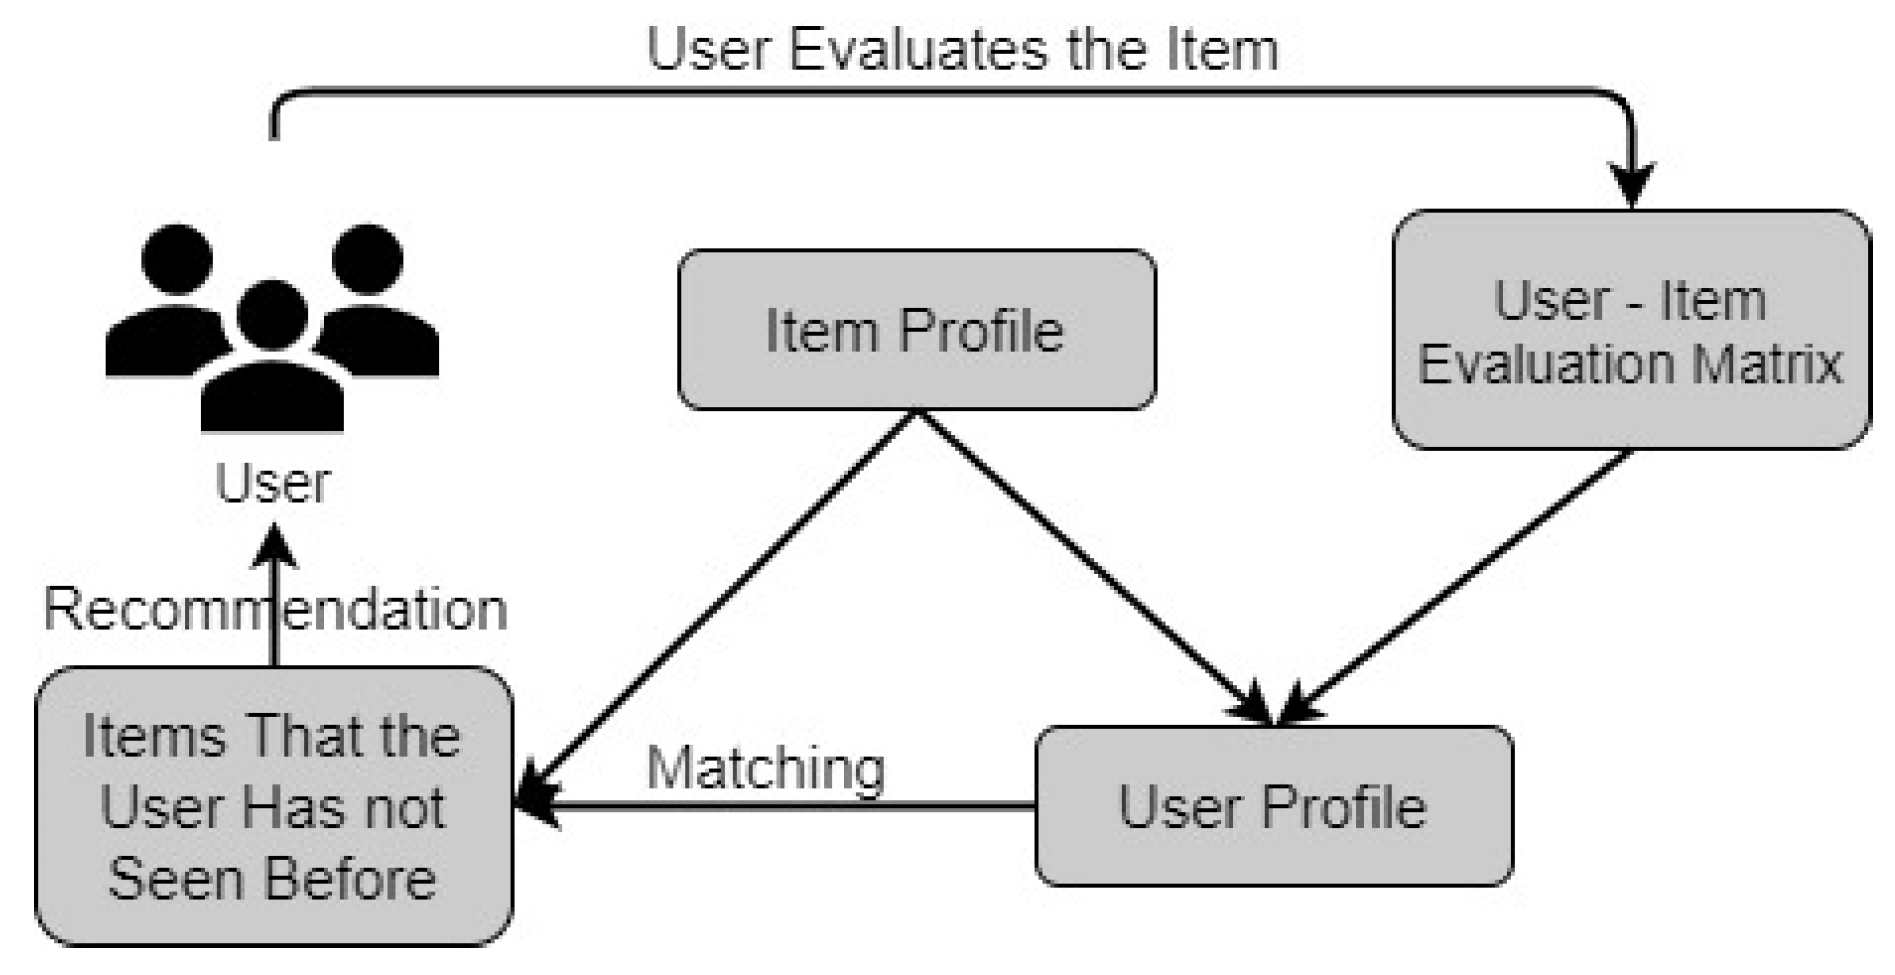
2.2. Structure of Collaborative Filtering Algorithms

RSs with a collaborative approach consisting of three different calculation stages. There are various methods at each stage. From combinations of these methods, a whole RS mechanism is obtained. These stages are Similarity Calculation, Neighborhood Choice, and Prediction Calculation. A small change in any of these stages directly affects the quality of the RS. For this reason, many new approaches are presented by both academic and industrial circles for each calculation stage, and some success has been achieved in some performance criteria (accuracy, speed, customization level, etc.).
The first step of the estimation algorithms is to find the weights that express the similarity of the users with the active user [33]. The values found at this stage are the similarities between the active user and other users, but these values are used as the weight of the relevant user in the estimation calculation phase; that is, it determines how much that user will affect the calculation.
Many similarity-finding algorithms are used in RSs using a collaborative approach. Still, the experimental results showed that the Pearson correlation method is better than other similarity-finding methods in user-based RSs [33].
In the neighborhood selection, previously calculated similarities are used to find the closest neighbors to the active user. User-based collaborative approach algorithms work according to the logic that similar users have similar interests and likes. According to this definition, all users calculated to be similar to active users are not included in the calculation.
Two methods are used to reduce the number of neighborhoods and choose the ones most similar to the active user [34]. The first of these methods is to determine a threshold value, and the second is the k-nearest neighbor method. Both of these techniques used in neighborhood selection have some potential problems. These problems have been discussed in sources such as [21,33].
At the prediction calculation step, the similarities of the users with the active user express the weight of that user in the calculation. In other words, the similarity value of a user with the active user determines how much that user will affect the analysis. Simple Average, Weighted Average and Adjusted Weighted Average (AWA) are the most commonly used estimation methods.
The Simple Average is the most straightforward method in which similarity calculations are not considered in the estimation stage. Although this method provides results in a relatively shorter time, the accuracy of the result is compromised. The weighted average is the most common method used in the estimation calculation phase [21]. This method obtains more accurate results since the users’ proximity to the active user is also considered. In the adjusted weighted average, the evaluation habits of the users and how they perceive the evaluation scale are also taken into account [21,35]. The differences from the user average are used in the calculation instead of the actual rating values. For this reason, it is possible to obtain better results than previous methods.
The system proposed in this study also includes application steps similar to CF. However, it has been tried to avoid the disadvantages of CF. Although the Pearson correlation method provides better results, it may not be the best method for finding neighbors and for weighting the neighbors found. Because it might be products that everyone in many areas loves. Similarity metrics such as Pearson do not see it as more valuable to have a match between two users on a controversial product than on a product liked by everyone [15]. Additionally, if the similarity threshold is set too high in neighborhood selection, there may be few or no neighbors for many users, and no predictions can be made for some products.
On the contrary, if the similarity threshold is too low, the estimation quality decreases since active users and users with low similarity will be included in the calculation [21,33]. Similar problems apply to the selection of the k value in the k-nearest neighbor algorithm [15]. These disadvantages are overcome by segmenting the customers with the RFM method and clustering them with k-means and the location data. The Within Clusters Sum of Square (WSS) method is used to determine the k value for k-means. In many approaches, the estimate is calculated by adding and subtracting a value from the user’s average. However, if the user’s standard deviation is high, the added or subtracted value may be small to find the value the user gives to the product or contrary, it may be large. Instead, cluster-based association rules are presented with Association Rule Mining methods using the obtained customer cluster matches. A product recommendation list is created with a rule-based heuristic algorithm.

2.3. Literature Review on the Development of Recommendation Systems

The studies in the RS’s literature have increased since the end of the 1990s and have grown significantly in quantity, especially in the last decade. In this study, various publications made between 1997 and 2022 are examined. Especially in recent years, thanks to the developments in data mining techniques and infrastructure developments that facilitate the analysis of big data, it is seen that the work conducted in this field has increased. The studies examined and their characteristics are presented in Appendix A.
Among these studies, Pazzani & Billsus [36] is essential as it is one of the first studies in this literature. In this study, the authors analyze the content of web pages using user input. In this context, the Naive Bayes Classification method is compared with other methods. In the following years, different approaches were introduced, and various techniques were used to make product recommendations.
The CF approach is one of the most widely used approaches in the literature. In different studies, recommendation lists are created by combining the CF approach with various techniques. Kim et al. [37] proposed an RS using a Collaborative tagging-based CF approach. After the tags are created in this system, it is decided which item to recommend by the Naïve Bayes Classifier method. In the study by Jomaa et al. [38], users are clustered with a user-based collaborative approach. Then, the objects that the users like and that the active user does not consume in the cluster that the user is included in are recommended. Sun et al. [39] use an object-oriented collaborative approach in their study. In the study, products that are probably sold to relevant users later and similar to those that the user has purchased before are recommended. Hwangbo et al. [40] developed an RS that they named K-RecSys. The purpose of the developed system is to expand the object-based CF algorithm used and to combine online and offline sales data. Iwanaga et al. [41] proposed an approach that improves CF algorithms. The study aims to create a high-quality rating matrix using the shape-restricted optimization model. The authors noted that the approach yielded good results even with limited data. Noulapeu Ngaffo et al. [42] developed a CF-based method that uses a combination of various similarity measures. Their experiments show that the newly developed approach outperforms state-of-the-art CF-based methods based on rating and ranking prediction accuracy.
One of the approaches frequently used in the literature is the content-based approach. Zhao et al. [43] used a content-based approach and developed a weight-based item recommendation approach that uses a novel similarity distance to equalize accuracy and computational complexity. Son & Kim [44] proposed a content-based filtering approach using multi-attribute networks for movie recommendation. The authors emphasized that the method they developed was not affected by sparsity, cold start, and over-specialization problems.
New approaches obtained by combining different approaches are called hybrid approaches. Choi et al. [45] developed a hybrid online product RS, integrating CF and sequential model analysis approaches. Li et al. [46] presented a hybrid product RS that considers customer preferences, products’ quality performances, and retailers’ service performances. Cao et al. [47] proposed an RS product based on product attributes and emphasized that this system outperforms the basic methods of sparse data. Cai et al. [48] proposed a hybrid RS mix of the three base RS. The first clustering is done with the k-means algorithm in the system, and three CF approaches are applied. Then, the coefficients are optimized with the hybrid model, and recommendations are presented. Walek & Fojtik [49] introduced an RS that combines CF, content-based, and fuzzy expert systems and provides movie recommendations. M. Li et al. [50] proposed a hybrid RS that combines CF and content-based methods to recommend Q&A documents. Vahidy Rodpysh et al. [51] drew attention to the cold start problem and presented a hybrid model-driven approach that combines similar measurement methods to overcome it. Zhou et al. [52] stated some of the shortcomings of web service RS and developed a hybrid CF model to eliminate these shortcomings. The developed model calculated the similarity with two different Pearson’s correlation coefficient approaches.
In RSs, segmentation or clustering of customers is used to differentiate customer groups exhibiting similar behaviors. Separating these groups makes it possible to present recommendation lists by creating association rules. Ha [53] developed an RS model in which products are clustered, and users’ RFM segments are created. After these processes, ARM was applied to the developed system, and a product recommendation was made. Liu & Shih [54] established two RS models that adopted different approaches to describing clusters. According to the final set, the authors made recommendations to customers using the ARM method. Lee [55] proposed a model that identifies the most valuable 20% of users according to their RFM scores and makes recommendations to these users. Rodrigues & Ferreira [56] calculated the customers’ RFM values and segmented the customers using the k-means method. Afterward, they applied the ARM method and offered N products to users they had not purchased. Rezaeinia & Rahmani [57] developed a model based on customer clustering over RFM segments. However, unlike other studies, they used weighted RFM values in this study. Then, they used the Expectation-Maximization algorithm to create clusters and determine the nearest neighbors by the k-NN algorithm. A song RS is designed in Najafabadi et al. [58] ‘s study. Here, the songs are grouped according to certain features, and the preference level is determined for the users. There are relationship rules according to this information. Z. Chen et al. [59] proposed a differentially private user-based CF recommendation system based on 𝑘-means clustering to avoid performance degradation caused by differential privacy. Bellini et al. [60] proposed a multi-level clustering approach for the fashion retail industry. It was emphasized that the approach tested in both online and physical stores increased customer interest.
Some researchers used personalized recommendation systems to present the most relevant and compelling information, using customers’ history and behavior to predict customer preferences. Jing et al. [61] proposed a developed CF approach that makes personalized recommendations. They tested their newly developed approach on the data from a popular electronic commerce website in China and showed that the new approach is better. Liji et al. [62] developed a personalized RS that considers user attributes. The authors also considered score matrix filling and presented a new evolutionary clustering method in the study.
In recent years, learning algorithms have also started to be used in RS. Wang et al. [63] emphasize that RSs enable users to select products for individuals with personalized fashion recommendations. The authors recommend a complementary clothing-matching method and use a graph neural network for visual compatibility. Wang and Qiu [64] proposed a fashion collocation recommendation model that uses a deep neural network. The authors used their model for side information in e-commerce. Balim and Özkan [65] generated a dataset with clothing images, compatibility comments, and a common compatibility comment for each image. The authors diagnose outfit compatibility on generated data using deep learning techniques.
How the recommended products are presented to the user or customer is as important as determining the RSs and the recommended product lists. This issue has also attracted the attention of the literature, and various studies have been carried out. Sulikowski [66] drew attention to the importance of the way product recommendations are presented on sites with lots of advertisements. In the study, research including gaze tracking is carried out to monitor human–website interaction indirectly. As a result, the study emphasizes that a vertical layout instead of a horizontal one can be used in interface design and balanced visual density solutions should be used, so buyers do not show habituation behavior. Sulikowski and Zdziebko [67] examine the interfaces of different e-commerce sites, using the events-based behavior analysis tool for vertical, horizontal, and mixed layouts and human–computer interactions, emphasizing the importance of the recommendation zone layout. Sulikowski and Zdziebko [68] used a trained deep neural network to evaluate the recommendation list interface’s performance at which the recommendations’ position and density were presented. Sulikowski et al. [69] emphasize that e-commerce sites offering recommended products with high-density animations to attract users’ attention may have a negative effect. Sulikowski et al. [70] conducted a task-based user eye-tracking study to examine variants of a fashion e-commerce site. They discussed various aspects of the recommended products’ relation to user attention.
Since it is out of the scope of this study, all RS studies in the literature were not included. However, detailed literature studies were conducted before, and comprehensive analyses were presented in these studies [2,3,4,17,71,72]. Systematic literature studies can be examined if it is desired to obtain more comprehensive information on the subject.
In addition to these studies, a review article includes only RS studies on the fashion industry [11]. In this study, the authors who focused specifically on fashion RSs emphasized that despite the recent increasing interest in the subject, academic publications are limited, and these publications do not provide a comprehensive review. Within the scope of the study, articles published between 2010–2022 were examined. Then, the metrics and methods used in the studies between the years mentioned were discussed after giving general information about the subject. Finally, recommendations for future work are presented. Here, the importance of demographic data and cultural information about products and users is emphasized for RSs, and researchers can develop more specific methods based on these data.
As a result of the literature research, customer segmentation has been used with increasing intensity since the beginning of the 2000s in the studies examined. The recent trend in the literature is the widespread use of collaborative approaches. It can be said that using these approaches produces efficient results and is relatively easy to implement.
Additionally, the scarcity of studies on fashion retail is one of the important sources of motivation for this study. Another critical problem in the literature is that real applications are also limited. Only experimental applications are made in a significant number of selected studies.
In the literature, the location dimension is not considered at the point of customer segmentation. The fact that this dimension is not used is a significant shortcoming in the literature, as it may affect cultural characteristics and, thus, customer preference. The lack of using demographic data was also emphasized in the study by Chakraborty et al. [11] and suggested future studies. As defined within the scope of Chakraborty et al.’s [11] study, our study can also be defined as hyper-personalized RS.

3. Proposed Recommendation System

In this study, the developed system is a product RS focusing on customer segmentation. Although there are many RS studies where customer segmentation is performed in the literature, none use customer/user location as an input. The proposed system aims to provide product recommendations to users with maximum success by obtaining as few inputs as possible from key users. For this reason, the models in the literature were evaluated, various opinions were taken from the experts in the industry, and a model was developed to be completed with an actual industry application.
The proposed system uses similar patterns of behavior based on their overlapping interactions on items to make recommendations between users, as in traditional CF. However, it determines user clusters with location data and RFM segmentation to eliminate the disadvantages of basic CF. In addition, it uses one of the techniques accepted in the literature to determine the number of clusters. It also uses the ARM technique to expand the customers’ profiles and remove the rules on the users’ shopping behaviors. The conceptual design of the proposed system is shown schematically in Figure 4.
The proposed system consists of four phases. In Phase-1, customer data are analyzed, and RFM segmentation is applied. The customers’ shopping data from that period are used as the input in this phase. In Phase-2, the k-means algorithm is applied by adding location information to the customers’ RFM values and customers clusters. In Phase-3, customers’ shopping data are prepared using customer cluster information as the input. Accordingly, the ARM approach is implemented using the apriori algorithm. In Phase-4, product recommendation lists are prepared and presented to the user by using rule-based heuristic algorithms. The phases of the proposed system are explained in detail in the next section.

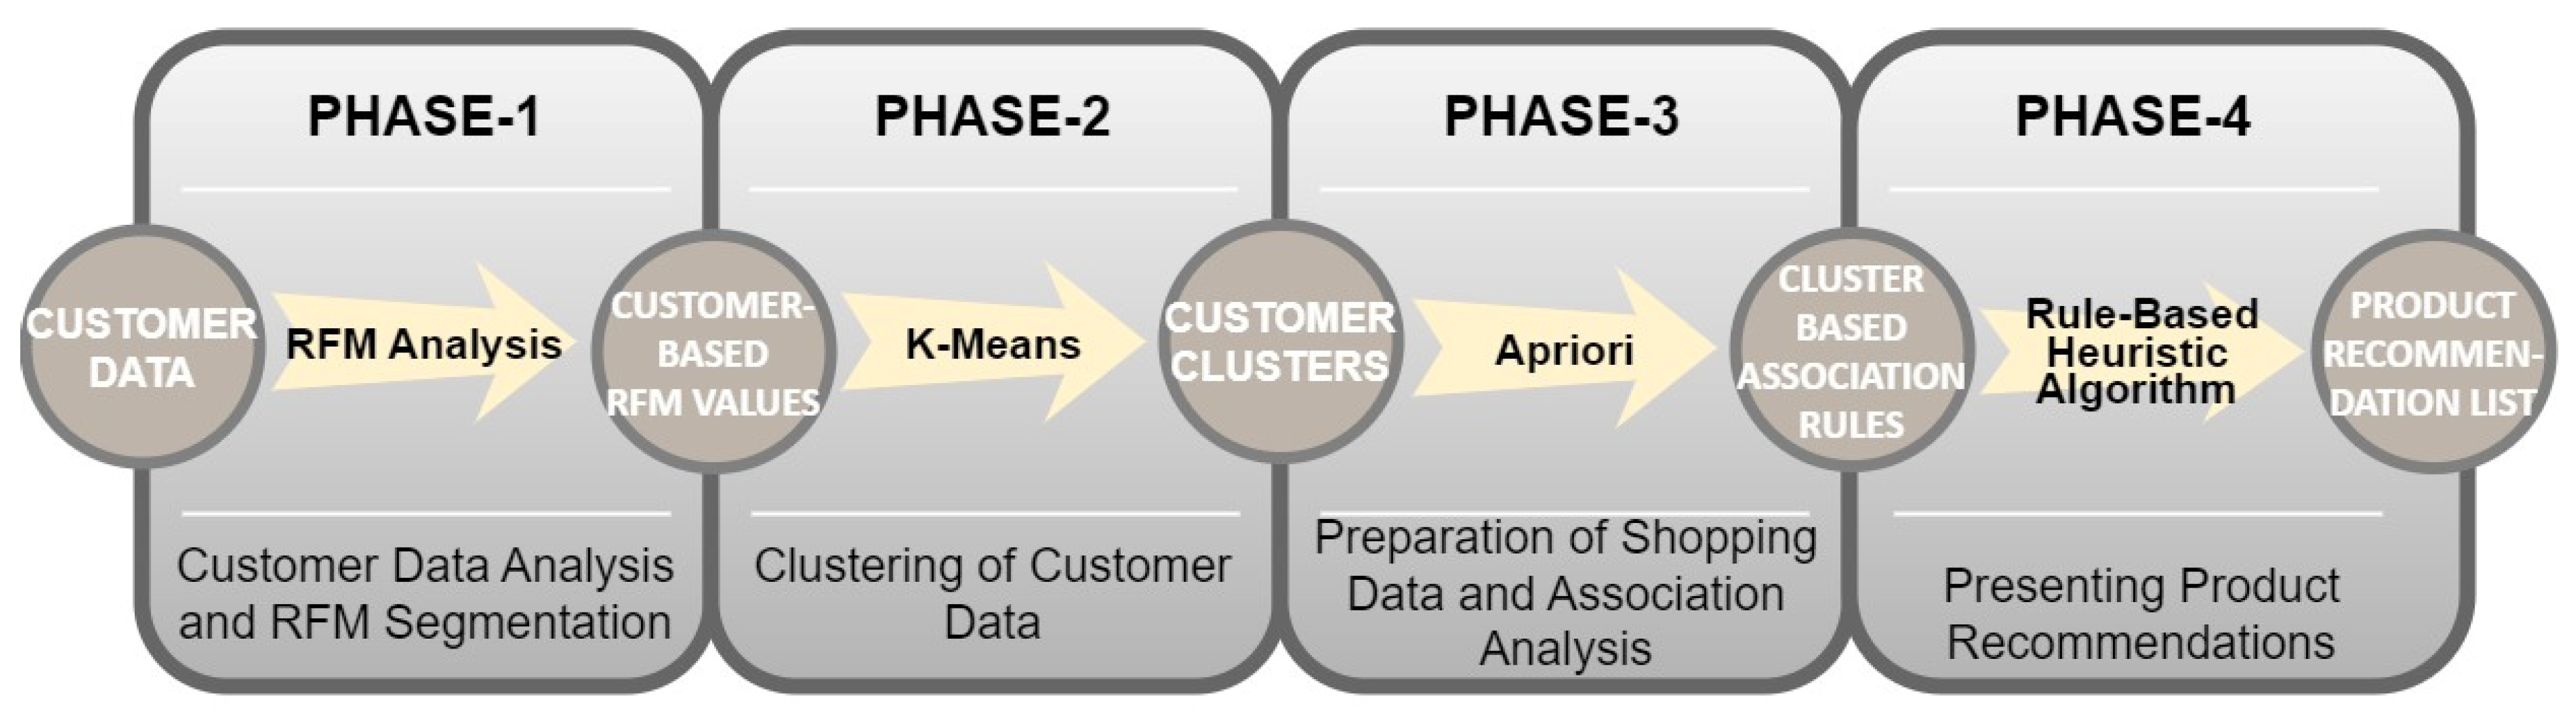
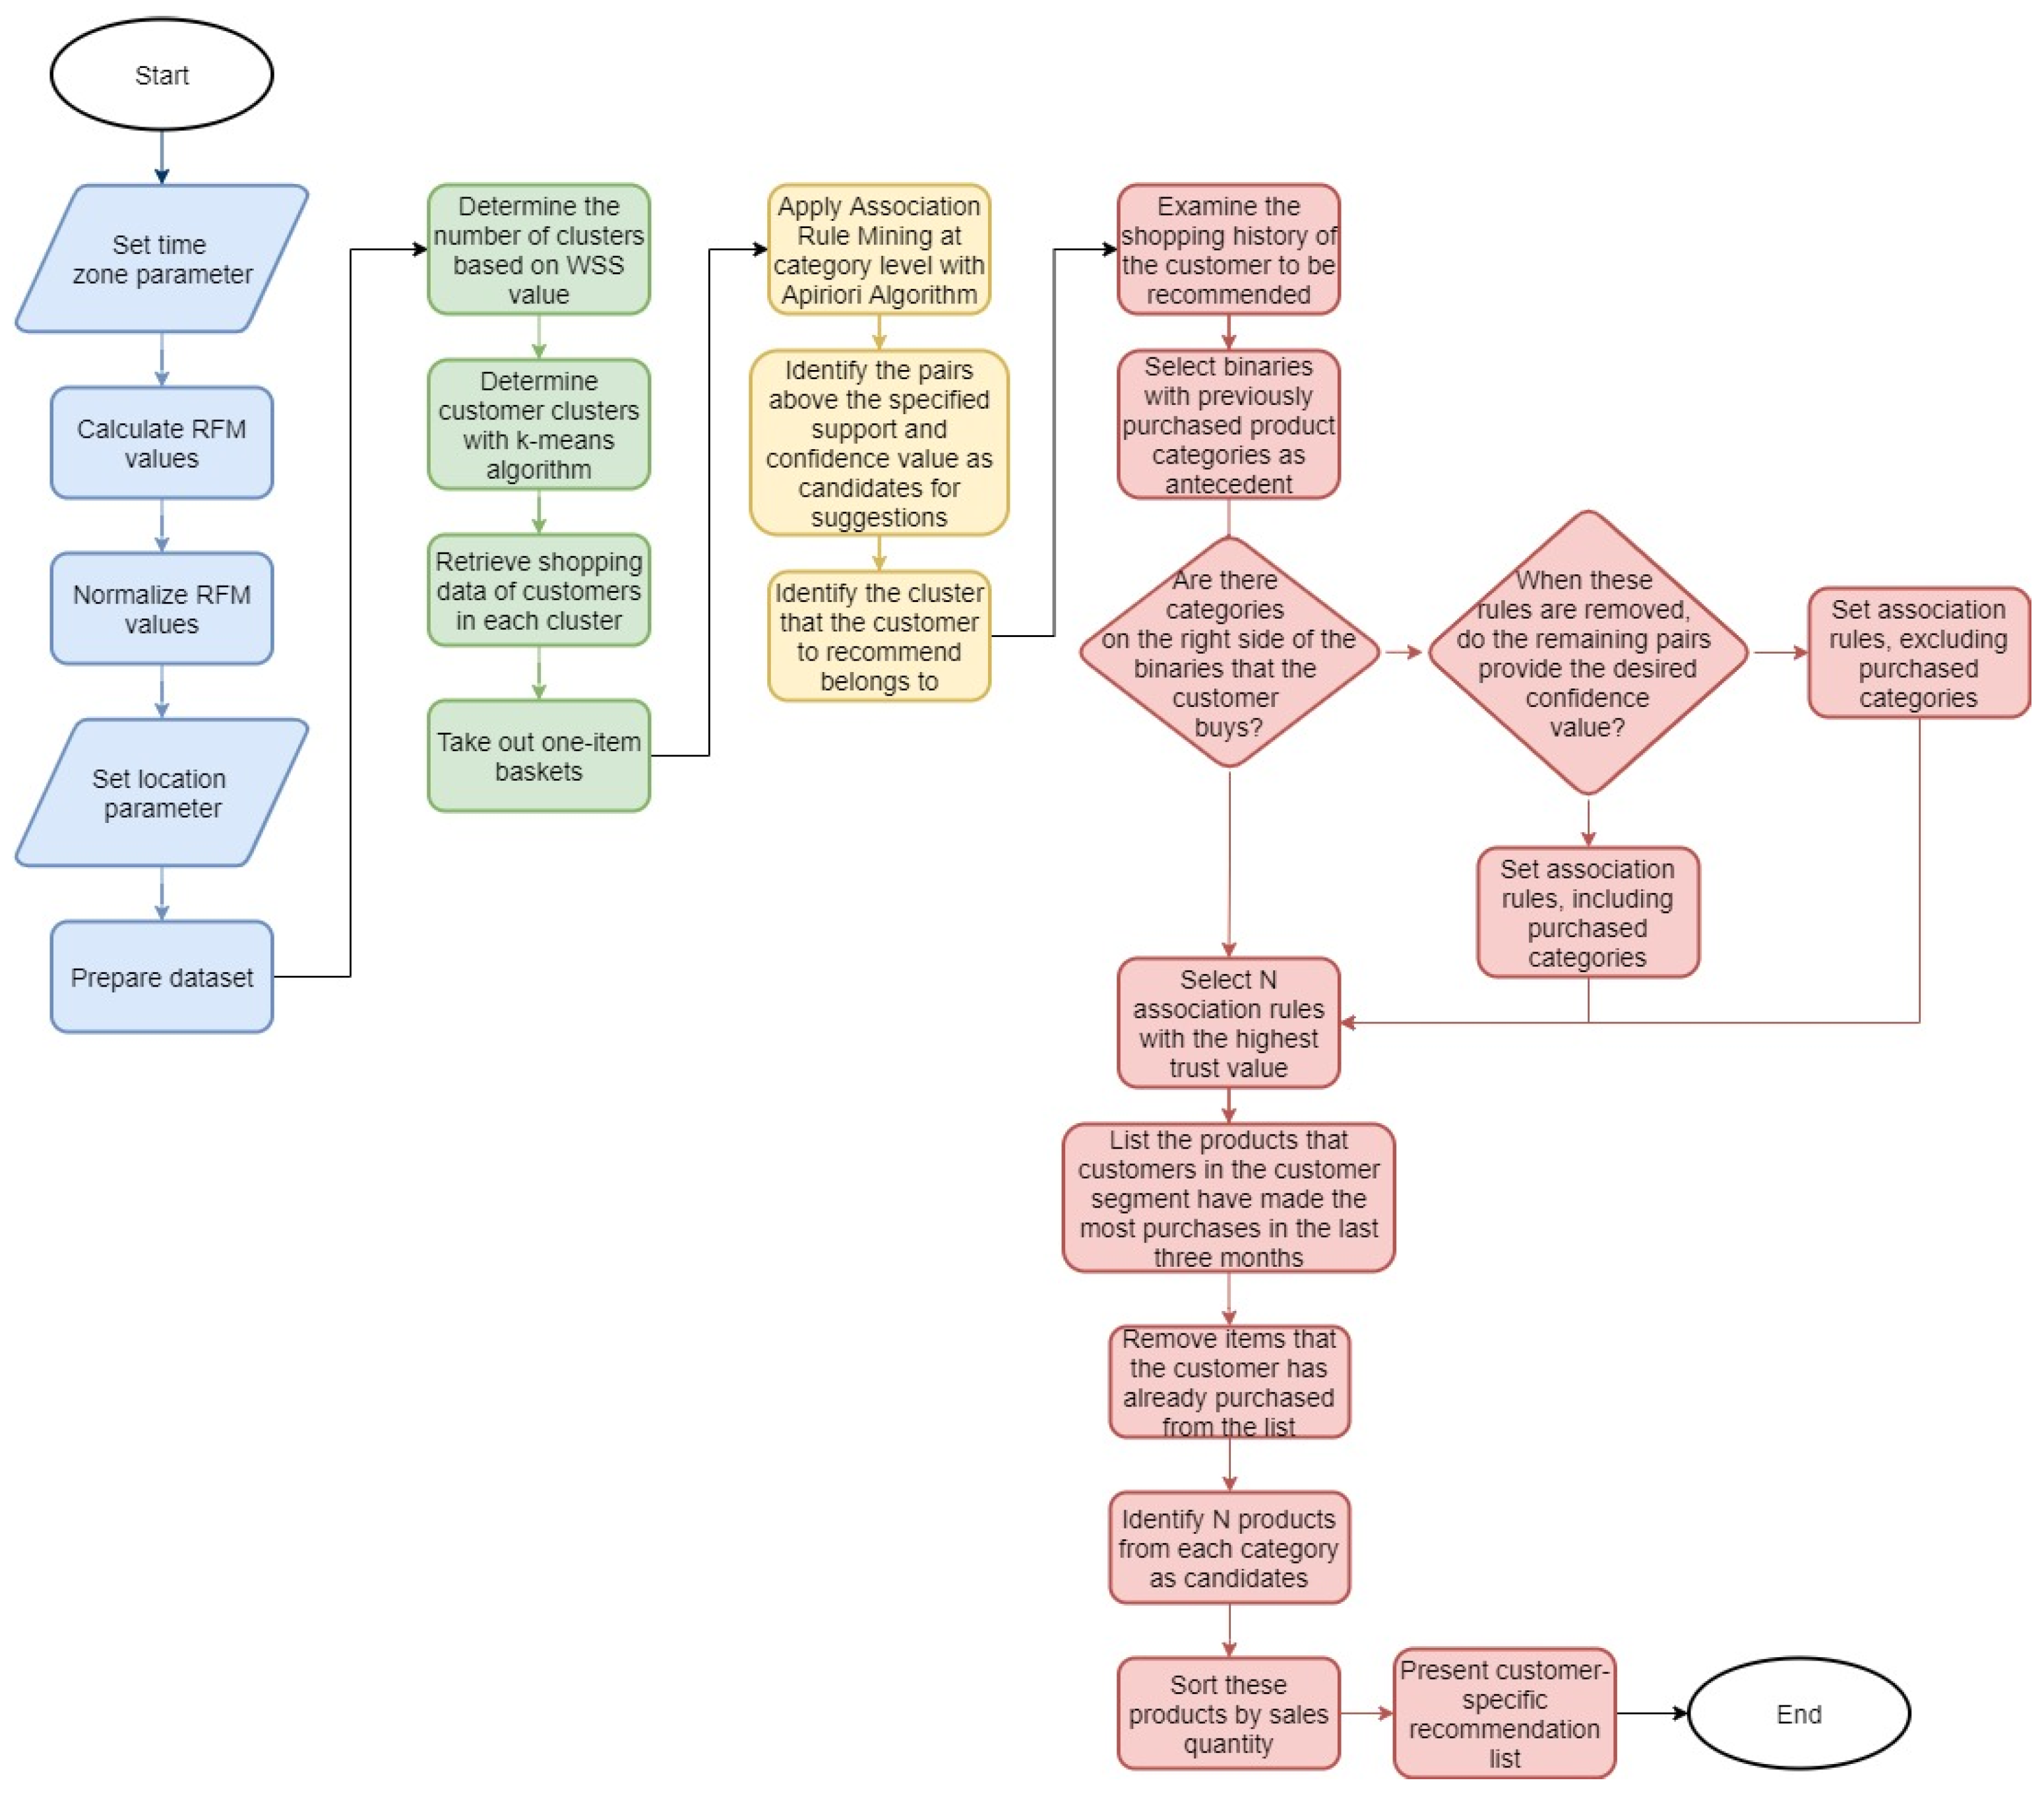
Phases of the Proposed Recommendation System

Phase-1: Analysis of customer data and RFM segmentation:
The basis of the proposed system design is customer segmentation. There are two values based on customer segmentation in the system. The first is the customer’s RFM values, and the second is the customer’s location information.
RFM technique is one of the most known and applied segmentation methods in marketing, especially in direct marketing [73,74]. RFM consists of the initials Recency, Frequency, and Monetary. Recency refers to the currentness of the customer’s last transaction, frequency refers to the frequency of commerce, and monetary refers to the total money the customer spends [75]. RFM is the answer to the questions of when, how often, and how much money the customer spends for the company, and its components are behavioral.
In this study, RFM values are used to determine customer clusters. First, the number of days since the each customer last shopped is calculated. This value corresponds to the customer’s recency value.
The expectation of shopping frequency should be determined for the firm where the implementation will be made to calculate the frequency value. For a food retailer, it is a meaningful frequency for the customer to make several purchases in the same month. In contrast, this value may decrease to several times a year for a fashion retailer. For this reason, it is crucial to determine the expected frequency for the relevant company by taking expert opinions. The frequency value is calculated as seen in Equation (1).
F r e q u e n c y = N u m b e r   o f   P u r c h a s e s N u m b e r   o f   P e r i o d s
In this equation, “Number of Purchases” represents the total number of purchases made by the customer during the period included in the analysis, and “Number of Periods” represents the number of periods during which the customer is expected to purchase at least once between the start date and the end date of the dataset.
Monetary represents the average expenditure size of the customer in the analyzed period. Accordingly, the Monetary value is calculated by dividing the total amount of expenditure of the customer in the relevant period by the total number of purchases.
M o n e t a r y = T o t a l   A m o u n t   o f   E x p e n d i t u r e N u m b e r   o f   P u r c h a s e s
After calculating the RFM values, whether these values fit a distribution is examined. If values contain numerous outliers, they must be normalized. Sigmoid functions are used for the normalization process. Sigmoid functions distribute data between zero and one or minus one and one. Although there are several different sigmoid functions, the tangent sigmoid function is used here, which is stated to provide better outputs in the literature [76]:
x = e x i e x i e x i + e x i
In this equation, x’ represents the normalized data, and xi represents the input value. After the normalization process, the final RFM values of the customers are obtained.
Phase-2: Clustering customer data:
The proposed system’s second step is to identify potentially similar customers by dividing customers into clusters. At this point, in addition to the RFM values of the customers, location information is also taken into account. The extent to which location information should be considered should be decided by examining the data and expert opinions. The k-means algorithm is used in the clustering of customer data. K-means is a basic clustering algorithm that starts with k cluster centers and is chosen arbitrarily [77]. The situation at the beginning of the cluster analysis is expressed in Equation (4).
W i = i l , j { 1 , , k } ,   l { 1 , , n }
The inputs of the algorithm are the given number of clusters (k) and the data used (C), and the outputs are k clusters [78]. The application steps of the algorithm are as follows:
Determination of arbitrarily taken k elements as cluster center ( m 1 , m 2 ,…, m k ),
Assigning each element to the set of m i to which it is closest,
Recalculating the values m 1 , m 2 ,…, m k of the clusters,
Continue from the first step until there is no change in the cluster. If there is no change, stop.
One of the k-means algorithm’s biggest problems is the k value’s determination. The WSS method can be used to determine the k value. The WSS value is the sum of the squares of the distance of each point from the cluster center. If this value is small, the clustering work is good.
At this point, the graphical interpretation of the WSS value for each k value is significant in determining the ideal cluster number. The WSS value decreases rapidly with the increase in clusters from the beginning; however, this decline takes a more horizontal course after a while. The number of clusters at the point of this break is used to determine the ideal number of clusters [79].
Phase-3: Preparation of shopping data and association analysis:
While preparing the data, the customers’ shopping data previously included in the RFM study are used. Since no association analysis can be made from this data, baskets consisting of a single product should be excluded. After this process, the resulting dataset is decomposed according to the clusters created in the previous step, and association analysis is performed for each customer cluster. In this way, the shopping tendency of each customer cluster is determined, and it is possible to make recommendations by referring to the cluster they belong to when recommending products to customers. As a result of shopping data subjected to association analysis for each cluster, category pairs with a confidence value determined by taking expert opinions are determined.
The association analysis aims to reveal the customers’ purchasing habits by obtaining data from the records in the database of the products purchased by the customers at the time of shopping by finding the association between the products they bought, or in other words, the relationships between the products. While finding association rules in large databases, the following steps are followed:
(1) First, frequently repeated sets of items are found. Each of these elements repeats at least as many as the predetermined minimum number of supports.
(2) The elements of frequently repeated clusters form stricter association rules; these rules can meet minimum support and minimum confidence values [20].
In market basket analysis, items refer to the items purchased by customers, and the transaction relates to the set of all items bought together.
The proposed system uses the Apriori algorithm while performing the association analysis. This is the basic algorithm used in the first stage of association rules and is frequently used in the literature [78]. The Apriori algorithm is a classical method used to learn relational rules in computer science and data mining [80]. The algorithm has a repetitive working style. It is used to discover the most common item sets in databases. Based on the Apriori algorithm, if an item set with z elements satisfies the minimum support, then the subsets of that item set will also meet the minimum support.
This algorithm involves a series of passes over the database; during k passes, the algorithm finds the set of Lk frequent itemset of length k that satisfies the minimum support requirement. When Lk is empty, the algorithm is terminated. A pruning step eliminates any candidate with a smaller subset [81].
The Apriori algorithm combines standard object sets formed in the previous pass and creates candidate object sets without dealing with movements in the database. It also deletes smaller subsets of the last pass. Considering the common object sets formed in the previous pass, the number of candidate object sets that pass the most frequently will make our work easier, and there will be a significant decrease [78].
In the first step of the algorithm, threshold values are determined to compare support and confidence values. The results obtained from the analysis are expected to be greater than or equal to the threshold values. In the second step, the support values for the products included in the analysis are calculated and compared with the threshold support value. If the obtained support value of the product is less than the threshold support value, the relevant rows are excluded from the analysis.
In the third step, the support values are obtained by grouping the products selected in the second step in pairs. These values are compared with the support values. Lines smaller than the threshold value are excluded from the analysis. In the fourth step, the grouping numbers are increased by one, and the threshold values are compared. The process continues as long as the repetitions exceed or are equal to the threshold value. In the last step, after the product group is determined, association rules are produced by looking at the rule support criterion. Confidence measures are calculated for each of the rules [78].
Phase-4: Representing product recommendations:
The proposed model’s final phase is presenting product recommendations to customers. This phase determines which products can be recommended to customers according to their shopping history. Suppose a recommendation will be given to a customer who has never been segmented before. In that case, these recommendations will not be customer specific, but products determined as a result of general rules determined by expert opinion.
The implementation steps of this phase are summarized in Figure 5, where the flowchart of the proposed RS is given. As a result of following these steps, a customer-specific product recommendation list is prepared and presented.

4. Experimental Design

The proposed RS is applied to the data obtained from the e-commerce operation of the Turkish fashion retail company. The fashion retail industry is an essential retail branch that has developed rapidly in recent years and has increased competition. However, the products are unique in the fashion retail industry and are produced and seasonally offered for sale.
The company offers its customers many different clothing and accessories products, especially products in the Jean category. In the company, sales can be made from stores and through e-commerce sites. The company has a product variety in over 50 categories under the main product groups for men and women. In this context, the right product must be presented to the customer with the right stocks. Therefore, this situation requires the need to guide the customers about the products. Especially in electronic commerce (e-commerce) channels, no assistants offer this type of service to the customer. Therefore, RSs are critical at this point.
As in all branches of the retail industry, one of the most fundamental problems in the fashion retail industry is presenting the right product to the right customer at the right time. Recommending products that may interest the customer in each shopping channel significantly contributes to the product mentioned above in the offering cycle.
Additionally, raising the conversion rate variable is one of the most basic needs in the fashion retail industry. The contribution of RSs to the conversion rate is indisputable. The company uses RSs to increase conversion rates and offer the right product to customers, especially in e-commerce operations. However, the RS used in the company belongs to a third-party software vendor, and the company managers do not know the system’s algorithm. This “black box” system uses a data integration tool to transfer the company’s customer data from the company’s systems and to send the product recommendation list from this system. Moreover, company managers have some concerns about the performance of the current product RS.
Furthermore, the lack of application in the literature in which the demographic data of customers is considered in the fashion retail industry has increased the motivation to present an application within the scope of the study. Turkey is a large country where different cultures live together in different regions. Cultures in various areas also affect the understanding of shopping. This can be observed particularly in the fashion sense. For this reason, it is essential to use demographic information in RS and to include location information in the proposed system. The design of the experiment is schematized in Figure 6.

Implementation of the Proposed Recommendation System

The data of the company’s e-commerce operation in Turkey between 2015-2017 are used for implementation. The main motivation for using data from these years is to normalize the first relative stagnation and then the wave of growth that the pandemic we have been facing since 2020 has brought to e-commerce operations. Another reason for using the data set from this timeframe is that the company’s marketplace operations were still limited. The company’s marketplace operations increased after 2018. Since marketplace channels do not share customer data details with the product owner company, the company’s customer data analysis becomes more complex and less valid. This dataset contains data from 43,127 transactions. This shopping data are subjected to RFM analysis; the number of customers included in this analysis is 33,176. The first day of the year is accepted as a milestone to calculate the Recency value of these customers. The time elapsed between the last shopping made by the customers back from this date and the first day of the year is considered recency. The frequency value of customers expresses the number of purchases made in the same period. On the other hand, the monetary value shows the average expenditure values made during this period.
RFM scores form the first basic input for customer clustering. The location information of the customers, which is the second basic input, is added to the dataset for each customer as a geographical region. The shipping address was used as customer location information.
There are two main reasons for including customer location information in the customer segmentation process. These are due to the nature of e-commerce data, especially in some geographical regions. Such sales are intense, and socio-culturally meaningful distinctions can be reached here. Additionally, the expert opinion received from company managers supports this regional distinction.
If a customer purchases from more than one region, the region where the customer makes the most purchases is the customer’s region. If the same shopping is carried out from the two regions, the region where the greater amount of shopping is made is considered the customer’s region. Turkey is geographically divided into seven regions. The names of these regions and the numerical codes used in the study are presented in Table 1.
After the region information and RFM scores come together, the process of clustering customer data begins. The k-means algorithm is used for this process. The algorithm was coded in the Microsoft Visual Studio environment with the R programming language and ran on a PC with an Intel Core i5-7200U 2.50 GHz processor and 8.00 GB RAM.
In the k-means algorithm, the number of clusters must be entered as a parameter by the user. Here, the variation of the WSS value is considered, as discussed in Section 4, to determine the ideal number of clusters. The graph showing the change in WSS value is given in Figure 7. The chart shows that after the number of clusters is three, the WSS value follows a more horizontal course and decreases. It is deduced from here that it is appropriate to determine the number of clusters as three. The customer profile resulting from this clustering process is presented in Table 2.
As shown in Table 2, the customer clusters created have specific characteristics. Accordingly, the customers in the first cluster represent customers with a basket size close to the average for the company, who shop little more than once a year on average, and who have six months since their last purchase. This cluster can be considered as the average customer base expected to shop. The customers in this cluster are mainly located in the Marmara and Aegean regions. The highest number of customers is in this cluster.
The customers in the second cluster represent the company’s most valuable customers. The basket averages and frequency values of the customers in this cluster are pretty high. Therefore, the customers should not be lost for the company. The number of customers in this cluster is relatively small, as might be expected. The customers in this cluster are primarily located in the Marmara and Central Anatolia regions.
The third cluster is customers who are not loyal to the firm and can be considered lost. Although the basket size of the customers in this cluster is at average levels, their frequencies are relatively low. Simultaneously, their Recency values are pretty high, which shows that these customers have not shopped from the company for a long time. There is a relatively high number of customers in this cluster. From this, it can be deduced that the company should take action to regain these lost customers and enable them to visit the site. The customers in this cluster are mostly located in the Marmara and Mediterranean regions. It is noteworthy that the Marmara region is densely seen in all clusters. This situation arises from a natural extension of Turkey’s socio-economic status and Turkey’s e-commerce sector.
In the shopping data phase preparation, the shopping information of previously clustered customers is first brought. Since this shopping data cannot be used in basket analysis, baskets containing a single item are removed from the dataset. The cleaned dataset is grouped in a different format to be an input to the category-based association analysis study. In this context, it is determined that 76 different categories of products are sold in all clusters in the available dataset. The abbreviations of these categories used in the system and their explanations are presented in Appendix B.
The sales data of each category within each order in the data is analyzed. Categories with sales transactions are marked in these orders, so a dataset consisting of order, cluster, and category information is obtained. If sales belong to a category in order, this category is marked as 1; otherwise, the categories are marked as 0. This dataset is extracted for each customer cluster and made ready to generate input for association analysis.
Prepared files are given as input to the SPSS Modeler, and the types of information are marked. Then, the Apriori algorithm is applied. The desired parameters are entered at this stage for the algorithm to work. These steps are done for orders belonging to all three customer clusters, and association rules for these clusters are determined. During the study, the experts’ opinions of the company are evaluated. The minimum support value is determined as 1%, and the minimum confidence value is specified as 15% to achieve a sufficient association. The ten association rules with the highest confidence values detected for each cluster are shared in Table 3.
Table 3 shows that in the association rules in all three clusters, the rule that customers who buy men’s belt products buy from men’s trousers takes the first place. This is because the company’s product and sales focus are concentrated on the Jean groups.
Another striking point in Table 3 is that the association rules of the customers in the first and third clusters are pretty similar. Six of the first ten association rules are common to both clusters. From this, it can be deduced that the customers in these two clusters have similar shopping behaviors. Additionally, while products belong to more than two categories in the baskets of the customers in the second cluster, it is seen that the purchase of products belonging to a third category is quite intense. This can be explained by the fact that the basket averages of the customers in this cluster are pretty high. Another unique situation in the association rules in this cluster is that the confidence values are higher than in the other two clusters. It can be deduced that this situation is since the number of customers in this cluster and, accordingly, the number of baskets is less.
A sample from the previous year’s shopping data is used for testing during the implementation phase. The RS is explained at this phase through a randomly selected customer. After a random customer is determined, the cluster information that the customer is included in is retrieved from the customer–cluster relations table. The cluster of the selected customer is set to “2”. For this reason, the category pairs recommended to the customer should belong to the second set. In this way, it is determined from which categories the customer has made purchases in his previous purchases. Table 4 shows the distribution of categories purchased by the selected customer.
According to Table 4, the customer mostly shops in the “W_PNT” (Women Pants), “W_CRD” (Women Cardigan), and “W_TSS” (Women T-shirt Short Sleeve) categories. Here, association rules with these categories should be determined in the recommendations to be presented to the customer. Table 5 shows the association rules for these categories.
The categories recommended with high confidence are determined by considering the categories for which the customer does not shop to avoid repetition. In this context, when the five potential rules with the highest confidence value are examined, it is seen that four different categories can be recommended. These are categories with codes “W_PNT”, “W_PLV”, “W_TSS”, and “W_SWS”.
After these steps are completed, the action to be taken is to identify the products to be recommended. At this point, the most purchased products by the customer’s cluster in the last three months are determined. The critical point is the date on which the recommendation will be made to the customer. With the three-month criterion, it is desired to catch the seasonality, especially in the fast fashion sector.
The five best-selling products in each category that the customer has not purchased before are listed in Table 6. According to the proposed RS, the customer-specific product recommendation list is prepared this way.

5. Discussion

Three metrics found in the RSs literature are used to measure the validity of the recommendation list created with the developed RS [56]. These metrics and their intended use are given below.
R e c a l l = n ( B I R I ) n ( B I )
P r e c i s i o n = n ( B I R I ) n ( R I )
F 1 = 2 R e c a l l P r e c i s i o n R e c a l l + P r e c i s i o n
The BI value used in the equations represents all the purchases made by the customer during the evaluation period, and the RI value represents the products offered to the customer in the same period. The Recall metric can evaluate the products that are correctly recommended to the customer. This metric is the ratio of the products purchased by the customer to all the customer’s purchases during the evaluation period. The Precision metric is the ratio of what the customer purchases among the products recommended to the customer to all the products recommended in the relevant period. These metric measures how high the prediction sensitivity of the RS is. The recall value can be increased by recommending too many products, but in this case, too many products are recommended to the customer, reducing the precision value. The F1 metric is used to eliminate this dilemma and provide balance. The F1 metric assigns equal weights to the recall and precision metrics.
These metrics are calculated for the customer given as an application example from the previous section to analyze the validity of the proposed RS. The purchase made by the customer during the comparison period is presented in Table 7. As shown in Table 7, the product with the code CL1017746, which is in second place in the shopping list made by the customer, is among the products recommended to the customer in the trousers category. The recall, precision, and F1 values are calculated as 0.250, 0.050, and 0.083, respectively.
According to Table 7, one of the 20 products recommended to the customer has turned into a sale, which corresponds to a precision of 5%. One of the four products purchased by the customer is recommended to the customer in the recommendation list; in this case, the recall value is 25%. The F1 value is calculated as approximately 8.3%. In addition to these metrics, another metric is calculated as 64.95, showing the average sales amount of the recommended product purchased by the customer. The aim is to show the average number of sales made through the RS and measure its contribution.
The analyses for the selected customer are repeated on 1478 randomly selected customers who purchased the product in 2017. The year is divided into four quarterly segments to catch seasonality, and recommendations are produced for these periods. The cluster information of customers included is retrieved from the customer–cluster relations table, and the clusters of customers are set. This provides information on which categories the customers have made purchases in their previous purchases. Afterward, association rules and the most purchased products by the customers’ cluster in the last three months are determined—the products the customer has purchased before being removed from the determined products. Candidate products from each category are determined, and a customer-specific recommendation list is created by ordering them according to their sales volumes. At the same time, the study’s results are compared with the data from the current RS. 1478 customers are selected for the sample, and there are 1147 customers in Cluster 1 and 331 in Cluster 2. Table 8 and Table 9 show the summary of the results produced by the current RS and the proposed RS, respectively. Table 10 shows the percentage difference between the proposed and current RS.
When the results are evaluated, it is seen that the proposed system has higher F1 and average sales values than the current system. In only one period (October–December of Cluster 1), the current system appears to have a higher F1 value than the proposed system. Similarly, the sales value of the current RS seems higher in some periods, but the proposed system is more successful in terms of the total sales average. In the April–June period of customers belonging to the first cluster, where the current system has the most successful F1 value, the proposed system achieved a more successful F1 score. In the same period, the sales average seems slightly lower than the current system, which can be explained by the recall value being slightly lower in the same period and the lower-priced product recommendations being successful.
The current RS’s data from the previous year is needed to compare the customers in the third cluster. However, since these data cannot be obtained from the company, the RS is run separately for the customers in the relevant cluster, and the previous year’s sales are taken as a reference. For this study, 864 customers in the third cluster who shopped in the previous year were randomly selected; the results are given in Table 11.
When the results in Table 11 are examined, it is noteworthy that the average sales amounts are somewhat low. However, it should not be overlooked that the change in product prices yearly may be effective in the background of this change. Here, the F1 value again appears to be at a satisfactory level. In this context, approximately 17% of the products purchased by the customer in Table 11 consist of the products recommended by the RS. Similarly, about 13% of the products targeted to be offered to customers are purchased by customers.
In general, the proposed system is tested on the shopping data of 2342 customers, and the outputs obtained are compared with the outcomes of the current RS in the company. As a result of this comparison, it is seen that the proposed product RS achieves more successful average sales and higher recommendation success than the current RS. In addition to providing better results than the current system, it is also crucial that the proposed RS is open for internal use and can be maintained by the company according to recent developments. The proposed system, which will replace the system outsourcing from a third-party provider, provides better results than the current system, allowing the study to go beyond its goals. An RS that will be operated openly for internal use allows the transfer of demographic information, such as location, which cannot be shared with third parties due to the protection of personal data, into the system. In this way, customers are offered hyper-personalized products. The importance of personalized recommendations can also explain the superiority of the proposed system over the existing system.

6. Conclusions and Future Studies

Presenting the right product at the right time is one of the problems that must be solved for all sectors, especially the retail sector. Giving recommendations that suit customers’ preferences and enjoyment is essential in overcoming this problem. RSs enable all kinds of objects to be presented to users/customers.
This study focuses on the fashion retail industry, an essential retail branch that has developed rapidly in recent years and has increased competition. The literature review has shown that no RS in the fashion retail industry considers customers’ demographic data. At the same time, it is observed that customer location information is not used as a parameter in clustering or recommendation preparation models in any of the studies examined. The proposed system to fill this gap in the literature was applied to the real customer data obtained from the e-commerce operation of the Turkish fashion retail company, and the application results were evaluated.
RFM segmentation was first applied to the customer data obtained during the proposed system’s implementation. In the following phase, the geographical regions of the places where the customers make purchases and the regions where the customers were located were determined. Customers were divided into clusters using the k-means algorithm by combining the region information of each customer with their RFM scores. In the next phase, the ARM technique was applied at the category level for each cluster obtained to determine which categories the customers in each cluster purchased together. Then, a product recommendation was prepared for a sample customer. Afterward, the proposed system was implemented on a total of 2342 customers, and the results of the implementation were compared with the current RSs used in the company. To measure the performance of the RS, “recall”, “precision”, and F1 metrics were used. As a fourth metric, the average prices of products recommended to customers and purchased by customers were added to these evaluation criteria. The proposed system achieved better values than the RS available in the company in both F1 and average sales values. At this point, the validity and applicability of the proposed system were verified on real sector data. By applying our proposed system, the managers found the opportunity to compare the performances of the current product RS and our proposed product RS. All the managers of the related departments appeared to be satisfied with the results and flexibility of our proposed system. Company executives welcomed having a non-black-box system and improving it in line with the company’s changing business requirements. These managers’ feedback has encouraged the company to replace their current RS system with our proposed system.
Although the system’s primary goals are achieved by applying it to a Turkish fashion retail company, we are aware of this study’s limitations, especially its relatively small sample size. In future studies, the proposed system can be applied to larger datasets and combined with data from different sales channels; it can be tested and used more reliably. In addition, the suitability of the proposed recommendation system may be evaluated by applying it to e-commerce operations of different retail sectors such as footwear, consumer durables, jewelry, books-music-gift articles, etc.
Additionally, in this study, we used the performance indicators found in the literature to validate the proposed system. It would be worth differentiating the key performance indicators in the future, especially by taking expert opinions. Furthermore, we plan to extend the clustering phase of the proposed study by using different customer parameters such as the customer’s socio-economic status, marital status, navigation data on the e-commerce site, etc. At this point, it should be noted that the number of customer clusters created should be manageable and meaningful.

Author Contributions

Conceptualization, E.Y.; Methodology, E.Y. and C.G.Ş.; Software, E.Y.; Validation, E.Y., C.G.Ş. and E.E.I.; Data curation, E.Y. and E.E.I.; Writing—original draft, E.Y. and E.E.I.; Writing—review and editing, C.G.Ş.; Supervision, C.G.Ş. All authors have read and agreed to the published version of the manuscript.

Funding

This research received no external funding.

Data Availability Statement

Data is unavailable due to the company’s privacy policy restrictions.

Conflicts of Interest

The authors declare no conflict of interest.

Appendix A. Literature Review Table

Authors (Year)Sector/ObjectReal ApplicationApproachCustomer SegmentationCustomer LocationTechniques
Pazzani & Billsus (1997)Web ContentNoCBANoNoNBC, k-NN, PEBLS, DT, Rocchio, ANN
Ha, (2002) RetailYesUBCFYesNoRFM, SOM, ARM
Liu & Shih, (2005)Medical stuffNoUBCFYesNoRFM, AHP, k-means, ARM
Kim et al. (2010)Web ContentYesUBCFNoNoNBC, k-NN
Lee, (2010)RetailYesUBCFYesNoRFM, C4.5
Choi et al. (2012)RetailYesUBCFNoNoSPA, CBS, ED
Jomaa et al. (2012)BookNoUBCFYesNoCBS, ED
Sun et al. (2014)Tobacco ProductsYesOBCFNoNoCBS, k-NN
Rezaeinia & Rahmani (2016)WholesaleYesUBCFYesNoRFM, AHP, k-NN
Rodrigues & Ferreira (2016)RetailYesUBCFYesNoRFM, k-means, ARM
Li et al. (2017)RetailYesHybridNoNoCBR, CBS
Najafabadi et al. (2017)MusicNoUBCFYesNoClustering, ARM
Zhao et al. (2017)MovieNoCBANoNoURBD
Son & Kim (2017)MovieNoCBANoNoDS, MC, MN
Hwangbo et al. (2018)FashionYesOBCFNoNoCBS, k-means
Liji et al. (2018)MovieNoUBCFNoNoEC, Improved CBS, SCM, k-NN
Jing et al. (2018)RetailYesUBCFNoNoPF, SA
Cao et al. (2019)Web ContentNoHCFNoNoCBS
Iwanaga et al. (2019)RetailYesUBCFNoNoNMF
Cai et al. (2020)MovieNoHybridNoNok-means, MaOEA
M. Li et al. (2020) Q&ANoCF+CBANoNoSC
Walek & Fojtik (2020)MovieNoCF+CBANoNoSVD, CBS, FES
Noulapeu Ngaffo et al. (2021)Web ContentNoUBCFNoNo-
Z. Chen et al. (2021)MovieNoUBCFNoNoTCA, RNS, k-means
Bellini et al. (2022)FashionYesMLCNoNoK-medoids, k-means, ARM
Vahidy Rodpysh et al. (2022)MovieYesMDANoYesSVD
Zhou et al. (2022)Web ContentNoUBCFNoNoPC, top-k
CBA: Content-Based Approach, OBCF: Object-Based CF, UBCF: User-Based CF, HCF: Hybrid CF, MLC: Multi-Level Clustering, LSIER: Latent Semantic Integrated Explicit Rating, SPA: Sequential Pattern Analysis, SVD: Singular Value Decomposition, ARM: Association Rule Mining, CBS: Cosine-Based Similarity, ED: Euclidean Distance, AHP: Analytic Hierarchy Process, k-NN: k-Nearest Neighbor, ANN: Artificial Neural Networks, DT: Decision Trees, SOM: Self-Organizing Maps, NBC: Naive Bayes Classifier, CBR: Case-Based Reasoning, URBD: User Rating Based Distance, DS: Dice Similarity, MC: Modularity Clustering, MN: Multiattribute network, PM: Preference Mining, SA: Sentiment Assessment EC: Evolutionary Clustering, SCM: Score Matrix Filling, SC: Sequential Clustering, FES: Fuzzy Expert System, NMF: Non-Negative Matrix Factorization, MaOEA: Many-Objective Evolutionary Algorithm, PC: Pearson’s correlation, HSM: Hybrid Similarity Measure, PMF: Probabilistic Matrix Factorization, TCA: Target Category Adjustment, RNS: Random Neighbor Selection, MDA: Model-Driven Approach, UCSM: User Context Similarity Measure, ICSM: Item Context Similarity Measure.

Appendix B. Product Category Descriptions

CodeDescriptionCodeDescriptionCodeDescription
M_ATHMale AthleteW_SCKWomen SocksW_OVRWomen Jumpsuit
W_ATHWomen AthletesM_SCRMen ScarfM_OVSMen Overshirts
M_BAGMen BagW_SCRWomen ScarfW_OVSWomen Overshirt
W_BAGWomen BagM_SETMen Beat-Scarf-GlovesM_PJMMen Pajamas
M_BJTMen JewelryW_SETWomen Beat-Scarf-GlovesW_PJMWomen Pajamas
W_BJTWomen JewelryM_SGLMen GlassesM_PLVMen Sweater
W_BKNWomen Bikini / SwimsuitW_SGLWomen GlassesW_PLVWomen Sweater
W_BLLWomen Blouse Long SleeveM_SHGMen Shirt Long SleeveM_PNTMen Trousers
W_BLRWomen BoleroW_SHGWomen Shirt Long SleeveW_PNTWomen Pants
W_BLSWomen Blouse Short SleeveM_SHLMen ShawlW_PREWomen Pareo
M_BLTMen BeltW_SHLWomen ShawlM_PTKMen Polo Short-Sleeve
W_BLTWomen BeltM_SHSMen Shirt Short SleeveW_PTKWomen Polo Short-Sleeve
M_BOTMen Boots / BootsW_SHSWomen Shirt Short SleeveM_PTLMen Polo Long Sleeve
W_BOTWomen Boots / BootsW_SKRWomen SkirtW_PTLWomen Polo Long Sleeve
M_BRTMen BeanM_SLRMen SlipperM_PUMMen Jacket Pu
W_BRTWomen BeanW_SLRWomen SlipperW_PUMWomen Jacket Pu
M_CAPMen HatM_SNDMen SandalsM_PUWMen Vest Pu
W_CAPWomen HatW_SNDWomen SandalsW_PUWWomen Vest Pu
M_COAMen CoatM_SOEMen ShoesM_RCOMen Raincoat
W_COAWomen CoatW_SOEWomen ShoesW_RCOWomen Raincoat
M_CPRMen CapriM_SRBMen Sea ShortsM_SCKMen Socks
W_CPRWomen CapriW_SRBWomen Sea ShortsM_TSLMen T-Shirt Long Sleeve
M_CRDMen CardiganM_SRTMen ShortsW_TSLWomen T-Shirt Long Sleeve
W_CRDWomen CardiganW_SRTWomen ShortsM_TSSMen T-Shirt Short Sleeve
W_DRSWomen DressM_SWSMen SweatshirtW_TSSWomen T-Shirt Short Sleeve
M_GLVMen GlovesW_SWSWomen SweatshirtM_TSTMen Track Suit
W_GLVWomen GlovesM_TCHMen TrenchcoatW_TSTWomen Track Suit
W_HPNWomen BuckleW_TCHWomen TrenchcoatM_TSUMen Sweatpants
M_JCKMen JacketW_TGTWomen TightsW_TSUWomen Sweatpants
W_JCKWomen JacketM_TIEMen TieM_TWLMen Beach Towel
M_MNTMen JacketsM_TNCMen TunicW_TWLWomen Beach Towel
W_MNTWomen JacketsW_TNCWomen TunicM_UDWMen Underwear
W_WSTWomen VestW_UNBWomen UmbrellaW_UDWWomen Underwear
M_WTCMen WatchM_WLTMen WalletM_UNBMen Umbrella
W_WTCWomen WatchW_WLTWomen WalletM_WSTMen Vest

References

  1. Wu, F.; Lyu, C.; Liu, Y. A personalized recommendation system for multi-modal transportation systems. Multimodal Transp. 2022, 1, 100016. [Google Scholar] [CrossRef]
  2. Alamdari, P.M.; Navimipour, N.J.; Hosseinzadeh, M.; Safaei, A.A.; Darwesh, A. A Systematic Study on the Recommender Systems in the E-Commerce. IEEE Access 2020, 8, 115694–115716. [Google Scholar] [CrossRef]
  3. Fayyaz, Z.; Ebrahimian, M.; Nawara, D.; Ibrahim, A.; Kashef, R. Recommendation Systems: Algorithms, Challenges, Metrics, and Business Opportunities. Appl. Sci. 2020, 10, 7748. [Google Scholar] [CrossRef]
  4. Ko, H.; Lee, S.; Park, Y.; Choi, A. A Survey of Recommendation Systems: Recommendation Models, Techniques, and Application Fields. Electronics 2022, 11, 141. [Google Scholar] [CrossRef]
  5. Acharya, N.; Sassenberg, A.-M.; Soar, J. Consumers’ Behavioural Intentions to Reuse Recommender Systems: Assessing the Effects of Trust Propensity, Trusting Beliefs and Perceived Usefulness. J. Theor. Appl. Electron. Commer. Res. 2022, 18, 4. [Google Scholar] [CrossRef]
  6. Wang, R.; Ma, X.; Jiang, C.; Ye, Y.; Zhang, Y. Heterogeneous information network-based music recommendation system in mobile networks. Comput. Commun. 2019, 150, 429–437. [Google Scholar] [CrossRef]
  7. Khademizadeh, S.; Nematollahi, Z.; Danesh, F. Analysis of book circulation data and a book recommendation system in academic libraries using data mining techniques. Libr. Inf. Sci. Res. 2022, 44, 101191. [Google Scholar] [CrossRef]
  8. Behera, G.; Nain, N. Collaborative Filtering with Temporal Features for Movie Recommendation System. In Procedia Computer Science; Elsevier B.V.: Amsterdam, The Netherlands, 2023; Volume 218, pp. 1366–1373. [Google Scholar] [CrossRef]
  9. Hallikainen, H.; Luongo, M.; Dhir, A.; Laukkanen, T. Consequences of personalized product recommendations and price promotions in online grocery shopping. J. Retail. Consum. Serv. 2022, 69, 103088. [Google Scholar] [CrossRef]
  10. Tyrväinen, O.; Karjaluoto, H.; Saarijärvi, H. Personalization and hedonic motivation in creating customer experiences and loyalty in omnichannel retail. J. Retail. Consum. Serv. 2020, 57, 102233. [Google Scholar] [CrossRef]
  11. Chakraborty, S.; Hoque, S.; Jeem, N.R.; Biswas, M.; Bardhan, D.; Lobaton, E. Fashion Recommendation Systems, Models and Methods: A Review. Informatics 2021, 8, 49. [Google Scholar] [CrossRef]
  12. Mendia, J.M.V.; Flores-Cuautle, J.J.A. Toward customer hyper-personalization experience—A data-driven approach. Cogent Bus. Manag. 2022, 9, 1. [Google Scholar] [CrossRef]
  13. Jain, G.; Rakesh, S.; Nabi, M.K.; Chaturvedi, K. Hyper-personalization—Fashion sustainability through digital clienteling. Res. J. Text. Appar. 2018, 22, 320–334. [Google Scholar] [CrossRef] [Green Version]
  14. Jain, G.; Paul, J.; Shrivastava, A. Hyper-personalization, co-creation, digital clienteling and transformation. J. Bus. Res. 2020, 124, 12–23. [Google Scholar] [CrossRef]
  15. Jannach, D.; Zanker, M.; Felfernig, A.; Friedrich, G. Recommender Systems: An Introduction; Cambridge University Press: Cambridge, UK, 2010. [Google Scholar] [CrossRef]
  16. Sarwar, B.; Karypis, G.; Konstan, J.; Riedl, J. Item-Based Collaborative Filtering Recommendation Algorithms. In Proceedings of the 10th International Conference on World Wide Web, WWW ’01, Hong Kong, China, 1–5 May 2001; Association for Computing Machinery: New York, NY, USA, 2001; pp. 285–295. [Google Scholar] [CrossRef] [Green Version]
  17. Bobadilla, J.; Ortega, F.; Hernando, A.; Gutiérrez, A. Recommender systems survey. Knowl. Based Syst. 2013, 46, 109–132. [Google Scholar] [CrossRef]
  18. Marx, P.; Hennig-Thurau, T.; Marchand, A. Increasing Consumers’ Understanding of Recommender Results: A Preference-Based Hybrid Algorithm with Strong Explanatory Power. In Proceedings of the Fourth ACM Conference on Recommender Systems, RecSys ’10, Barcelona, Spain, 26–30 September 2010; Association for Computing Machinery: New York, NY, USA, 2010; pp. 297–300. [Google Scholar] [CrossRef]
  19. Ricci, F.; Rokach, L.; Shapira, B. Recommender Systems Handbook, 2nd ed.; Springer: New York, NY, USA, 2015. [Google Scholar] [CrossRef]
  20. Bhatnagar, V. (Ed.) . Collaborative Filtering Using Data Mining and Analysis; IGI Global: Hershey, PE, USA, 2016. [Google Scholar] [CrossRef]
  21. Adomavicius, G.; Tuzhilin, A. Toward the next generation of recommender systems: A survey of the state-of-the-art and possible extensions. IEEE Trans. Knowl. Data Eng. 2005, 17, 734–749. [Google Scholar] [CrossRef]
  22. Akrivas, G.; Wallace, M.; Andreou, G.; Stamou, G.; Kollias, S. Context—Sensitive Semantic Query Expansion. Proceedings 2002 IEEE International Conference on Artificial Intelligence Systems (ICAIS 2002), Divnomorskoe, Russia, 5–10 September 2002; pp. 109–114. [Google Scholar]
  23. Anand, S.S.; Mobasher, B. (Eds.) Intelligent Techniques for Web Personalization. In Intelligent Techniques in Web Personalization; Springer: Berlin, Germany, 2005; pp. 1–36. [Google Scholar] [CrossRef]
  24. Jones, G. Challenges and Opportunities of Context-Aware Information Access. In Proceedings of the International Workshop on Ubiquitous Data Management, Tokyo, Japan, 4 April 2005; pp. 53–62. [Google Scholar] [CrossRef] [Green Version]
  25. Chen, Z.-S.; Jang, J.-S.R.; Lee, C.-H. A Kernel Framework for Content-Based Artist Recommendation System in Music. IEEE Trans. Multimed. 2011, 13, 1371–1380. [Google Scholar] [CrossRef]
  26. Jurado-Lucena, A.; Errasti-Alcalá, B.; Escot-Bocanegra, D.; Fernández-Recio, R.; Poyatos-Martínez, D.; Montiel Sánchez, I. Methodology to Achieve Accurate Non Cooperative Target Identification Using High Resolution Radar and a Synthetic Database. In Trends in Applied Intelligent Systems; García-Pedrajas, N., Herrera, F., Fyfe, C., Benítez, J.M., Ali, M., Eds.; Springer: Berlin/Heidelberg, Germany, 2010; pp. 427–436. [Google Scholar]
  27. Goldberg, D.; Nichols, D.; Oki, B.M.; Terry, D. Using collaborative filtering to weave an information tapestry. Commun. ACM 1992, 35, 61–70. [Google Scholar] [CrossRef]
  28. Schafer, J.B.; Konstan, J.; Riedl, J. Recommender Systems in E-Commerce. In Proceedings of the 1st ACM Conference on Electronic Commerce, EC ’99, Denver, CO, USA, 3–5 November 1999; Association for Computing Machinery: New York, NY, USA, 1999; pp. 158–166. [Google Scholar] [CrossRef]
  29. Rashid, A.M.; Lam, S.K.; Karypis, G.; Riedl, J. ClustKNN: A Highly Scalable Hybrid Model- & Memory-Based CF Algorithm. Search 2006, 35, 61–70. [Google Scholar]
  30. Breese, J.S.; Heckerman, D.; Kadie, C. Empirical Analysis of Predictive Algorithms for Collaborative Filtering. In Proceedings of the Fourteenth conference on Uncertainty in artificial intelligence, Madison, WI, USA, 24–26 July 1998; pp. 43–52. [Google Scholar]
  31. Felfernig, A.; Burke, R. Constraint-Based Recommender Systems: Technologies and Research Issues. In Proceeding of the 10th International Conference on Electronic Commerce, Innsbruck, Austria, 19–22 August 2008. [Google Scholar] [CrossRef]
  32. Burke, R. Hybrid Recommender Systems: Survey and Experiments. User Model. User-Adapted Interact. 2002, 12, 331–370. [Google Scholar] [CrossRef]
  33. Herlocker, J.L.; Konstan, J.A.; Borchers, A.; Riedl, J. An algorithmic framework for performing collaborative filtering. In Proceedings of the 22nd Annual International ACM SIGIR Conference on Research and Development in Information Retrieval—SIGIR ’99, Berkeley, CA, USA, 15–20 August 1999; Association for Computing Machinery (ACM): New York, NY, USA, 1999; pp. 230–237. [Google Scholar]
  34. Tan, P.-N.; Steinbach, M.; Karpatne, A.; Kumar, V. Introduction to Data Mining, 2nd ed.; Pearson: New York, NY, USA, 2018. [Google Scholar]
  35. Ding, Y.; Li, X.; Orlowska, M.E. Recency-Based Collaborative Filtering. In Proceedings of the 17th Australasian Database Conference—Volume 49, ADC ’06, Hobart, Australia, 16–19 January 2006; Australian Computer Society, Inc.: Hobart, Australia, 2006; pp. 99–107. [Google Scholar]
  36. Pazzani, M.; Billsus, D. Learning and Revising User Profiles: The Identification of Interesting Web Sites. Mach. Learn. 1997, 27, 313–331. [Google Scholar] [CrossRef]
  37. Kim, H.-N.; Ji, A.-T.; Ha, I.; Jo, G.-S. Collaborative filtering based on collaborative tagging for enhancing the quality of recommendation. Electron. Commer. Res. Appl. 2010, 9, 73–83. [Google Scholar] [CrossRef]
  38. Jomaa, I.; Poirson, E.; Da Cunha, C.; Petiot, J.-F. Design of a Recommender System Based on Customer Preferences: A Comparison Between Two Approaches. In Proceedings of the ASME 2012 11th Biennial Conference on Engineering Systems Design and Analysis, Nantes, France, 2 July 2012; pp. 827–836. [Google Scholar] [CrossRef]
  39. Sun, C.; Gao, R.; Xi, H. Big data based retail recommender system of non E-commerce. In Proceedings of the Fifth International Conference on Computing, Communications and Networking Technologies (ICCCNT), Hefei, China, 11–13 July 2014; pp. 1–7. [Google Scholar] [CrossRef]
  40. Hwangbo, H.; Kim, Y.S.; Cha, K.J. Recommendation system development for fashion retail e-commerce. Electron. Commer. Res. Appl. 2018, 28, 94–101. [Google Scholar] [CrossRef]
  41. Iwanaga, J.; Nishimura, N.; Sukegawa, N.; Takano, Y. Improving collaborative filtering recommendations by estimating user preferences from clickstream data. Electron. Commer. Res. Appl. 2019, 37, 100877. [Google Scholar] [CrossRef]
  42. Ngaffo, A.N.; El Ayeb, W.; Choukair, Z. A service recommendation approach based on trusted user profiles and an enhanced similarity measure. Electron. Commer. Res. 2021, 22, 1537–1572. [Google Scholar] [CrossRef]
  43. Zhao, Y.-S.; Liu, Y.-P.; Zeng, Q.-A. A weight-based item recommendation approach for electronic commerce systems. Electron. Commer. Res. 2015, 17, 205–226. [Google Scholar] [CrossRef]
  44. Son, J.; Kim, S.B. Content-based filtering for recommendation systems using multiattribute networks. Expert Syst. Appl. 2017, 89, 404–412. [Google Scholar] [CrossRef]
  45. Choi, K.; Yoo, D.; Kim, G.; Suh, Y. A hybrid online-product recommendation system: Combining implicit rating-based collaborative filtering and sequential pattern analysis. Electron. Commer. Res. Appl. 2012, 11, 309–317. [Google Scholar] [CrossRef]
  46. Li, Y.-H.; Fan, Z.-P.; Qiao, G. Product recommendation incorporating the consideration of product performance and customer service factors. Kybernetes 2017, 46, 1753–1776. [Google Scholar] [CrossRef]
  47. Cao, M.; Zhou, S.; Gao, H. A Recommendation Approach Based on Product Attribute Reviews: Improved Collaborative Filtering Considering the Sentiment Polarity. Intell. Autom. Soft Comput. 2019, 25, 595–605. [Google Scholar] [CrossRef]
  48. Cai, X.; Hu, Z.; Zhao, P.; Zhang, W.; Chen, J. A hybrid recommendation system with many-objective evolutionary algorithm. Expert Syst. Appl. 2020, 159, 113648. [Google Scholar] [CrossRef]
  49. Walek, B.; Fojtik, V. A hybrid recommender system for recommending relevant movies using an expert system. Expert Syst. Appl. 2020, 158, 113452. [Google Scholar] [CrossRef]
  50. Li, M.; Li, Y.; Lou, W.Q.; Chen, L.S. A hybrid recommendation system for Q & A documents. Expert Syst. Appl. 2020, 144, 11308. [Google Scholar] [CrossRef]
  51. Rodpysh, K.V.; Mirabedini, S.J.; Banirostam, T. Model-driven approach running route two-level SVD with context information and feature entities in recommender system. Comput. Stand. Interfaces 2022, 82, 103627. [Google Scholar] [CrossRef]
  52. Zhou, Q.; Zhuang, W.; Ren, H.; Chen, Y.; Yu, B.; Lou, J.; Wang, Y. Hybrid collaborative filtering model for consumer dynamic service recommendation based on mobile cloud information system. Inf. Process. Manag. 2022, 59, 102871. [Google Scholar] [CrossRef]
  53. Ha, S.H. Helping online customers decide through Web personalization. IEEE Intell. Syst. 2002, 17, 34–43. [Google Scholar] [CrossRef]
  54. Liu, D.-R.; Shih, Y.-Y. Hybrid approaches to product recommendation based on customer lifetime value and purchase preferences. J. Syst. Softw. 2005, 77, 181–191. [Google Scholar] [CrossRef]
  55. Lee, S.-L. Commodity recommendations of retail business based on decisiontree induction. Expert Syst. Appl. 2010, 37, 3685–3694. [Google Scholar] [CrossRef]
  56. Rodrigues, F.; Ferreira, B. Product Recommendation based on Shared Customer’s Behaviour. Procedia Comput. Sci. 2016, 100, 136–146. [Google Scholar] [CrossRef] [Green Version]
  57. Rezaeinia, S.M.; Rahmani, R. Recommender system based on customer segmentation (RSCS). Kybernetes 2016, 45, 946–961. [Google Scholar] [CrossRef]
  58. Najafabadi, M.K.; Mahrin, M.N.; Chuprat, S.; Sarkan, H.M. Improving the accuracy of collaborative filtering recommendations using clustering and association rules mining on implicit data. Comput. Hum. Behav. 2017, 67, 113–128. [Google Scholar] [CrossRef]
  59. Chen, Z.; Wang, Y.; Zhang, S.; Zhong, H.; Chen, L. Differentially private user-based collaborative filtering recommendation based onk-means clustering. Expert Syst. Appl. 2020, 168, 114366. [Google Scholar] [CrossRef]
  60. Bellini, P.; Palesi, L.A.I.; Nesi, P.; Pantaleo, G. Multi Clustering Recommendation System for Fashion Retail. Multimed. Tools Appl. 2022, 82, 9989–10016. [Google Scholar] [CrossRef] [PubMed]
  61. Jing, N.; Jiang, T.; Du, J.; Sugumaran, V. Personalized recommendation based on customer preference mining and sentiment assessment from a Chinese e-commerce website. Electron. Commer. Res. 2017, 18, 159–179. [Google Scholar] [CrossRef]
  62. U, L.; Chai, Y.; Chen, J. Improved personalized recommendation based on user attributes clustering and score matrix filling. Comput. Stand. Interfaces 2018, 57, 59–67. [Google Scholar] [CrossRef]
  63. Wang, R.; Wang, J.; Su, Z. Learning compatibility knowledge for outfit recommendation with complementary clothing matching. Comput. Commun. 2021, 181, 320–328. [Google Scholar] [CrossRef]
  64. Wang, S.; Qiu, J. A deep neural network model for fashion collocation recommendation using side information in e-commerce. Appl. Soft Comput. 2021, 110, 107753. [Google Scholar] [CrossRef]
  65. Balim, C.; Özkan, K. Diagnosing fashion outfit compatibility with deep learning techniques. Expert Syst. Appl. 2023, 215, 119305. [Google Scholar] [CrossRef]
  66. Sulikowski, P. Evaluation of Varying Visual Intensity and Position of a Recommendation in a Recommending Interface towards Reducing Habituation and Improving Sales. In Proceedings of the 16th International Conference on e-Business Engineering (ICEBE 2019), Shanghai, China, 12–13 October 2019; Chao, K.-M., Jiang, L., Hussain, O.K., Ma, S.-P., Fei, X., Eds.; Springer: Berlin/Heidelberg, Germany, 2019; pp. 208–218. [Google Scholar]
  67. Sulikowski, P.; Zdziebko, T. Deep Learning-Enhanced Framework for Performance Evaluation of a Recommending Interface with Varied Recommendation Position and Intensity Based on Eye-Tracking Equipment Data Processing. Electronics 2020, 9, 266. [Google Scholar] [CrossRef] [Green Version]
  68. Sulikowski, P.; Zdziebko, T. Horizontal vs. Vertical Recommendation Zones Evaluation Using Behavior Tracking. Appl. Sci. 2020, 11, 56. [Google Scholar] [CrossRef]
  69. Sulikowski, P.; Ryczko, K.; Bąk, I.; Yoo, S.; Zdziebko, T. Attempts to Attract Eyesight in E-Commerce May Have Negative Effects. Sensors 2022, 22, 8597. [Google Scholar] [CrossRef]
  70. Sulikowski, P.; Kucznerowicz, M.; Bąk, I.; Romanowski, A.; Zdziebko, T. Online Store Aesthetics Impact Efficacy of Product Recommendations and Highlighting. Sensors 2022, 22, 9186. [Google Scholar] [CrossRef]
  71. Sharma, M.; Mittal, R.; Bharati, A.; Saxena, D.; Singh, A.K. A Survey and Classification on Recommendation Systems. In Proceedings of the 2nd International Conference on Big Data, Machine Learning and Applications (BigDML 2021), Silchar, India, 19–20 December 2021; pp. 1–16. [Google Scholar]
  72. Çano, E.; Morisio, M. Hybrid recommender systems: A systematic literature review. Intell. Data Anal. 2017, 21, 1487–1524. [Google Scholar] [CrossRef] [Green Version]
  73. Christy, A.J.; Umamakeswari, A.; Priyatharsini, L.; Neyaa, A. RFM ranking—An effective approach to customer segmentation. J. King Saud Univ. Comput. Inf. Sci. 2018, 33, 1251–1257. [Google Scholar] [CrossRef]
  74. Rahim, M.A.; Mushafiq, M.; Khan, S.; Arain, Z.A. RFM-based repurchase behavior for customer classification and segmentation. J. Retail. Consum. Serv. 2021, 61, 102566. [Google Scholar] [CrossRef]
  75. Hughes, A.M. Strategic Database Marketing: The Masterplan for Starting and Managing a Profitable, Customer-Based Marketing Program, 3rd ed.; McGraw-Hill Pub. Co.: New York, NY, USA, 2005. [Google Scholar]
  76. Yavuz, S.; Deveci, M. The Effect of Statistical Normalization Techniques on the Performance of Artificial Neural Network. J. Erciyes Univ. Fac. Econ. Adm. Sci. 2012, 1, 167–187. [Google Scholar] [CrossRef]
  77. Ikotun, A.M.; Ezugwu, A.E.; Abualigah, L.; Abuhaija, B.; Heming, J. K-means clustering algorithms: A comprehensive review, variants analysis, and advances in the era of big data. Inf. Sci. 2023, 622, 178–210. [Google Scholar] [CrossRef]
  78. Agarwal, S. Data Mining: Data Mining Concepts and Techniques. In Proceedings of the 2013 International Conference on Machine Intelligence and Research Advancement, Katra, India, 21–23 December 2013; pp. 203–207. [Google Scholar] [CrossRef]
  79. Nainggolan, R.; Perangin-angin, R.; Simarmata, E.; Tarigan, A.F. Improved the Performance of the K-Means Cluster Using the Sum of Squared Error ({SSE}) optimized by using the Elbow Method. J. Phys. Conf. Ser. 2019, 1361, 12015. [Google Scholar] [CrossRef]
  80. Kumar, B.; Rukmani, K. Implementation of Web Usage Mining Using APRIORI and FP Growth Algorithms. Int. J. Adv. Netw. Appl. 2010, 404, 400–404. [Google Scholar]
  81. Bilgin, T.T.; Çamurcu, Y. Applied Comparison of DBSCAN, OPTICS and K-Means Clustering Algorithms. J. Polytec. 2005, 8, 139–145. [Google Scholar]
Figure 1. Basic flowchart of recommendation systems.
Jtaer 18 00029 g001
Figure 2. The classification of recommendations systems.
Jtaer 18 00029 g002
Figure 3. Basic flowchart of the content-based approach.
Jtaer 18 00029 g003
Figure 4. Conceptual design of the proposed system.
Jtaer 18 00029 g004
Figure 5. Flowchart of the proposed recommendation system.
Jtaer 18 00029 g005
Figure 6. Schematic presentation of experimental design.
Jtaer 18 00029 g006
Figure 7. Variation of WSS value with the number of customer clusters.
Jtaer 18 00029 g007
Table 1. Region names and corresponding numeric codes.
Numeric CodeRegion
1 Marmara Region
2 Aegean Region
3 Mediterranean Region
4 Central Anatolia Region
5 Eastern Anatolia Region
6 Southeastern Anatolia Region
7 Black Sea Region
Table 2. Characteristics of the customer clusters.
Cluster Frequency Monetary Recency Two Busiest RegionsCustomer Quantity
1 1.355 155.773 203.985 1 and 2 18,244
2 6.343 1075.469 223.297 1 and 4 674
3 0.634 132.360 798.468 1 and 3 14,258
Table 3. Top ten association rules identified for customer clusters.
ClusterAntecedent DescriptionConsequent DescriptionSupport (%) Confidence (%)
1 M_BLT Men Belt M_PNT Men Trousers 2.442 46.847
1 W_SHS Women Shirt Short Sleeve W_TSS Women T-Shirt Short Sleeve1.579 43.454
1 W_ATH Women Athletes W_TSS Women T-Shirt Short Sleeve4.795 38.440
1 M_ATH Male Athlete M_TSS Men T-Shirt Short Sleeve1.157 38.403
1 M_SCK Men Socks M_PNT Men Trousers3.621 35.358
1 M_SRT Men Shorts M_TSS Men T-Shirt Short Sleeve3.779 35.274
1 W_BLT Women Belt W_PNT Women Pants 2.838 35.194
1 M_SHG Men Shirt Long Sleeve M_PNT Men Trousers7.193 33.700
1 W_TSL Women T-Shirt Long Sleeve W_TSS Women T-Shirt Short Sleeve2.820 33.541
1 W_SCK Women Socks W_PNT Women Pants 3.951 32.183
2 M_BLT Men BeltM_PNT Men Trousers3.804 55.970
2 M_TSS and W_PNT Men T-Shirt Short Sleeve and Women PantsW_TSS Women T-Shirt Short Sleeve1.022 55.556
2 W_BLT Women BeltW_PNT Women Pants 1.646 51.724
2 M_SCK Men SocksM_PNT Men Trousers2.299 50.617
2 W_SHG and W_TSS Women Shirt Long Sleeve and Women T-Shirt Short SleeveW_PNT Women Pants 2.157 50.000
2 M_SHG Men Shirt Long Sleeve M_PNT Men Trousers10.304 49.587
2 M_PLV and M_SHG Men Sweater and Men Shirt Long Sleeve M_PNT Men Trousers1.107 48.718
2 W_SCK Women SocksW_PNT Women Pants 2.157 48.684
2 M_SHS Men Shirt Short Sleeve M_PNT Men Trousers6.812 46.667
2 W_TNC Women Tunic W_TSS Women T-Shirt Short Sleeve1.646 46.552
3 M_BLT Men BeltM_PNT Men Trousers3.556 48.667
3 W_TNC Women Tunic W_TSS Women T-Shirt Short Sleeve1.387 45.299
3 W_SHS Women Shirt Short SleeveW_TSS Women T-Shirt Short Sleeve1.576 41.353
3 M_SRT Men Shorts M_TSS Men T-Shirt Short Sleeve5.109 38.051
3 M_PTK Men Polo Short-Sleeve M_TSS Men T-Shirt Short Sleeve4.498 37.286
3 W_ATH Women Athletes W_TSS Women T-Shirt Short Sleeve4.350 37.193
3 M_SRB Men Sea Shorts M_TSS Men T-Shirt Short Sleeve2.465 37.019
3 M_SHG Men Shirt Long Sleeve M_PNT Men Trousers8.416 35.775
3 M_SLR Men Slipper M_TSS Men T-Shirt Short Sleeve2.027 35.380
3 W_TSL Women T-Shirt Long SleeveW_TSS Women T-Shirt Short Sleeve3.360 35.097
Table 4. Purchased product-category distribution for the selected customer.
CategoryDescriptionPurchase Quantity
W_PNT Women Pants6
W_CRD Women Cardigan4
W_TSS Sleeve3
W_PLV Women Sweater2
W_SRT Women Shorts2
W_ATH Women Athletes1
W_COA Women Coat1
W_SCK Women Socks1
W_SHG Women Shirt Long Sleeve1
W_SKR Women Skirt1
W_SRB Women Sea Shorts1
W_SWS Women Sweatshirt1
Table 5. Potential category pairs that can be recommended for the selected customer.
AntecedentDescriptionConsequentDescriptionSupport (%) Confidence (%)
W_TSS Women T-Shirt Short SleeveW_PNT Women Pants13.738 39.876
W_CRD Women CardiganW_PNT Women Pants3.094 35.780
W_CRD Women CardiganW_PLV Women Sweater3.094 30.275
W_CRD Women CardiganW_TSS Women T-Shirt Short Sleeve3.094 23.853
W_CRD Women CardiganW_SWS Women Sweatshirt 3.094 22.018
W_PNT Women PantsW_TSS Women T-Shirt Short Sleeve27.022 20.273
W_CRD Women CardiganW_TSL Women T-Shirt Long Sleeve 3.094 18.349
W_CRD Women CardiganW_SHG Women Shirt Long Sleeve 3.094 17.431
W_TSS Women T-Shirt Short SleeveW_SHG Women Shirt Long Sleeve 13.738 15.702
W_TSS Women T-Shirt Short SleeveW_ATH Women Athletes 13.738 15.289
W_TSS Women T-Shirt Short SleeveM_TSS Men T-Shirt Short Sleeve13.738 15.289
Table 6. A recommendation list was created for the selected customer.
Model Category DescriptionOrder
CL1004735 W_PLV Women Sweater 1
CL1003827 W_PLV Women Sweater2
CL1006477 W_PLV Women Sweater3
CL1005006 W_PLV Women Sweater4
CL1005054 W_PLV Women Sweater5
CL1013242 W_PNT Women Pants 1
CL1013265 W_PNT Women Pants2
CL1017746 W_PNT Women Pants3
CL1013322 W_PNT Women Pants4
CL1013333 W_PNT Women Pants5
CL1014261 W_SWS Women Sweatshirt 1
CL1022345 W_SWS Women Sweatshirt2
CL1022346 W_SWS Women Sweatshirt3
CL1023071 W_SWS Women Sweatshirt4
CL1024806 W_SWS Women Sweatshirt5
CL1018843 W_TSS Women T-Shirt Short Sleeve 1
CL1018592 W_TSS Women T-Shirt Short Sleeve2
CL1017197 W_TSS Women T-Shirt Short Sleeve3
CL1018603 W_TSS Women T-Shirt Short Sleeve4
CL1017935 W_TSS Women T-Shirt Short Sleeve5
Table 7. The shopping details of the selected customer during the recommendation period.
E-mail ID Item CodeCategory DescriptionOrder Number
40881 CL1021011 W_SHG Women Shirt Long Sleeve 0000115725_WO
40881 CL1017746 W_PNT Women Pants 0000115725_WO
40881 CLBDEWSRT0329070 W_SRT Women Shorts 0000115725_WO
40881 CL1019961 W_SRB Women Sea Shorts 0000115725_WO
Table 8. Implementation outputs of the current recommendation system.
ClusterPeriod of the Analyzed Timeframe’s 3rd Year RecallPrecisionF1Average of Sales
1 January–March0.1670.1400.15276.38
1 April–June0.2480.1610.19571.18
1 July–September0.0810.0690.07577.76
1 October–December0.2660.1380.18275.92
2 January–March0.1170.0960.10665.53
2 April–June0.2120.1530.17873.28
2 July–September0.2350.0990.13974.36
2 October–December0.1920.1300.15576.99
Average 0.14873.92
Table 9. Implementation outputs of the proposed recommendation system.
ClusterPeriod of the Analyzed Timeframe’s 3rd Year RecallPrecisionF1Average of Sales
1 January–March0.1840.1370.15780.89
1 April–June0.2420.1710.20067.65
1 July–September0.0850.0820.08484.32
1 October–December0.2120.1490.17573.87
2 January–March0.1220.1050.11371.05
2 April–June0.2310.1610.19079.92
2 July–September0.2210.1020.13975.37
2 October–December0.2090.1240.15572.51
Average 0.15275.70
Table 10. The percentage difference between the proposed RS and the current RS.
ClusterPeriod of the Analyzed Timeframe’s 3rd Year RecallPrecisionF1Average of Sales
1 January–March9.239−2.1903.1855.575
1 April–June−2.4795.8482.500−5.218
1 July–September4.70615.85410.7147.780
1 October–December−25.4727.383−4.000−2.775
2 January–March4.0988.5716.1957.769
2 April–June8.2254.9696.3168.308
2 July–September−6.3352.9410.0001.340
2 October–December8.134−4.8390.000−6.178
Average 3.1142.075
Table 11. Application outputs for the third cluster customers of the proposed system.
ClusterPeriod of the Analyzed Timeframe’s 2nd Year RecallPrecisionF1Average of Sales
3 January–March0.1830.1500.16574.42
3 April–June0.1430.1250.13461.56
3 July–September0.1660.1140.13578.42
3 October–December0.1960.1390.16268.70
Average 0.14970.78
Disclaimer/Publisher’s Note: The statements, opinions and data contained in all publications are solely those of the individual author(s) and contributor(s) and not of MDPI and/or the editor(s). MDPI and/or the editor(s) disclaim responsibility for any injury to people or property resulting from any ideas, methods, instructions or products referred to in the content.

