Article

Multichannel Digital Marketing Optimizations through Big Data Analytics in the Tourism and Hospitality Industry

by
Damianos P. Sakas
1,
Dimitrios P. Reklitis
1,*,
Marina C. Terzi
1,* and
Costas Vassilakis
2
1
Business Information and Communication Technologies in Value Chains Laboratory (BICTEVAC LABORATORY), Department of Agribusiness and Supply Chain Management, School of Applied Economics and Social Sciences, Agricultural University of Athens, 11855 Athens, Greece
2
Department of Informatics and Telecommunications, Akadimaikou G.K. Vlachou, 22100 Tripoli, Greece
*
Authors to whom correspondence should be addressed.
J. Theor. Appl. Electron. Commer. Res. 2022, 17(4), 1383-1408; https://doi.org/10.3390/jtaer17040070
Submission received: 31 July 2022 / Revised: 2 October 2022 / Accepted: 19 October 2022 / Published: 24 October 2022
(This article belongs to the Special Issue Multi-Channel Retail and Its Applications in the Future of E-Commerce)

Abstract

:
The tourism sector increasingly relies on technology to acquire new clients in a world overflowing with information. So, the main question that needs to be answered is:What digital marketing strategy should be adopted to attract customers and built digital brand name by incorporating websites and social media big data? The authors of this research utilize web analytics and big data to build an innovative methodology in an effort to address this issue. After the data collection, statistical analysis was implemented, followed by a fuzzy cognitive map and an agent-based simulation model in order to illustrate the usage of social media and user experience in multichannel marketing. The findings suggest that, in contrast to the websites of other industries, such as logistics, where customers want to finish their inquiries as quickly as possible and leave the webpage, it is advantageous for tourism websites to keep customers’ attention moreon their website in order to increasevisibility. Additionally, the research further highlights the importance of personalization and user-engagement content to e-WOM, suggesting to tourism businesses to encourage posts made by customers and employees.

1. Introduction

The Internet has changed the way that tourism companies conduct business [1]. The main lead generation of bookings derives from tourism websites and social media through advertisements or social media influencers [2,3,4]. The amount of information being produced across high-traffic platforms and popular applications is thrilling. Every single minute, Facebook users’ share 240k photos, Twitter users’ post 575k tweets, Instagram users’ share 65k photos, Google conducts 5.7m searches, and 6m people shop online [5]. Moreover, according to Statista, online users spend an average of 147 min per day on social medial platforms [6]. Nowadays, travelers search online to choose their travel destination, accommodation, and restaurant based on online reviews, indicating that social media platforms are able to affect users’ booking process [7]. For example, the crowd-sourced site TripAdvisor reached one billion reviews and opinions in 2021, a fact that demonstrates that travel inspiration happens through reviews, which is a factor that validates their booking process [8].These impressive numbers lead to the conclusion that consumers are heavily engaged with social media platforms, and therefore, growing business and increasing traffic is more likely to happen online [9,10]. Customers seek information through various sources, leading businesses to carefully consider various touchpoints in their customers’ journey mapping. As multiple marketing channels make the way into our daily lives, making the buying process an intuitive procedure is the key to ensure that businesses’ limited resources will be efficiently allocated to reach customers and deliver personalized, hassle-free experiences [11,12].
Undoubtedly, social media platforms come along with multiple trust issues. According to the Edelman Trust Barometer [13], the major information sources are not considered as trustful, with the level of trust in social media at only 37%. Online users receive information from social media platforms with skepticism [14]. However, within the travel and tourism industry, social media should be seen as the gold mine of trust-building by evaluating reviews and opinions from multiple social media platforms. According to recent research, social media postings are considered unbiased and objective, with travelers relying more on them rather than on official tourist websites [15]. Moreover, millennials tend to have the highest levels of trust on social media platforms, since they represent the majority of social media postings [16]. In addition, social media influencers [17] and brand awareness [18] positively influence the booking process of users and augment trust levels within the tourism industry. According to Statista, 49% of the respondents claim to “somewhat trust” review sites, indicating that online reviews have become the new e-WOM [19].
In the digital era, where there is a shift to an information-based economy, leveraging the power of popular social media is a powerful way to facilitate communication and achieve branding goals [20]. Internet-based channels create new opportunities for companies to obtain a 360-degree view of customers, with the intention to mold a personalized image as a first step to improving business accessibility and visibility. Indeed, the current trend in business marketing fends off traditional marketing tools to employ social media approaches, which add greater value to the product or service on offer [21]. From retargeting campaigns to personalized advertising, multichannel marketing approaches prove to be important in understanding the market pulse, driving in traffic, and predicting future trends.
Increasingly seen as a successful one-way path to customers’ purchasing intention [22,23] and brand loyalty [24,25], advertising in social media has attracted the attention of multiple researchers. Knoll conducted an empirical review in 51 studies to conclude that the use of advertising in social media is one of the seven emerging themes [26]. Similarly, Alalwan et al. state that promotional and advertising efforts are one of the predominant themes and trends for the academia, suggesting further research [27]. The digital transformation of the Hospitality, Travel, and Tourism (HTT) sector, with multiple mobile apps, websites, and social media platforms, offer tons of new avenues for the development of a better multichannel digital marketing strategy [28]. For example, HTT could construct loyalty programs that compensate positive e-WOM marketing on social media in exchange for loyalty points [29]
The study is allocated in 5 sections: The introductionis presented in Section 1; the materials and methodological framework are defined in Section 2, and the statistical analysis, as well as the Fuzzy Cognitive Map (FCM) and Agent-Based Model (ABM) findings, are presented in Section 3. Section 4 then summarizes the results, and Section 5 concludes with practical and theoretical implications of the research.

1.1. Multichannel Marketing in the Digital Era

The new digitalized ecosystem requires constant changes so as to adapt to the ever-changing environment of social media trends as a way to effectively satisfy customers’ preferences [30]. In an attempt to leverage the power of social media branding, companies are consistently looking for the right methods to effectively target their audience. Creating detailed user personas is challenging; however, it is the first step while developing a successful multichannel marketing strategy [31]. Identifying where a company’s traffic is coming from, in terms of what channels they frequently use and switch between, allows active industry players to bring their business back. Social media platforms are no longer sterile platforms for virtual communities, but important business tools to boost sales opportunities and brand communication through a significant dual effect:by acquiring new followers and influencing new followers’ friends [32].
Companies struggle to achieve optimal multichannel marketing activities since tracking the customer journey has become more difficult than ever. Customers, within the tourism industry, are constantly looking for personalized social media advertising experiences [33], setting personalization as the foundation of this massive shift in consumer behavior. More and more consumers are looking for ways not merely to buy a product or a service, but to also feel engaged toward the brand they have selected [34]. This process demands the development of a robust and strategic approach more personalized than ever before. Effectively executed personalization requires an update in personalized ads so as to reflect the digital transformation of consumers.
COVID-19 has accelerated consumers’ behavior to more digital services, heightening in this way their expectations for personalized experiences [35]. Indeed, a number of variables, among which are customer innovativeness, internet experience, and channel experience, greatly contribute to the advancement of customer experience management, taking customer experience to the next level [36]. That is to say that constant innovations in the HTT sector, such as mobile apps and the use of virtual reality, make tourism services more user-friendly and further advance the levels of customer experience as an antidote to brand building [37]. The revolution in digital marketing lies in social media advertising personalization as the default standard for customers’ engagement with brands [38]. As tailored advertising is getting smarter, the increase in customers’ conversions and leads generations fends off the traditional one-size advertising approaches, preferring instead personalization tactics that meet or even exceed customers’ needs and expectations [39].
Multiple touchpoints exist today since consumers spend a great amount of time online, some of which are found on social media platforms. As such, companies struggle to find solutions on how to orchestrate their marketing activities across channels [40]. Not only that, but also as consumers get savvier, the winds of change have moved the bottom-line from less environmental-friendly companies to those that adopt a more sustainable approach in favor of brand optimization [41]. The Ad-Net-Zero Report is an important attempt of advertising professionals to support brand campaigns that promote sustainable behaviors [42]. In fact, tourism companies that support environmental, social, and governance (ESG) principles in their business strategy are more likely to achieve higher levels of travelers’ loyalty [43]. An interested work has been recently published by Polman and Winston, named Net Positive [44]. In this book, the authors strongly argue that the employment of a holistic, sustainable approach, from maximizing the benefits for products, services, and influence to employees, consumers, suppliers, communities, and more, lead companies to thrive. This is a trend that appeases not only travelers but the entire travel community as well, from travel stakeholders to investors [45]. An interesting attempt has been made by Google Flights, where users can find carbon emission estimates on their flight search results [46]. The stake for companies lies in decarbonizing their ads and environmental fingerprint in an attempt to offer personalized sustainable-focused marketing campaigns, which will become the new driver for competitive advantage [47].
The question here is not whether personalized advertising will shape e-commerce in the future, it is how companies can gather and analyze the right data in favor of personalization, as the foundation of an effective multichannel marketing strategy. Exposure to superior e-business personalization demands a great amount of data to be collected. Noticeably, numerous studies have been devoted to social media efficiency in advertising activities [48,49,50]. Moreover, multichannel retailing has been thoroughly investigated by researchers, indicating it as a win-win game contingent on market environments [51,52]. However, little research has been conducted on how multichannel shoppers react on different online social media platforms and how digital advertising messages could be best processed to potential customers. Lee and Cho identify the effect of big data on advertisement executions as one of the key trends pertaining to digital advertising [53]. Zhang et al. acknowledge the importance of big data regarding customers’ satisfaction and brand awareness [54]. Similarly, Chang, Kaufmann, and Kwon state that big data analysis is here to analyze social science phenomena in the real-world setting [55].
Within the HTT industry, several works of research have been carried out using big data [56,57,58,59]. A very interesting study has been carried out by Xiang, Du, Ma, and Fan using social media data in the tourism and hospitality sector [60]. This is one of the first studies to explore the contribution of social media to the HTT domain and pave the way for more research on this topic, such as tourist sites’ image posting [61] and attractions in heritage parks [62]. According to Xu, Nash, and Whitmarsh, social media analytics can contribute to the development of balanced methodological approaches, especially if combined with small data [63]. The literature review reveals that there is a strong connection between big data and innovations within the tourism research [64], a fact that opens new avenues for future research on social media analytics and the HTT sector. The benefits are dual: adopting big data artificial intelligence strategies can offer increased efficiency, productivity, and profitability to tourism businesses and personalized, convenient, and rich experience to customers [65]
The landscape of digital advertising constantly changes, raising concerns regarding customer engagement and retention rate. Marketers need to re-evaluate their ads from massive targeting to personalized messaging in an attempt to meet current needs and anticipate new trends. The possibility of hypereffective ads lies on the prompt analysis of online customers’ behavior based on crowdsourcing data [66].

1.2. Digitalization in the Travel and Tourism Industry

According to the World Economic Forum’s Digital Transformation Initiative, digitalization in aviation, travel, and tourism is expected to create up to USD 305 by 2025 [67]. Advances in technology boost innovation and growth, allowing travel and tourist companies to replace traditional tourism in a more human-centric, personalized approach [68]. Leveraging technology, such as the social media explosion, goes beyond digitalization; it introduces tools and activities that change the travel behavior from the beginning to the end and enables travel companies to stay ahead of the curve [69,70].
TCI research reveals that 31% of online users are willing to share their travel experiences even with users outside their friend zone [71]. As such, social media should be seen as a part of customers’ decision-making process, able to shape perceptions [72], and become an influential factor of selecting tourist destinations [73]. It therefore becomes apparent that by harvesting data and analytics, travel and tourist companies acknowledge behavioral patterns that will help them build targeted marketing campaigns on a larger scale.
Undoubtedly, social media and tourism marketing comprise an incredible opportunity, a perfect match for growth and development of existing activities and future trends within the travel industry. Social media analysis empowers brands with useful insights so as to increase guest engagement, gain competitive advantage, and achieve business superiority within the tourism sector [74,75]. In August 2021, a survey was conducted in the United States to determine the online travel brands with the best social media presence [76]. A total of 34% of the respondents voted for booking.com and 25% for Expedia. However, the systematic use of social media before, during, and after trips depends greatly on the nationality of travelers [77]. One main concern of the popularity of social media platforms is strongly associated with cultural values. Social media tears down national boundaries, and it is the local culture that seems to face the most challenges [78]. Based on a recent paper, 40% of the respondents’ cultural identity seems to be affected by the use of social media [79]. Apart from gradually losing their local identity and adopting a cross-cultural one, one could further encounter posts containing feelings that violated their cultural values. Nevertheless, one thing is for sure: social media is here to stay and those companies who manage to engage critically with the dynamics that unfold, by fighting an uphill battle, will win the race of competitiveness [80].
The role of social media has been further researched in multiple sectors, among which are hospitality, tourism, and travel [81]. In 2021, advertisers in the United States were projected to spend nearly USD 106 billion on programmatic digital display advertising, which is expected to increase to nearly USD 142 billion by 2023 [82]. According to a study conducted in the fourth quarter of 2021, approximately 24 percent of surveyed Spanish consumers aged between 18 and 29 years looked at posts on social media for holiday inspiration, and 21 percent of Dutch respondents aged 45 years and older claimed to do the same [83]. It is evident that both the tourism industry [84] and travelers [85] greatly rely on the use of social media platforms as a way to inspire or get inspired, respectively.
It is apparent that tourism advertising in social media requires further investigation [86].Hanouda states the positive impact of online users toward social media advertising and highlights the need for future research in the social advertising field within the travel and tourism industry [87]. Several recent works of research in the hospitality, tourism, and travel (HTT) industry exist, exploring interesting topics that mainly look at the role of social media on brand trust [88], sharing behavior [89], tourism information quality [90], destination marketing and image [91,92,93], among others, showing that social media marketing can affect consumers’ online decision-making process [94]. One of the latest studies in the HTT sector identifies that social media advertising is an understudied research field, suggesting future research should be concentrated on social media platforms as an advertising medium [3]. The authors further advise future studies that will overcome the national borders and adopt a cross-national identity. Having that said, the current study attempts to fill this gap and therefore focuses on social media advertising within the HTT industry at a global level. The paper extracts data from 10 world leading tourism websites in an attempt to study the behavioral patterns of online users. Given the great attention that has been given to the relationship between online reviews and online users [95], the present study investigates the interconnection between social media advertising across multiple channels in favor of tourism businesses’ brand optimization.
Implementing successful multichannel approaches is a difficult task in business, especially in understanding customers’ behavior [96]. Having this in mind, and with an eye to big data-driven technology, the authors focus on the role of implementing a multichannel marketing strategy, with a special interest in social media channels, as a cornerstone to encourage customer engagement, increase sales opportunities, and build brand awareness and visibility across digital platforms. Since advertising on social media is seen as an emerging trend within the tourism sector, the present study is devoted to understanding the importance of new digital technologies in shaping users’ purchasing intentions and building brand awareness and stability.

1.3. Web Analytics KPIs and Tourism Digital Brand Name

The implementation and analysis of big data and web analytics on a holistic digital marketing strategy is crucial for the optimization of the digital brand name in various sectors [10,24,42,97]. It is essential for tourism companiesto invest in new digital channels of interactionwith customers in order to increase bookings and sales in a highly competitive environment [98]. A logical consequent question arises. What are those channels that can contribute to customer user engagement and optimize the corporate digital brand name in tourism enterprises? This study attempts to respond with the extraction and analysis of the following Web Analytics KPIs that have been shown [99,100,101] that play a crucial role in those parameters.
Web analytics (WA) can be defined asthe process of analyzing user activity on a webpage [102]. Web analytics, which were collected from the websites under examination and quantitatively analyzed, are namedkey performance indicators (KPIs) [103]. The web analytics KPIs for websites’ user activity and social media user behavior has been gathered from Semrush.com (accessed on 15 July 2022) and Fanpagekarma.com (accessed on 15 July 2022), respectively.
Table 1. Description of the Web analytics KPIs.
WA KPIsDescription of the WA KPIs
Social Media TrafficSocial media platforms such as Instagram and Facebook redirect users to the corporate website through links or advertisements. This KPI is named Social Media Traffic [104].
Organic TrafficVisitors that arrive on the webpage using a search engine are referred to as “organic traffic.” [104].
Global RankThe platforms’ overall traffics (organic, social, and paid traffic) and the user engagement parameters (pages/visits, average time on site) combined produce this KPI. Since a website in the first spot has a higher rating than a website in the fourteenth position, the smaller the global rank, the more famous the website [104,105].
Websites’ Average Time on SiteThis WA KPI determines how many seconds are spent on average by users on a webpage per visit [104].
Websites’ Pages/VisitThis WA KPI calculates the total number of pages viewed by each user when they enter a tourism website [104].
Websites’ Paid TrafficThis WA KPI is generated through paid methods. For instance, Google search leads users to tourism websites when they click on an advertisement [104].
Websites’ Total VisitsThis WA KPI measures how many users visit a website each day. This sum is computed while a cookie is used to track each visitor’s IP address [104].
Websites’ Bounce RateThis WA KPI is the percentage of website users that are one-page visits, and the visitor leaving the site without reading a second webpage is known as the bounce rate [104].
Total Fans in Facebook/InstagramThis WA KPI refers to the total number of fans of a tourism website [106,107].
Total Reactions to comments in Facebook/InstagramThe number of comments made on posts that were made during the chosen time frame [108].
Number of Comments in Facebook/InstagramThis WA KPI illustrates the total number of comments of the tourism websites social media [106].
Number of Likes in Facebook/InstagramThis WA KPI presents the total number of likes of the tourism websites’ social media [106].
Post Interaction in Facebook/InstagramThe post interaction metric measures how frequently fans interact with a post’s content. It displays the average number of interactions per fan [109].

1.4. Formulation of Research Hypotheses

To acquirea competitive advantage, tourismenterprisesmust assess their surroundings using all accessible resources, especially thedigital ones [110]. Some crucial elements that need to be taken under consideration are the users’ behavioral factors on the corporate website, such as “average time on site” and “pages per visit”, as well as the behavioral factors of the users on social media, such as “post interaction” and “number of likes”. The analysis of those factors can provide a holistic view of the user engagement and corporate digital brand name [111].
The study’s findings will help decision-makers and marketers determine the optimal multichannel digital marketing strategythat distinguishes one tourismenterprise from another.More precisely, decision-makers may maximize digital investments by analyzing site analytics and combining them into a broader plan to boost the company’s digitalbrand name [112,113]. Tourismmarketers can develop competitive differentiation by incorporating websites and social mediabig data in their strategy [114,115]. The following hypotheses were developed to explore the impact of social media and websitebig data on interactivity, user engagement, and digitalbrand name.
Hypothesis 1 (H1).
“Paid Traffic” of tourism enterprises affects the “Social Media Traffic” variable through their “Post Interaction” metric.
This hypothesis studies the effects of paid traffic on social media traffic as well as the effects of interactivity between the users and the tourismsocial media on social media visibility. This hypothesis will provide valuable insights on social media lead generation. Additionally, it is crucial for marketers to identify the effects of paid traffic on the post interaction metric and the corporate social media in total, in order to have a clear view of the intercorrelation of the metrics when creating a digital marketing campaign [116].
Hypothesis 2 (H2).
“Number of Comments” of tourism enterprises affects the “Total reactions on posts” variable through their “Posts per day” metric.
A previous study has revealed that the total reactions to social media posts have a positive impact on user engagement and on social media marketing in general [111]. Hence, the second hypothesis attempts to examine the social media interactivity of tourismenterprises. The holistic interactivity can be revealed with the examination of the number of comments per post, the number of posts per day, and their effects on the total user reaction to those posts.
Hypothesis 3 (H3).
“Social media traffic” of tourism enterprises affects the “Total visits” variable through their “Pages per visits” metric.
After assessing the interactivity of behavioral metrics and their effects on corporate social media, the third hypothesis examines how the effects of social media activity affect the tourism website visibility. This is a crucial hypothesis for multichannel marketing since all platforms (social media and corporate websites) must achieve high visibility in order to produce optimal profitability [10,117].
Hypothesis 4 (H4).
“Social media traffic” of tourism enterprises affects the “Organic traffic” variable through their “Total visits” and “Number of fans” metrics.
As previous studies have revealed, from the logistics industry to tourism, the steady growth of the metric organic traffic is a valid indicator for the growth of the global rank metric [41,69]; it is crucial to research the effects of social media traffic on this metric. Therefore, the fourth hypothesis examines the effects of social media activity and website activity on the website’sorganic traffic. Since the variable organic traffic is calculated from all unpaid sources [68], such as users that type booking.com into a search engine or browser and are not redirected from an advertisement, it has been established as the main precursor of the website’s digital brand name [118].
Hypothesis 5 (H5).
“Average time on site” of tourism enterprises affects the “Global rank” variable through their “Number of likes” and “Pages per visit” metric.
After identifying the effects of social media and website behavioral factors on the organic traffic metric, the fifth hypothesis examines if the digital brand name represented with the global rank metric is affected by the average time spent on the website, the pages viewed per visit, and the number of likes on corporate social media. For marketers, it is crucial to identify if those metrics affect the digital brand name and to what extent in comparison with other industries [105,119] in order to produce an effective digital marketing campaign.
As a result, theseresearch hypotheseshave been developed to comprehensively assessthe main multichannel marketing study. More precisely, tourismenterprises need toidentify and invest in the parameters that affect their social media traffic (H1). Then, it would be useful to explore which parameters of the corporate social media could add value to their website’s interactivity and visibility (H2, H3). Furthermore, it is critical to understand how the above parameters can be optimized to assist the corporate website to climb in search engines and improve its digitalbrand name (H4, H5).
2. Materials and Methods

The authors implement an innovativemethodologyin this researchto assess the effects of multichannel digitalmarketing on tourismenterprises’ digital brand name and user engagement. This approach has been developed because the raw retrieved big data are not impacted from any possible cognitive bias [120]. The methodology is divided into four stages. In the first and second stages, big data were extracted from two web analytics websites over 210 days for 10 tourismenterprises and statistically analyzed. In the third stage, a fuzzy cognitive map was developed to illustrate the cause-and-effect relationships and present the macrolevel approach to optimization [121]. Finally, an agent-based simulation model was developed to present the research’s microlevel approach [121].

2.1. Data Extraction and Statistics

The websites’ behavioral data were extracted from the platform Semrush.com, and the social media big data were extracted from Fanpagekarma.com. The study is limited to Facebook and Instagram since, according to previous research, these are the social media platforms that provide an added value to the corporate digital brand name and profitability [122,123]. The world leading tourism websites that were examined are: Booking.com, Airbnb.com, Trivago.com, Tripadvisor.com, Hoteles.com, Marriott.com, Kayak.com, Edreams.com, Expedia.com, and Agoda.com. Despite the fact that Marriot.com owns more than 30 hotel brands, upon further examination it can be assumed that choosing Marriott.com does not fit among the other type of websites, since it is a single company. This study gathered the top websites based on tourism websites’ ranking and revenue [124,125]. The websites were picked based on purpose. Those sites were selected because they represent a holistic view of the tourism industry and also have corporate social media [124,125]. The authors attempt to identify users’ behaviors and their effects on the digital brand name of the tourism industry in general and not as a role or category, e.g., “accommodation and hotel”, “air travel”, or “attractions” [8,124]. Following datagathering, statistical analysis was conducted, including regression analysis and correlation analysis. Theanalysis offers a thorough view of all the elements and how they interact with each other.

2.2. Fuzzy Cognitive Map and Agent-Based Modeling

The number of correlations between the variables under consideration that were found was used in the development of the fuzzy cognitive map (FCM). TheFCM’s primary goal is to offer a graphical depiction of the positive and negative cause-and-effect relationships between the metrics under consideration [126]. Consequently, those relationships were used in the creation of three multichannel marketing optimization scenarios. These macrolevel scale scenarios can be beneficial for marketers and decision-makers to understand and implement funds allocation effectively in their marketing strategy [121]. Following the development of the macroscale fuzzy cognitive map, a microscale agent-based model (ABM) was created. ABMsproduce simulation and estimation of all thebehavioralelements influencing enterprises’brand name and engagement [121,127,128]. Predictive models are valuable to marketers since they can simulate user behavior, reactions, and engagement for free without spending valuable funds on other traditional marketing techniques [129].

3. Results

3.1. Statistical Analysis

This section illustrates the statistical analysis of the extracted tourism big data, as shown in Table 1.The findings are produced from the big data of10 tourism corporate websites [124,125]. Table 2 and Table 3 present the correlation analysis and regression analysis for the H1.
The (H1) shows a positive correlation with ρ = 0.931 * * between the social media traffic metric and the total paid traffic metric. Furthermore, nonsignificant correlations were found between the social media posts with paid and social media traffic. That finding highlights the importance of paid traffic that was generated from paid advertisements placed in search engines such as Google, which provides an added value to the visibility of corporate social media. On the other hand, there is no indicator that post interaction plays any crucial role in social media traffic or on paid traffic and vice versa. The regression model for the first hypothesis (H1) is presented in Table 4. Regression analyses can be identified as significant with p-values of less than 0.05. In this nonsignificant regression, for every 1% rise in social media traffic, the paid traffic increases by 93.1% and the post interaction decreases by 6.8%. Since the p-value is more than 0.05, the (H1) is rejected.
Table 4 and Table 5 present the correlation analysis and regression analysis for the H2.
The (H2) shows multiple positive correlations with ρ = 0.573 * * and ρ = 0.471 * * between the total reactions on posts metric with the number of comments and posts per day. Such interactivity is commonly shown in social media influencers while providing “giveaways” [130] which directly produce electronic word of mouth (e-WOM) [131,132]. Furthermore, significant correlation was observed between the number of comments and posts per day, with ρ = 0.784 * * . That finding highlights the importance of provoking social media interactivity with stories, posts, reactions, and likes. The regression model for the first hypothesis (H2) is presented in Table 6. Regression analyses can be identified as significant with p-values of less than 0.05. In this regression, for every 1% rise in total reactions on posts, the number of comments and post per day increase by 52.8%, and 5.7%, respectively. Since the p-value is less than 0.05, the (H2) is accepted.
Table 6 and Table 7 present the correlation analysis and regression analysis for the H3.
The (H3) shows positive correlations with ρ = 0.889 * * and ρ = 0.353 * * between the websites’ total visits metric and the social media traffic and pages per visits metrics, respectively. Furthermore, nonsignificant correlations have been found between the social media traffic with the websites’ pages per visits with. That finding illustrates the crucial positive effect that the social media traffic and interactivity have on the corporate website visibility. On the other hand, as expected, there is no significant connection between pages per visits and social media traffic. The regression model for the first hypothesis (H3) is presented in Table 8. Regression analyses can be identified as significant with p-values of less than 0.05. In this regression, for every 1% rise in total visits, the social media traffic increases by 89.6%, and the pages per visit decreases by 1.7%. The H3 is accepted because the p-value of the constant variable is <0.05.
Table 8 and Table 9 present the correlation analysis and regression analysis for the H4.
The (H4) shows positive correlations with ρ = 0.628 * * and ρ = 0.859 * * , respectively, between the website’s organic traffic and the social media traffic and pages per visit. Additionally, and interestingly, nonsignificant correlations have been found between the organic traffic and the number of fans on social media. Those findings highlight the important effect of social media visibility on the corporate website, but that does not mean that the rise of followers on social media provides an added value to the corporate website visibility. More specifically, nonsignificant correlations can be observed between the number of fans, the social media traffic, and the total social media traffic. Finally, a significant correlation can be identified between the social media traffic and the total visits, with ρ = 0.889 * * , which highlights the importance of investing in social media in order to raise the corporate website visibility. Theregression model for the first hypothesis (H4) is presented in Table 10. Regression analyses can be identified as significant, with p-values of less than 0.05; therefore, the H4 is accepted. More specifically, in this regression, for every 1% rise in organic traffic, the social media traffic increases by 65.7%, the total visits increases by 44.3%, and the number of fans increases by 6%.
Table 10 and Table 11 present the correlation analysis and regression analysis for the H5.
The (H5) shows significant negative correlations, with ρ = 0.483 * * and ρ = 0.424 * * , between the global rank and the average time on site, and the pages per visits metrics, respectively. This is an interesting result since it illustrates that the behavioral metrics affect the digital brand name and improve the tourism websites’ global rank. It is an improvement because if a website ranks in the 2nd place, it is better than the 14th. Furthermore, it can be observed that the number of likes does not play a crucial role on average time on site and pages per visit, but it plays an important role on global ranking, with ρ = 0.241 * . Additionally, a significant correlation can be identified between the website behavioral factors’ average time on site and pages per visit, with ρ = 0.542 * * . The regression model for the first hypothesis (H5) is presented in Table 11 In this regression, for every 1% rise in global rank, the average time on site decreases by 34.5%, the pages per visit decreases by 24.8%, and the number of likes increases by 17.1%. Regression analyses can be identified as significant with p-values of less than 0.05, and the H5 is accepted since p< 0.001.

3.2. Creation of Macromodel FCM and Optimization Scenarios

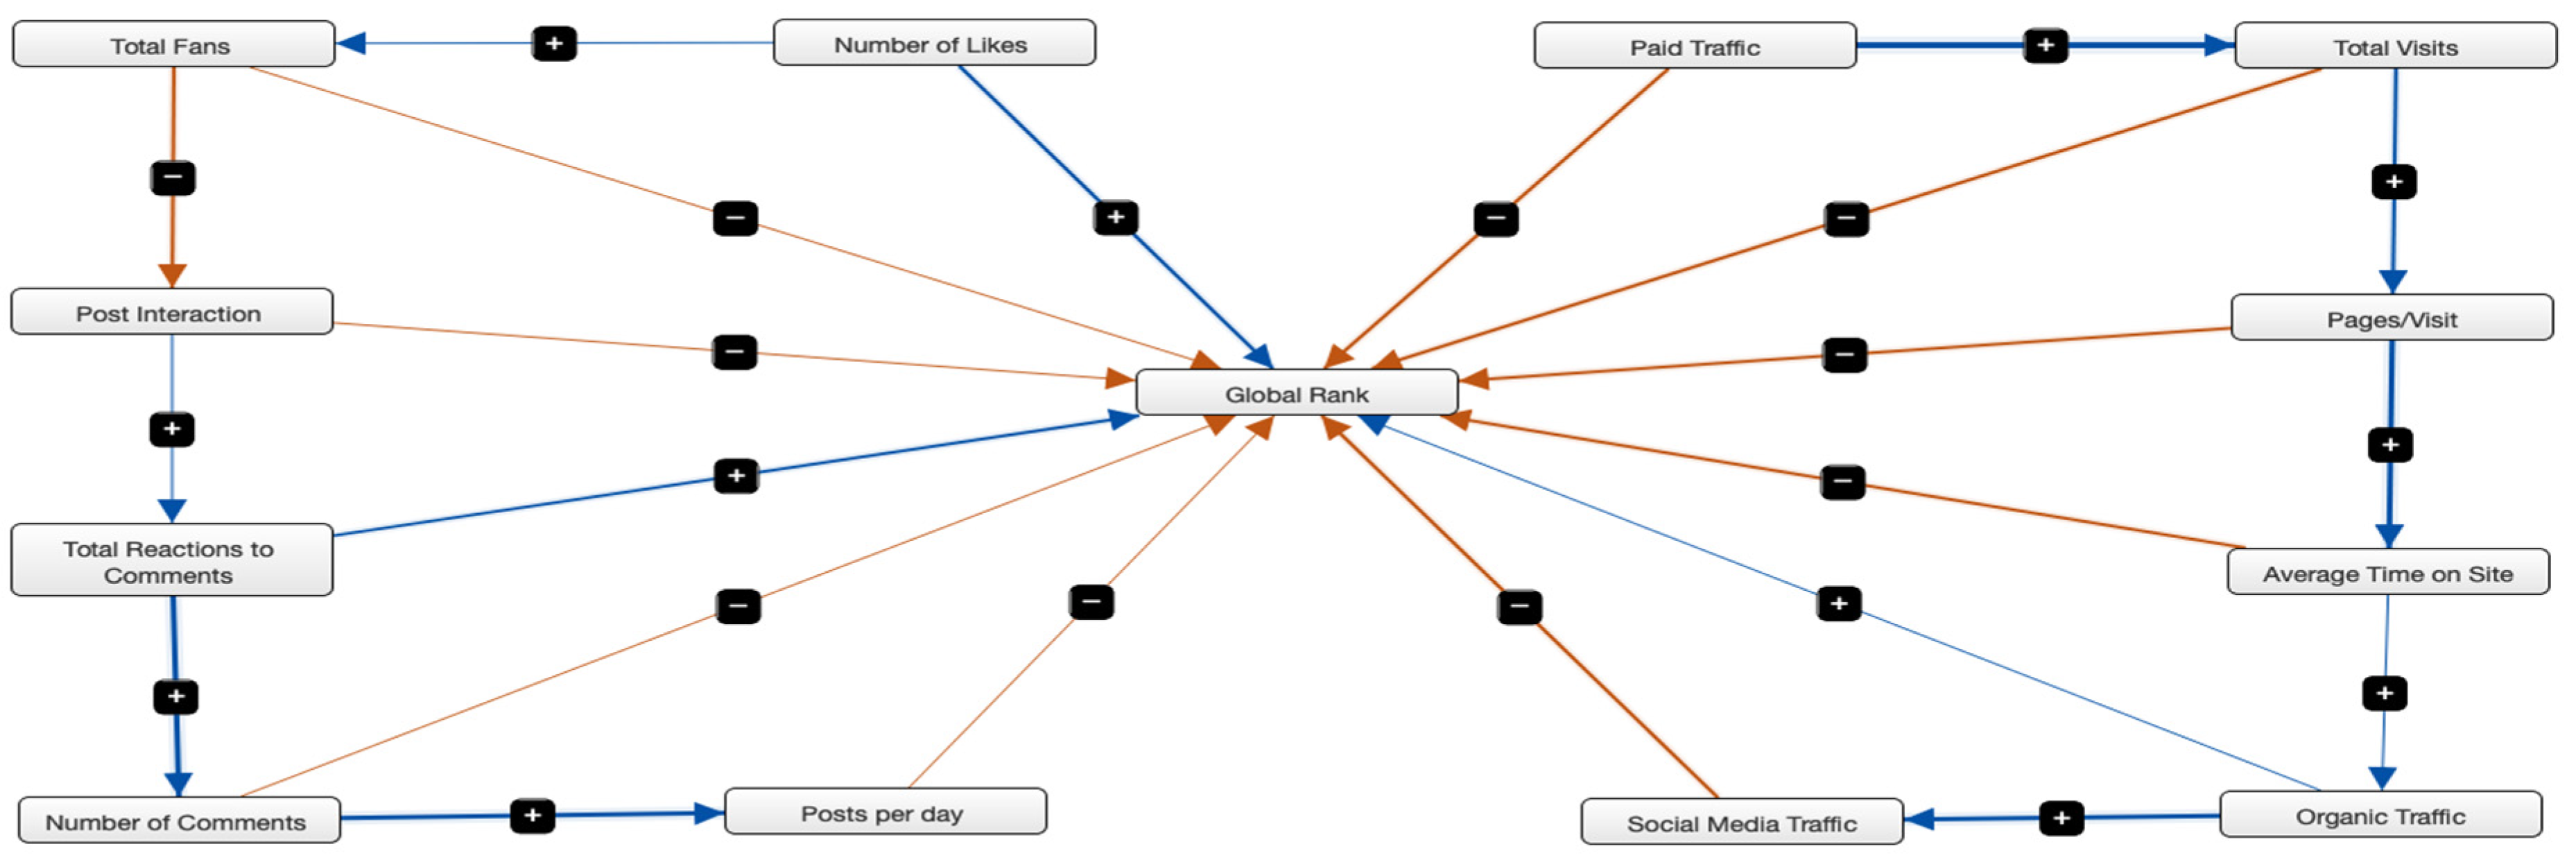
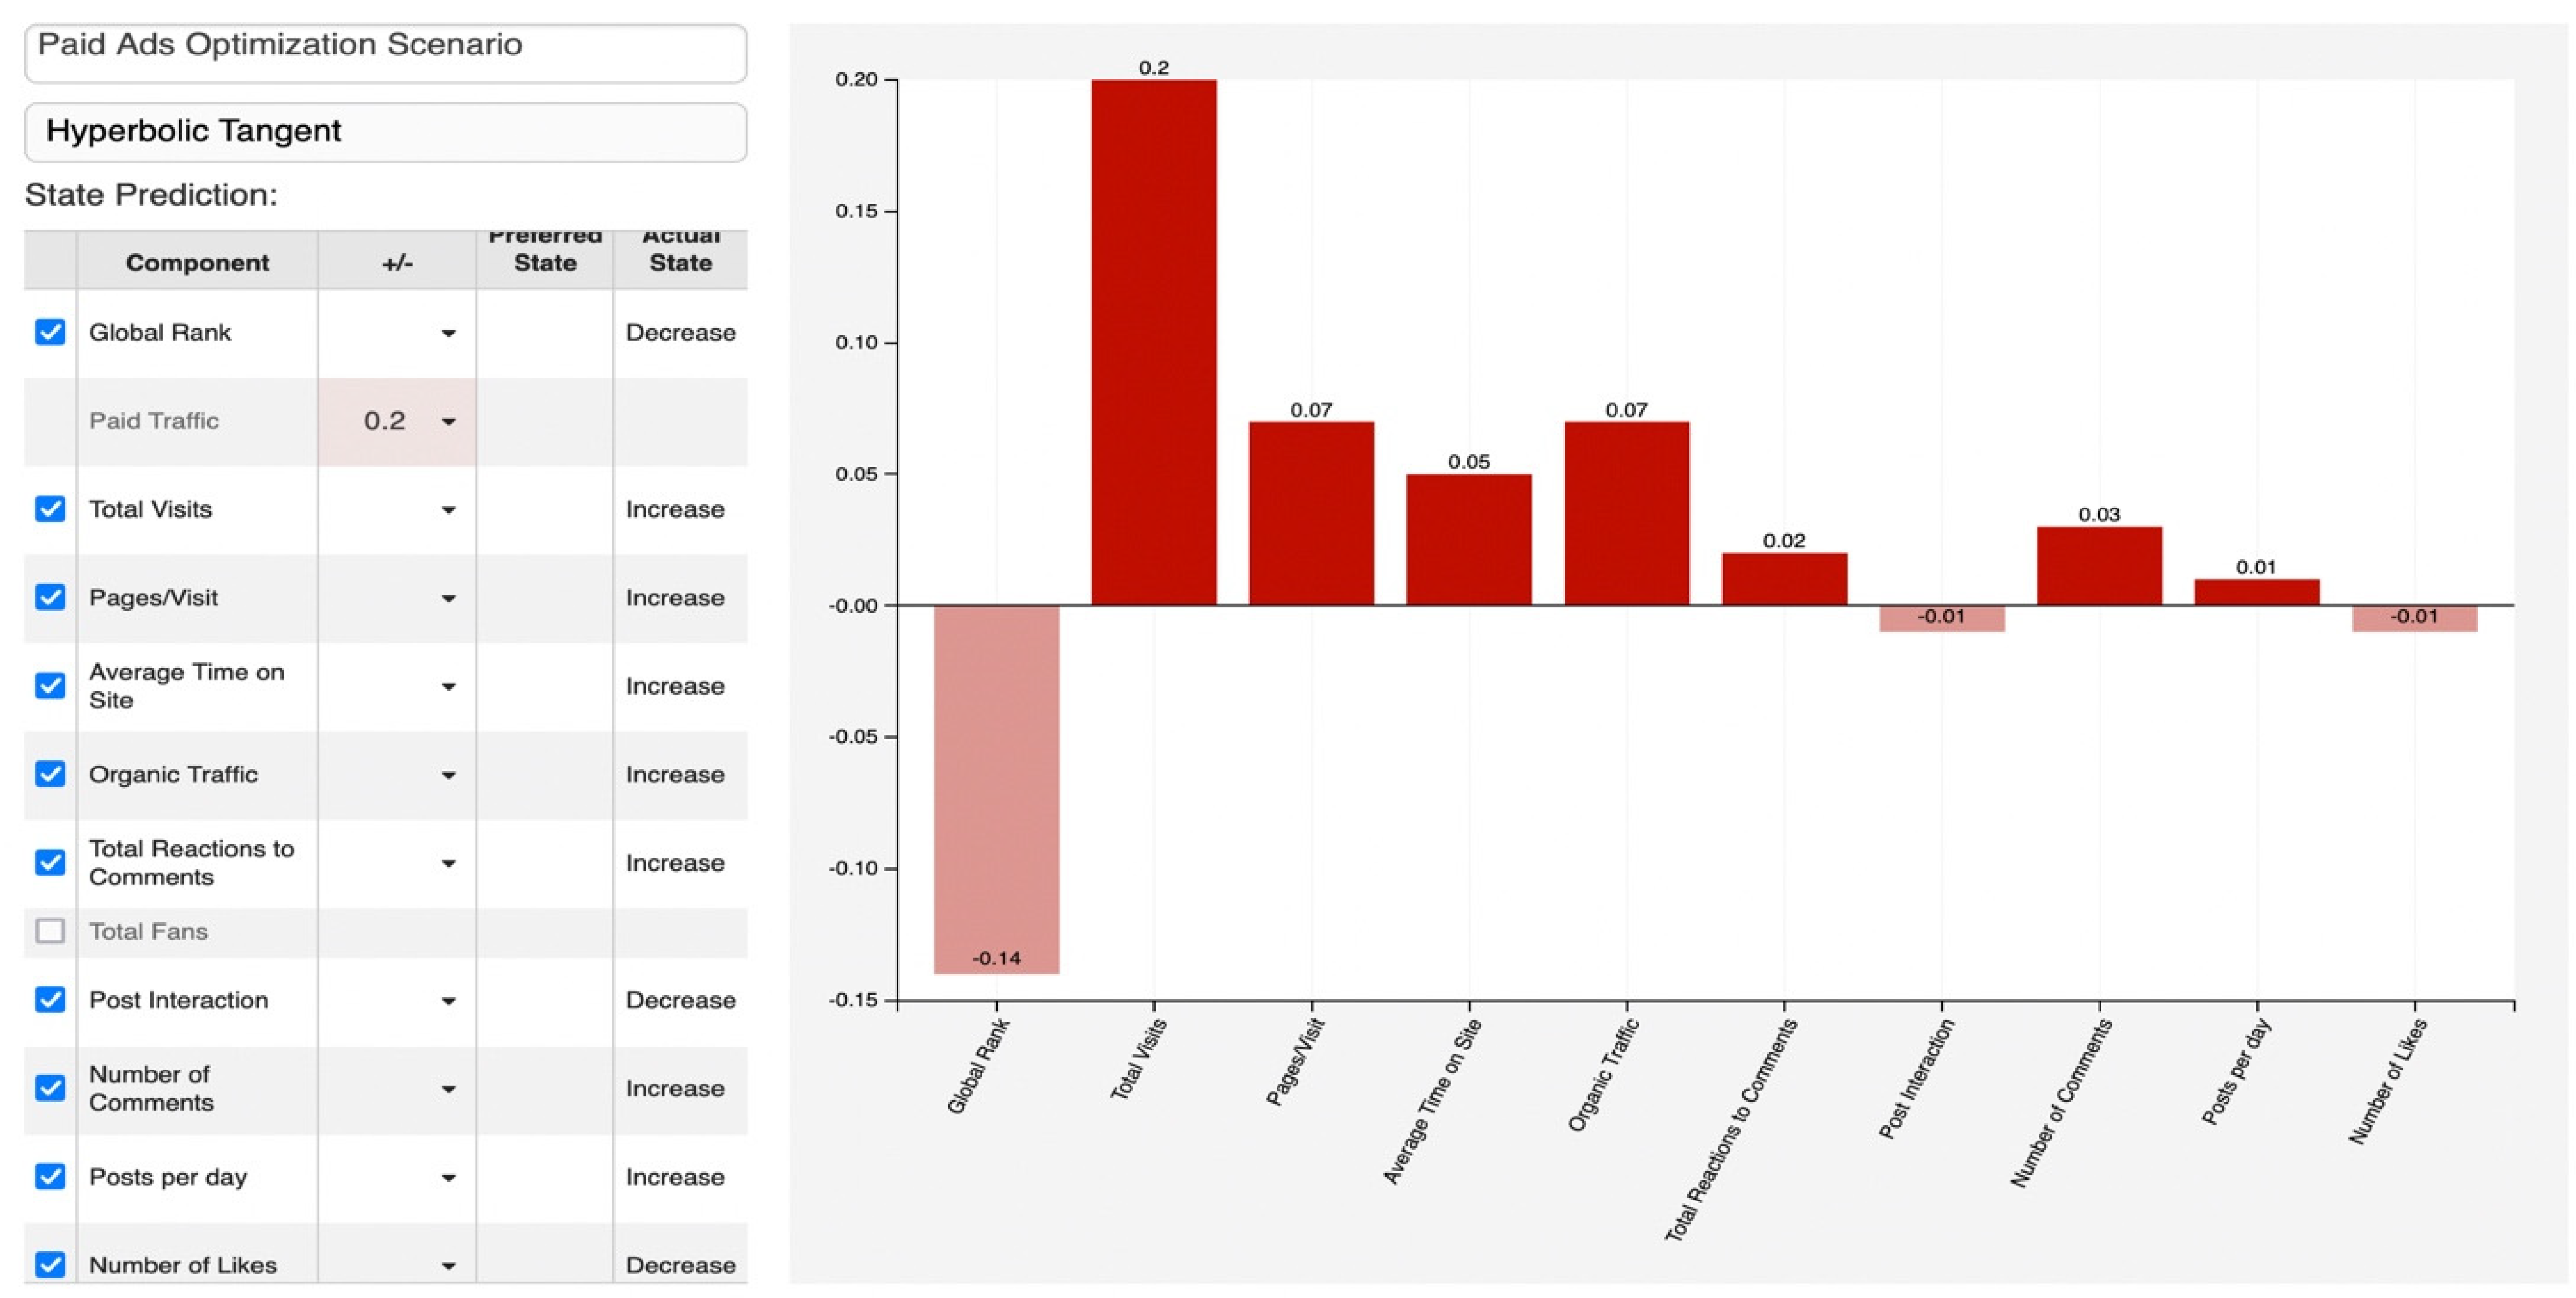
The FCM was created using the statistical analyses described above. An FCM displays the basic characteristics of a system as well as the strength of connections (−1,1) between the parameters [121]. This capability is critical for marketersbecause big data are unstructured data, and their illustration of the cause-and-effect links of a system on a map is particularly valuable for the development of a marketing strategy [133,134]. Figure 1 depicts the fuzzy cognitive map, where the stronger the connection, the larger the line. The standardization of the process and the incorporation of the statistical results to the FCM is crucial for the formulation and analysis of the model. The first step includes the “Clarification of objectives” [135,136].In our case, the first step is the creation of three scenarios in order to provide a direct effect to tourism companies’ decision-making by optimizing paid advertisements, social media interactivity, and digital brand name. The next steps include the “Sources” and “Calibration” of the model [135,136]. In this study, the next step came from the statistical analysis in Section 3.1, and, more specifically, the statistical correlations which have been used to illustrate the interconnections. Finally, for the “Interpretation” [135,136] of the results, the hyperbolic tangent was used in order to have a clearer presentation of the scenarios [137]. This approach, the incorporation of statistical analysis in the FCM, was utilized in this article since it has been widely included in previous research for providing static results of various metrics to the desired variables of a study [121,136].

Creation of FCM Optimization Scenarios

Theoptimization scenarios were conducted to analyze the projected fluctuations in the web analytics’ KPIs at various stages of user engagement and interactivityon the tourismwebsite and social media, assisting the FCM model’s progress. The hyperbolic tangent was used in all situations since it displays values that are positive and negativeand exist within the range (−1, 1) [136]. The scenariosare depicted in Figure 2, Figure 3 and Figure 4. Figure 2 illustrates the paid traffic optimization scenario. In this case, when the tourism website invests in paid traffic by placing 20% more, the website’s digital brand name will improve by 14%, and the website’s organic traffic will by 7%. This is expected since paid advertisements in search engines, such as Google, have beneficial effects on the tourism sector, but they do not affect the social media interactivity, as can be observed in Figure 2 [138,139].
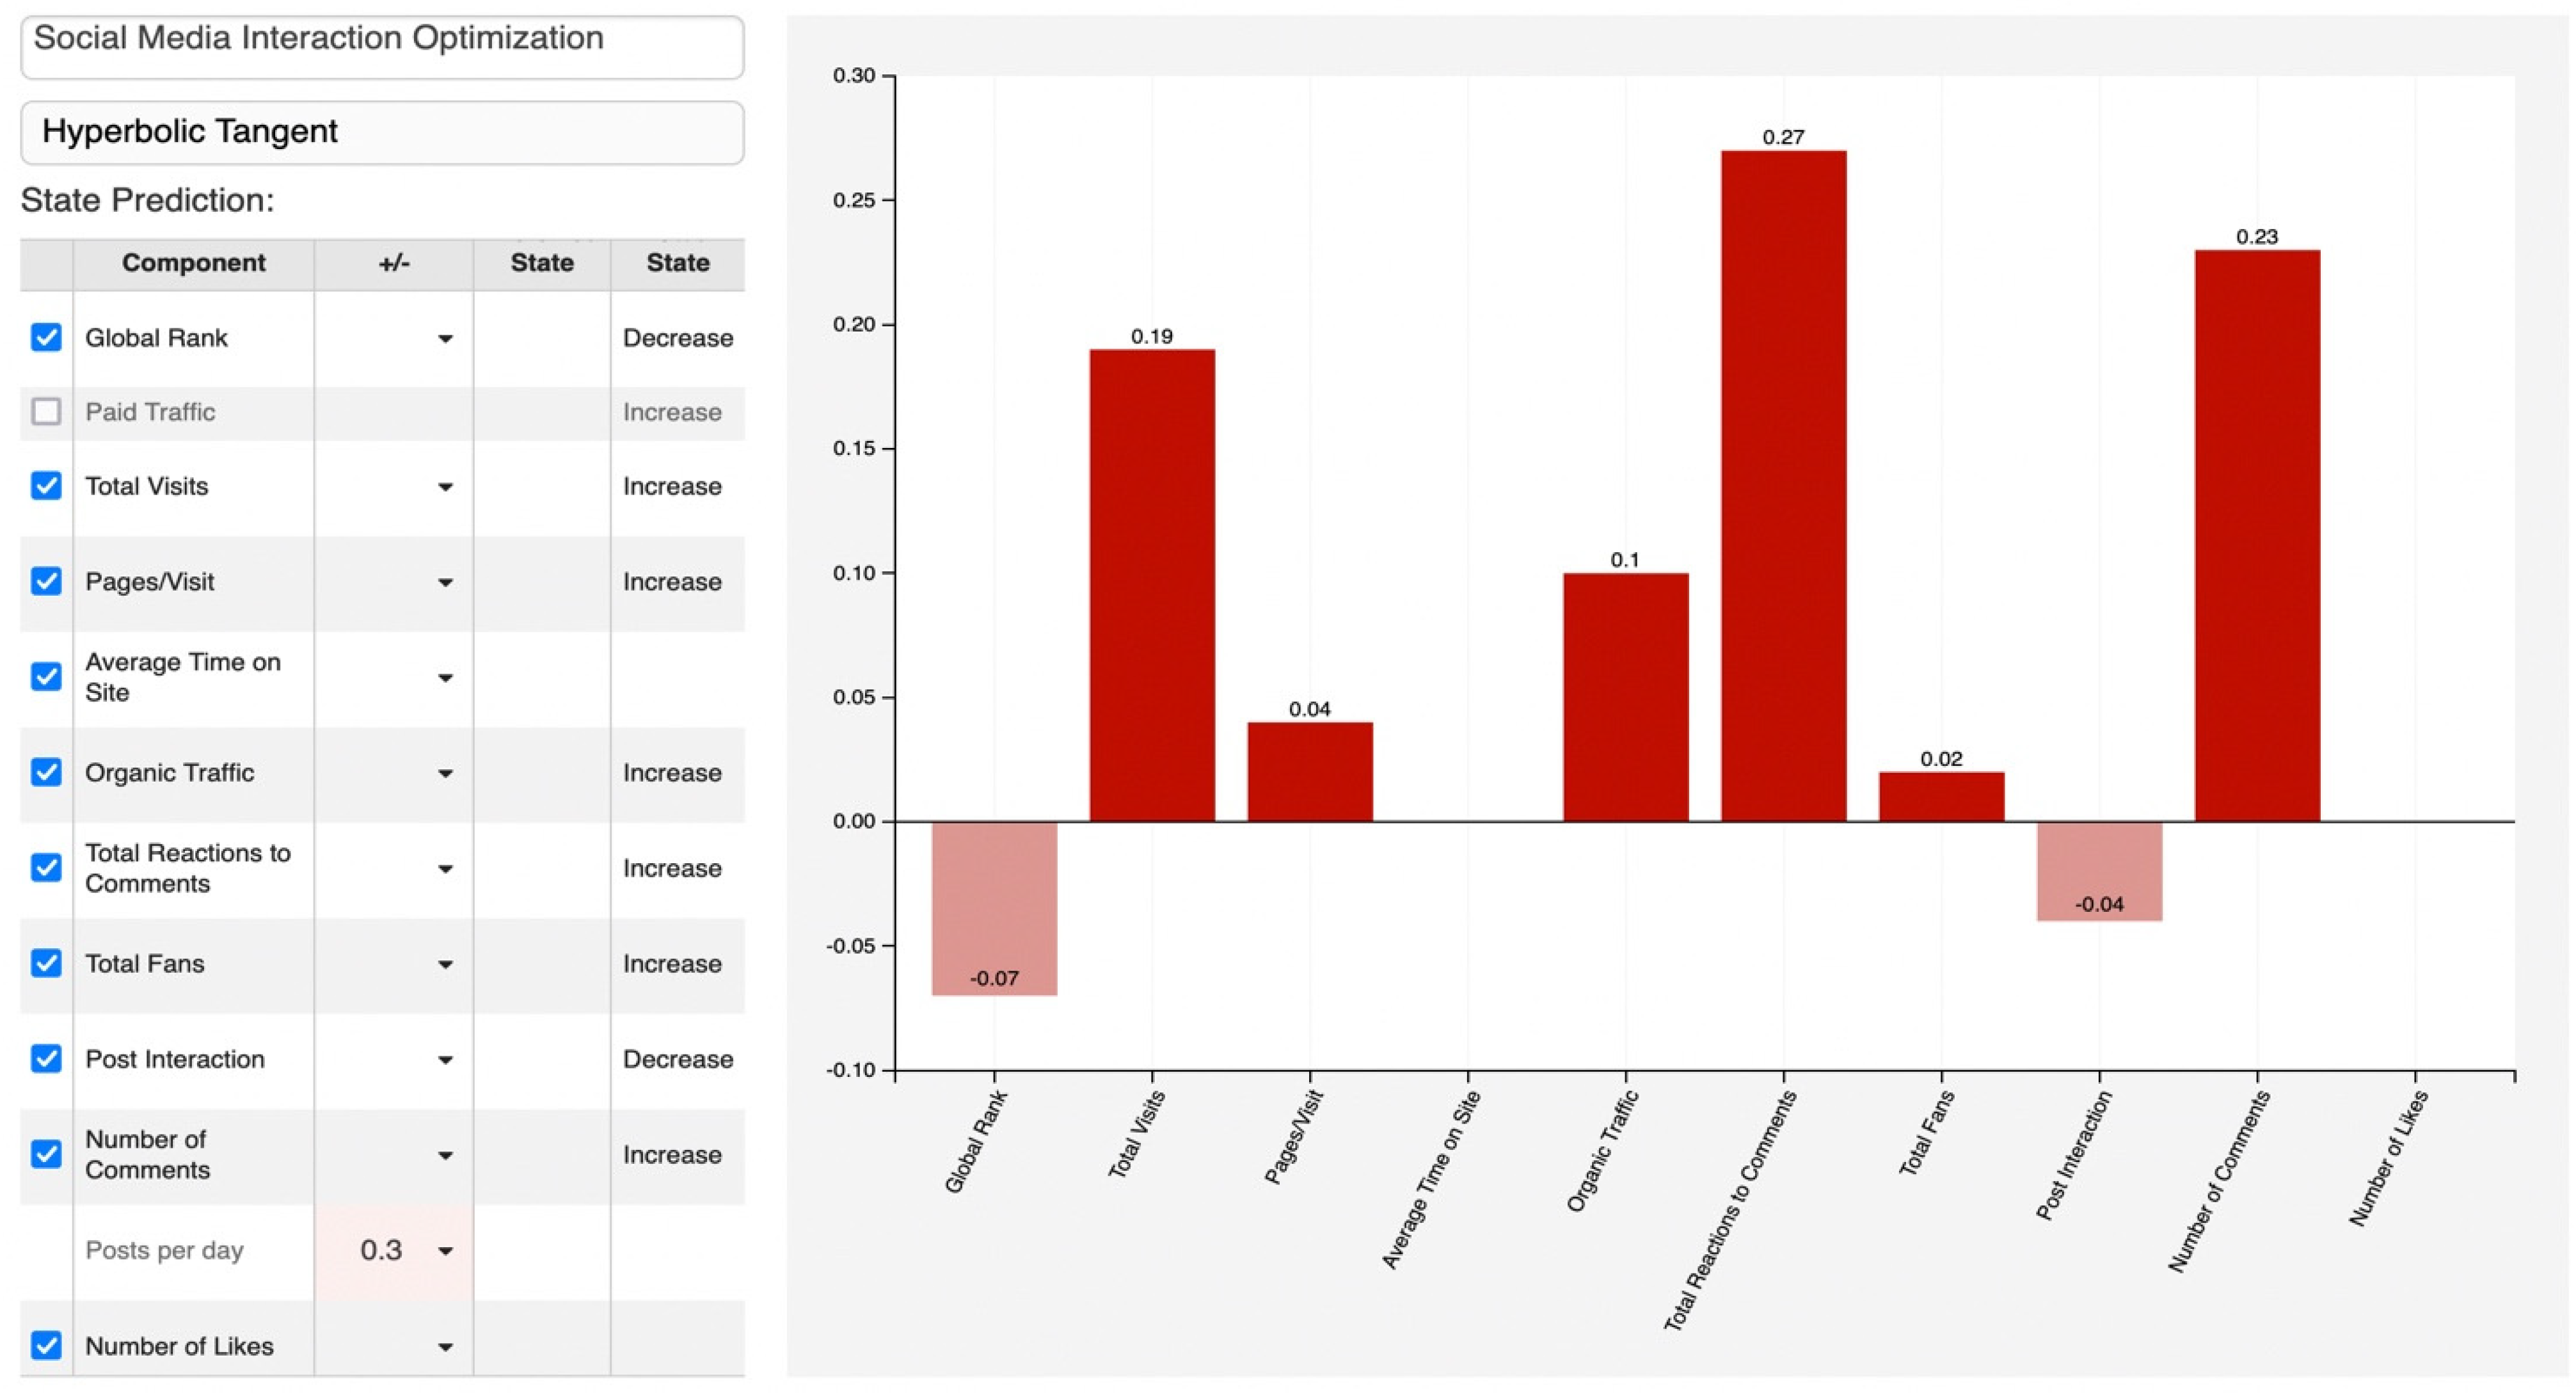
Figure 3 illustrates the social media interactivity optimization scenario. As can be observed, if the tourism enterprise creates more posts on social media by 30% daily, the digital brand name will increase by 7%, the website visibility will increase by 19%, and the organic traffic by 10%. This finding is fully aligned with previous research [140,141].
Figure 4 depicts the digital brand name optimization scenario. In this case, if the tourism companies wish to increase the digital brand name by 20%, they must invest in paid traffic by 31%. Additionally, it can be observed that the pages per visit metric and average time on site will also increase, which is in complete contradiction to logistics websites [10,142]. This can be explained since someone wants to book an apartment for vacation enjoys the time that they spend on the request, which is in contradiction with someone trying to search for a parcel.

3.3. Creation of the Agent-Based Model

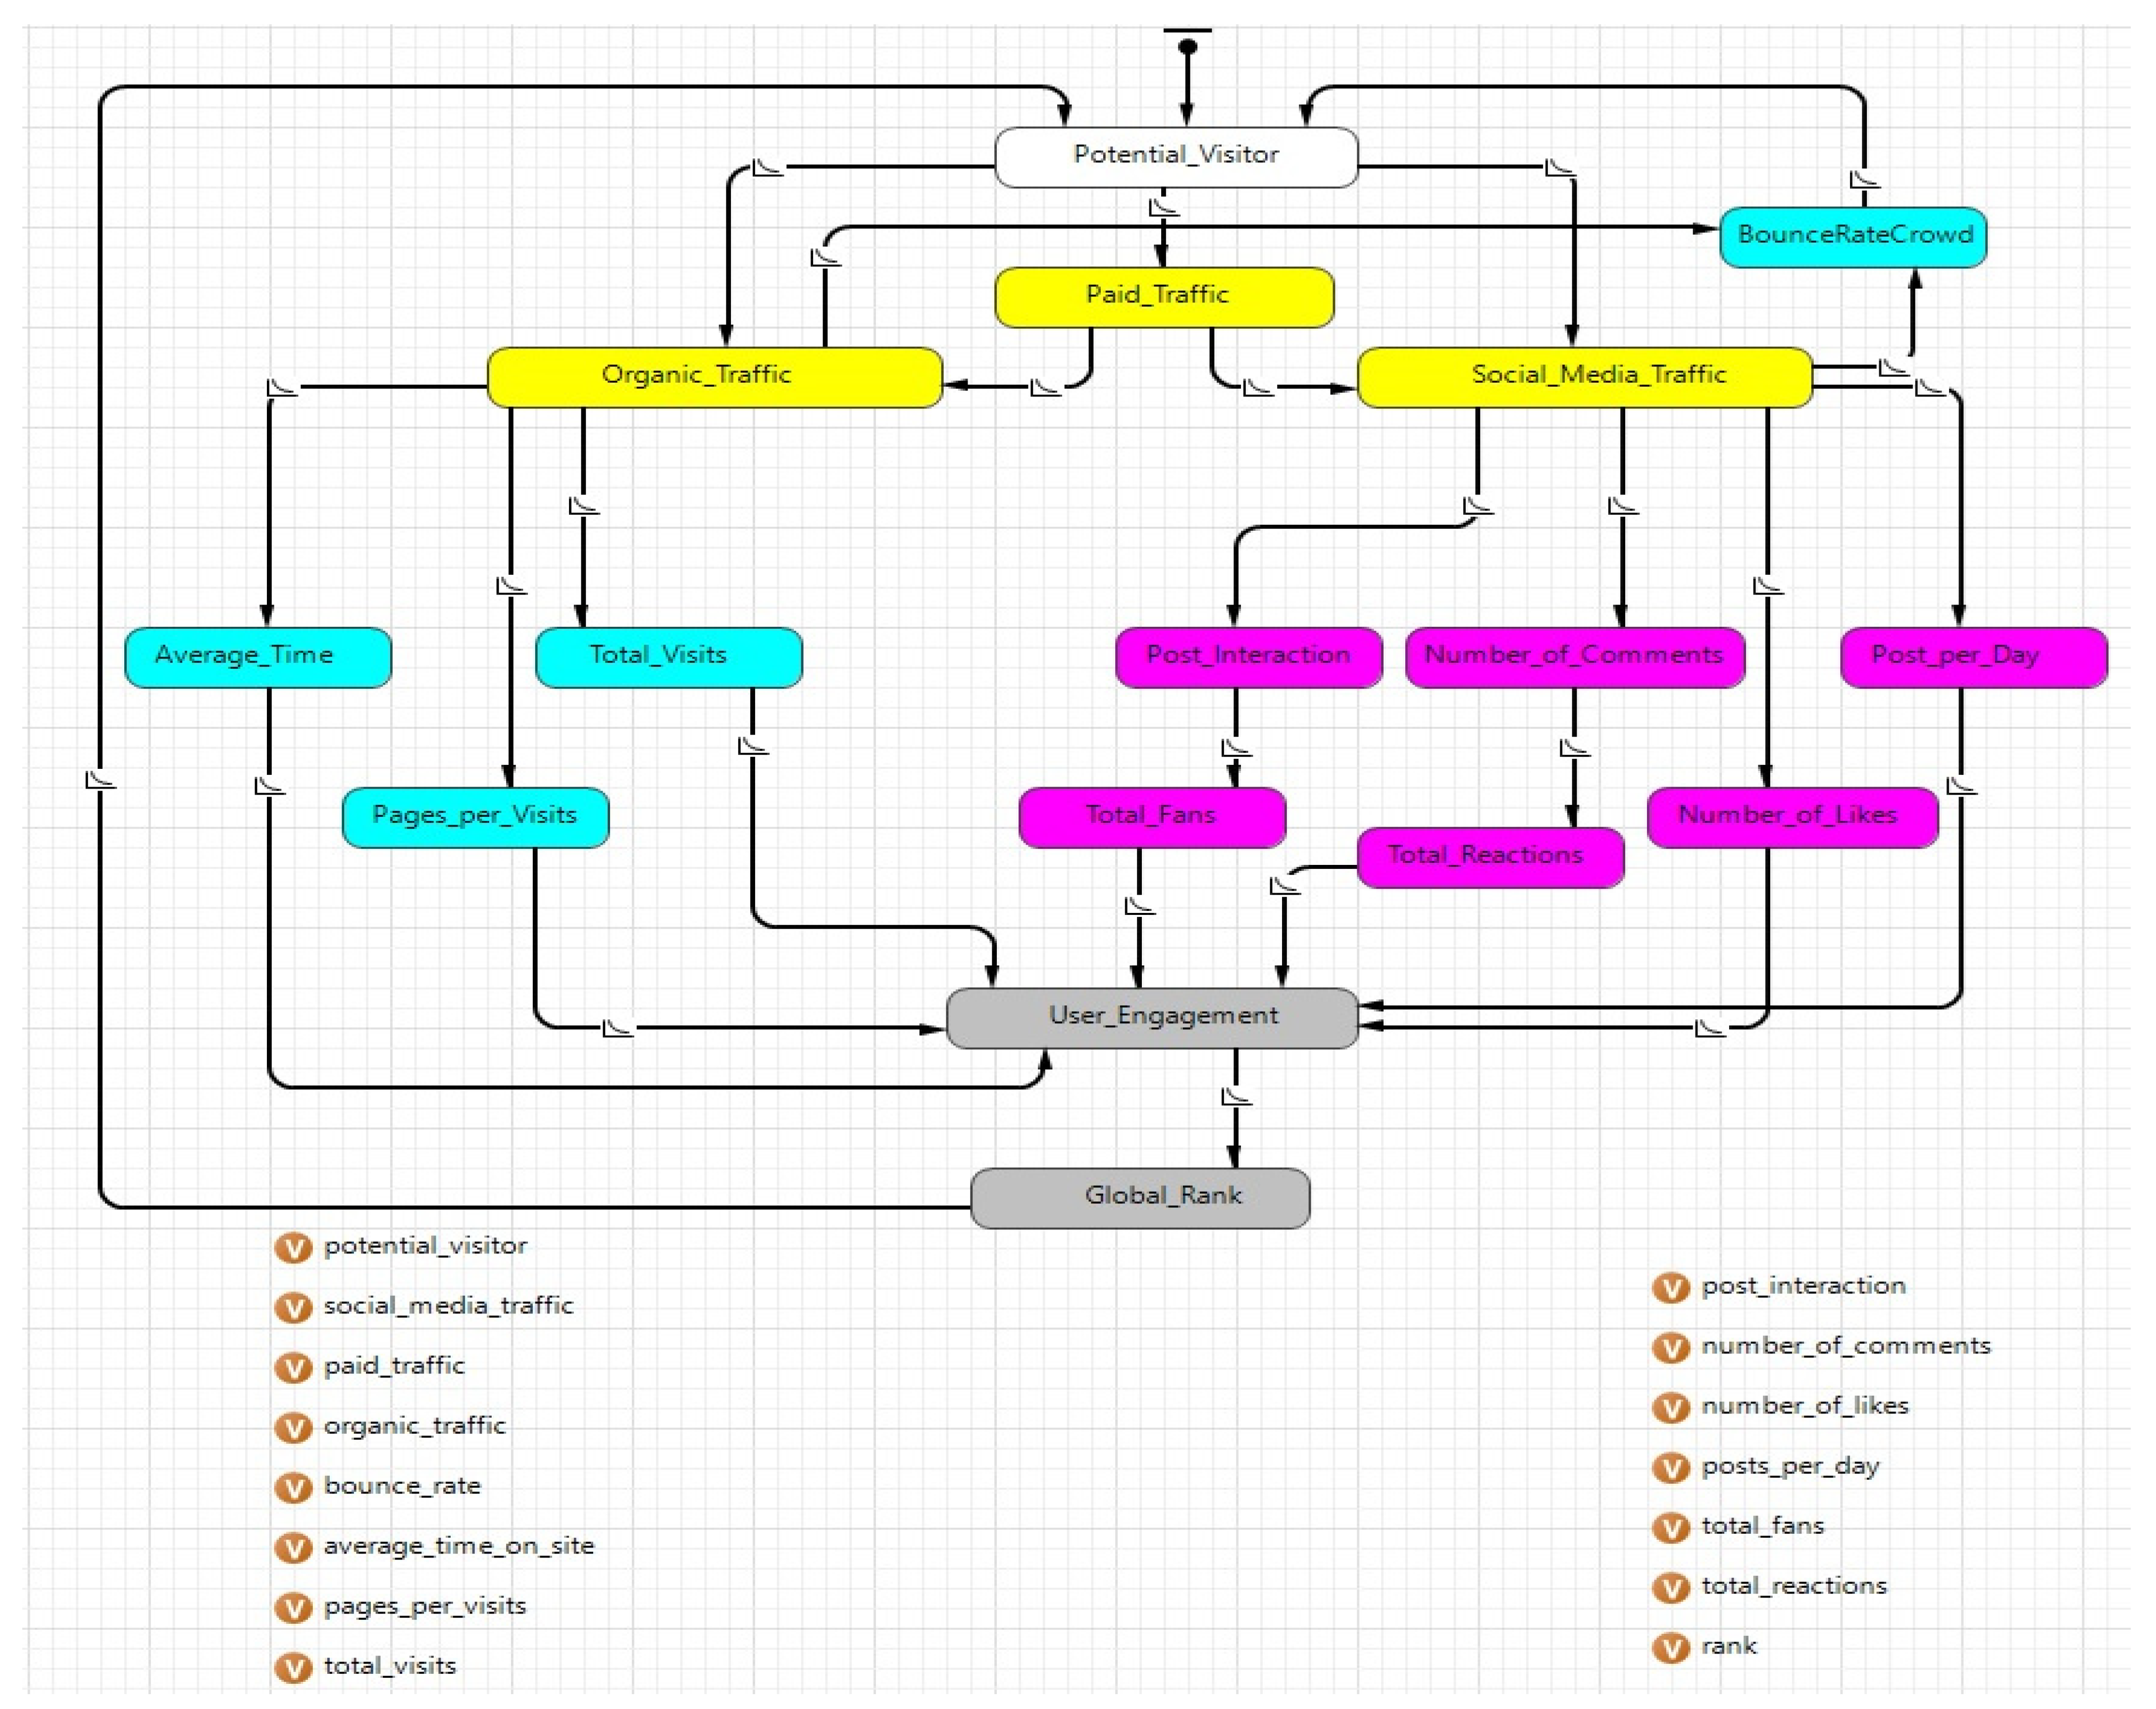
To produce a microscaleexaminationof the topic, an ABMwas developed [121]. The ABM is a well-researched, widely used method whichcan assist researchers in comprehending and analyzing the patterns of customer behavior [143].The ABMcan encompasstraits that are challenging to include in conventional models [121,143]. ABM is most usefulwhen the system’s behavior can be predicted by writing down the rules of behavior at the microscale [121]. The main advantage of utilizing an ABM technique in marketing is that the behaviors of businesses and customers inside the ABMmay be built on solid ideas of behavior, butsimultaneously, the findings can be evaluated against real data, and the ABMcan then be used to produce behavioral predictions based on historical data [144]. Its application benefits marketers because ABMssimulate real-world scenariosand assess customers’behavioral patterns in order to extract relevant decision-making strategies. One of the main differences between the FCM and ABM is the ability of the ABM to present the behavioral changes on a time scale [121,143]. Additionally, the usage of agent-based models allows organizations to fully comprehend the insights provided by big data in terms of user interaction with their websites, as well as chances for growth [143,145]. The ABMrepresents the typical behavior of a client who visits tourismwebsites and social media. The white box, in particular, depicts an agent’s beginning position, named “Potential Visitor”. The complete model was created using the Anylogic 8.7.12 software. The Poisson distribution was chosen for this model since it allows the implementation of thestatistical analysis [146,147], asdescribed in Section 3.1.
The model mimics all operations, beginning with how a consumer interacts with the enterprise in three main ways. Firstly, the visitor canenter the website by searching the name on Google or because he remembers it (organic traffic). Secondly, the visitor can redirect to the corporate website from paid traffic (e.g., google ads), and finally, the visitor can access the corporate website through social media links or advertisements. Continuously, the website’s behavioral factors are generated from the users’ activity in it and represented with light blue color on the left-hand side of the model. On the right-hand side with pink color, the behavioral factors of the social media can be observed. Those factors are summed in the total user engagement parameter (gray color), which leads to the development of the websites’ global ranking. The variables (V) at the bottom of Figure 5 represent changes to the required circumstances that generate movement between the blocks, which is shown on the agent-based modelwitharrows.
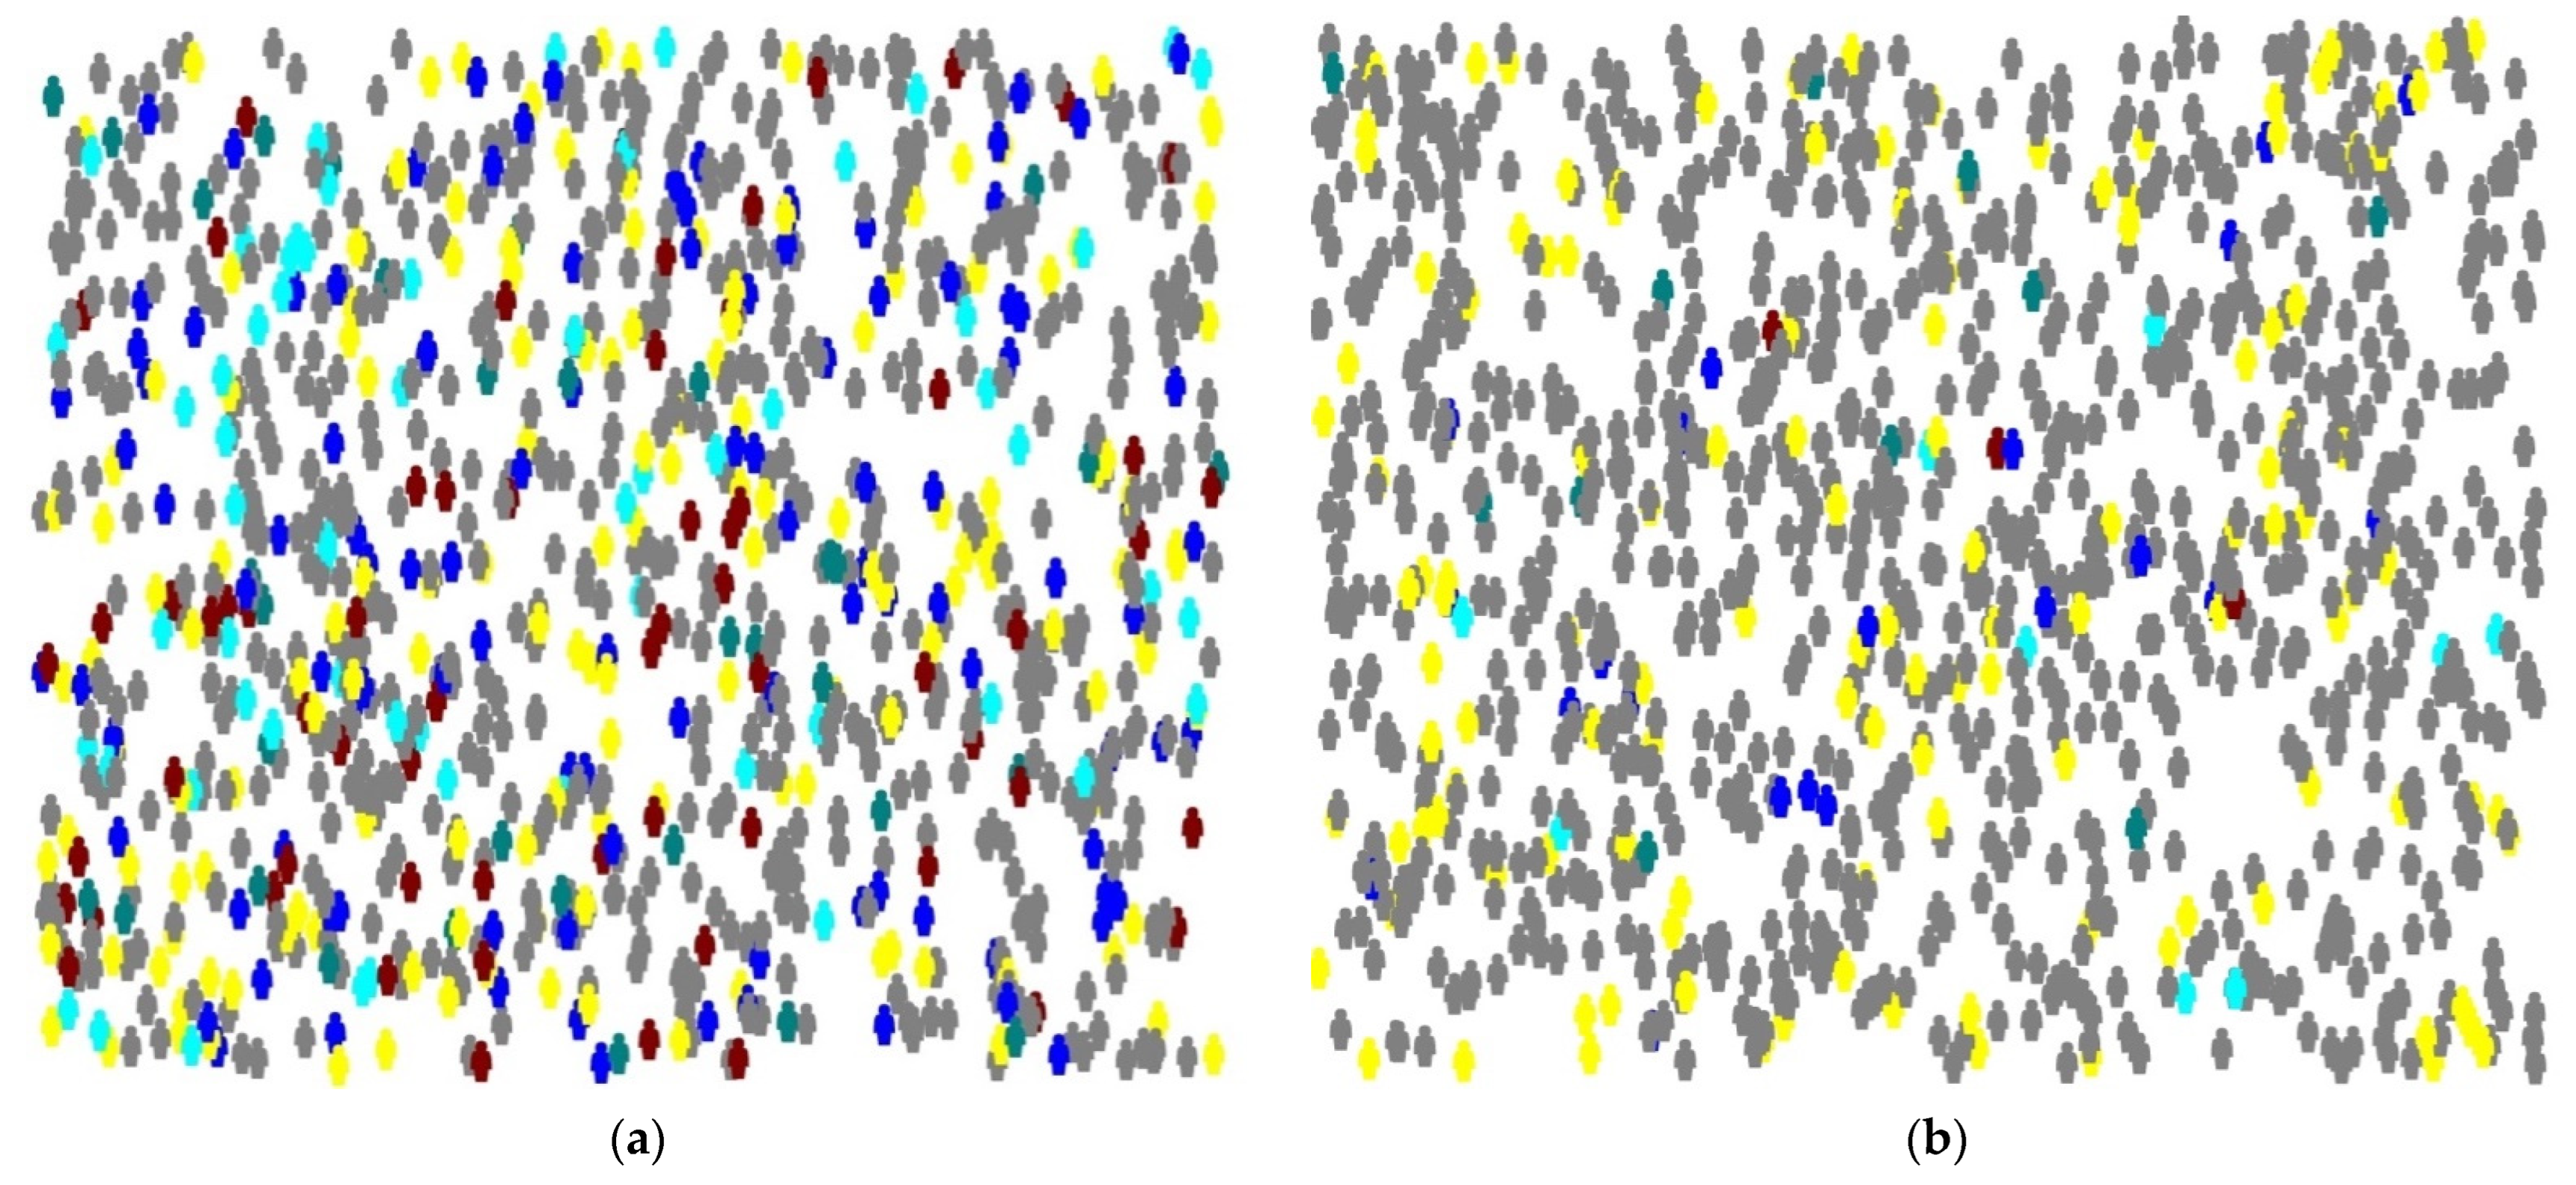
Figure 6 illustrates the predictive model population distribution over a six-month period. On the left-hand side of Figure 6a, the 20th dayof the model can be observed, and on the right-hand side of Figure 6b, the 170 days of the predictive model can be identified. The blue agents represent the website’s behavioral factors, the red represents the paid traffic, the light blue the social media factors, the yellow represents the organic traffic, and the gray represents the global ranking. As can be observed, on the right-hand side and after 170 days, the gray and yellow agents are more than the day 20, which illustrates the rise of website traffic and ranking, which leads to the rise of the digital brand name.
In Figure 7 and Figure 8, the time charts illustrate the history of the contribution of the examined metrics over six months [148]. More specifically, in Figure 7 a paid traffic boost can be identified by the advertisement that was placed on day 0. This had a big impact on social media traffic, which lasted up to day 55. Then, a second one was placed, from day 55 to day 73, which provoked a positive reaction on the tourism social media that finished on day 117. The final paid traffic boosts in advertisements were placed on days 117 to 127, provoking a bigger reaction with less cost than the one before. That finding illustrates that a digital brand name has already been created, so there was no need for more advertisements that last longer in contradiction to startups that need a steady stream of advertisements to increase their digital brand name [149,150,151].
In Figure 8, it can be observed that the growth of paid traffic from the placement of an advertisement at the beginning of the model on day 0 created an interesting impact on the website’s organic traffic but did not crucially affect the global rank. Major changes can be observed after the second placement on day 55, which created a boost in organic traffic and global ranking. That can safely lead to the assumption that a digital brand name has been created [10,30,32].

4. Discussion

The chaos and uncertainty caused by COVID-19 requests hospitality businesses to respond effectively, or immediately pivot, through social media marketing [152]. Especially for businesses in hibernation, social media advertising plays a key role in customers’ engagement levels and brand establishment [153]. However, using social media as a marketing channel creates content shock, with loads of information being produced every single minute, from publishing links, photos, and videos to performing contests and polls. Either way, the question is the same:among this vaguely structured chaos, how could travel and tourism business survive in such a demanding era? The purpose of the present study is to provide a deep understanding on the role of social media advertising as part of multichannel marketing strategy to brand optimization. It offers fruitful information on how to overcome the overwhelming noise of social media, focusing on gaining a competitive advantage. Specifically, it raises questions on how new technologies could contribute to the advancement of digital marketing activities within the tourism sector, and how consumers could process digital advertising messages.
Since the (H1) is rejected from the statistical analysis, the investments on paid traffic through digital advertisements produce imperceptible results to social media traffic, which is in contradiction with previous research [111,141]. The amount of money and the placement gaps are different from other industries, and this has to do with the seasonality of the tourism industry [154,155]. The results of the second hypothesis (H2) suggest that the high social media interactivity is beneficial for tourism enterprises since it boosts e-WOM [131,132] and could benefit from the social media influencers through “giveaways” [135].
The third hypothesis (H3) suggests that it is beneficial for tourism websites to maintain the customer’s attention as much as they can on their website because it increases their visibility [156,157], which is in contradiction to other industries’ websites, such as logistics websites in which the customer wants to complete their inquiry as fast as possible and exit the webpage [10]. A suggestion for developers to maximize the time that users spend on the website is the use of AI chatbots in order to promote interactivity with the website [158]. Furthermore, predictive and targeted content could be incorporated, depending on the responses of the chatbot, in order to produce a hypertargeted offer to the user or to sell an extra service before the user’s arrival at the destination [159]. Finally, the fourth (H4) and fifth hypotheses (H5) are fully supported by previous research and illustrate the important effects of the website and social media interactivity on the development of digital brand name [30,32]. The agent-based model additionally provided a more detailed explanation of the paid traffic in correlation to the time.

5. Conclusions

5.1. Theoretical Implications

Having big data as the starting point for acknowledging customers’ online behavioral attitude, the hospitality industry is able to redefine online marketing activities. To this end, the current research has designed a precise methodology, containing pioneering context, pertaining to digital marketing activities as the foundation of brand establishment. The research has focused on 10 top hospitality organizations. The outcomes clearly demonstrate the efficiency of social media advertising for companies aiming at building social interactivity and traffic. The examination of the most important KPI’s, total fans, post interactions, and posts per day, among others, provide a 360-degree view on online users’ behavior. Given these shifting trends, it is helpful for all industry stakeholders to maintain a deep understanding of the market they serve by focusing on the followings:
(a)
Hypertargeted advertisements: It is evident that the future of digital advertising lies in the development of hypertargeted advertisements [160]. Providing the feeling of “one in a million”, hospitality marketers can deliver personalized messages to the targeted audience, based on their behavior, and receive valuable feedback. While it is true that the audience is smaller, the results of conversion rates are higher, since they improve advertising relevance. Personalized advertising has been less explored withing the HTT domain, with most research focusing on personalized services [161,162]. Lately, there has been a slight tendency for academic research to deal with personalization and advertising withing the HTT sector [163,164], a fact that indicates that personalized advertising is a promising trend within the HTT domain, with manyresearch extensions. Personalization is the future of digital advertising and the common denominator of every digital marketing activity in favor of higher conversion rates and brand awareness. The HTT sector needs to invest in hypertargeted advertisements, and not just continuously bombard consumers with over-the-top ads, with the use of market segmentation via online reviews [165].
(b)
User-generated content (UGC): The traditional strategy of pushing massive marketing messaged to all no longer drives clicks. The key to tourism business success lies in the development of user-friendly technology that urges users to post reviews and ratings on social media, building in this way trust and brand empowerment [166]. This is where a new opportunity arises: HTT businesses should use social media as an engagement channel for personalized advertisements. However, in order to be seen or heard on such online platforms, there is an urgent need to re-evaluate the content in the first place. The shift toward sustainable digital advertising is increasingly under the scope. If the ultimate goal of hospitality companies is generating more targeted traffic, then showcasing the company’s sustainable personality is of the essence [167]. However, it is not only the content that matters, but also the way that this brand-specific content is created and published on social media. Travelers perceive UGC as an empowerment factor that shapes their travel planning [168]. Displaying authentic user-generated content by customers and/or brand evangelists is able to influence engagement, increase conversion rates, and act as a form of modern e-word-of-mouth communication [169].
(c)
Artificial Intelligence (AI) in digital advertising: With an eye to deliver top-notch services, the hospitality industry needs to enhance customer experience. Top-notch services start by understanding the customer journey across all touchpoints and profiling guests. The statistical analysis demonstrates that digital branding and social media interaction are closely associated and interdependent variables. Interactions happen through “likes”, “shares”, and “posts”; however, in order to achieve higher levels of customer satisfaction, boost retention rates, and drive sales, personalizing services through automation and big data is the key to unlock business potential.The HTT providers heavily rely on AI-powered tools, such as chatbots, virtual reality, and language translators, to boost the user experience [158]. AI is revolutionizing the hotel industry since it takes personalization one step further by actually detecting patterns in data and forecasting behavioral attitudes [38].
Customers’ preferences are constantly changing, raising concerns on the future of digital advertising within the hospitality sector. Social media has transformed the decision-making process of travelers by choosing their travel services based on social sharing, reviews, and ratings, which in turn manipulates the HTT companies’ reputation [3,60]. More travelers are using social platforms such as Facebook, Instagram, and YouTube as search engines, making social media advertising an important tool in the tourism industry [4,30]. As consumers become more digitalized, they are mesmerized by sharing videos, photos, reviews, and opinions of their travel experiences, building an influential web peer-to-peer content [16].
During the digital age, customers have heightened their expectations for superior services, leading tourism businesses to struggle with keeping up with the latest trends within hospitality marketing. Travelers’ digitalization has altered the guest journey from linear to scattered. That said, travel companies are now able to reach their customers directly though social media and multiple touchpoints, making social media management important in all phases of the customers’ online journey [85]. Emerging technologies, such as mobile social media [170], enable the industry to better cater to the need of the market by offering seamless personalized customer experiences through hypertargeted advertisements. Even small brands that leverage data-driven practices, such as social media analytics, are likely to develop long-term drivers of growth. With a focus on customers’ lifetime value, hospitality brands can use personalized social media advertisements to increase their revenue, improve retention, and create brand awareness The future of advertising lies in using AI-personalized marketing activities, with authentic users generating brand-specific content, that will successfully guide online consumers through the buying process.

5.2. Practical Implications

The current study suggests that the hospitality sector should invest more resources in analyzing the behavioral patterns of online users by utilizing big data analytics. By doing so, the tourism companies will be able to track existing trends and acknowledge the variables that greatly shape the online purchasing behavior of users based on their social media interaction. Whether it is a well-established brand or not, the opportunities arisen by the social media analysis could impact the level of customers’ engagement, leading to higher conversion rates, driving sales, and achieving higher levels of brand recognition and establishment. Therefore, there is an urgent need for companies within the hospitality sector to be supported by good data analysts familiar with the latest developments of big data [171]. The research further highlights the importance of personalization and userengagement-content to e-WOM, suggesting to tourism businesses to welcome posts made by customers and employees. In addition, it paves the way for companies to adopt AI technology, for instance, chatbox and voice search, in an attempt to offer superior services and improve the customer experience.

5.3. Limitations and Future Research

Specifically, the main focus of this paper is to identify the importance of personalization in optimizing brand strategies through social media platforms. While our proposed methodology based on data from 10 hospitality websites and their social media platforms (Facebook and Instagram) represent novel, robust evidence on the impacts of social media advertising on brand optimization, the proposed methodological framework could be expanded and generalized to other tourist companies.
The current study raises the alarm regarding customers’ privacy concerns, as personalized advertisements use personal information. In addition, more attention needs to be placed on the content of personalized advertising, so as to examine the role of sustainability as well as culture in digital marketing activities. Eventually, our proposed methodology and framework could offer deep insights to other markets as well and reflect users’ online behavior, such as the healthcare sector, transportation sector, etc. Moreover, deep research within the hospitality sector, such as on luxury hotel branches, will elucidate the effectiveness of the proposed methodology.

Author Contributions

Conceptualization, D.P.R., D.P.S., M.C.T. and C.V.; methodology, D.P.R., D.P.S. and C.V.; software, D.P.R., D.P.S. and C.V.; validation, D.P.R., D.P.S. and M.C.T.; formal analysis, D.P.R.; investigation, D.P.R., D.P.S. and M.C.T.; resources, D.P.R., D.P.S. and C.V.; data curation, D.P.R., D.P.S., M.C.T. and C.V.; writing—original draft preparation, D.P.R. and M.C.T.; writing—review and editing, D.P.R. and M.C.T.; visualization, D.P.R., D.P.S., M.C.T. and C.V.; supervision, D.P.S. and C.V.; project administration, D.P.R., D.P.S. and M.C.T. All authors have read and agreed to the published version of the manuscript.

Funding

This research received no external funding.

Institutional Review Board Statement

Not applicable.

Informed Consent Statement

Not applicable.

Data Availability Statement

Not applicable.

Conflicts of Interest

The authors declare no conflict of interest.

References

  1. Sitel. How Technology Is Changing the Travel and Tourism Industry. Available online: https://www.sitel.com/blog/how-technology-is-changing-the-travel-and-tourism-industry/ (accessed on 18 September 2022).
  2. Szymkowiak, A.; Gaczek, P.; Padma, P. Impulse Buying in Hospitality: The Role of Content Posted by Social Media Influencers. J. Vacat. Mark. 2021, 27, 385–399. [Google Scholar] [CrossRef]
  3. Chu, S.-C.; Deng, T.; Cheng, H. The Role of Social Media Advertising in Hospitality, Tourism and Travel: A Literature Review and Research Agenda. Int. J. Contemp. Hosp. Manag. 2020, 32, 3419–3438. [Google Scholar] [CrossRef]
  4. Leung, D.; Law, R.; van Hoof, H.; Buhalis, D. Social Media in Tourism and Hospitality: A Literature Review. J. Travel Tour. Mark. 2013, 30, 3–22. [Google Scholar] [CrossRef]
  5. Domo. Data Never Sleeps 9.0. Available online: https://www.domo.com/learn/infographic/data-never-sleeps-9 (accessed on 15 July 2022).
  6. Statista. Daily Time Spent on Social Networking by Internet Users Worldwide from 2012 to 2022. Available online: https://www.statista.com/statistics/433871/daily-social-media-usage-worldwide/ (accessed on 15 July 2022).
  7. Gupta, V. The influencing role of social media in the consumer’s hotel decision-making process. Worldw. Hosp. Tour. 2019, 11, 378–391. [Google Scholar] [CrossRef]
  8. Statista. Global Tourism Industry—Statistics & Facts. Available online: https://www.statista.com/topics/962/global-tourism/#topicHeader__wrapper (accessed on 17 September 2022).
  9. Kim, N.; Kim, W. Do your social media lead you to make social deal purchases? Consumer-generated social referrals for sales via social commerce. Int. J. Inf. Manag. 2018, 39, 38–48. [Google Scholar] [CrossRef]
  10. Sakas, D.P.; Reklitis, D.P.; Trivellas, P.; Vassilakis, C.; Terzi, M.C. The Effects of Logistics Websites’ Technical Factors on the Optimization of Digital Marketing Strategies and Corporate Brand Name. Processes 2022, 10, 892. [Google Scholar] [CrossRef]
  11. Weinberg, B.; Parise, S.; Guinan, P. Multichannel marketing: Mindset and program development. Bus. Horiz. 2007, 50, 385–394. [Google Scholar] [CrossRef]
  12. Acquila-Natale, E.; Iglesias-Pradas, S. How to measure quality in multi-channel retailing and not die trying. J. Bus. Res. 2020, 109, 38–48. [Google Scholar] [CrossRef]
  13. Edelman. 2022 Edelman Trust Barometer. The Cycle of Distust. Available online: https://www.edelman.com/trust/2022-trust-barometer (accessed on 18 September 2022).
  14. Karlsen, R.; Aalberg, T. Social Media and Trust in News: An Experimental Study of the Effect of Facebook on News Story Credibility. Digit. J. 2021. [Google Scholar] [CrossRef]
  15. Singh, S.; Srivastava, P. Social media for outbound leisure travel: A framework based on technology acceptance model (TAM). J. Tour. Futur. 2019, 5, 43–61. [Google Scholar] [CrossRef]
  16. Oliveira, T.; Araujo, B.; Tam, C. Why do people share their travel experiences on social media? Tour. Manag. 2020, 78, 104041. [Google Scholar] [CrossRef]
  17. Pop, R.A.; Săplăcan, Z.; Dabija, D.C.; Alt, M.A. The impact of social media influencers on travel decisions: The role of trust in consumer decision journey. Curr. Issues Tour. 2022, 25, 823–843. [Google Scholar] [CrossRef]
  18. Li, M.W.; Teng, H.Y.; Chen, C.Y. Unlocking the customer engagement-brand loyalty relationship in tourism social media: The roles of brand attachment and customer trust. J. Hosp. Tour. Manag. 2020, 44, 184–192. [Google Scholar] [CrossRef]
  19. Statista. Level of Trust in Crowd-Sourced Review Websites by Online Users in the United States and the United Kingdom as of April 2021. 2021. Available online: https://www.statista.com/statistics/1243212/us-uk-trust-review-websites/ (accessed on 18 September 2022).
  20. Dwivedi, Y.; Kapoor, K.; Chen, H. Social media marketing and advertising. Mark. Rev. 2015, 15, 289–309. [Google Scholar] [CrossRef] [Green Version]
  21. Rathore, A.K.; Ilavarasan, P.V.; Dwivedi, Y.K. Social Media Content and Product Co-Creation: An Emerging Paradigm. J. Enterp. Inf. Manag. 2016, 29, 7–18. [Google Scholar] [CrossRef] [Green Version]
  22. Alalwan, A. Investigating the impact of social media advertising features on customer purchase intention. Int. J. Inf. Manag. 2018, 42, 65–77. [Google Scholar] [CrossRef]
  23. Ananda, A.S.; Hernández-García, Á.; Acquila-Natale, E.; Lamberti, L. What Makes Fashion Consumers “click”? Generation of eWoM Engagement in Social Media. Asia Pac. J. Mark. Logist. 2019, 31, 398–418. [Google Scholar] [CrossRef]
  24. Moro, S.; Rita, P. Brand Strategies in Social Media in Hospitality and Tourism. Int. J. Contemp. Hosp. Manag. 2018, 30, 343–364. [Google Scholar] [CrossRef] [Green Version]
  25. Sakas, D.; Giannakopoulos, N.; Reklitis, D.; Dasaklis, T. The Effects of Cryptocurrency Trading Websites on Airlines’ Advertisement Campaigns. J. Theor. Appl. Electron. Commer. Res. 2021, 16, 3099–3119. [Google Scholar] [CrossRef]
  26. Knoll, J. Advertising in Social Media: A Review of Empirical Evidence. Int. J. Advert. 2016, 35, 266–300. [Google Scholar] [CrossRef]
  27. Alalwan, A.A.; Rana, N.P.; Dwivedi, Y.K.; Algharabat, R. Social Media in Marketing: A Review and Analysis of the Existing Literature. Telemat. Inform. 2017, 34, 1177–1190. [Google Scholar] [CrossRef] [Green Version]
  28. Imtiaz, S.; Kim, D.J. Digital Transformation: Development of New Business Models in the Tourism Industry. Culin. Sci. Hosp. Res. 2019, 25, 91–101. [Google Scholar] [CrossRef]
  29. Vada, S.; Prentice, C.; Filep, S.; King, B. The influence of travel companionships on memorable tourism experiences, well-being, and behavioural intentions. Int. J. Tour. Res. 2022, 24, 714–724. [Google Scholar] [CrossRef]
  30. Christou, E. Branding Social Media in the Travel Industry. Procedia Soc. Behav. Sci. 2015, 175, 607–614. [Google Scholar] [CrossRef] [Green Version]
  31. Kohli, C.; Suri, R.; Kapoor, A. Will social media kill branding? Bus. Horiz. 2015, 58, 35–44. [Google Scholar] [CrossRef]
  32. Rezaei, S.; Valaei, N. Branding in a multichannel retail environment. Inf. Technol. People 2017, 30, 853–886. [Google Scholar] [CrossRef]
  33. Lipsman, A.; Mudd, G.; Rich, M.; Bruich, S. The Power of “Like”. J. Advert. Res. 2012, 52, 40–52. [Google Scholar] [CrossRef]
  34. Majid, A.; Chen, L.; Chen, G.; Mirza, H.; Hussain, I.; Woodward, J. A context-aware personalized travel recommendation system based on geotagged social media data mining. Int. J. Geogr. Inf. Sci. 2013, 27, 662–684. [Google Scholar] [CrossRef]
  35. de Oliveira Santini, F.; Ladeira, W.J.; Pinto, D.C.; Herter, M.M.; Sampaio, C.H.; Babin, B.J. Customer Engagement in Social Media: A Framework and Meta-Analysis. J. Acad. Mark. Sci. 2020, 48, 1211–1228. [Google Scholar] [CrossRef]
  36. Mahrous, A.A.; Hassan, S.S. Achieving Superior Customer Experience: An Investigation of Multichannel Choices in the Travel and Tourism Industry of an Emerging Market. J. Travel Res. 2016, 56, 1049–1064. [Google Scholar] [CrossRef]
  37. Labanauskaitė, D.; Fiore, M.; Stašys, R. Use of E-marketing tools as communication management in the tourism industry. Tour. Manag. Perspect. 2020, 34, 100652. [Google Scholar] [CrossRef]
  38. Almeida, F.; Duarte Santos, J.; Augusto Monteiro, J. The Challenges and Opportunities in the Digitalization of Companies in a Post-COVID-19 World. IEEE Eng. Manag. Rev. 2020, 48, 97–103. [Google Scholar] [CrossRef]
  39. Abdel Monem, H. The Effectiveness of Advertising Personalization. J. Des. Sci. Appl. Arts 2021, 2, 335–344. [Google Scholar] [CrossRef]
  40. Ribeiro-Navarrete, S.; Botella-Carrubi, D.; Palacios-Marqués, D.; Orero-Blat, M. The effect of digitalization on business performance: An applied study of KIBS. J. Bus. Res. 2021, 126, 319–326. [Google Scholar] [CrossRef]
  41. Acquila-Natale, E.; Iglesias-Pradas, S.; Chaparro-Peláez, J. Barriers and drivers of multi-channel e-commerce: A cross-country examination. Dir. Y Organ. 2019, 68, 20–32. [Google Scholar] [CrossRef]
  42. Ahmed, R.; Streimikiene, D.; Berchtold, G.; Vveinhardt, J.; Channar, Z.; Soomro, R. Effectiveness of Online Digital Media Advertising as A Strategic Tool for Building Brand Sustainability: Evidence from FMCGs and Services Sectors of Pakistan. Sustainability 2019, 11, 3436. [Google Scholar] [CrossRef] [Green Version]
  43. Hassan, A.S.; Meyer, D.F. Does countries’ environmental, social and governance (ESG) risk rating influence international tourism demand? A case of the Visegrád Four. J. Tour. Futur. 2022. ahead-of-print. [Google Scholar] [CrossRef]
  44. Net Positive. Available online: https://netpositive.world/book/ (accessed on 18 September 2022).
  45. Ionescu, G.H.; Firoiu, D.; Pirvu, R.; Vilag, R.D. The impact of ESG factors on market value of companies from travel and tourism industry. Technol. Econ. Dev. Econ. 2019, 25, 820–849. [Google Scholar] [CrossRef]
  46. Google Flights. Available online: https://support.google.com/travel/answer/9671620?hl=en (accessed on 18 September 2022).
  47. Adnetzero. Advertising’s Response to the Climate Crisis. Available online: https://adnetzero.com/ (accessed on 15 July 2022).
  48. Tran, T.P.; van Solt, M.; Zemanek, J.E. How Does Personalization Affect Brand Relationship in Social Commerce? A Mediation Perspective: An Abstract. In From Micro to Macro: Dealing with Uncertainties in the Global Marketplace; Springer International Publishing: Cham, Switzerland, 2022; pp. 535–536. [Google Scholar]
  49. Shareef, M.A.; Mukerji, B.; Alryalat, M.A.A.; Wright, A.; Dwivedi, Y.K. Advertisements on Facebook: Identifying the Persuasive Elements in the Development of Positive Attitudes in Consumers. J. Retail. Consum. Serv. 2018, 43, 258–268. [Google Scholar] [CrossRef] [Green Version]
  50. Lee, J.; Hong, I. Predicting positive user responses to social media advertising: The roles of emotional appeal, informativeness, and creativity. Int. J. Inf. Manag. 2016, 36, 360–373. [Google Scholar] [CrossRef]
  51. Jung, J.; Shim, S.W.; Jin, H.S.; Khang, H. Factors Affecting Attitudes and Behavioural Intention towards Social Networking Advertising: A Case of Facebook Users in South Korea. Int. J. Advert. 2016, 35, 248–265. [Google Scholar] [CrossRef]
  52. Liu, H.; Lobschat, L.; Verhoef, P.C. Multichannel Retailing: A Review and Research Agenda. Found. Trends Mark. 2018, 12, 1–79. [Google Scholar] [CrossRef]
  53. Lee, H.; Cho, C.-H. Digital Advertising: Present and Future Prospects. Int. J. Advert. 2020, 39, 332–341. [Google Scholar] [CrossRef]
  54. Zhang, H.; Zang, Z.; Zhu, H.; Uddin, M.; Amin, M. Big data-assisted social media analytics for business model for business decision making system competitive analysis. Inf. Process. Manag. 2022, 59, 102762. [Google Scholar] [CrossRef]
  55. Chang, R.; Kauffman, R.; Kwon, Y. Understanding the paradigm shift to computational social science in the presence of big data. Decis. Support Syst. 2014, 63, 67–80. [Google Scholar] [CrossRef]
  56. Xiang, Z.; Schwartz, Z.; Gerdes, J.H.; Uysal, M. What can big data and text analytics tell us about hotel guest experience and satisfaction? Int. J. Hosp. Manag. 2015, 44, 120–130. [Google Scholar] [CrossRef]
  57. Li, X.; Pan, B.; Law, R.; Huang, X. Forecasting tourism demand with composite search index. Tour. Manag. 2017, 59, 57–66. [Google Scholar] [CrossRef]
  58. Del Vecchio, P.; Mele, G.; Ndou, V.; Secundo, G. Open Innovation and Social Big Data for Sustainability: Evidence from the Tourism Industry. Sustainability 2018, 10, 3215. [Google Scholar] [CrossRef] [Green Version]
  59. Yang, Y.; Stienmetz, J. Big data and tourism planning. Inf. Technol. Tour. 2018, 20, 189–190. [Google Scholar] [CrossRef] [Green Version]
  60. Xiang, Z.; Du, O.; Ma, Y.; Fan, W. A comparative analysis of major online review platforms: Implications for social media analytics in hospitality and tourism. Tour. Manag. 2017, 58, 51–65. [Google Scholar] [CrossRef]
  61. Giglio, S.; Bertacchini, F.; Bilotta, E.; Pantano, P. Using social media to identify tourism attractiveness in six Italian cities. Tour. Manag. 2019, 72, 306–312. [Google Scholar] [CrossRef]
  62. Kim, Y.; Kim, C.; Lee, D.; Lee, H.; Andrada, R. Quantifying nature-based tourism in protected areas in developing countries by using social big data. Tour. Manag. 2019, 72, 249–256. [Google Scholar] [CrossRef]
  63. Xu, F.; Nash, N.; Whitmarsh, L. Big data or small data? A methodological review of sustainable tourism. J. Sustain. Tour. 2020, 28, 144–163. [Google Scholar] [CrossRef]
  64. Li, J.; Xu, L.; Tang, L.; Wang, S.; Li, L. Big data in tourism research: A literature review. Tour. Manag. 2018, 68, 301–323. [Google Scholar] [CrossRef]
  65. Samara, D.; Magnisalis, I.; Peristeras, V. Artificial intelligence and big data in tourism: A systematic literature review. J. Hosp. Tour. Technol. 2020, 11, 343–367. [Google Scholar] [CrossRef]
  66. Sakas, D.P.; Reklitis, D.P. The Impact of Organic Traffic of Crowdsourcing Platforms on Airlines’ Website Traffic and User Engagement. Sustainability 2021, 13, 8850. [Google Scholar] [CrossRef]
  67. World Economic Forum. The Electricity Industry: Uncovering Value through Digital Transformation. Available online: https://www.res4med.org/wp-content/uploads/2017/05/Accenture-WEF-DTI-Electricity-Industry-Summary.pdf (accessed on 15 July 2022).
  68. Zheng, W.; Ji, H.; Lin, C.; Wang, W.; Yu, B. Using a Heuristic Approach to Design Personalized Urban Tourism Itineraries with Hotel Selection. Tour. Manag. 2020, 76, 103956. [Google Scholar] [CrossRef]
  69. Varkaris, E.; Neuhofer, B. The Influence of Social Media on the Consumers’ Hotel Decision Journey. J. Hosp. Tour. Technol. 2017, 8, 101–118. [Google Scholar] [CrossRef]
  70. Acquila-Natale, E.; Chaparro-Peláez, J.; Del-Río-Carazo, L.; Cuenca-Enrique, C. Do or Die? The Effects of COVID-19 on Channel Integration and Digital Transformation of Large Clothing and Apparel Retailers in Spain. J. Theor. Appl. Electron. Commer. Res. 2022, 17, 439–457. [Google Scholar] [CrossRef]
  71. TCI Research ECM Conference: Sharing Economy Impact. Available online: https://tci-research.com/ecm-conference-sharing-economy-impact/ (accessed on 15 July 2022).
  72. Sârbu, R.; Alecu, F.; Dina, R. Social Media Advertising Trends in Tourism. Amfiteatru Econ. J. 2018, 20, 1016–1028. [Google Scholar] [CrossRef]
  73. Mitrović, D.; Simović, O.; Raičević, M. Personalized Marketing in the Function of the Tourist Destination Improvement. ECONOMICS 2019, 7, 127–137. [Google Scholar] [CrossRef] [Green Version]
  74. Stylos, N.; Zwiegelaar, J. Big Data as a Game Changer: How Does It Shape Business Intelligence Within a Tourism and Hospitality Industry Context? In Big Data and Innovation in Tourism, Travel, and Hospitality: Managerial Approaches, Techniques, and Applications; Sigala, M., Rahimi, R., Thelwall, M., Eds.; Springer: Singapore, 2019; pp. 163–181. ISBN 9789811363399. [Google Scholar]
  75. Sigala, M.; Rahimi, R.; Thelwall, M. Big Data and Innovation in Tourism, Travel, and Hospitality; Springer Nature Singapore: Singapore, 2019. [Google Scholar]
  76. Statista. Online Travel Brands Believed to Have the Best Social Media Presence in the United States as of August 2021. Available online: https://www.statista.com/statistics/1331159/online-travel-brands-best-social-media-us/ (accessed on 18 September 2022).
  77. Amaro, S.; Duarte, P. Social media use for travel purposes: A cross cultural comparison between Portugal and the UK. Inf. Technol. Tour. 2017, 17, 161–181. [Google Scholar] [CrossRef]
  78. Tang, M.; Chan, E. Social Media: Influences and Impacts on Culture. Adv. Intell. Syst. Comput. 2020, 1228, 491–501. [Google Scholar]
  79. Radwan, M. Effect of social media usage on the cultural identity of rural people: A case study of Bamha village, Egypt. Humanit. Soc. Sci. Commun. 2022, 9, 248. [Google Scholar] [CrossRef]
  80. Kwayu, S.; Lal, B.; Abubakre, M. Enhancing Organisational Competitiveness Via Social Media—A Strategy as Practice Perspective. Inf. Syst. Front. 2017, 20, 439–456. [Google Scholar] [CrossRef] [Green Version]
  81. Khoa, B.T.; Ly, N.M.; Uyen, V.T.T.; Oanh, N.T.T.; Long, B.T. The impact of Social Media Marketing on the Travel Intention of Z Travelers. In Proceedings of the 2021 IEEE International IOT, Electronics and Mechatronics Conference (IEMTRONICS), Toronto, ON, Canada, 21–24 April 2021. [Google Scholar]
  82. Statista. Programmatic Digital Display Advertising Spending in the United States from 2019 to 2023 (in billion U.S. dollars). Available online: https://www.statista.com/statistics/278727/programmatic-display-ad-spend-in-the-us/ (accessed on 15 July 2022).
  83. Statista. Share of Consumers Looking at Posts on Social Media for Holiday Inspiration in Selected Countries Worldwide as of 4th quarter 2021, by Age. Available online: https://www.statista.com/statistics/1296318/use-of-social-media-for-holiday-inspiration-worldwide-by-age/ (accessed on 15 July 2022).
  84. van Asperen, M.; de Rooij, P.; Dijkmans, C. Engagement-Based Loyalty: The Effects of Social Media Engagement on Customer Loyalty in the Travel Industry. Int. J. Hosp. Tour. Adm. 2017, 19, 78–94. [Google Scholar] [CrossRef]
  85. Hu, L.; Olivieri, M. Social media management in the traveller’s customer journey: An analysis of the hospitality sector. Curr. Issues Tour. 2020, 24, 1768–1779. [Google Scholar] [CrossRef]
  86. Dolega, L.; Rowe, F.; Branagan, E. Going Digital? The Impact of Social Media Marketing on Retail Website Traffic, Orders and Sales. J. Retail. Consum. Serv. 2021, 60, 102501. [Google Scholar] [CrossRef]
  87. Hamouda, M. Understanding Social Media Advertising Effect on Consumers’ Responses: An Empirical Investigation of Tourism Advertising on Facebook. J. Enterp. Inf. Manag. 2018, 31, 426–445. [Google Scholar] [CrossRef]
  88. Harrigan, P.; Evers, U.; Miles, M.; Daly, T. Customer engagement with tourism social media brands. Tour. Manag. 2017, 59, 597–610. [Google Scholar] [CrossRef]
  89. Okazaki, S.; Andreu, L.; Campo, S. Knowledge Sharing Among Tourists via Social Media: A Comparison Between Facebook and TripAdvisor. Int. J. Tour. Res. 2016, 19, 107–119. [Google Scholar] [CrossRef]
  90. Kim, S.; Lee, K.Y.; Shin, S.; Yang, S.B. Effects of tourism information quality in social media on destination image formation: The case of Sina Weibo. Inf. Manag. 2017, 54, 687–702. [Google Scholar] [CrossRef]
  91. Mukherjee, A.; Nagabhushanam, M. Role of Social Media in Tourism Marketing. Int. J. Sci. Res. 2016, 5, 2026–2033. [Google Scholar]
  92. Lund, N.F.; Cohen, S.A.; Scarles, C. The power of social media storytelling in destination branding. J. Destin. Mark. Manag. 2018, 8, 271–280. [Google Scholar] [CrossRef] [Green Version]
  93. Cheung, M.L.; Ting, H.; Cheah, J.H.; Sharipudin, M.N.S. Examining the role of social media-based destination brand community in evoking tourists’ emotions and intention to co-create and visit. J. Prod. Brand Manag. 2021, 30, 28–43. [Google Scholar] [CrossRef]
  94. Icoz, O.; Kütük, A.; Icoz, O. Social media and consumer buying decisions in tourism: The case of Turkey. PASOS Rev. De Tur. Y Patrim. Cult. 2018, 16, 1051–1066. Available online: https://www.researchgate.net/publication/328592597_Social_media_and_consumer_buying_decisions_in_tourism_The_case_of_Turkey (accessed on 17 September 2022). [CrossRef]
  95. Schuckert, M.; Liu, X.; Law, R. Hospitality and Tourism Online Reviews: Recent Trends and Future Directions. J. Travel Tour. Mark. 2015, 32, 608–621. [Google Scholar] [CrossRef]
  96. Valos, M.J.; Polonsky, M.; Geursen, G.; Zutshi, A. Marketers’ Perceptions of the Implementation Difficulties of Multichannel Marketing. J. Strateg. Mark. 2010, 18, 417–434. [Google Scholar] [CrossRef]
  97. Liu, X. A big data approach to examining social bots on Twitter. J. Serv. Mark. 2019, 33, 369–379. [Google Scholar] [CrossRef]
  98. Hristoforova, I.; Silcheva, L.; Arkhipova, T.; Demenkova, A.; Nikolskaya, E. Improvement of Digital Technologies in Marketing Communications of Tourism and Hospitality Enterprises. J. Environ. Manag. Tour. 2022, 10, 829–834. [Google Scholar]
  99. Lubis, M.; Khairiansyah, A.; Jafar Adrian, Q.; Almaarif, A. Exploring the User Engagement Factors in Computer Mediated Communication. J. Phys. Conf. Ser. 2019, 1235, 012040. [Google Scholar] [CrossRef]
  100. Yanenko, M.; Nazarova, E.; Kuzmenko, V.; Moshkin, I. Development of Digital Technologies in Brand Strategies of Retailing. In Proceedings of the DTMIS ’20: International Scientific Conference—Digital Transformation on Manufacturing, Infrastructure and Service, St. Petersburg, Russia, 18–19 November 2020; pp. 1–6. [Google Scholar]
  101. Amed, S.; Mukherjee, S.; Das, P.; Datta, B. Triggers of Positive eWOM: Exploration with Web Analytics. Mark. Intell. Plan. 2019, 37, 433–450. [Google Scholar] [CrossRef]
  102. Kumar, V.; Ogunmola, G. Web Analytics for Knowledge Creation. Int. J. Cyber Behav. Psychol. Learn. 2020, 10, 1–14. [Google Scholar] [CrossRef]
  103. Saura, J.R.; Palos-Sánchez, P.; Cerdá Suárez, L.M. Understanding the Digital Marketing Environment with KPIs and Web Analytics. Future Internet 2017, 9, 76. [Google Scholar] [CrossRef] [Green Version]
  104. Semrush. Traffic Analytics Overview Report Manual. Available online: https://www.semrush.com/kb/895-traffic-analyticsoverview-report (accessed on 15 July 2022).
  105. Vyas, C. Evaluating State Tourism Websites Using Search Engine Optimization Tools. Tour. Manag. 2019, 73, 64–70. [Google Scholar] [CrossRef]
  106. Fanpage Karma. Frequently Asked Questions. Available online: https://academy.fanpagekarma.com/en/frequently-asked-questions/#analytics (accessed on 15 July 2022).
  107. Gao, F.; Zhang, L. Application of Artificial Intelligence and Big Data Technology in Digital Marketing. In Proceedings of the 2020 2nd International Conference on Big Data and Artificial Intelligence, Johannesburg, Africa, 28–30 April 2020; pp. 270–272. [Google Scholar]
  108. Fanpage Karma. Total Reactions, Comments, Shares. Available online: https://academy.fanpagekarma.com/en/hrf_faq/total-reactions-comments-shares/ (accessed on 15 July 2022).
  109. Fanpage Karma. Post Interaction. Available online: https://academy.fanpagekarma.com/en/hrf_faq/post-interaction-3/ (accessed on 15 July 2022).
  110. Hossain, M.; Kannan, S.; Raman Nair, S. Factors Influencing Sustainable Competitive Advantage in the Hospitality Industry. J. Qual. Assur. Hosp. Tour. 2020, 22, 679–710. [Google Scholar] [CrossRef]
  111. Drivas, I.C.; Kouis, D.; Kyriaki-Manessi, D.; Giannakopoulou, F. Social Media Analytics and Metrics for Improving Users Engagement. Knowledge 2022, 2, 225–242. [Google Scholar] [CrossRef]
  112. Inanc–Demir, M.; Kozak, M. Big Data and Its Supporting Elements: Implications for Tourism and Hospitality Marketing. In Big Data and Innovation in Tourism, Travel, and Hospitality: Managerial Approaches, Techniques, and Applications; Sigala, M., Rahimi, R., Thelwall, M., Eds.; Springer: Singapore, 2019; pp. 213–223. ISBN 9789811363399. [Google Scholar]
  113. Line, N.D.; Dogru, T.; El-Manstrly, D.; Buoye, A.; Malthouse, E.; Kandampully, J. Control, Use and Ownership of Big Data: A Reciprocal View of Customer Big Data Value in the Hospitality and Tourism Industry. Tour. Manag. 2020, 80, 104106. [Google Scholar] [CrossRef]
  114. Hruska, J.; Maresova, P. Use of Social Media Platforms among Adults in the United States—Behavior on Social Media. Societies 2020, 10, 27. [Google Scholar] [CrossRef] [Green Version]
  115. Agung, N.; Darma, G. Opportunities and Challenges of Instagram Algorithm in Improving Competitive Advantage. Int. J. Innov. Sci. Res. Technol. 2022, 10, 4. [Google Scholar]
  116. Luo, X.; Zhang, J. How Do Consumer Buzz and Traffic in Social Media Marketing Predict the Value of the Firm? J. Manag. Inf. Syst. 2013, 30, 213–238. [Google Scholar] [CrossRef]
  117. Apenteng, B.; Ekpo, I.; Mutiso, F.; Akowuah, E.; Opoku, S. Examining the relationship between social media engagement and hospital revenue. Health Mark. Q. 2020, 37, 10–21. [Google Scholar] [CrossRef] [PubMed]
  118. Baye, M.; De los Santos, B.; Wildenbeest, M. Search Engine Optimization: What Drives Organic Traffic to Retail Sites? J. Econ. Manag. Strategy 2015, 25, 6–31. [Google Scholar] [CrossRef] [Green Version]
  119. Pan, B. The Power of Search Engine Ranking for Tourist Destinations. Tour. Manag. 2015, 47, 79–87. [Google Scholar] [CrossRef]
  120. Rao, R.J.; Stewart, C.; Perez, A.; Renganathan, S.M. Assessing Learning Behavior and Cognitive Bias from Web Logs. In Proceedings of the 2018 IEEE Frontiers in Education Conference (FIE), San Jose, CA, USA, 3–6 October 2018; pp. 1–5. [Google Scholar]
  121. Giabbanelli, P.J.; Gray, S.A.; Aminpour, P. Combining Fuzzy Cognitive Maps with Agent-Based Modeling: Frameworks and Pitfalls of a Powerful Hybrid Modeling Approach to Understand Human-Environment Interactions. Environ. Model. Softw. 2017, 95, 320–325. [Google Scholar] [CrossRef]
  122. Triantafillidou, A.; Yannas, P. Social media crisis communication in racially charged crises: Exploring the effects of social media and image restoration strategies. Comput. Hum. Behav. 2020, 106, 106269. [Google Scholar] [CrossRef]
  123. Asanbekova, M.; Maksudunov, A. The Marketing Power of Instagram: A Content Analysis of Top Hotel Enterprises in Kyrgyzstan. Int. J. Turk. World Tour. Stud. 2018, 3, 2. [Google Scholar]
  124. Similarweb. Top Websites Ranking for Travel and Tourism in the World. Available online: https://www.similarweb.com/top-websites/category/travel-and-tourism/ (accessed on 15 July 2022).
  125. Statista. Most Visited Travel and Tourism Websites Worldwide as of May 2022. Available online: https://www.statista.com/statistics/1215457/most-visited-travel-and-tourism-websites-worldwide/ (accessed on 15 July 2022).
  126. Felix, G.; Nápoles, G.; Falcon, R.; Froelich, W.; Vanhoof, K.; Bello, R. A Review on Methods and Software for Fuzzy Cognitive Maps. Artif. Intell. Rev. 2019, 52, 1707–1737. [Google Scholar] [CrossRef] [Green Version]
  127. Drivas, I.C.; Sakas, D.P.; Giannakopoulos, G.A. Display Advertising and Brand Awareness in Search Engines: Predicting the Engagement of Branded Search Traffic Visitors. In Business Intelligence and Modelling; Springer International Publishing: Cham, Switzerland, 2021; pp. 3–15. ISBN 9783030570644. [Google Scholar]
  128. Bell, D.; Mgbemena, C. Data-Driven Agent-Based Exploration of Customer Behavior. Simulation 2018, 94, 195–212. [Google Scholar] [CrossRef] [Green Version]
  129. Negahban, A.; Yilmaz, L. Agent-Based Simulation Applications in Marketing Research: An Integrated Review. J. Simul. 2014, 8, 129–142. [Google Scholar] [CrossRef]
  130. Vrontis, D.; Makrides, A.; Christofi, M.; Thrassou, A. Social media influencer marketing: A systematic review, integrative framework and future research agenda. Int. J. Consum. Stud. 2021, 45, 617–644. [Google Scholar] [CrossRef]
  131. Erkan, I.; Evans, C. The Influence of eWOM in Social Media on Consumers’ Purchase Intentions: An Extended Approach to Information Adoption. Comput. Hum. Behav. 2016, 61, 47–55. [Google Scholar] [CrossRef]
  132. Gvili, Y.; Levy, S. Consumer Engagement with eWOM on Social Media: The Role of Social Capital. Online Inf. Rev. 2018, 42, 482–505. [Google Scholar] [CrossRef]
  133. Son, C.; Kim, J.; Kim, Y. Developing Scenario-Based Technology Roadmap in the Big Data Era: An Utilisation of Fuzzy Cognitive Map and Text Mining Techniques. Technol. Anal. Strateg. Manag. 2020, 32, 272–291. [Google Scholar] [CrossRef]
  134. Lee, K.C.; Lee, H.; Lee, N.; Lim, J. An Agent-Based Fuzzy Cognitive Map Approach to the Strategic Marketing Planning for Industrial Firms. Ind. Mark. Manag. 2013, 42, 552–563. [Google Scholar] [CrossRef]
  135. Amer, M.; Jetter, A.; Daim, T. Development of fuzzy cognitive map (FCM)-based scenarios for wind energy. Int. J. Energy Sect. Manag. 2011, 5, 564–584. [Google Scholar] [CrossRef]
  136. Kokkinos, K.; Lakioti, E.; Papageorgiou, E.; Moustakas, K.; Karayannis, V. Fuzzy Cognitive Map-Based Modeling of Social Acceptance to Overcome Uncertainties in Establishing Waste Biorefinery Facilities. Front. Energy Res. 2018, 6, 112. [Google Scholar] [CrossRef] [Green Version]
  137. Krrabaj, S.; Baxhaku, F.; Sadrijaj, D. Investigating search engine optimization techniques for effective ranking: A case study of an educational site. In Proceedings of the 2017 6th Mediterranean Conference on Embedded Computing (MECO), Bar, Montenegro, 11–15 June 2017. [Google Scholar] [CrossRef]
  138. Moral, P.; Gonzalez, P.; Plaza, B. Methodologies for Monitoring Website Performance: Assessing the Effectiveness of AdWords Campaigns on a Tourist SME Website. Online Inf. Rev. 2014, 38, 575–588. [Google Scholar] [CrossRef]
  139. Angeloni, S.; Rossi, C. Online Search Engines and Online Travel Agencies: A Comparative Approach. J. Hosp. Tour. Res. 2021, 45, 720–749. [Google Scholar] [CrossRef]
  140. Ariel, Y.; Avidar, R. Information, Interactivity, and Social Media. Atl. J. Commun. 2015, 23, 19–30. [Google Scholar] [CrossRef]
  141. Sreejesh, S.; Paul, J.; Strong, C.; Pius, J. Consumer response towards social media advertising: Effect of media interactivity, its conditions and the underlying mechanism. Int. J. Inf. Manag. 2020, 54, 102155. [Google Scholar]
  142. Sakas, D.P.; Reklitis, D.P. Predictive Model for Estimating the Impact of Technical Issues on Consumers Interaction in Agri-Logistics Websites. In Information and Communication Technologies for Agriculture—Theme IV: Actions; Bochtis, D.D., Pearson, S., Lampridi, M., Marinoudi, V., Pardalos, P.M., Eds.; Springer International Publishing: Cham, Switzerland, 2021; pp. 269–283. ISBN 9783030841560. [Google Scholar]
  143. Rand, W.; Rust, R.T. Agent-Based Modeling in Marketing: Guidelines for Rigor. Int. J. Res. Mark. 2011, 28, 181–193. [Google Scholar] [CrossRef]
  144. Rand, W. Theory-Interpretable, Data-Driven Agent-Based Modeling. In Social-Behavioral Modeling for Complex Systems; John Wiley & Sons, Inc.: Hoboken, NJ, USA, 2019; pp. 337–357. ISBN 9781119485001. [Google Scholar]
  145. Serrano, E.; Iglesias, C. Validating viral marketing strategies in Twitter via agent-based social simulation. Expert Syst. Appl. 2016, 50, 140–150. [Google Scholar] [CrossRef]
  146. Hamill, L.; Gilbert, G.N. Social Circles: A Simple Structure for Agent-Based Social Network Models. J. Artif. Soc. Soc. Simul. 2009, 12, 2. [Google Scholar]
  147. Robinson, S.; Rai, V. Determinants of spatio-temporal patterns of energy technology adoption: An agent-based modeling approach. Appl. Energy 2015, 151, 273–284. [Google Scholar] [CrossRef] [Green Version]
  148. Anylogic. Time Stack Chart. Available online: https://anylogic.help/anylogic/analysis/time-stack-chart.html (accessed on 15 July 2021).
  149. Coates Nee, R. Social Responsibility Theory and the Digital Nonprofits: Should the Government Aid Online News Startups? Journalism 2014, 15, 326–343. [Google Scholar] [CrossRef]
  150. Mushtaq, H.; Sadiq, I.; Ali, S.N. Internet Markets & E-Advertising Active Models in Pakistan: Signifying E-Advertising Artifacts Apposite for E-Business Startups. In Proceedings of the 2nd International Conference on Business Management, Lahore, Pakistan, 28–29 March 2012. [Google Scholar]
  151. Poddar, N.; Agarwal, D. A Comparative Study of Application Effectiveness between Digital and Social Media Marketing for Sustainability of Start-Ups. Int. J. Bus. Insights Transform. 2019, 12, 50–54. [Google Scholar]
  152. Syaifullah, J.; Syaifudin, M.; Sukendar, M.U.; Junaedi, J. Social Media Marketing and Business Performance of MSMEs During the COVID-19 Pandemic. J. Asian Financ. Econ. Bus. 2021, 8, 523–531. [Google Scholar] [CrossRef]
  153. Shawky, S.; Kubacki, K.; Dietrich, T.; Weaven, S. Using Social Media to Create Engagement: A Social Marketing Review. J. Soc. Mark. 2019, 9, 204–224. [Google Scholar] [CrossRef] [Green Version]
  154. Butler, R. Seasonality in tourism: Issues and implications. Tour. Rev. 1998, 53, 18–24. [Google Scholar] [CrossRef]
  155. Martín Martín, J.; Rodriguez Martín, J.; Zermeño Mejía, K.; Salinas Fernández, J. Effects of Vacation Rental Websites on the Concentration of Tourists—Potential Environmental Impacts. An Application to the Balearic Islands in Spain. Int. J. Environ. Res. Public Health 2018, 15, 347. [Google Scholar] [CrossRef] [Green Version]
  156. Plaza, B. Google Analytics for Measuring Website Performance. Tour. Manag. 2011, 32, 477–481. [Google Scholar] [CrossRef]
  157. Setiawan, A.; Harahap, Z.; Syamsuar, D.; Kunang, Y.N. The Optimization of Website Visibility and Traffic by Implementing Search Engine Optimization (SEO) in Palembang Polytechnic of Tourism. CommIT (Commun. Inf. Technol.) J. 2020, 14, 31–44. [Google Scholar] [CrossRef]
  158. Pillai, R.; Sivathanu, B. Adoption of AI-Based Chatbots for Hospitality and Tourism. Int. J. Contemp. Hosp. Manag. 2020, 32, 3199–3226. [Google Scholar] [CrossRef]
  159. Kazak, A.; Chetyrbok, P.; Oleinikov, N. Artificial intelligence in the tourism sphere. IOP Conf. Ser. Earth Environ. Sci. 2020, 421, 042020. [Google Scholar] [CrossRef]
  160. Shanahan, T.; Tran, T.P.; Taylor, E.C. Getting to Know You: Social Media Personalization as a Means of Enhancing Brand Loyalty and Perceived Quality. J. Retail. Consum. Serv. 2019, 47, 57–65. [Google Scholar] [CrossRef]
  161. Buhalis, D.; Amaranggana, A. Smart tourism destinations enhancing tourism experience through personalisation of services. In Information and Communication Technologies in Tourism 2015; Springer: Cham, Switzerland, 2015; ISBN 9783319143439. [Google Scholar]
  162. Shen, H.; Wu, L.; Yi., S.; Xue, L. The effect of online interaction and trust on consumers’ value co-creation behavior in the online travel community. J. Travel Tour. Mark. 2020, 37, 418–428. [Google Scholar] [CrossRef]
  163. Nyheim, P.; Xu, S.; Zhang, L.; Mattila, A.S. Predictors of avoidance towards personalization of restaurant smartphone advertising: A study from the Millennials’ perspective. J. Hosp. Tour. Technol. 2015, 6, 145–159. [Google Scholar] [CrossRef]
  164. Lei, S.S.I.; Chan, I.C.C.; Tang, J.; Ye, S. Will tourists take mobile travel advice? Examining the personalization-privacy paradox. J. Hosp. Tour. Manag. 2022, 50, 288–297. [Google Scholar] [CrossRef]
  165. Ahani, A.; Nilashi, M.; Ibrahim, O.; Sanzogni, L.; Weaven, S. Market segmentation and travel choice prediction in Spa hotels through TripAdvisor’s online reviews. Int. J. Hosp. Manag. 2019, 80, 52–77. [Google Scholar] [CrossRef]
  166. Bakshi, S.; Gupta, D.R.; Gupta, A. Online travel review posting intentions: A social exchange theory perspective. Leisure 2021, 45, 603–633. [Google Scholar] [CrossRef]
  167. Vinzenz, F.; Priskin, J.; Wirth, W.; Ponnapureddy, S.; Ohnmacht, T. Marketing sustainable tourism: The role of value orientation, well-being and credibility. J. Sustain. Tour. 2019, 27, 1663–1685. [Google Scholar] [CrossRef]
  168. Mendes-Filho, L.; Mills, A.M.; Tan, F.B.; Milne, S. Empowering the traveler: An examination of the impact of user-generated content on travel planning. J. Travel Tour. Mark. 2018, 35, 425–436. [Google Scholar] [CrossRef]
  169. Kim, A.J.; Johnson, K.K.P. Power of Consumers Using Social Media: Examining the Influences of Brand-Related User-Generated Content on Facebook. Comput. Hum. Behav. 2016, 58, 98–108. [Google Scholar] [CrossRef]
  170. Chen, Y.; Liu, Y.; Wu, L.; Li, X. How Does Mobile Social Media Sharing Benefit Travel Experiences? J. Travel Res. 2022. [Google Scholar] [CrossRef]
  171. Mariani, M.; Baggio, R.; Fuchs, M.; Höepken, W. Business Intelligence and Big Data in Hospitality and Tourism: A Systematic Literature Review. Int. J. Contemp. Hosp. Manag. 2018, 30, 3514–3554. [Google Scholar] [CrossRef]
Figure 1. FCM with statistical correlations.
Jtaer 17 00070 g001
Figure 2. Paid Advertisement optimization scenario.
Jtaer 17 00070 g002
Figure 3. Social media interactivity optimization scenario.
Jtaer 17 00070 g003
Figure 4. Digital brand name optimization scenario.
Jtaer 17 00070 g004
Figure 5. ABM.
Figure 5. ABM.
Jtaer 17 00070 g005
Figure 6. (a) Predictive model’s population of 1000 agents over a 6-month period. Day 20. (b) Reductive’s model population of 1000 agents over a 6-month period. Day 170.
Jtaer 17 00070 g006
Figure 7. Paid and Social traffic changes in 180 simulation days.
Jtaer 17 00070 g007
Figure 8. Organic traffic and global rank development in 180 simulation days.
Jtaer 17 00070 g008
Table 2. Pearson’s correlations of the H1.
CorrelationsSocial Media TrafficSM Post InteractionPaid Traffic
Social Media Traffic1
SM Post Interaction−0.0721
Paid Traffic0.931 **−0.0041
** Correlation is significant at the 0.01 level (1-tailed).
Table 3. Regression analysis for H1.
VariablesStandardized CoefficientR2Fp-Value
Constant (Social Media Traffic)-0.872223.8210.116
SM Post Interaction−0.068 0.126
Paid Traffic0.931 <0.001
Table 4. Coefficients between the examined metrics for H2.
CorrelationsTotal Reactions on PostsNumber of CommentsPosts per Day
Total Reactions on Posts1
Number of Comments0.573 **1
Posts per Day0.471 **0.784 **1
** Correlation is significant at the 0.01 level (1-tailed).
Table 5. Regression analysis for H2.
VariablesStandardized CoefficientR2Fp-Value
Constant (Total Reactions on Posts)-0.32919.195<0.001
Number of Comments0.528 0.725
Posts per Day0.057 0.002
Table 6. Coefficients between the examined metrics for H3.
CorrelationsTotal VisitsSocial Media TrafficPages per Visit
Total Visits1
Social Media Traffic0.889 **1
Pages per Visit0.353 **0.4131
** Correlation is significant at the 0.01 level (1-tailed).
Table 7. Regression analysis for H3.
VariablesStandardized CoefficientR2Fp-Value
Constant (Total Visits)-0.791126.897<0.001
Social Media Traffic0.896 <0.001
Pages per Visits−0.017 0.779
Table 8. Coefficients between the examined metrics for H4.
CorrelationsOrganic TrafficNumber of FansSocial Media Traffic
Organic traffic1
Number of Fans−0.1271
Social Media traffic0.628 **−0.0121
Total Visits0.859 **−0.0970.889 **1
** Correlation is significant at the 0.01 level (1-tailed).
Table 9. Regression analysis for H4.
VariablesStandardized CoefficientR2Fp-Value
Constant (Organic Traffic)-0.826103.200<0.001
Social Media traffic0.657 <0.001
Total Visits0.443 <0.001
Number of Fans0.006 0.905
Table 10. Coefficients between the examined metrics for H5.
CorrelationsGlobal RankAverage Time on SiteNumber of LikesPages per Visit
Global Rank1
Average Time on Site−0.483 **1
Number of Likes0.241 *−0.1891
Pages per Visit−0.424 **0.542 **−0.0201
* Correlation is significant at the 0.02 level (2-tailed). ** Correlation is significant at the 0.01 level (1-tailed).
Table 11. Regression analysis for H5.
VariablesStandardized CoefficientR2Fp-Value
Constant (Global Rank)-0.32510.433<0.001
Average Time on Site−0.345 0.007
Number of Likes0.171 0.107
Pages per Visit−0.248 0.044
Publisher’s Note: MDPI stays neutral with regard to jurisdictional claims in published maps and institutional affiliations.