Article

Measuring Using Disruptive Technology in the Supply Chain Context: Scale Development and Validation

by
Özden Özkanlısoy
1,* and
Füsun Bulutlar
2
1
Department of Logistics Management, Yeditepe University, 34755 İstanbul, Turkey
2
Department of International Trade and Business, Yeditepe University, 34755 İstanbul, Turkey
*
Author to whom correspondence should be addressed.
J. Theor. Appl. Electron. Commer. Res. 2022, 17(4), 1336-1360; https://doi.org/10.3390/jtaer17040068
Submission received: 21 July 2022 / Revised: 12 October 2022 / Accepted: 14 October 2022 / Published: 19 October 2022
(This article belongs to the Special Issue Supply Chain Digitalization)

Abstract

:
The concept of disruptive technology has been in our lives for many years, and it is essential to measure their utilization levels to survive in the global competitive environment, to benefit from their contributions to supply chains, to examine their relations with supply chain operations and to compare them with average state of the industry. The aim of this study is to develop and validate a measurement instrument for supply chain management practices in the disruptive technology field. Accordingly, the study was carried out in five steps and the sample size consists of 47 companies as pilot data and 426 companies for the main data. These steps consist of item generation and purification, pilot test, initial identification of dimensionality, dimensionality confirmation and convergent validity assessment. As a result of the study, a new scale with a single factor structure was developed. The study ends with the evaluation of the findings. Correcting the lack of a measurement tool developed in this field in the literature is the theoretical contribution of the study. Furthermore, this study enables supply chain leaders to compare their utilization level of disruptive technology with the industries in which they operate, to associate it with operations and to enhance technology investments in practice.

1. Introduction

Technology is a concept as old as the history of humanity and continues to maintain its existence and significance throughout our lives [1]. The birth and utilization of technology caused a revolution in businesses [2]. Thereafter, it has provided and continues to provide revolutionary contributions to businesses [3]. Nowadays, the concept of “disruptive technology (DT)” has become a widely accepted scientific term based on the commercial world and is used to describe the effect of technology on decision-making processes. The word “disruptive” refers to the interruption or disruption of the orderly progress of an event, process or activity, but also may mean a major change in structure [4].
DTs were given the title of “disruptive” because they are technologies that replace existing technologies after they are put into practice. They do this by initially outperforming technology already established in serving the mainstream market. However, they replace existing technologies over time [5]. Which technologies are disruptive have changed since the day they were introduced as a concept. DTs are typically widely focused on new and revolutionary technologies in the literature [6]. Therefore, technologies that have a disruptive effect in every period of life differ according to their era [7].
The revolutionary technologies of the current era are provided by the industrial revolutions of that era [8]. Consequently, the technologies offered by the industrial revolutions should be evaluated within the scope of DTs [9]. In the journey of industrial revolutions, which started with production using steam machines, the third industrial revolution took place with the transition of production systems from analog systems to digital systems, and the processes of companies became more complex, consumer demands and expectations changed, and the need for interdisciplinary work brought about the need for connection and communication of all objects via the internet. The need for a new industrial revolution in which the internet interacts has emerged. This need has created The Fourth Industrial Revolution (4IR) [10].
With the realization of the 4IR, new technologies and business models emerged and transformed the societies and economies in which they lived [11]. In addition to being very crucial for the modern economy, the concept of 4IR includes innovation and technological progress; it has dramatically transformed products, services, operations, and production processes [12,13]. In this context, the technologies offered by this industrial revolution, which is also called 4IR, are accepted as today’s DTs, as they eliminate existing systems and provide more efficient systems to replace them [9]. This industrial revolution, unlike the other three industrial revolutions, is not a continuation of the previous one (third industrial revolution). It has been developed mainly on the basis of velocity, width/depth and system effect [14].
The supply chain (SC) is an integrated structure that includes forward and backward activities, in which many units and operations are intertwined [15]. Supply chain management (SCM) ensures the coordination of all activities in the SC by connecting suppliers, shippers, internal departments, and businesses. SCM includes coordination in SC. This coordination is the movement of products from suppliers to end users. The sharing of information such as sales forecasts, sales dates and promotional campaigns among whole members of the chain is realized through SCM [16]. 4IR is a new level of company and administration of the SC throughout the life cycle of products [17]. 4IR dramatically affects SC activities, business processes and models [18].
4IR enhances integration in the SC. It enables collaborative production and allows businesses to focus on their core competencies. In this way, businesses can develop more value-added products and complementary assets or services [19]. With this industrial revolution, SCs have become more flexible. Correspondingly, it is easier to react to changes in the market [20]. 4IR provides an unprecedented increase in operational efficiency and productivity in SCs. It enables this with production ecosystems driven by intelligent systems with autonomous features. In addition, it enables new kinds of advanced manufacturing and industrial operations to emerge [21]. Additionally, 4IR also enables mass customization. Mass customization allows businesses to address customer demands and consistently introduce new goods and services to the market in SCs. 4IR has the effect of enhancing the transparency of whole stages, from the sending of the order to the end of the product’s utilization life. Furthermore, the cost, quality and competitive advantages of 4IR are some of the principal benefits of this industrial revolution [22,23,24].
4IR enables many competitive advantages with the dynamic structure it provides in business processes. It reduces SC risks. Besides the benefits of time and price, it is also environmentally friendly. In all these respects, it enhances economic, social, and environmental sustainability. It eliminates malfunctions. It optimizes decision making thanks to the end-to-end visibility it provides [25]. It improves the working conditions of employees with the cooperation of technology and workforce [24].
As a whole these contributions point out that 4IR is the transformation of economies and industries, and thus SCs, through a combination of technological, social, and business disruptive forces [11]. The disruptive forces that bring about the transformation referred to are DTs [26]. Consequently, the technologies with disruptive effects have emerged with 4IR in SCM. These technologies have made and continue to make dramatic contributions to SCs [27,28,29]. Understanding the latest trends in using DTs to shape the world is essential [30]. Nowadays, consumer habits have changed rapidly, and businesses and SCs must cope with the adversities revealed by this dynamic new environment and adapt to this change [11]. The COVID-19 pandemic has once again highlighted how significant the utilization of new DTs is to enhance SC visibility, take better action in case of SC disruptions, and build more resilient SCs [31]. For companies to benefit from the above-mentioned contributions and carry on existing in a global competitive environment, they must pursue current technological developments, current trends, innovations and research, and invest in these technologies [32].
In order to understand to what extent these facts exist in the external world and to what extent they interact, it is necessary to measure them concretely. Measuring is defined as assigning numbers to objects [33]. Scale development studies are very significant to embody the abstract and to quantify qualitative findings [34,35]. To measure the level of DT use of a company, to compare it with the average of the industry in which it operates, or to measure the level of DT use of a SC is only possible with a measurement instrument developed in this field. Measuring the level of DT use is significant and necessary both to see to what extent the company benefits from them and to compare the company with the industry in which it operates, both locally and globally. A scale developed in this field also allows the relationship of utilizing these technologies for different operations and the effect of these operations to be analyzed quantitatively in SCs, in addition to measuring the utilization level of the DTs.
In the current age, using technologies offered by the period is not a necessity, but a compulsion, for businesses to continue their operations, enhance their performance and gain a competitive advantage [36]. 4IR has many new DTs to offer [
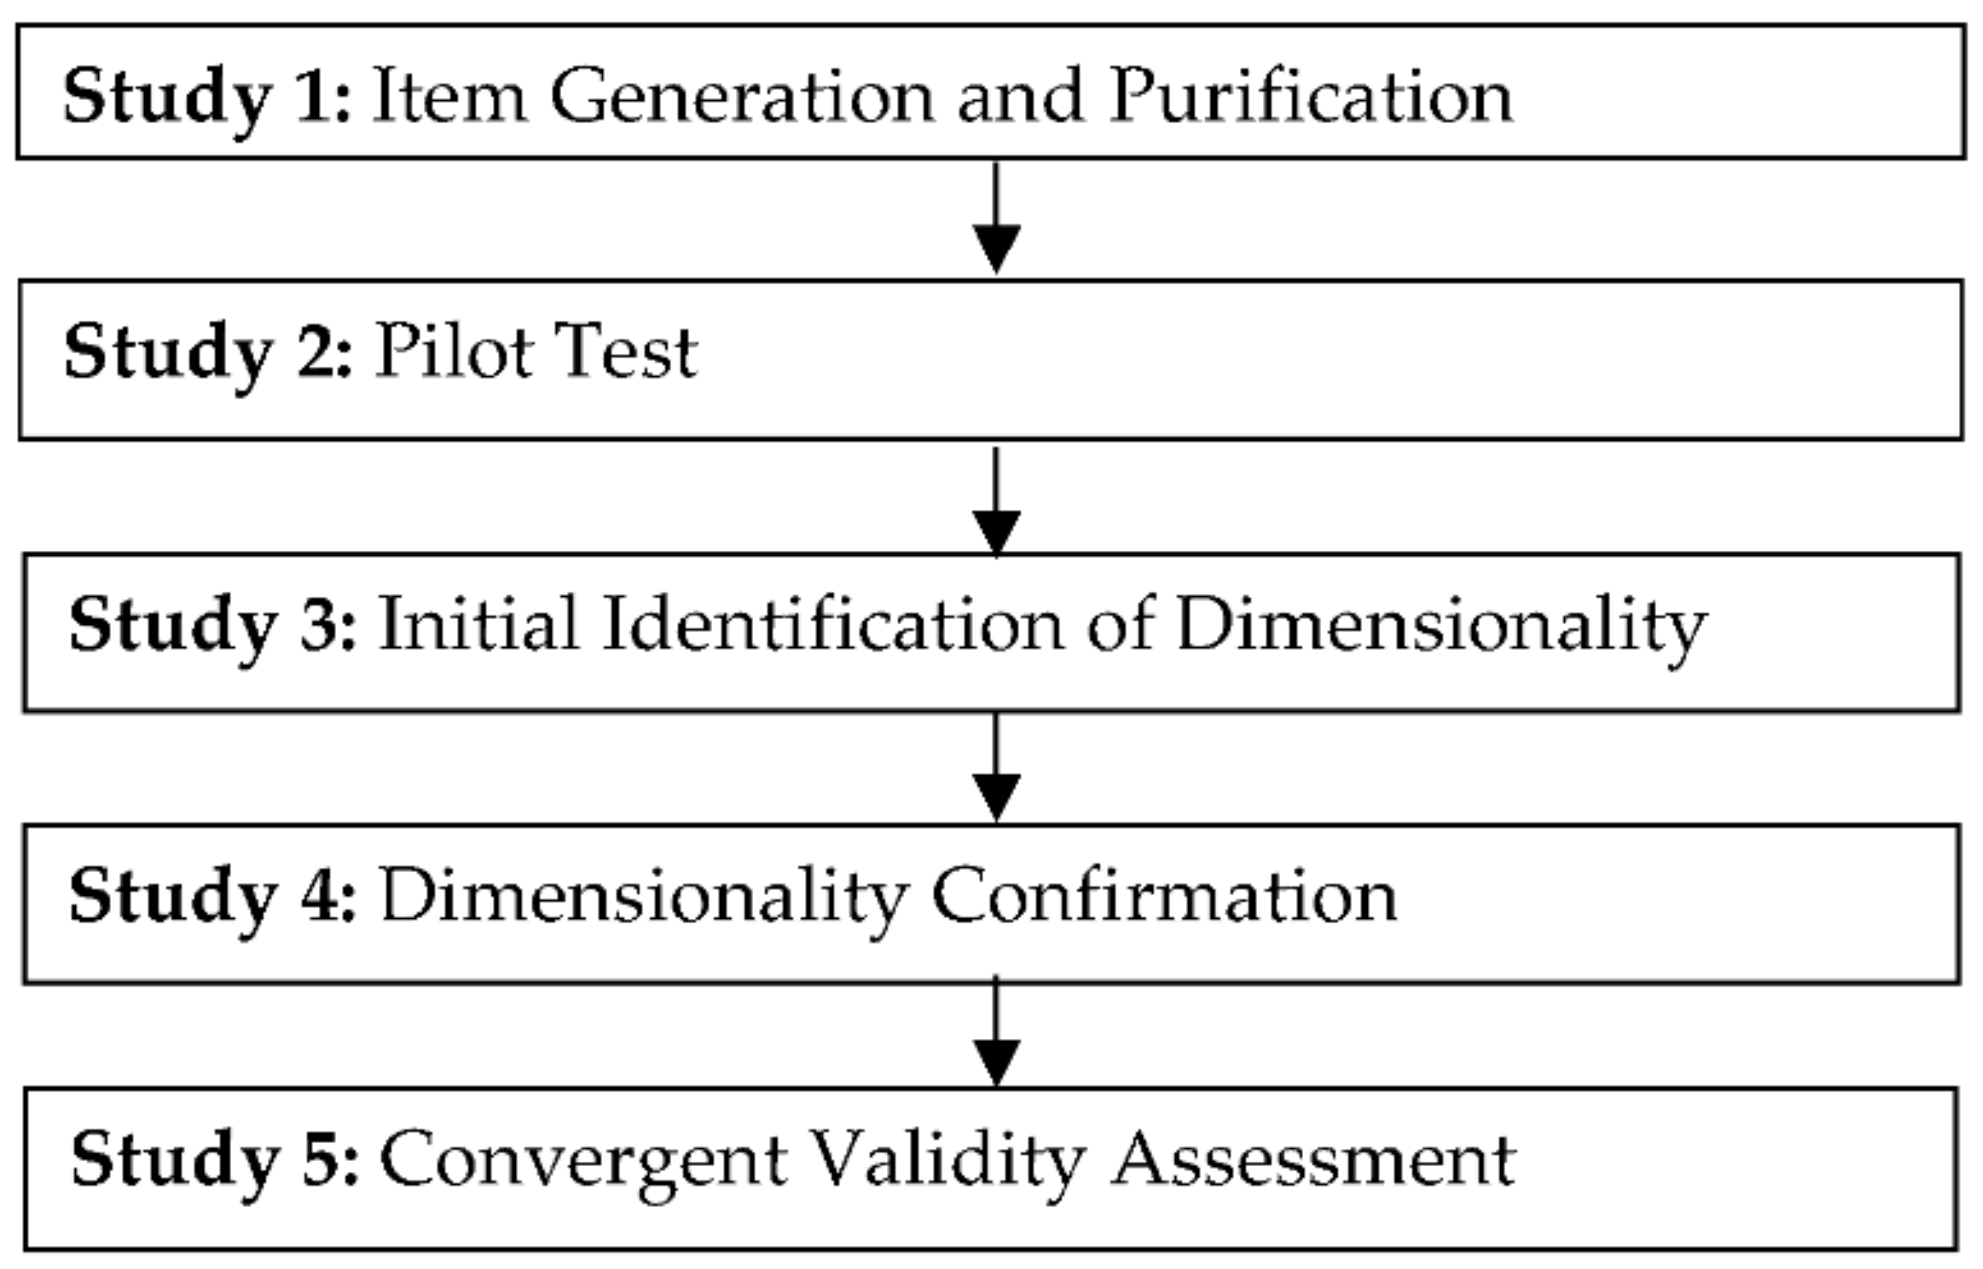
37]. The purpose of this study is to develop and validate a measurement instrument for SCM practices in the technology field. In this study, the technologies offered by 4IR within the scope of DTs within the scope of the scale development study, based specifically on those that are frequently utilized in SCs in the existing literature. The remainder of this article is developed as follows: Section 2 reviews the conceptualization of DTs, the theoretical background of the study, and explains their characteristics, opportunities and threats. Section 3 presents the empirical findings on which the scale development study is based. This scale was developed as the “Using Disruptive Technology Scale (UDTS)”. In the study, the scale development steps are given separately, and the scale has validity and reliability criteria. The consequences are presented in Section 4, and it ends with the final section in Section 5.

2. Theoretical Background

2.1. Conceptualizing Disruptive Technology

The concept of “disruptive technology (DT)”, which emerged with the study of Clayton Christensen and his colleagues on this subject, was not only a popular study of that period, but has continued to maintain its significance. The authors introduced the concept of DT with their book Innovator’s Dilemma (1997) [5], which examines five key issues related to the impact of technological transformation on companies and industries, and were met as “gurus” in the field at that time [38,39]. DTs are technologies that dramatically change the way consumers, industry and businesses operate. A DT destroys the systems or habits it replaces. It can achieve this thanks to its recognizable superior features [40].
The condition for a technology to be called “disruptive” is not that it replaces the previous technology. For a technology to be considered disruptive, it must operate through a certain mechanism. At the same time, using this technology needs to achieve certain results. From all these perspectives, there is a technological transformation. These technologies are those that initially spread to small markets and eventually spread to the mass market. The markets where it has the most disruptive effect are the mass markets. Products produced with DTs enhance the existing product market and additionally offer new product market opportunities. They have a proactive high risk–high payoff but enable significant long-term benefits. They enable revolutionary alteration in the conduct of operations [41].
DTs have some characteristic features. Since these technologies have superior features than traditional methods, the product and service structures produced with these technologies are positively differentiated [42]. These technologies manufacture products that focus on the demands of leading utilizers [43]. They are technologies that alter the established behavior of utilizers. They enhance social welfare level, while minimizing the possibility of social harm [44]. Therefore, power and prosperity will shift in favor of SCs that can integrate and utilize them in an innovative manner [45].
DTs are technologies that affect market leaders, end users and the infrastructure used. The effects in these three fields are considered as three disruptive effects. It is through these effects that technologies can be compared amongst themselves in terms of disruptiveness. Technologies that affect market leaders, end users and infrastructure are characterized as the technologies with the highest disruptive effect [46]. This is a crucial point to be considered for companies and SCs so that managers can choose the right technology and make the right decisions. Prices are slightly higher than existing technologies for initial utilization. However, their price decreases as they spread to mass markets over time. They enable some activities to become easier to do. They are also adopted by customers because of these contributions [47].
DTs bring some opportunities and threats to companies and their SCs. While the use of DTs is increasing rapidly both on a local and global scale, it is necessary to evaluate the opportunities and threats presented by DTs while addressing the wide-ranging effects of 4IR [48]. These opportunities and challenges are given below in Section 2.2.

2.2. Opportunities and Challenges

There are many opportunities that DTs offer both to companies and their SCs. When DTs are successful, they lessen the market share and profits of large, settled companies in the upper segment. It takes several years for them to take over the market. The main advantages can be put in order as enabling a vying advantage [49], enhancing the success of the company in the industry in which it operates, improving processes and operations, contributing to the growth of the industry, creating new industries, improving the delivery of goods and services and ensuring the participation of the non-technologically advanced workforce [41]. Furthermore, it encourages disruptive innovations [50]. In other words, disruptive innovation takes place utilizing these technologies. Although the concepts of DT and disruptive innovation are considered synonymous by some researchers in the literature, they are different concepts [51].
In addition to the opportunities offered by DTs, they also bring some challenges for companies that utilize them and those that do not. Selection of these technology is a crucial challenge. They may consist of a combination of different technologies or may emerge as a completely new technology [52]. Determining the mix of technologies is complicated in terms of planning processes and performance targets. The technologies to be selected should be evaluated in terms of long-term profitability, low risk/return balance of long-term projects and their contribution to sustainability, and existing strategic planning and management processes during the selection of technology process [41]. Moreover, DTs are a threat to companies that do not utilize them because companies that adopt these technologies tend to replace established companies that do not adopt them [5]. For this reason, companies should follow the level of technologies that dominate the era utilized in the industries they are in and should bring themselves closer to this utilization level [53]. This is possible with a measurement instrument developed in this field.
Before DTs are implemented, they must be addressed in terms of legal aspects, liabilities, insurance and ethics [24]. Moreover, these technologies should be assessed in terms of security vulnerabilities and cyber risks before they are implemented. Cyber risks are risks that compromise the data records of customers, suppliers and employees, and lead to data breaches related to management and operations [54]. Additionally, cyber security precautions should be taken [21], as failure to do so leads to fraud, intellectual property theft, failure of information technology and infrastructure and unavailability of critical services [55].
While DTs promise significant opportunities for early and strong entry into existing and new markets, they can face resistance from customers. This resistance also brings with it the risk of failure that may be encountered during the implementation of technology. It should be adapted to the requirements of customers to utilize them [56]. Employee resistance poses a similar challenge. For this reason, the necessary cultural and mental transformation should be provided for the employees. The utilization of DTs should be made an integral part of company strategies. Budgeting appropriately for these technologies is another challenge. This requires a good analysis of the return-on-investment costs. Furthermore, it is crucial to be at the same technological maturity level with other SC members, as this situation leads to challenges in establishing a systemic infrastructure. Lastly, it is crucial to build a roadmap of the opportunities and challenges they enable, before implementing these technologies [57].

3. Materials and Methods

In this study, a five-step study was organized to measure, validate, and constitute the structure and predictability of using DTs. Study 1 focuses on item generation and purification. In Study 2, a draft questionnaire was prepared, the pilot study was conducted and the questionnaire was finalized. Initial identification of dimensionality was carried out in Study 3, while dimensionality confirmation was performed in Study 4. Convergent validity assessment was realized in Study 5. The micro view of the research process is given in Figure 1 below.
In this study, data were acquired face-to-face and by e-mail, and necessary ethics committee permissions were obtained. The sample of the study consists of the data of 47 companies for the pilot study and 426 companies for the main study. SPSS V.21 for exploratory factor analysis (EFA) and controlling of bias effect, LISREL 8.51 for confirmatory factor analysis (CFA) and relationships between variables and MS Office 365 Excel for convergent validity were used. The questionnaire was generated utilizing a five-point Likert scale ranging from 1 (I totally disagree) to 5 (I totally agree).

3.1. Study 1: Item Generation and Purification

The literature review was executed by taking into account the existing academic literature in item generation and an item pool was created considering the disruptive effects of the technologies offered by 4IR. In order to negotiate the intelligibility of the items and whether there were any missing or DTs to be added, a list of expert groups to be interviewed was determined. A total of nine experts were determined, five of whom are industry professionals working in this field, and four who are previous academicians from Turkey who continue their academic studies in this field. Professionals from the industry were selected from the companies’ digital transformation and SC departments. Academicians have continued to work as faculty members in these fields, and are experts in the fields of management information systems and SCM. The interviewed expert group list is given in the Appendix A of this study, Table A1. The interviews were conducted face-to-face or online by Zoom platform. In this way, the content validity of the study was performed with expert group interviews. The items generated are given in the Appendix A of this study, Table A2. In the next part of this study, the conclusions of the pilot study carried out before proceeding to the results of main study are given.

3.2. Study 2: Pilot Test

Pilot tests are studies that draw a roadmap for the study before starting the main study. A pilot study is suggested to handle the issue and predict the response rate and explore the feasibility of the study [58]. The sample size required for the pilot study in the literature differs according to the researchers. While it is accepted by a group of researchers that a sample with N’s between 10 and 30 is favorable in terms of simple, easy calculation and testing ability [59], it was emphasized by another group of researchers that a pilot study should be performed with a sample of 10% of the required sample in the main study [60]. In this study, a pilot test was conducted with the data of 47 different companies, the sample size of which corresponds to approximately 10% of the targeted main sample. Internal consistency and exploratory factor analyses (EFA) of alternative models were performed in the pilot test. The conclusions of reliability analysis are given in Table 1 and conclusions of subscales and factor analysis are given in Table 2 below.
KMO and Bartlett’s Test of Sphericity values are values that show how convenient the data are for factor analysis. Since the KMO values for the pilot study were above 0.60 and the Barlett’s Test value was found to be statistically significant (p < 0.05), the data were convenient for factor analysis [61,62].
When Figure 2 is examined, the eigenvalue for a single factor structure is approximately 9. Since the graph started to flatten after the second factor, it can be said that the most appropriate factor structure for the data was formed by the two-factor structure, according to the results of the pilot study. The eigenvalue for this structure is approximately 1.70. Additionally, when the structure is single factor, single factor explains 56.027% of the total variance as seen in Table 2.
Reaching the first definition of factors with structure sub-dimensions is provided by EFA [63,64]. Varimax rotation is a type of orthogonal rotation that forces factors to be uncorrelated [65,66,67]. In this study, varimax rotation was used because most of the relationships between the items were below 0.30.
According to the results of EFA, the items and their factor loadings for both the single-factor structure and the two-factor structure for the pilot study are given in Table 3 and Table 4 below. The factor loadings for the two-factor structure consist of 8 items ranged from 0.68 to 0.84, while the factor loadings for the single-factor structure consist of 16 items ranged from 0.60 to 0.87. DTs may fall under this grouping because technologies are grouped into hardware and software generally [68]. Hence, the factors are named as hardware and software in Table 3.
As a result of the pilot study, no items were removed from the item pool, but augmentative reality and virtual reality items were combined into a single item. Therefore, the number of items decreased from 16 in the pilot study to 15 in the main study. Accordingly, the item pool utilized in the main study, along with its references, is given in Table 5 below.

3.3. Study 3: Initial Identification of Dimensionality

Before the initial identification of dimensionality was made, the demographic characteristics of the 426 samples collected for the main study were examined. The results are given in Table 6 below:
EFA was performed for the initial identification of dimensionality. In this part of the study, 3 different models were tested. These are the two-factor structure obtained by removing the 3 items caused by crossloading (EFA Model 1), the structure formed by compressing the remaining 12 items into a single factor (EFA Model 2), and the 15-item structure obtained by compressing into a single factor without removing the item (EFA Model 3). Reliability analyses and factor analysis results for these 3 constructs are given in Table 7 and Table 8 below.
Varimax with Kaiser Normalization was used as the rotation method since there was not a high level of relationship between the variables in the EFAs [89].
Principal Component Analysis (PCA) is a statistical instrument utilized to extract dominant properties, that is, principal components, from a set of multivariate data, and it was utilized as a extraction method in this study [90]. Items with a factor loading below 0.60 should be excluded from the scale [91]. Since the factor loadings of 3D Printers technology was below 0.60, compression into a single factor was carried out on 14 items. Since the KMO values were above 0.70 and Bartlett’s Test of Sphericity values were statistically significant (p < 0.05), the data was convenient for factor analysis.
UDTS has 12 items and two factors with loading ranged from 0.545 to 0.775 (Table 9). UDTS has 12 items and one factor with loading ranged from 0.618 to 0.75 (Table 10). Since the factor loading value of the item (Q8) measuring the companies using 3D printers technology was below 0.60 (λ = 0.530), the remaining 14 items were excluded from the scale items and the remaining 14 items were compressed into a single factor. Factor loading values for this structure ranged from 0.611 to 0.754 (Table 11).
When Figure 3 is examined, the eigenvalue for a single factor structure is approximately 7.00. Since the graph starts to flatten after the second factor, it is possible to say that the most appropriate factor structure for the data is the two-factor structure, according to the results of EFA of the main study. The eigenvalue for this structure is approximately 1.00.

3.4. Study 4: Dimensionality Confirmation

CFA was utilized to ensure confirmation of dimensionality. Four alternative models were tested for construct validity. The first of these is Alternative Model 1, whose items and factor loading values are given in Table 9, which we reached with EFA. This model is given in Figure 4 below. The second tested alternative model is the single factor model. Question number Q8, which measures the utilization of 3D Printer technology in CFA, was excluded from the items because its factor loading was below 0.60 and analyzed the remaining 14 items. The resulting structure is given in Figure 5 together with its loadings. However, since the model fit values of this structure were not within the desired limits, the modifications suggested by the LISREL 8.51 package program were carried out and the alternative models given in Figure 6 and Figure 7 were tested. Finally, the chi-square difference test was performed for the 4 models. According to the test results, these 4 models differ from each other in a statistically significant way. The most appropriate model is Alternative Model 4, which has the lowest chi-square value among these models. The final model, Alternative Model 4, is given in Figure 7 and the fit values for these models are given in Table 12.
The existence of a relationship between the items in CFA has the effect of improving the model fit indices. However, the related items should be related in theory according to the existing literature. In Figure 4 above, Q5 and Q14, Q9 and Q11, and Q10 and Q11 are correlated in model. These relations were selected from the modification suggestions section, as they were among the relations that caused the most chi-square value decrease and based on the theoretical justification.
Big data technology requires data security [92]. Cyber security includes many different fields from information security to operational security and security of computer systems [93]. Big data analytics utilizes in cyber security [94]. Therefore, big data analytics and cyber security are related technologies, since cyber security includes data security. For this reason, Q5 and Q14 were correlated in the model. The digital twin is a technology with a virtual reality infrastructure created with simulations, which is seen as a useful tool that can be used in decision making and redesigning the system depending on the decision, supported by machine learning and artificial intelligence [95] and it can be utilized with reality technologies [96]. Therefore, Q9 and Q10 were correlated in the model. Considering the relationship between autonomous driverless vehicles and digital twin technology, for instance, by creating a digital twin of highways, autonomous vehicles can safely test different scenarios without going into traffic [97]. Therefore, Q10 and Q11 were correlated in the model. Artificial intelligence (Q3) and big data analytics (Q5) technologies were correlated with the models given in Figure 5, Figure 6 and Figure 7 below. The reason for this is the utilization of artificial intelligence and machine learning techniques in big data analytics [98].
According to the EFA and CFA results, different factor loading values were obtained for the items. The reason for this situation is that different programs are used for these two-factor analysis. Since the loadings of item Q7, which measures companies using Cloud Computing, and Q10, which measures companies using autonomous (driverless) vehicles, are below 0.60, these items were removed from the structure and retested according to the alternative model 2 loadings for CFA. In addition, taking into account the modification indices suggestions for this model, the items Q12, which measures the utilization of horizontal and vertical system integrations, and Q14, which measures the utilization of cyber security, were removed from the structure and the model was retested. As a result of the test, the structure given has been reached in Figure 6 below. In order to improve the model fit values, new modification suggestions were fulfilled and the structure was retested by removing the items Q9, which measures the using augmented reality (AR) and virtual reality (VR), and Q11, which measures the using digital twin, which cause reduction of chi-square by removing them from the model. The model obtained is given with the loadings in Figure 7.
Table 12. The Comparison of Alternative Models.
IndicesPerfect Fit Threshold Value *Acceptable Fit Range *Alternative Model 1Alternative Model 2Alternative Model 3Alternative Model 4
x2/df 1 ≤ x2/df ≤ 32 ≤ x2/df ≤ 5(122.24/50) 2.44(384.64/76) 5.061(124.21/34) 3.65(47.28/19) 2.49
RMSEA≤0.050.05 ≤ RMSEA ≤ 0.080.0580.0980.0790.059
GFI≥0.950.90 ≤ GFI ≤ 10.950.890.940.97
SRMR≤0.050.05 ≤ SRMR ≤ 0.100.0370.0540.0400.030
CFI≥0.950.90 ≤ CFI ≤ 10.960.900.950.97
NFI≥0.950.90 ≤ NFI ≤ 10.940.880.940.97
AGFI≥0.900.85 ≤ AGFI ≤ 10.930.840.910.95
* Reproduced from sources: [99,100].
Chi-square difference test was performed for the 4 alternative models. These structures are different from each other, and this difference is significant statistically. The most appropriate model is Alternative Model 4 with the lowest chi-square value statistically and this model is the final model of the scale. It is the model representing the “Using Disruptive Technology Scale (UDTS)”. As seen in Table 12 above, the final model has a perfect fit for the indices of x2/df, GFI, SRMR, CFI, NFI and AGFI. The structure has an acceptable fit in terms of the RMSEA index.
Factor loadings point out the amount of relationship between the items and the latent structure [64,101]. The item with the highest loading of the scale is Q3, which measures the utilization of Artificial Intelligence with a loading of 0.74. It is followed by Q4, which measures utilizing autonomous robots, and Q13, which measures utilizing simulation technology, with loadings of 0.70. These are standardized loading values. The item with the lowest loading of the model is Q1, which measures the utilization of cyber physical systems (CPS) with a loading of 0.61. T-values were examined for the significance of loadings. T-values of the loadings are significant because they are above 1.96 at the 0.05-significance level [101]. The relevant values are given in Table 13 below:

3.5. Study 5: Convergent Validity Assessment

Average variance extracted (AVE) and composite reliability (CR) values are considered for convergent validity [102]. Some researchers agree that both AVE and CR values should be within their expected limits. According to these limits, AVE should be 0.05 or higher to enable adequate convergent validity [100]. For CR, it is desirable that this value be close to 1.00 [103]. According to Fornell and Larcker (1981), in a case where AVE is lower than 0.50 but CR is greater than 0.60, the convergent validity of the construct is still adequate [104]. Therefore, this scale has provided convergent validity according to these conditions (AVE = 0.471; CR = 0.877). The condition for the scale to have internal consistency reliability is that the Cronbach’s Alpha value is above 0.70 [102,105,106]. Since the scale has a value above this, it has internal consistency. The relevant values are given in Table 14 below.
Discriminant validity is calculated separately for each latent variable [107]. Since the most ideal structure in this scale is a single factor structure, there is only one latent variable. Therefore, the discriminant validity could not be examined. The final form of the scale, of which whole statistical analysis results are given above, is presented in Appendix A, Table A3.

3.6. Controlling of Bias Effect

In the data obtained through the questionnaire, an issue called “bias effect” or “common method bias” may arise depending on the perception of the participants who answered the items [108]. Whether there was a response bias in the answers given by the employees was tested utilizing the MANOVA test Wilks’ Lamp statistics. Wilks’ Lamp is a widely utilized type of statistics that investigates whether groups differ in some way, regardless of whether they alter in at least one linear combination of dependent variables [107]. It expresses the ratio of error variance to total variance for each variable [108]. In this study, there is only one item containing information about the employees as seen in Table 6. This is the item of the position of the employees in the company. It was tested whether the eight DTs obtained in the final model differentiated according to the positions of the employees in the company, and it has been concluded that the answers given do not demonstrate a significant difference (p = 0.734). Consequently, the data collected within the scope of scale development does not have the bias effect. These findings are given in Table 15 below:

3.7. Relationships between Variables

The ordinal variables were taken from the variables involving the demographic characteristics of the participants given in Table 6, and the relations between the variables were examined because structural equation modeling is a type of analysis that works with categorical data [109]. First, EFA was performed for demographic variables by utilizing the PCA as extraction method and varimax rotation. The results of the analysis demonstrated that the variables of activity period, number of employees in company and annual turnover for company related to company information form a single factor structure. Since the structure obtained indicates the size of the company, this latent variable is named as CSIZE as an abbreviation of company size. The above-mentioned observed variables are named Csize1, Csize2 and Csize3 respectively. Since the variable time to use DTs emerged as a separate structure and points to the digitalization time, this latent variable was named DTIME as an abbreviation of it. The observed variable of the related factor is named Dtime1. The item numbers of the technologies obtained as a result of the developed UDTS were utilized in the model without altering. The model, in which the demographic characteristics of the participants are also reflected in the model and showing the relationships between the relevant structures, is given in Figure 8 below.
There is a low correlation between the UDT structure constituted by using DT and the CSIZE structure for company size (r = 0.11). Since the t-value of this relationship is greater than 1.96, this relationship is statistically significant (t-value = 1.97). There is low correlation between DTIME and UDT (r = 0.10), but this relationship is not statistically significant (t-value = 1.92). There is a moderate correlation between CSIZE and DTIME and this relationship is statistically significant (r = 0.37, t-value = 6.96). Therefore, it is possible to say that larger size companies have been using DTs longer than other companies. The item that best explains the company size (CSIZE) latent variable is the activity period of the company with a factor loading of 0.80. It is followed by the number of employees in the company (λ = 0.78) and company turnover (λ = 0.51). When the model fit indices of the above model are investigated, the model has perfect model fit indices in terms of whole kinds of them discussed in this study (x2/df = 77.22/51; RMSEA = 0.035; GFI = 0.97; SRMR = 0.029; CFI = 0.98; NFI = 0.96; AGFI = 0.96).

4. Discussion

The measurement is a concept that has been the subject of discussion since ancient times [110]. It is one of the most basic concepts that enables social sciences to approach natural sciences [111]. In addition, it is the first stage encountered when a study tries to break away from theoretical context and move to the empirical level. As well as the purpose for which the measurement is made, the means by which it is made is one of the indispensable elements of the measurement methods [112].
In the current era, SCs of which they are members, not businesses, compete, and DTs have effects on SCs in many aspects, especially on SC performance [113]. In addition to enhancing SC performance, DTs have a significant role in constructing more flexible, more efficient, more visible and more resilient SCs. The COVID-19 pandemic has revealed the need to reevaluate current SC approaches and restructure SCs in recent past. This restructure requirement covers enhancing the utilization of DTs [30]. For these reasons, it is extremely critical and significant to investigate the extent to which DTs are utilized, to measure the current utilization levels of these technologies, and to examine their effects on operations in SCs. In order to determine these, it is essential to first measure their level of utilization. This can only be possible with a measurement instrument developed in this field.
Many technological changes have taken place from the past to the present [114] and DTs change according to the current era [
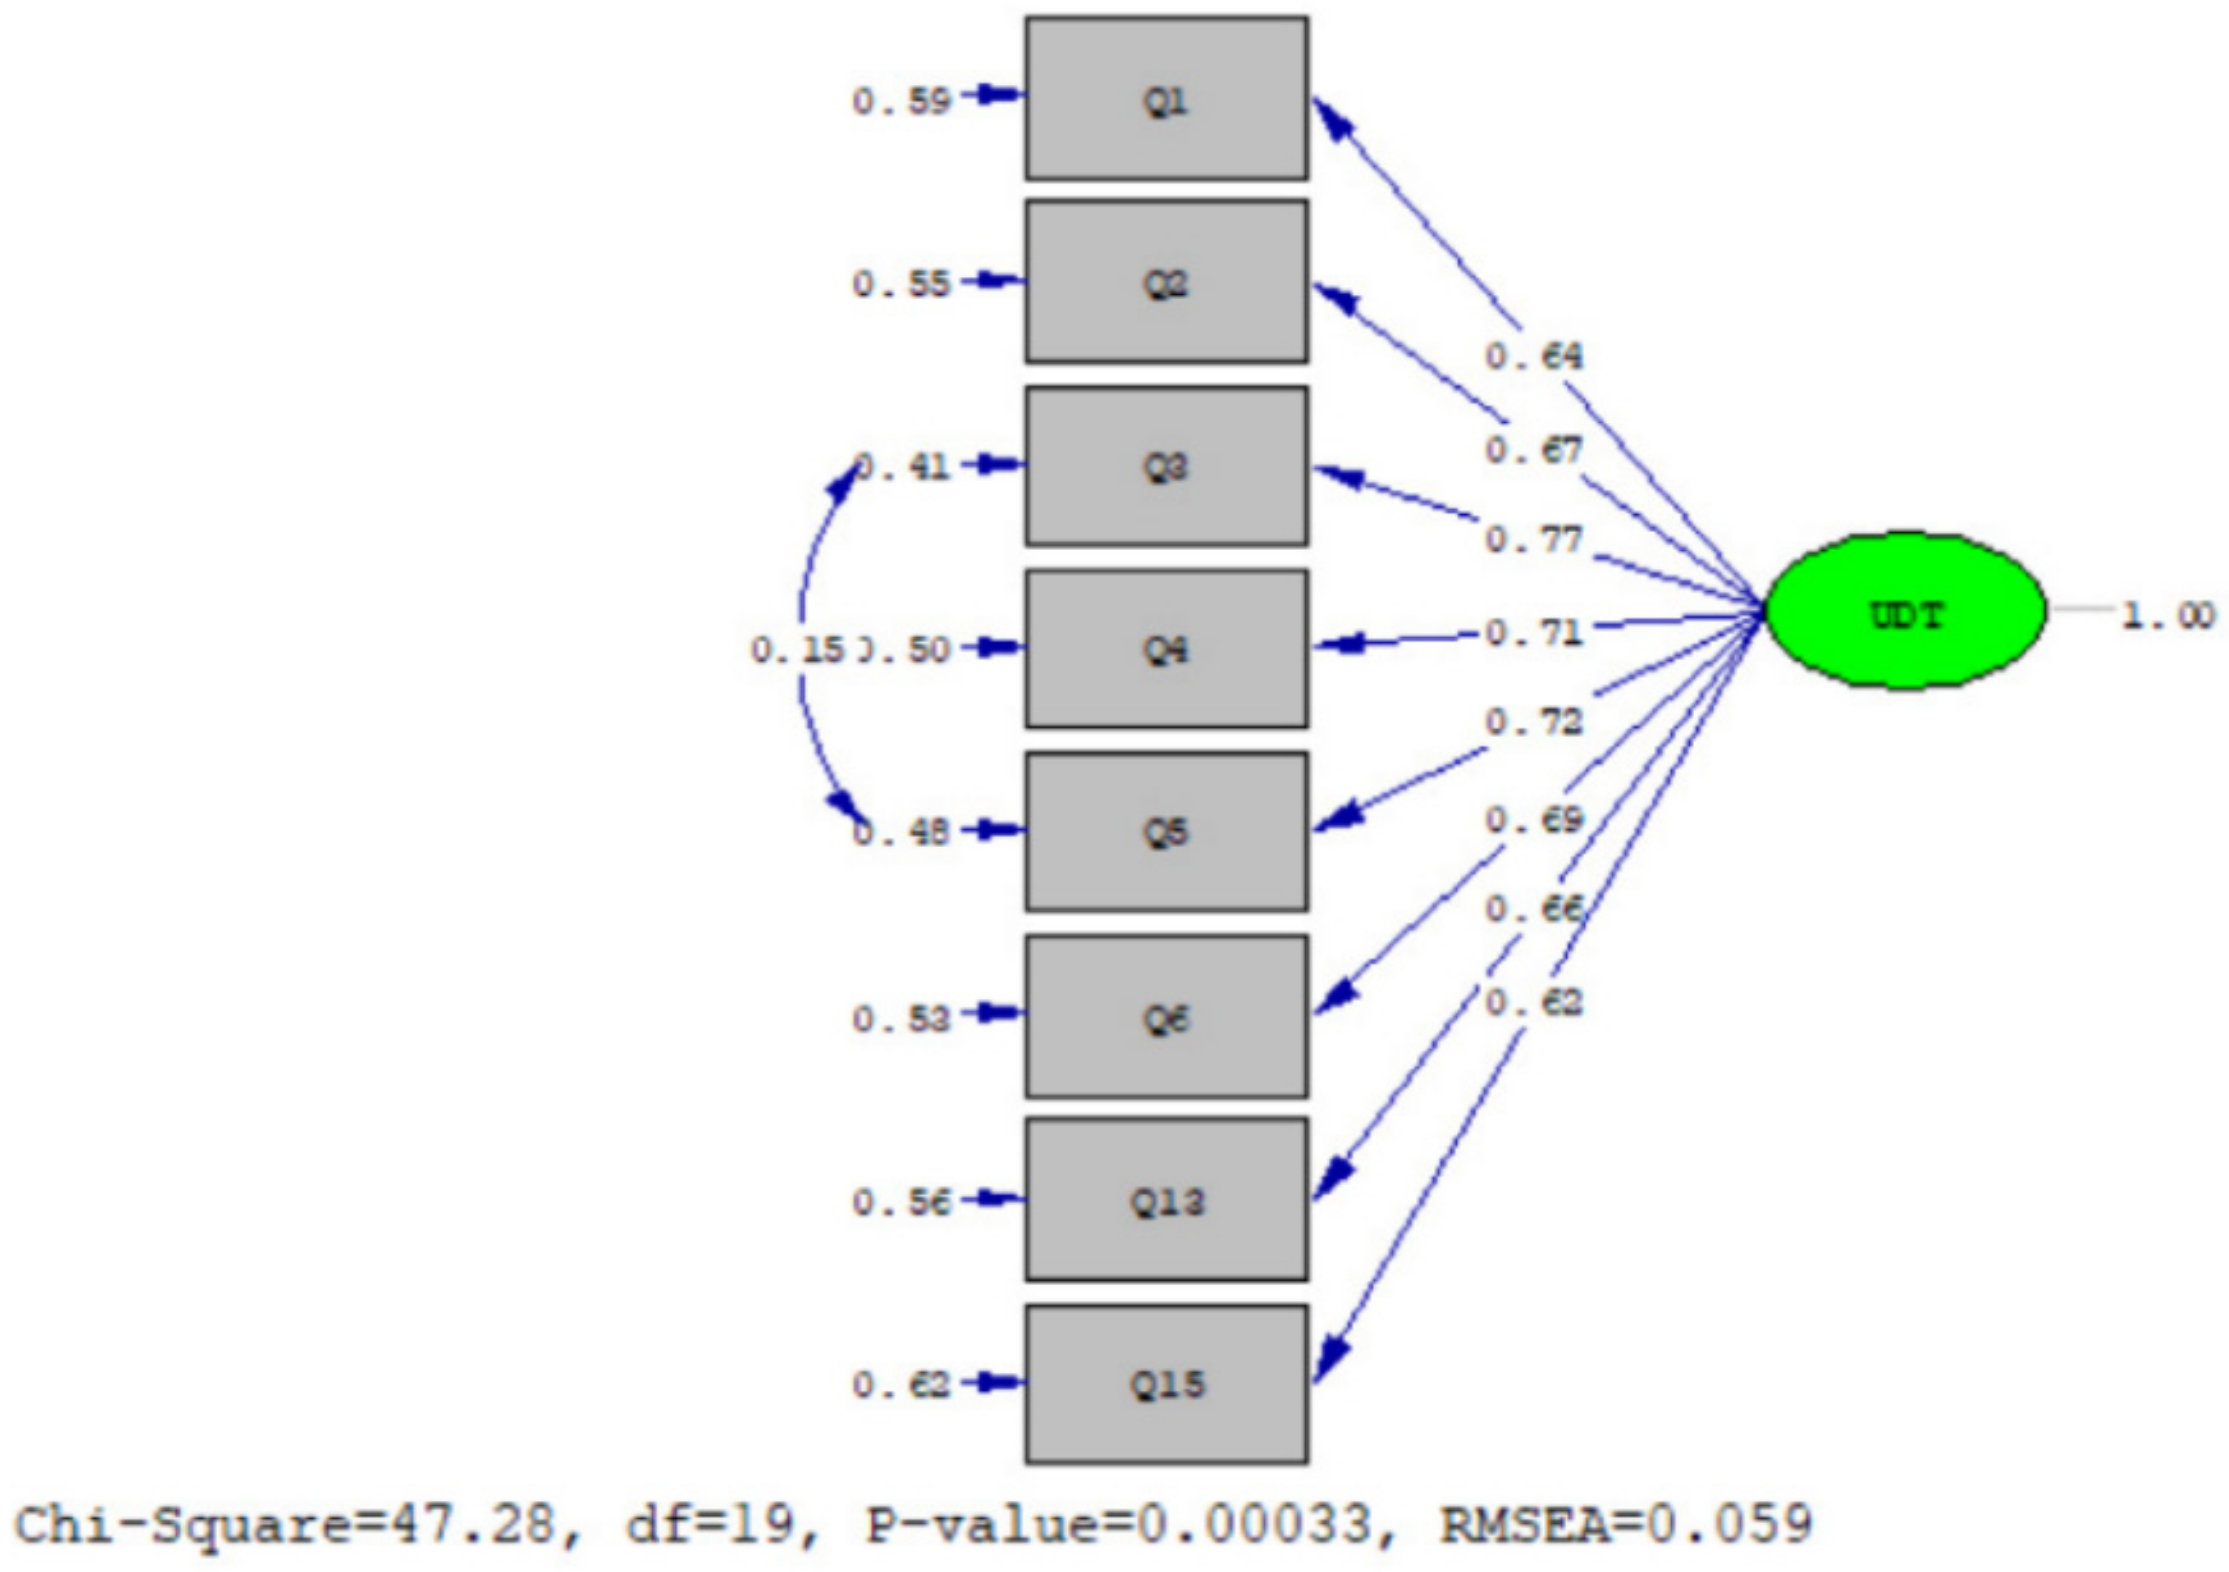
115]. In this study, 4IR technologies were taken as DTs and current DTs that are widely used in SCs were preferred. With the inductive method, we tried to obtain information about the SCs with questionnaires collected from the companies operating in different industries. The technology that best explains the single-factor structure obtained in the final model is artificial intelligence technology, with the highest factor loading (λ = 0.77). This technology is frequently discussed today and has an enhancing utilization level in SCM. It enables machines to carry out functions that require intelligence, without humans, by offering machines the intelligence of humans [116]. It is estimated that the contribution of this technology to the global economy will be USD 15 trillion by 2030 [117].
Big data analytics is the second technology that best explains the structure (λ = 0.72). Big data technology is critical in SCs. It enables in-depth information on SCs, supports right decision making, predicts SC performance and positively affects performance [118,119]. The technology with the lowest factor loading and least explaining the structure is 5G because it is a technology that has just started to spread around the world (λ = 0.72). It refers to the fifth-generation wireless technology and has only been utilized for two years [120].
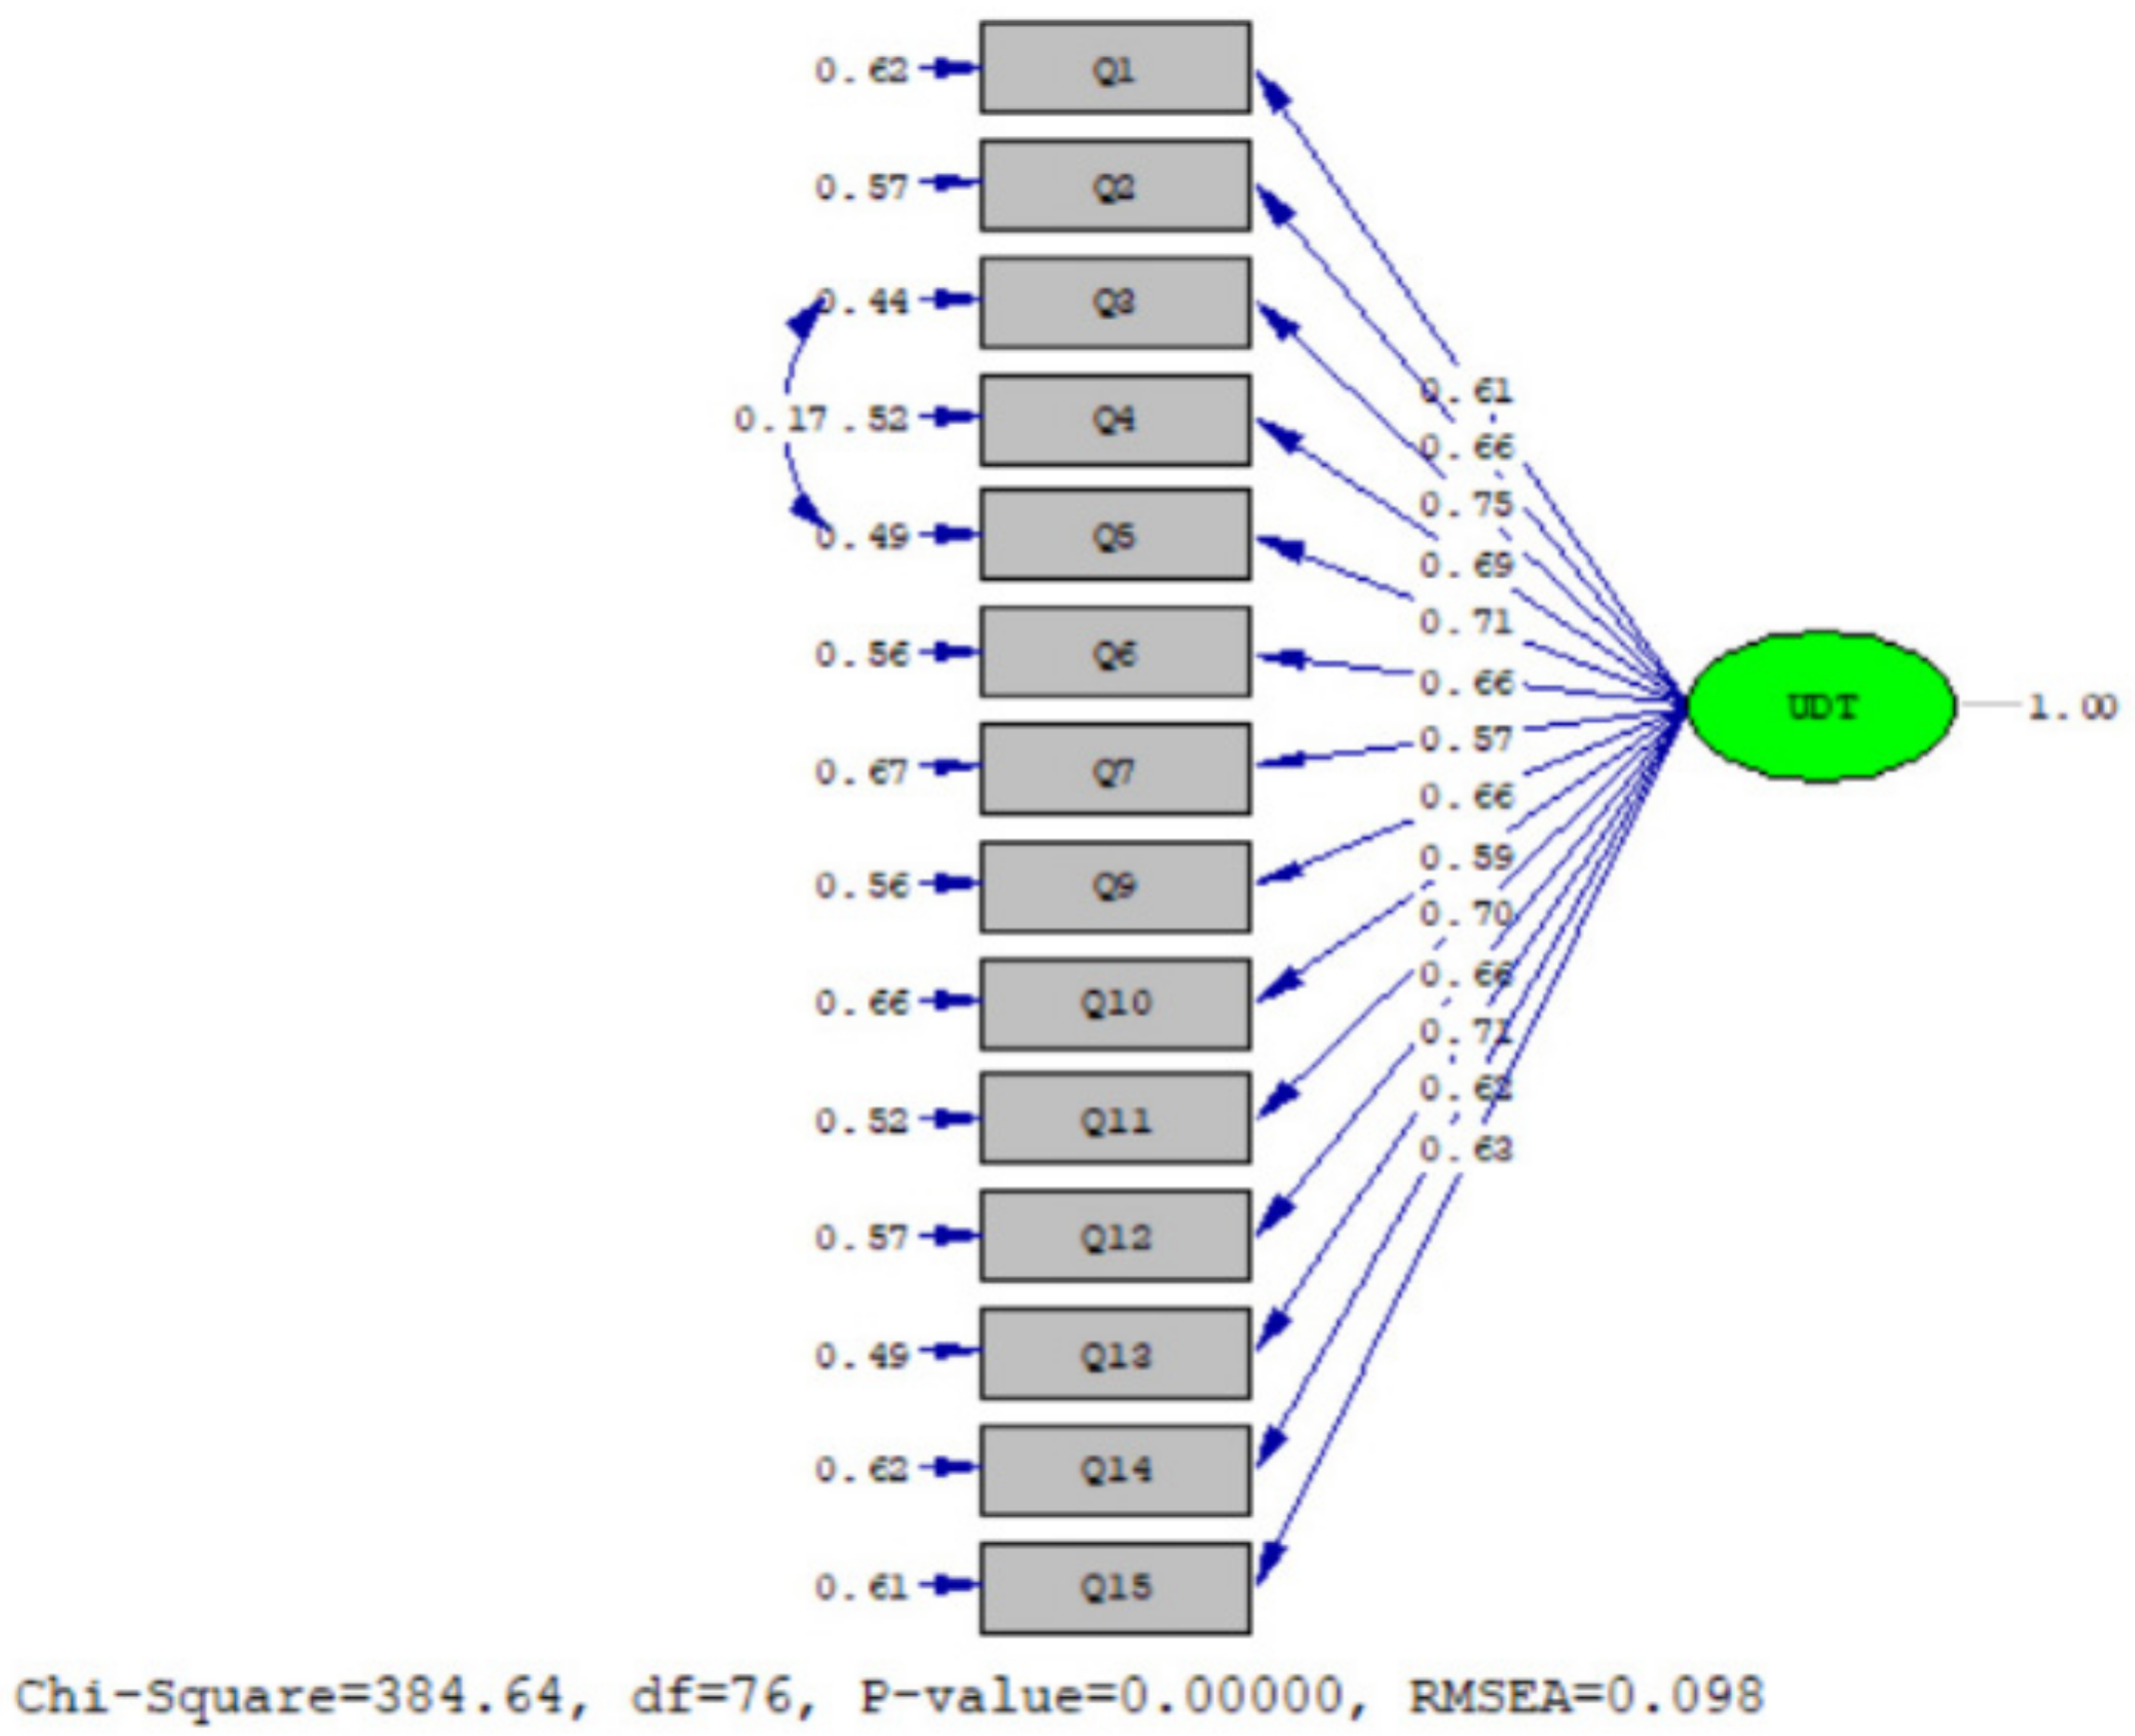
Since the scale items generated in the study focused on the level of UDT rather than agreeing with an opinion or behavior, the factor loadings obtained for the items in the study were lower than the scales in different fields. Moreover, 3D printers, a crucial technology in SCs, were excluded from the study due to their low loading (λ = 0.530). Although 3D printers are a technology that is a very high trend today and makes significant contributions to SCs, the current level of utilization of this technology is lower when it is compared with artificial intelligence and big data analytics technologies. According to a study conducted in 2020, the utilization of 3D printers will approximately triple in the next five years [121]. In other words, the loading of this technology is lower because its current utilization level is lower compared to other DTs.
The fact that the AVE value was below 0.50 in this study is due to the partially low loading values. This is due to the same reason as the utilization of 3D printer technology. Since the scale is not a measurement based on an opinion or behavior, it directly measures the level of technology use, and since companies that never use the relevant technologies answer the item as 1 (I totally disagree), it decreases the loading values of the related items. Such a strict response in items based on opinion either does not exist at whole items or is valid for very few items of the scale. It is a convergent validity value that gives results depending on the AVE factor loading values [122]. However, the scale has convergent validity when the CR value is above 0.60 according to the literature [104]. Since this scale development study is a completely new scale introduced to the SC literature, the results could not be compared with other studies.

4.1. Theoretical Contribution

The fact that a lot of study has been performed in a field so far does not mean that a new contribution cannot be made to that field. The deepest and most fundamental contribution that can be made to any field can be made in terms of measurement, because that field cannot be fully assessed when measurements cannot be made in that field [123]. Despite the enhancing emphasis on the contribution of DTs to SCM, there is a gap in enabling a measurement instrument that can evaluate their utilization. Correcting the lack of a measurement instrument developed in this field in the literature is the most crucial theoretical contribution of this study.

4.2. Managerial Implication

4IR has brought with it new DTs and digital transformation. Digital transformation is more than an essentialness; the DTs that 4IR enables are also an opportunity for countries to enhance their economic, social and environmental benefits [124]. Policy makers should engage in practices that foster the UDT and the disruptive innovation that these technologies stimulate [125].
By using the UDTS, SC managers or leaders can compare the UDT of the industries in which they operate, and with this direction they can increase their investments in the DTs in which they are behind compared to the industry. By examining the effects of DTs on SC performance, they can enhance the level of using that technology by becoming aware of which technology contributes more to SC performance. The effects of DTs on the entire SC can be examined, as well as on the basis of a specific SC operation. Improvements can be made after this study. Furthermore, UDT affects the way SC managers make strategic and operational decisions [126]. Therefore, they can measure the level of utilization of these technologies and benefit from this in their decision-making processes.

4.3. Limitations and Future Research

This study has four main limitations. First, DTs differ according to the related eras. This study deals with 4IR technologies, which are the DTs of current age. Nowadays, the concept of Industry 5.0, which is the fifth industrial revolution, has begun to be handled and discussed by many researchers [127,128,129,130,131]. However, before the fifth industrial revolution can be evaluated, it is necessary to have a good understanding of 4IR technologies and to reach the required level of technological maturity [132]. Measuring the 4IR maturity level is possible with the “Using Disruptive Technology Scale (UDTS)”. Researchers can add different technologies to these technologies and do a scale adaptation study for further research. For instance, they can benefit from this study by adding the currently very popular metaverse technology to the item pool of this study and performing a scale adaptation study in the future. In this sense, this study will form the basis of future research.
The second limitation of the study is that it is based on perception like all other studies based on questionnaire data. Whole studies in which data were collected through questionnaires suffer from the same limitation. Third, DTs are discussed in the context of the SC, and this is a constraint. The number of these technologies used can be enhanced or lessened in different contexts by specifying their theoretical justifications. It is recommended by the authors that the scale name be altered according to that context. Finally, it involves only one type of technology. In other words, this study only contains DTs utilized in the SC. It makes a profound contribution to the literature in this respect, but for researchers and managers who want to consider the technologies utilized in the SC as a whole, they can actualize a scale adaptation study by including information systems utilized in SCs such as enterprise software and enterprise resource planning (ERP) software. In this case, it would be convenient to change the name of the scale to “using supply chain technology scale”. Taking the relevant scale as a two-factor structure with information technologies and DTs factors will enable a better explanation of the structure.

5. Conclusions

SCM is the planning and coordination of whole people, processes and technology involved in constituting value. DTs have now become a part of modern SCs and make enormous contributions to them. Implementing new DTs in SCs is critical to successful SC processes. SC managers must have knowledge of these technologies and understand and know how to utilize them [133]. They must persuade managers of companies to implement these technologies or enhance their utilization level.
SC is a dynamic environment, and it has to adapt and react to the events and situations going on around it. Nowadays, there are many significant issues that SCs need to adapt to. The requirement of enhancing SC visibility and SC resilience due to the COVID-19 pandemic, and the requirement of enhancing SC sustainability performance to achieve sustainable development goals are just a few examples. DTs enable the most significant contribution to the improvement of SCs related to these issues [18,134,135,136,137]. SCs need to be improved in line with these strategic goals. Consequently, the necessity of current research in SCs is a never-ending cycle. This developed and validated scale will contribute greatly to future research and SC literature.
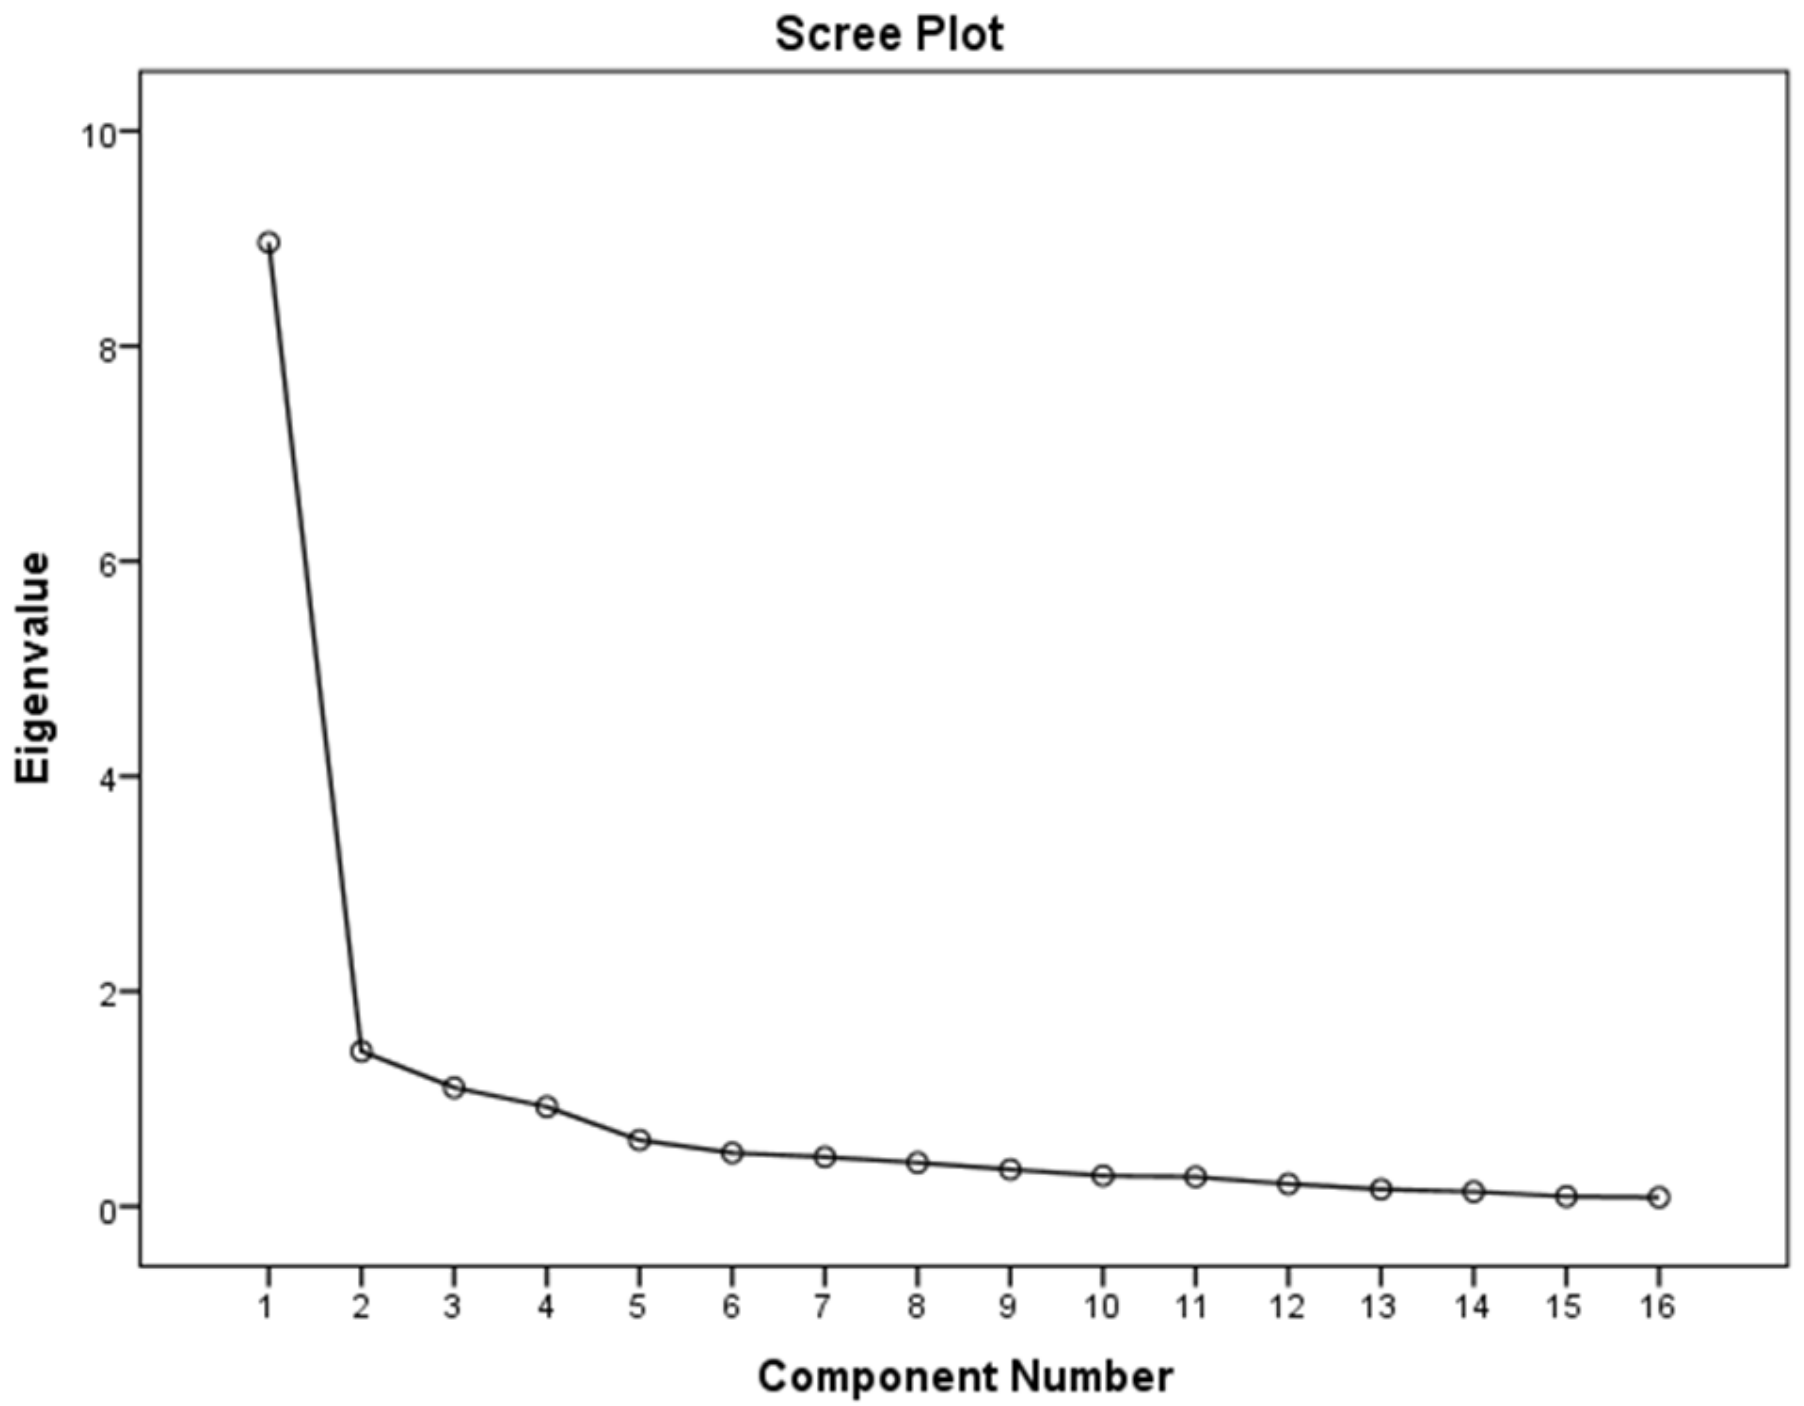
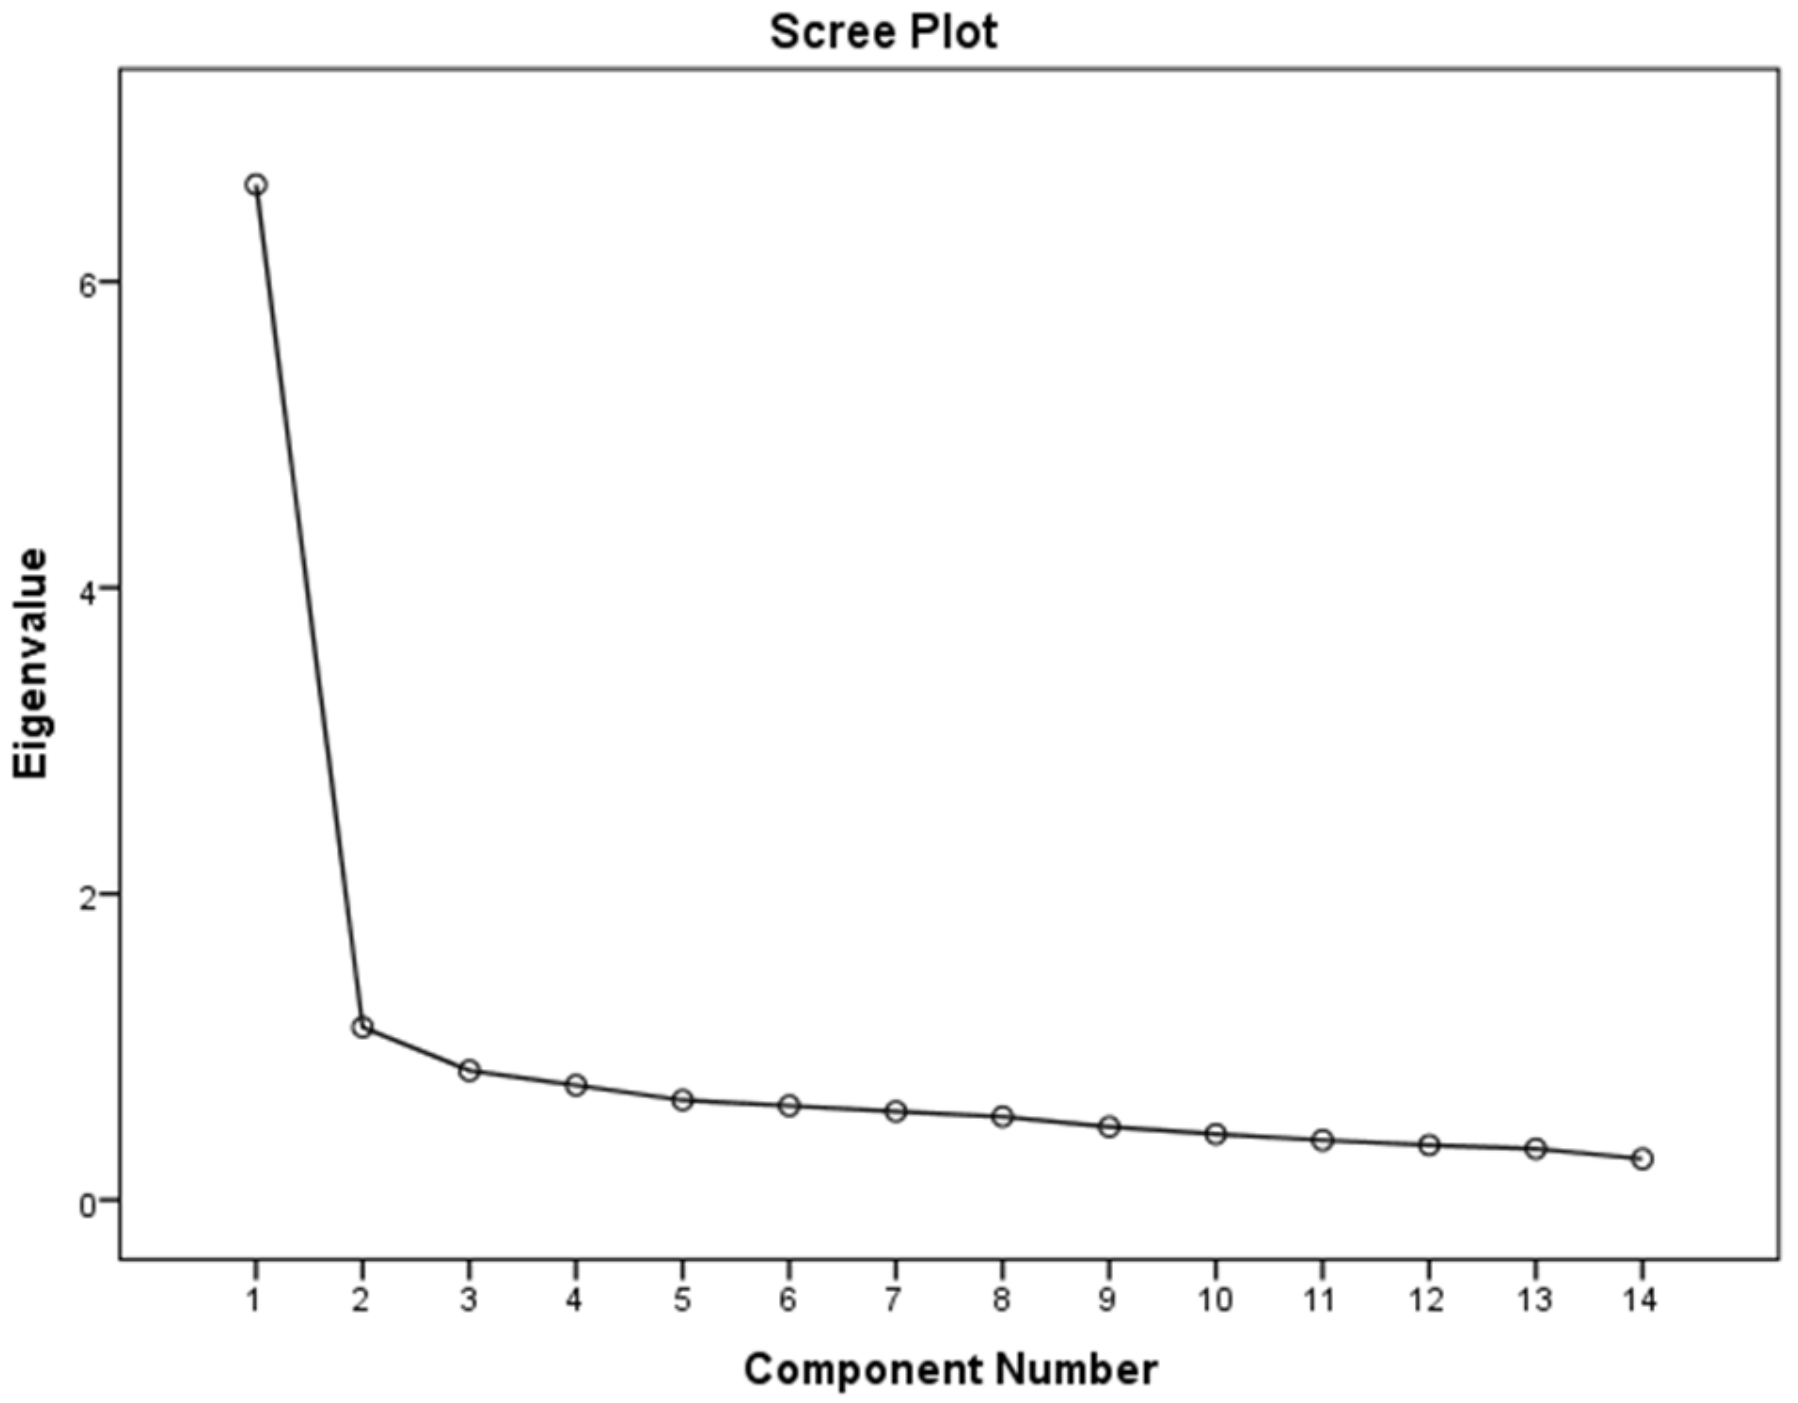
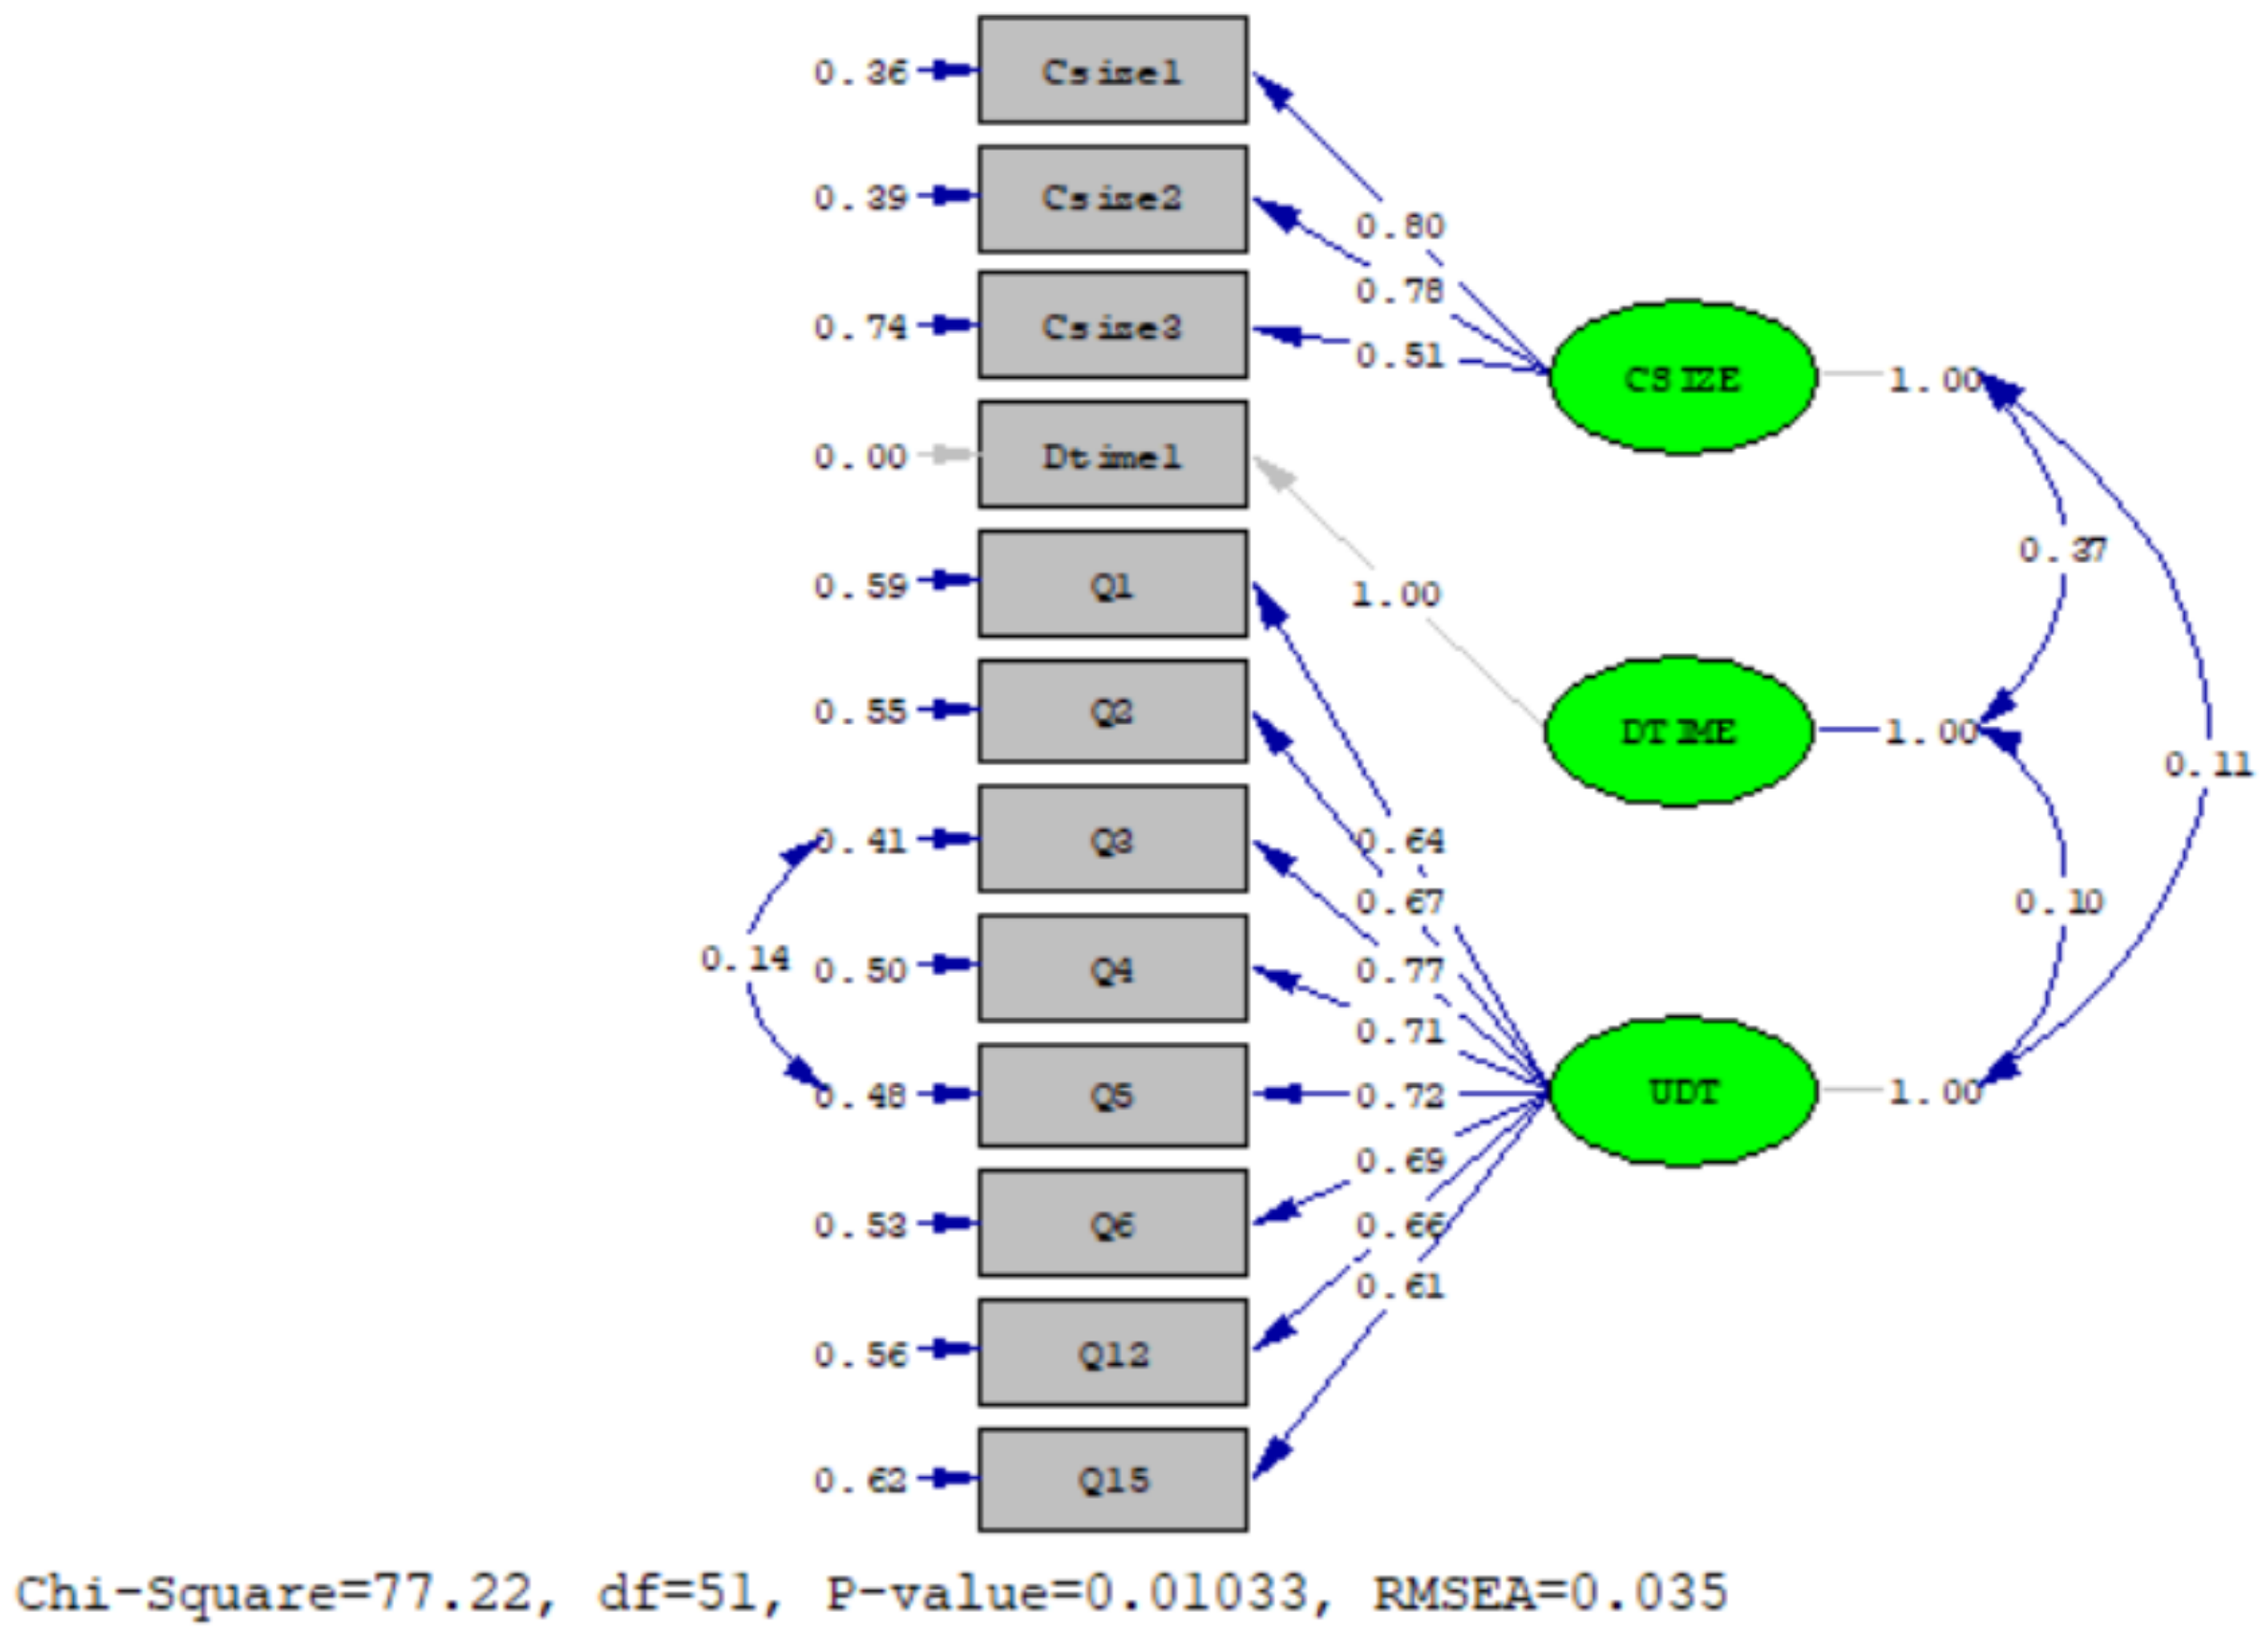
Explanatory and confirmatory factor analyzes show that the UDTS scale has only one dimension which consists of cyber-physical systems (CPS), internet of things (IoT), artificial intelligence, autonomous robots, big data analytics, blockchain, simulation and 5G technologies. The fact that 4IR technologies are gathered under a single roof in the literature confirms that the scale has a one-dimensional structure reached in line with the empirical results. Moreover, the technologies that explain this dimension as a result of the study are the technologies that are widely utilized in SCM and are confirmed by the theoretical background of the study. In both respects, the study is validated by the relevant literature with the theoretical justifications stated [7,11,18,24,26,31,72,121,135].
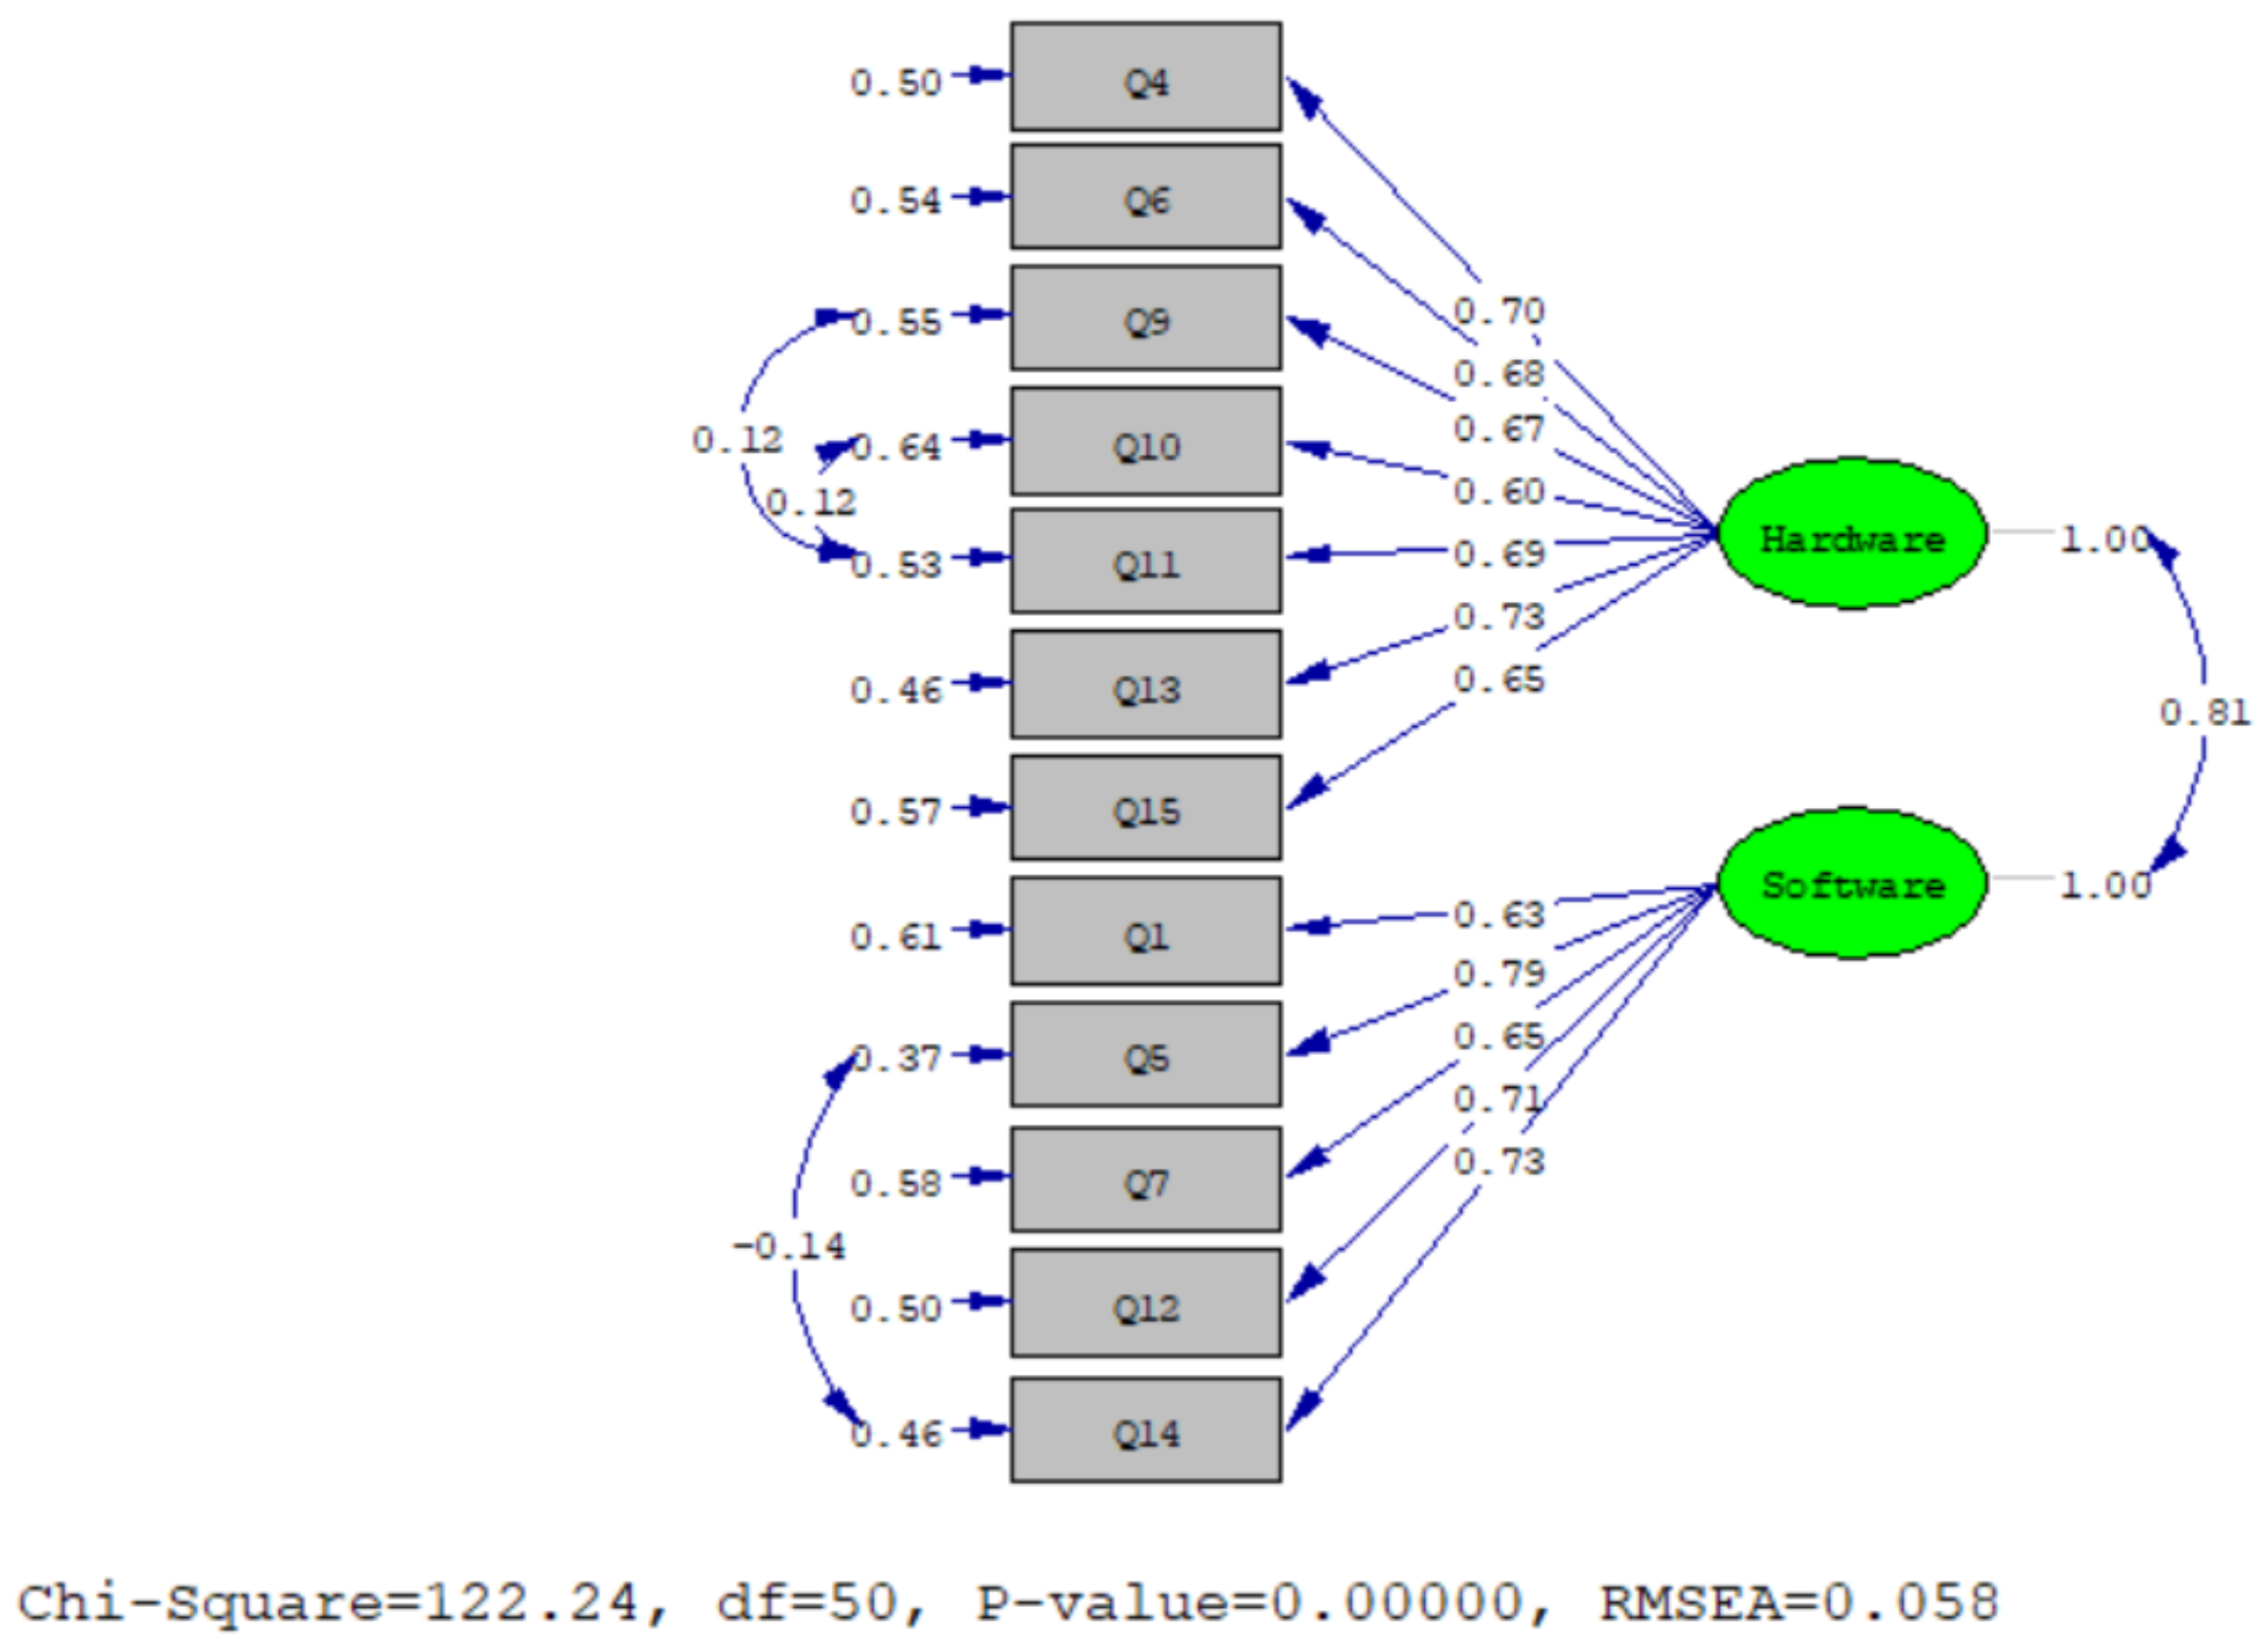
As stated above, this scale has perfect model fit values in terms of x2/df, GFI, SRMR, CFI, NFI and AGFI indices. It also has an acceptable level of model fit index value in terms of the RMSEA. The scale also has convergent validity and data that does not have the bias effect. This scale can be utilized with confidence in research in which DT will be a variable in different fields of the social sciences in its current form. In addition, it can be utilized to determine levels of UDT. Utilizing this scale, relationships and impacts can be examined throughout the SC or within its specific operations.

Author Contributions

Conceptualization, Ö.Ö.; methodology, Ö.Ö. and F.B.; software, Ö.Ö.; validation, Ö.Ö. and F.B.; formal analysis, Ö.Ö. and F.B.; investigation, Ö.Ö.; resources, Ö.Ö.; data curation, Ö.Ö. and F.B.; writing—original draft preparation, Ö.Ö. and F.B., writing—review and editing methodology, F.B.; visualization, Ö.Ö.; supervision, F.B.; project administration, F.B.; funding acquisition, Ö.Ö. All authors have read and agreed to the published version of the manuscript.

Funding

This research received no external funding.

Institutional Review Board Statement

This study was carried out with the approval of the ethics committee received from Yeditepe University Social and Human Sciences Ethics Committee (Ethics Committee Decision No. 28/2022, Date of Approval 25.03.2022).

Informed Consent Statement

Informed consent was obtained from all subjects involved in the study.

Data Availability Statement

Data can be requested from the Correspondence author when necessary.

Acknowledgments

We are grateful to the expert group that generated the item pool and ensured content validity, and to whole participating companies that constituted the sample of our study.

Conflicts of Interest

The authors declare no conflict of interest.

Abbreviations

(DTs)Disruptive Technologies
(4IR)The Fourth Industrial Revolution
(SCs)Supply Chains
(SCM)Supply Chain Management
(UDTS)Using Disruptive Technology Scale
(EFA)Exploratory Factor Analysis
(CFA)Confirmatory Factor Analysis
(UDT)Using Disruptive Technology
(CPS)Cyber Physical Systems
(IoT)Internet of Things
(AR)Augmented Reality
(VR)Virtual Reality
(AVE)Average Variance Extracted
(CR)Composite Reliability

Appendix A

Table A1. List of Expert Group.
NumberName SurnameCompany, University, Position *
Experts from Professional Life
1B. Mahir YamakoğluDoğuş Çay, Supply Chain Manager
2Utku GençMigros, Supply Chain Manager
3Bora TanyelYıldız Holding, Supply Chain Director
4Evren ErsoySiemens, Digital Transformation Specialist & Business University of Costa Rica, PhD Candidate
5Erman KeskinColgate-Palmolive, Supply Chain Leader (Africa Eurasia Region)
Experts from Academia
6Prof. Dr. Mehmet TanyaşMaltepe University, Head of Logistics Management
7Asst. Prof. Mehmet Sıtkı SaygılıBahçeşehir University, Faculty Member of Logistics Management
8Asst. Prof. Özlem SanrıYeditepe University, Faculty Member of Logistics Management
9Prof. Dr. Batuhan KocaoğluPiri Reis University, Head of Management Information Systems
* Consists of the knowledge of the expert group at the time of the interviews.
Table A2. Item Pool for the Pilot Study.
Item NumberItemReferences
1The company has used cyber physical systems (CPS) in its operations actively.[69]
2The company has used internet of things (IoT) in its operations actively.[70]
3The company has used artifical intelligence in its operations actively.[71]
4The company has used autonomous robots in its operations actively.[72]
5The company actively has used big data analitics in its operations.[73]
6The company has used blockchain technology in its operations actively.[74,75]
7The company has used cloud computing technology in its operations actively.[76]
8The company has used 3D printers (additive manufacturing) in its operations actively.[77,78]
9The company has used augmented reality (AR) in its operations actively.[79,80]
10The company has used virtual reality (VR) in its operations actively.[79,80]
11The company has used autonomous (driverless) vehicles in its operations actively.[81,82]
12The company has used digital twin technology in its operations actively.[83]
13The company has used horizontal and vertical software integrations actively.[84]
14The company has used simulation technology in its operations actively.[85,87]
15The company has used cyber security (smart networks/network security) technology in its operations actively.[84,87]
16The company has used 5G technology in its operations actively.[88]
Table A3. The Final Form of the Scale.
Using Disruptive Technology Scale (UDTS)
Item NumberItem1: I Totally Disagree2: I Disagree3: I Have No Idea4: I Agree5: I Totally Agree
1The company has used cyber physical systems (CPS) in its operations actively.
2The company has used internet of things (IoT) in its operations actively.
3The company has used artifical intelligence in its operations actively.
4The company has used autonomous robots in its operations actively.
5The company actively has used big data analitics in its operations.
6The company has used blockchain technology in its operations actively.
7The company has used simulation technology in its operations actively.
8The company has used 5G technology in its operations actively.

References

  1. McClellan, J.E.; Dorn, H. Science and Technology in World History: An Introduction; Johns Hopkins University Press: Baltimore, MD, USA, 2015; pp. 6–7. [Google Scholar]
  2. Ross, D.F.; Weston, F.S.; Stephen, W. Introduction to Supply Chain Management Technologies; CRC Press: Boca Raton, FL, USA, 2010; p. 35. [Google Scholar]
  3. Makridakis, S. The forthcoming Artificial Intelligence (AI) revolution: Its impact on society and firms. Futures 2017, 90, 46–60. [Google Scholar] [CrossRef]
  4. Lele, A. Defence and Disruptive Technologies. In Disruptive Technologies for the Militaries and Security: Smart Innovation, Systems and Technologies; Lele, A., Ed.; Springer Nature: Singapore, 2019; Volume 132, pp. 29–42. [Google Scholar] [CrossRef]
  5. Christensen, C.M. The Innovator’s Dilemma: When New Technologies Cause Great Firms to Fail; Harvard Business School Press: Boston, MA, USA, 1997. [Google Scholar]
  6. Tushman, M.L.; Anderson, P. Technological Discontinuities and Organizational Environments. In Organizational Innovation; Routledge: London, UK, 2018; pp. 345–372. [Google Scholar]
  7. Schwab, K.; Davis, N. Shaping the Future of The Fourth Industrial Revolution; Currency Books: New York, NY, USA, 2018; p. 60. [Google Scholar]
  8. Brettel, M.; Friederichsen, N.; Keller, M.; Rosenberg, M. How virtualization, decentralization and network building change the manufacturing landscape: An Industry 4.0 Perspective. Int. J. Inf. Commun. Eng. 2014, 8, 37–44. [Google Scholar]
  9. Bower, J.L.; Christensen, C.M. Disruptive technologies: Catching the wave. Harv. Bus. Rev. 1995, 43–53. [Google Scholar]
  10. Lu, Y. Industry 4.0: A survey on technologies, applications and open research issues. J. Ind. Inf. Integr. 2017, 6, 1–10. [Google Scholar] [CrossRef]
  11. Manners-Bell, J.; Lyon, K. The Logistics and Supply Chain Innovation Handbook: Disruptive Technologies and New Business Models; Kogan Page Publishers: London, UK, 2019; pp. 1–2. [Google Scholar]
  12. Hitpass, B.; Astudillo, H. Industry 4.0 challenges for business process management and electronic commerce. J. Theor. Appl. Electron. Commer. Res. 2019, 14, 1–3. [Google Scholar] [CrossRef] [Green Version]
  13. Ślusarczyk, B. Industry 4.0: Are we ready? Pol. J. Manag. Stud. 2018, 17, 232–248. [Google Scholar] [CrossRef]
  14. Schwab, K. The Global Competitiveness Report 2018; World Economic Forum: Geneva, Switzerland, 2018; p. 11. Available online: https://www3.weforum.org/docs/GCR2018/05FullReport/TheGlobalCompetitivenessReport2018.pdf (accessed on 6 July 2022).
  15. Bowersox, D.; Closs, D.; Cooper, M.B. Supply Chain Logistics Management, 3rd ed.; McGraw-Hill: New York, NY, USA, 2009; p. 6. [Google Scholar]
  16. Reid, D.R.; Sanders, N.R. Managing Supply Chain: Operation Management; John Wiley & Sons: Hoboken, NJ, USA, 2002; pp. 28–29. [Google Scholar]
  17. Shafiq, S.; Sanin, C.; Szczerbicki, E.; Toro, C. Virtual engineering object/virtual engineering process: A specialized form of cyber physical system for Industrie 4.0. Procedia Comput. Sci. 2015, 60, 1146–1155. [Google Scholar] [CrossRef] [Green Version]
  18. Luthra, S.; Mangla, S. Evaluating challenges to industry 4.0 initiatives for supply chain sustainability in emerging economies. Process Saf. Environ. Prot. 2018, 117, 168–179. [Google Scholar] [CrossRef]
  19. Frank, A.; Dalenogare, L.; Ayala, N. Industry 4.0 technologies: Implementation patterns in manufacturing companies. Int. J. Prod. Econ. 2019, 210, 15–26. [Google Scholar] [CrossRef]
  20. Immerman, G. Why Industry 4.0 Important? 2017. Available online: https://www.machinemetrics.com/blog/why-industry-4-0-is-important (accessed on 10 June 2022).
  21. Thames, L.; Schaefer, D. Industry 4.0: An overview of key benefits, technologies, and challenges. In Cybersecurity for Industry 4.0; Thames, L., Schaefer, D., Eds.; Springer: New York, NY, USA, 2017; p. 2. [Google Scholar] [CrossRef]
  22. Masood, T.; Sonntag, P. Industry 4.0: Adoption challenges and benefits for SMEs. Comput. Ind. 2020, 121, 1–11. [Google Scholar] [CrossRef]
  23. Kusiak, A. Smart manufacturing. Int. J. Prod. Res. 2017, 56, 508–517. [Google Scholar] [CrossRef]
  24. Tjahjono, B.; Esplugues, C.; Ares, E.; Pelaez, G. What does industry 4.0 mean to supply chain? Procedia Manuf. 2017, 13, 1175–1182. [Google Scholar] [CrossRef]
  25. Mrugalska, B.; Wyrwicka, M.K. Towards lean production in industry 4.0. Procedia Eng. 2017, 182, 466–473. [Google Scholar] [CrossRef]
  26. Abdelmajied, F.E.Y. Industry 4.0 and its implications: Concept, opportunities, and future directions. In Supply Chain—Recent Advances and New Perspectives in the Industry 4.0 Era; Bányai, T., Bányai, Á., Kaczmar, I., Eds.; IntechOpen: London, UK, 2022; pp. 1–24. [Google Scholar] [CrossRef]
  27. Ben-Daya, M.; Hassini, E.; Bahroun, Z. Internet of things and supply chain management: A literature review. Int. J. Prod. Res. 2017, 57, 4719–4742. [Google Scholar] [CrossRef] [Green Version]
  28. Brennan, L.; Ferdows, K.; Godsell, J.; Golini, R.; Keegan, R.; Kinkel, S.; Srai, S.J.; Taylor, M. Manufacturing in the world: Where next? Int. J. Oper. Prod. Manag. 2015, 35, 1253–1274. [Google Scholar] [CrossRef]
  29. Waller, M.A.; Fawcett, S.E. Data science, predictive analytics, and big data: A revolution that will transform supply chain design and management. J. Bus. Logist. 2013, 34, 77–84. [Google Scholar] [CrossRef]
  30. Bali, V.; Bhatnagar, V.; Sinha, S.; Johri, P. (Eds.) Disruptive Technologies for Society 5.0: Exploration of New Ideas, Techniques, and Tools; CRC Press: Boca Raton, FL, USA, 2021. [Google Scholar]
  31. Dolgui, A.; Ivanov, D. Exploring supply chain structural dynamics: New disruptive technologies and disruption risks. Int. J. Prod. Econ. 2020, 229, 107886. [Google Scholar] [CrossRef]
  32. Katsamakas, E.G.; Georgantzas, N.C. Open-Source disruptive innovation strategy. Hum. Syst. Manag. 2010, 29, 217–229. [Google Scholar] [CrossRef]
  33. Wu, M.; Tam, H.P.; Jen, T.H. Educational Measurement for Applied Researchers Theory into Practice; Springer: Singapore, 2016; p. 3. [Google Scholar]
  34. DeVellis, R.F.; Thorpe, C.T. Scale Development: Theory and Applications; Sage Publications: Thousand Oaks, CA, USA, 2021; p. 19. [Google Scholar]
  35. DeVellis, R.F. Scale Development: Theory and Applications, 3rd ed.; Sage Publications: Thousand Oaks, CA, USA, 2012; p. 11. [Google Scholar]
  36. Boudreau, M.C.; Loch, K.D.; Robey, D.; Straud, D. Going global: Using information technology to advance the competitiveness of the virtual transnational organization. Acad. Manag. Perspect. 1998, 12, 120–128. [Google Scholar] [CrossRef]
  37. McKinsey Global Institute. Disruptive Technologies: Advances That Will Transform Life, Business, and The Global Economy. Available online: https://www.mckinsey.com/~/media/mckinsey/business%20functions/mckinsey%20digital/our%20insights/disruptive%20technologies/mgi_disruptive_technologies_executive_summary_may2013.pdf (accessed on 20 July 2022).
  38. Danneels, E. Disruptive technology reconsidered: A critique and research agenda. J. Prod. Innov. Manag. 2004, 21, 246–258. [Google Scholar] [CrossRef]
  39. Scherreik, S. When a guru manages money. Bus. Week 2000, 3692, 128. [Google Scholar]
  40. Smith, T. Distruptive Technology. 2019. Available online: https://www.investopedia.com/terms/d/disruptive-technology.asp (accessed on 28 December 2019).
  41. Kostoff, R.N.; Boylan, R.; Simons, G.R. Disruptive technology roadmaps. Technol. Forecast. Soc. Change 2004, 71, 141–159. [Google Scholar] [CrossRef]
  42. Charitou, D.; Markides, C. Responses to disruptive strategic innovation. MIT Sloan Manag. Rev. 2003, 44, 55–63. [Google Scholar]
  43. Von Hippel, E. Lead users: A source of novel product concepts. Manag. Sci. 1986, 32, 791–805. [Google Scholar] [CrossRef] [Green Version]
  44. Kołacz, M.K.; Quintavalla, A.; Yalnazov, O. Who should regulate disruptive technology? Eur. J. Risk Regul. 2019, 10, 4–22. [Google Scholar] [CrossRef] [Green Version]
  45. Majumdar, D.; Banerji, P.K.; Chakrabarti, S. Disruptive technology and disruptive innovation: Ignore at your peril! Technol. Anal. Strateg. Manag. 2018, 30, 1247–1255. [Google Scholar] [CrossRef]
  46. Hardman, S.; Steinberger, R.; Horst, D. Disruptive Innovations: The Case for Hydrogen Fuel Cells and Battery Electric Vehicles. Int. J. Hydrog. Energy 2013, 38, 15438–15451. [Google Scholar] [CrossRef]
  47. Christensen, C.; Euchner, J. Managing disruption: An interview with Clayton Christensen. Res.-Technol. Manag. 2011, 54, 11–17. [Google Scholar] [CrossRef]
  48. Doorsamy, W.; Paul, B.; Marwala, T. The Disruptive Fourth Industrial Revolution; Springer: Cham, Germany, 2020; pp. 15, 54. [Google Scholar]
  49. Christensen, C.M.; Raynor, M.; Mcdonald, R. The big idea: Disruptive innovation. Harv. Bus. Rev. 2015, 33, 7–8. [Google Scholar]
  50. Sandström, C.; Magnusson, M.; Jörnmark, J. Exploring factors influencing incumbents’ response to disruptive innovation. Creat. Innov. Manag. 2009, 18, 8–15. [Google Scholar] [CrossRef]
  51. Agarwala, N. Role of policy framework for disruptive technologies in the maritime domain. Aust. J. Marit. Ocean Aff. 2022, 14, 1–20. [Google Scholar] [CrossRef]
  52. Walsh, S.; Linton, J. Infrastructure for emerging markets based on discontinuous innovations. Eng. Manag. J. 2000, 12, 23–31. [Google Scholar] [CrossRef]
  53. UNCTAD. Technology and Innovation Report 2021: Catching Technological Waves, İnovation with Equity; United Nations Publications: New York, NY, USA, 2021; Available online: https://unctad.org/system/files/official-document/tir2020_en.pdf (accessed on 2 July 2022).
  54. Boyson, S. Cyber supply chain risk management: Revolutionizing the strategic control of critical IT systems. Technovation 2014, 34, 342–353. [Google Scholar] [CrossRef]
  55. Riglietti, G.; Aguada, L. Supply Chain Resilience Report 2018, Business Continuity Institute. Available online: https://www.thebci.org/static/uploaded/c50072bf-df5c-4c98-a5e1876aafb15bd0.pdf (accessed on 10 September 2022).
  56. Walsh, S.T. Roadmapping a disruptive technology: A case study: The emerging microsystems and top-down nanosystems industry. Technol. Forecast. Soc. Change 2004, 71, 161–185. [Google Scholar] [CrossRef]
  57. Özkanlısoy, Ö.; Akkartal, E. Digital transformation in supply chains: Current applications, contributions and challenges. Bus. Manag. Stud. Int. J. 2021, 9, 32–55. [Google Scholar] [CrossRef]
  58. Johanson, G.A.; Brooks, G.P. Initial scale development: Sample size for pilot studies. Educ. Psychol. Meas. 2010, 70, 394–400. [Google Scholar] [CrossRef] [Green Version]
  59. Isaac, S.; Michael, W.B. Handbook in Research and Evaluation; Educational and Industrial Testing Services: San Diego, CA, USA, 1995; p. 101. [Google Scholar]
  60. Treece, E.W.; Treece, J.W. Elements of Research in Nursing, 3rd ed.; Mosby: St. Louis, MO, USA, 1982; p. 176. [Google Scholar]
  61. Carpenter, S. Ten steps in scale development and reporting: A guide for researchers. Commun. Methods Meas. 2018, 12, 25–44. [Google Scholar] [CrossRef]
  62. McCrosky, J.C.; Young, T.J. The use and abuse of factor analysis in communication research. Hum. Commun. Res. 1979, 5, 375–382. [Google Scholar] [CrossRef]
  63. Stevens, J.P. Applied Multivariate Statistics for the Social Sciences; Routledge: London, UK, 2012; p. 325. [Google Scholar]
  64. Tabachnick, B.G.; Fidell, L.S.; Ullman, J.B. Using Multivariate Statistics, 6th ed.; Pearson Education: Boston, MA, USA, 2015; pp. 44, 476. [Google Scholar]
  65. Borgotta, E.F.; Kercher, K.; Stull, D.E. A cautionary note on use of principal components analysis. Sociol. Methods Res. 1986, 15, 160–168. [Google Scholar] [CrossRef]
  66. Conway, J.M.; Huffcutt, A.I. A review and evaluation of exploratory factor analysis practices in organizational research. Organ. Res. Methods 2003, 6, 147–168. [Google Scholar] [CrossRef]
  67. Ford, J.K.; MacCullum, R.C.; Tait, M. The application of exploratory factor analysis in applied psychology: A critical review and analysis. Pers. Psychol. 1986, 39, 291–314. [Google Scholar] [CrossRef]
  68. Lee, K.; Park, Y.; Lee, D. Measuring efficiency and ICT ecosystem impact: Hardware vs. software industry. Telecommun. Policy 2018, 42, 107–115. [Google Scholar] [CrossRef]
  69. Frederico, G.F. Project Management for Supply Chains 4.0: A conceptual framework proposal based on PMBOK methodology. Oper. Manag. Res. 2021, 14, 434–450. [Google Scholar] [CrossRef]
  70. Goldsby, T.J.; Zinn, W. Technology innovation and new business models: Can logistics and supply chain research accelerate the evolution? J. Bus. Logist. 2016, 37, 80–81. [Google Scholar] [CrossRef]
  71. Rodríguez-Espíndola, O.; Chowdhury, S.; Beltagui, A.; Albores, P. The potential of emergent disruptive technologies for humanitarian supply chains: The integration of blockchain, Artificial Intelligence and 3D printing. Int. J. Prod. Res. 2020, 58, 4610–4630. [Google Scholar] [CrossRef]
  72. Koh, L.; Orzes, G.; Jia, F. The fourth industrial revolution (Industry 4.0): Technologies’ disruption on operations and supply chain management. Int. J. Oper. Prod. Manag. 2019, 39, 817–828. [Google Scholar] [CrossRef]
  73. Sathi, A. Big Data Analytics: Disruptive Technologies for Changing the Game, 1st ed.; Mc Press: Boise, ID, USA, 2012; p. 73. [Google Scholar]
  74. Durach, C.F.; Blesik, T.; von Düring, M.; Bick, M. Blockchain applications in supply chain transactions. J. Bus. Logist. 2021, 42, 7–24. [Google Scholar] [CrossRef] [Green Version]
  75. Wamba, S.F.; Queiroz, M.M.; Trinchera, L. Dynamics between blockchain adoption determinants and supply chain performance: An empirical investigation. Int. J. Prod. Econ. 2020, 229, 107791. [Google Scholar] [CrossRef]
  76. Wu, D.; Greer, M.J.; Rosen, D.W.; Schaefer, D. Cloud manufacturing: Strategic vision and state-of-the-art. J. Manuf. Syst. 2013, 32, 564–579. [Google Scholar] [CrossRef] [Green Version]
  77. Loy, J.; Novak, J.I.; Scerri, M.; Chowdhury, M.M.H.H.; Skellern, K. Developing transition research for disruptive technology: 3D printing innovation. In Advanced Perspectives on Global Industry Transitions and Business Opportunities; IGI Global: Derry Township, PA, USA, 2021; pp. 1–20. [Google Scholar] [CrossRef]
  78. Singh, S.; Agrawal, V. Critical success factors for new horizons in the supply chain of 3-D printed products–A review. Mater. Today Proc. 2021, 44, 1627–1634. [Google Scholar] [CrossRef]
  79. Abdel-Basset, M.; Chang, V.; Nabeeh, N.A. An intelligent framework using disruptive technologies for COVID-19 analysis. Technol. Forecast. Soc. Change 2021, 163, 1–14. [Google Scholar] [CrossRef]
  80. Huang, T.L.; Liu, B.S. Augmented reality is human-like: How the humanizing experience inspires destination brand love. Technol. Forecast. Soc. Change 2021, 170, 120853. [Google Scholar] [CrossRef]
  81. Heard, B.R.; Taiebat, M.; Xu, M.; Miller, S.A. Sustainability implications of connected and autonomous vehicles for the food supply chain. Resour. Conserv. Recycl. 2018, 128, 22–24. [Google Scholar] [CrossRef]
  82. Tsolakis, N.; Bechtsis, D.; Srai, J.S. Intelligent autonomous vehicles in digital supply chains. Bus. Process Manag. J. 2018, 181, 1–24. [Google Scholar] [CrossRef]
  83. Tao, F.; Cheng, J.; Qi, Q.; Zhang, M.; Zhang, H.; Sui, F. Digital Twin-Driven Product Design, Manufacturing and Service with Big Data. Int. J. Adv. Manuf. Technol. 2017, 94, 3563–3576. [Google Scholar] [CrossRef]
  84. Rüßmann, M.; Lorenz, M.; Gerbert, P.; Waldner, M.; Justus, J.; Engel, P.; Harnisch, M. Industry 4.0: The future of productivity and growth in manufacturing industries. Boston Consult. Group 2015, 9, 54–89. [Google Scholar]
  85. De Paula Ferreira, W.; Armellini, F.; De Santa-Eulalia, L. Simulation in industry 4.0: A state-of-the-art review. Comput. Ind. Eng. 2020, 149, 106868. [Google Scholar] [CrossRef]
  86. Hermann, M.; Pentek, T.; Otto, B. Design principles for industrie 4.0 scenarios. In Proceedings of the 2016 49th Hawaii International Conference on System Sciences (HICSS), Koloa, HI, USA, 5–8 January 2016; pp. 3928–3937. [Google Scholar]
  87. Von Solms, R.; Van Niekerk, J. From information security to cyber security. Comput. Secur. 2013, 38, 97–102. [Google Scholar] [CrossRef]
  88. Taboada, I.; Shee, H. Understanding 5G technology for future supply chain management. Int. J. Logist. Res. Appl. 2021, 24, 392–406. [Google Scholar] [CrossRef]
  89. Gerbing, D.W.; Hamilton, J.G. Viability of exploratory factor analysis as a precursor to confirmatory factor analysis. Struct. Equ. Modeling Multidiscip. J. 1996, 3, 62–72. [Google Scholar] [CrossRef]
  90. Sophian, A.; Tian, G.Y.; Taylor, D.; Rudlin, J. A feature extraction technique based on principal component analysis for pulsed Eddy current NDT. NDT e Int. 2003, 36, 37–41. [Google Scholar] [CrossRef]
  91. Worthington, R.L.; Whittaker, T.A. Scale development research: A content analysis and recommendations for best practices. Couns. Psychol. 2006, 34, 806–838. [Google Scholar] [CrossRef]
  92. Chandra, S.; Ray, S.; Goswami, R.T. Big Data Security: Survey on Frameworks and Algorithms. In Proceedings of the 2017 IEEE 7th International Advance Computing Conference (IACC), Hyderabad, India, 5–7 January 2017; pp. 48–54. [Google Scholar]
  93. O’Brien, K. Information age, terrorism and warfare. Small Wars Insur. 2003, 14, 183–206. [Google Scholar] [CrossRef]
  94. Srivastava, N.; Jaiswal, U.C. Big Data Analytics Technique in Cyber Security: A Review. In Proceedings of the 2019 3rd International Conference on Computing Methodologies and Communication (ICCMC), Erode, India, 27–29 March 2019; pp. 579–585. [Google Scholar]
  95. Mukhopadhyay, A.; Reddy, G.R.; Saluja, K.S.; Ghosh, S.; Peña-Rios, A.; Gopal, G.; Biswas, P. Virtual-reality-based digital twin of office spaces with social distance measurement feature. Virtual Real. Intell. Hardw. 2022, 4, 55–75. [Google Scholar] [CrossRef]
  96. Zhu, Z.; Liu, C.; Xu, X. Visualisation of the digital twin data in manufacturing by using augmented reality. Procedia Cirp 2019, 81, 898–903. [Google Scholar] [CrossRef]
  97. Davies, C. NVIDIA Is Mapping Earth’s Digital Twin and Your Car Could Help. Available online: https://www.slashgear.com/806714/nvidia-is-mapping-earths-digital-twin-and-your-car-could-help/?utm_campaign=clip (accessed on 17 July 2022).
  98. Najafabadi, M.M.; Villanustre, F.; Khoshgoftaar, T.M.; Seliya, N.; Wald, R.; Muharemagic, E. Deep learning applications and challenges in big data analytics. J. Big Data 2015, 2, 1. [Google Scholar] [CrossRef] [Green Version]
  99. Chen, F.; Curran, P.J.; Bollen, K.A.; Kirby, J.; Paxton, P. An empirical evaluation of the use of fixed cutoff points in RMSEA test statistic in structural equation models. Sociol. Methods Res. 2008, 36, 462–494. [Google Scholar] [CrossRef] [Green Version]
  100. Hoelter, J.W. The Analysis of Covariance Structures: Goodness-of-Fit Indices. Sociol. Methods Res. 1983, 11, 324–344. [Google Scholar] [CrossRef]
  101. Schumacker, R.E.; Lomax, R.G. A Beginner’s Guide to Structural Equation Modeling, 2nd ed.; Lawrence Erlbaum Associates: Mahwah, NJ, USA, 2004; pp. 65, 81. [Google Scholar]
  102. Hair, J.; Hult, G.T.M.; Ringle, C.; Sarstedt, M. A Primer on Partial Least Squares Structural Equation Modeling (PLS-SEM); Sage Publications: Los Angeles, CA, USA, 2014; p. 102. [Google Scholar]
  103. Nunnally, J.C.; Bernstein, I.H. Psychometric Theory, 3rd ed.; McGraw-Hill: New York, NY, USA, 1994; p. 94. [Google Scholar]
  104. Fornell, C.; Larcker, D.F. Evaluating structural equation models with unobservable variables and measurement error. J. Mark. Res. 1981, 18, 39–50. [Google Scholar] [CrossRef]
  105. Cronbach, L.J. Coefficient alpha and the internal structure of tests. Psychometrika 1951, 16, 297–334. [Google Scholar] [CrossRef] [Green Version]
  106. Field, A.P. Discovering Statistics Using SPSS, 3rd ed.; SAGE Publications: London, UK, 2009; p. 675. [Google Scholar]
  107. Hair, J.F.; Black, W.C.; Babin, B.J.; Anderson, R.E. Multivariate Data Analysis, 8th ed.; Cengage Learning: Andover, UK, 2019; pp. 636–663. [Google Scholar]
  108. Podsakoff, P.M.; MacKenzie, S.B.; Lee, J.Y.; Podsakoff, N.P. Common method biases in behavioral research: A critical review of the literature and recommended remedies. J. Appl. Psychol. 2003, 88, 879–903. [Google Scholar] [CrossRef] [PubMed]
  109. Byrne, B.M. A Primer of LISREL: Basic Applications and Programming for Confirmatory Factor Analytic Models; Springer: New York, NY, USA, 2012; p. 4. [Google Scholar]
  110. Blalock, H.M. (Ed.) Measurements in the Social Sciences: Theories and Strategies; Aldine Transaction: Piscataway, NJ, USA, 1974. [Google Scholar]
  111. Greer, S.A. The Logic of Social Inquiry; Transaction Publishers: Piscataway, NJ, USA, 1989; p. 160. [Google Scholar]
  112. Hays, W.L. Statistics for the Social Sciences, 2nd ed.; Holt, Rinehart and Winston: New York, NY, USA, 1973; p. 676. [Google Scholar]
  113. Fatorachian, H.; Kazemi, H. Impact of Industry 4.0 on supply chain performance. Prod. Plan. Control. 2021, 32, 63–81. [Google Scholar] [CrossRef]
  114. Patterson, K.A.; Grimm, C.M.; Corsi, T.M. Adopting new technologies for supply chain management. Transp. Res. Part E: Logist. Transp. Rev. 2003, 39, 95–121. [Google Scholar] [CrossRef]
  115. KPMG. The Changing Landscape of Disruptive Technologies Part 2: Innovation Convergence Unlocks New Paradigms Report. 2017, p. 19. Available online: https://assets.kpmg/content/dam/kpmg/br/pdf/2017/07/disruptive-tech-2017.pdf (accessed on 19 July 2022).
  116. Kurzweil, R. The Age of Intelligent Machines; MIT Press: Cambridge, UK, 1992. [Google Scholar]
  117. Oxford Insights. Government Artificial Intelligence. 2019. Available online: https://www.oxfordinsights.com/ai-readiness2019 (accessed on 5 October 2022).
  118. Chalmeta, R.; Barqueros-Muñoz, J.E. Using big data for sustainability in supply chain management. Sustainability 2021, 13, 7004. [Google Scholar] [CrossRef]
  119. Zadrozny, P.; Kodali, R. Big data and splunk. In Big Data Analytics Using Splunk: Deriving Operational Intelligence from Social Media, Machine Data, Existing Data Warehouses, and Other Real-Time Streaming Sources; Zadrozny, P., Kodali, R., Eds.; Apress: New York, NY, USA, 2013; pp. 1–7. [Google Scholar]
  120. Prasad, R. 5G: 2020 and Beyond; CRC Press: New York, NY, USA, 2022. [Google Scholar]
  121. Gyimah-Concepcion, M. Technology in Supply-Chain Management and Logistics: What Does the Future Hold? In Technology in Supply Chain Management and Logistics: Current Practice and Future Applications; Pagano, A., Liotine, M., Eds.; Elsevier: Cambridge, MA, USA, 2020; pp. 183–198. [Google Scholar] [CrossRef]
  122. Ghadi, I.; Alwi, N.H.; Bakar, K.A.; Talib, O. Construct Validity Examination of Critical Thinking Dispositions for Undergraduate Students in University Putra Malaysia. High. Educ. Stud. 2012, 2, 138–145. [Google Scholar] [CrossRef] [Green Version]
  123. Singh, Y.K. Fundamental of Research Methodology and Statistics; New Age International: New Delhi, India, 2006; p. 6. [Google Scholar]
  124. Rupeika-Apoga, R.; Petrovska, K.; Bule, L. The Effect of Digital Orientation and Digital Capability on Digital Transformation of SMEs during the COVID-19 Pandemic. J. Theor. Appl. Electron. Commer. Res. 2022, 17, 669–685. [Google Scholar] [CrossRef]
  125. Dymitrowski, A.; Mielcarek, P. Business model innovation based on new technologies and its influence on a company’s competitive advantage. J. Theor. Appl. Electron. Commer. Res. 2021, 16, 2110–2128. [Google Scholar] [CrossRef]
  126. Forbes Insights. Logistics 4.0: How Iot is Transforming the Supply Chain. 2018. Available online: https://www.forbes.com/sites/insights-inteliot/2018/06/14/logistics-4-0-how-iot-is-transforming-the-supply-chain/?sh=38fc9a9c880f (accessed on 21 June 2022).
  127. Javaid, M.; Haleem, A.; Singh, R.P.; Haq, M.I.U.; Raina, A.; Suman, R. Industry 5.0: Potential applications in COVID-19. J. Ind. Integr. Manag. 2020, 5, 507–530. [Google Scholar] [CrossRef]
  128. Maddikunta, P.K.R.; Pham, Q.V.; Prabadevi, B.; Deepa, N.; Dev, K.; Gadekallu, T.R.; Liyanage, M. Industry 5.0: A survey on enabling technologies and potential applications. J. Ind. Inf. Integr. 2021, 26, 100257. [Google Scholar] [CrossRef]
  129. Nahavandi, S. Industry 5.0—A human-centric solution. Sustainability 2019, 11, 4371. [Google Scholar] [CrossRef] [Green Version]
  130. Özdemir, V.; Hekim, N. Birth of industry 5.0: Making sense of big data with artificial intelligence, “the internet of things” and next-generation technology policy. Omics J. Integr. Biol. 2018, 22, 65–76. [Google Scholar] [CrossRef] [PubMed]
  131. Xu, X.; Lu, Y.; Vogel-Heuser, B.; Wang, L. Industry 4.0 and Industry 5.0—Inception, conception and perception. J. Manuf. Syst. 2021, 61, 530–535. [Google Scholar] [CrossRef]
  132. Alexa, L.; Pîslaru, M.; Avasilcăi, S. From Industry 4.0 to Industry 5.0: An Overview of European Union Enterprises. In Sustainability and Innovation in Manufacturing Enterprises. Advances in Sustainability Science and Technology; Draghici, A., Ivascu, L., Eds.; Springer: Singapore, 2022; p. 223. [Google Scholar] [CrossRef]
  133. Datta, S.; Das, S.; Bagchi, D. (Eds.) Becoming a Supply Chain Leader: Mastering and Executing the Fundamentals; Routledge: Boca Raton, FL, USA, 2021. [Google Scholar] [CrossRef]
  134. Dubey, R.; Gunasekaran, A.; Childe, S.J.; Roubaud, D.; Wamba, S.F.; Giannakis, M.; Foropon, C. Big data analytics and organizational culture as complements to swift trust and collaborative performance in the humanitarian supply chain. Int. J. Prod. Econ. 2019, 210, 120–136. [Google Scholar] [CrossRef]
  135. Ivanov, D.; Dolgui, A.; Sokolov, B. The impact of digital technology and Industry 4.0 on the ripple effect and supply chain risk analytics. Int. J. Prod. Res. 2019, 57, 829–846. [Google Scholar] [CrossRef]
  136. Ivanov, D.; Dolgui, A. Low-Certainty-Need (LCN) supply chains: A new perspective in managing disruption risks and resilience. Int. J. Prod. Res. 2019, 57, 5119–5136. [Google Scholar] [CrossRef] [Green Version]
  137. Kumar, S.; Barua, M.K. Sustainability of operations through disruptive technologies in the petroleum supply chain. Benchmarking Int. J. 2021, 29, 1640–1676. [Google Scholar] [CrossRef]
Figure 1. The micro view of research process.
Jtaer 17 00068 g001
Figure 2. Scree Plot Graph for Pilot Study.
Jtaer 17 00068 g002
Figure 3. Scree Plot Graph for Main Study.
Jtaer 17 00068 g003
Figure 4. Alternative Model 1.
Jtaer 17 00068 g004
Figure 5. Alternative Model 2.
Jtaer 17 00068 g005
Figure 6. Alternative Model 3.
Jtaer 17 00068 g006
Figure 7. Alternative Model 4 (Final Model).
Jtaer 17 00068 g007
Figure 8. Relationships between Variables.
Jtaer 17 00068 g008
Table 1. Reliability analyses results of the pilot study.
SubscalesNumber of ItemsCronbach’s Alpha (α)Inter-Item MeansScale Statistics
CorrelationCovarianceMeanVarianceStd. Deviation
UDT160.9440.5161.11746.96591302.92817.40482
UDT100.9010.4781.01630.30112.75210.61849
UDT80.8670.4520.97724.957472.0858.49029
Note: Maximum iteration: 50.
Table 2. Subscales and factor analyses results of the pilot study.
Number of ItemsNumber of FactorsKMOBartlett’s Test of SphericityExtraction Sums of Squared Loadings
Approx. Chi-SquaredfSig. (p)TotalCumulative %
16 items1 factor *0.886563.5171200.0008.96456.027
10 items **1 factor *0.892367.347273660.0006.70055.833096
8 items ***2 factors0.887311.436450.00010.23870.577
8 items ***1 factor *6.03460.340
Note: KMO: Kaiser–Meyer–Olkin, Measure of sampling adequacy. * These structures are compressed into a factor. ** These 10 items consist of blockchain, autonomous robots, 3D printers, 5G, Cloud Computing, Horizontal and Vertical System Software Integrations, Cyber Security, Big Data Analytics, simulation and virtual reality technologies. *** These 8 items consist of blockchain, autonomous robots, 3D printers, 5G, Cloud Computing, Horizontal and Vertical System Software Integrations, Cyber Security and Big Data Analytics technologies.
Table 3. Factor Loadings for Pilot Test.
Subscales (Factors) and ItemsFactor Loadings of ItemsSubscales (Factors) And ItemsFactor Loadings of Items
Hardware TechnologiesSoftware Technologies
Blockchain0.841Cloud Computing0.835
Autonomous Robots0.840Horizontal and Vertical System Software Integrations0.806
3D Printers0.830Cyber Security0.775
5G0.757Big Data Analytics0.682
Note: 8 items, 2 factors, Extraction Method: Principal Component Analysis, Rotation Method: Varimax with Kaiser Normalization. Rotation converged in 3 iterations.
Table 4. Factor Loadings for Pilot Test.
Subscales (Factors) and ItemsFactor Loadings of ItemsSubscales (Factors) and ItemsFactor Loadings of Items
Using Disruptive Technology (UDT)
Autonomous Robots0.874Augmented Reality (AR)0.722
Artificial Intelligence0.829Digital Twin0.716
Cyber Physical Systems (CPS)0.824Big Data Analytics0.711
Blockchain0.8175G0.705
Autonomous Driverless Vehicles0.812Cyber Security0.675
Internet of Things (IoT)0.810Cloud Computing0.643
Virtual Reality (VR)0.7943D Printers0.632
Simulation0.749Horizontal and Vertical System Software Integrations0.597
Note: 16 items, 1 factor, Extraction Method: Principal Component Analysis; 1 component extracted.
Table 5. Item Pool for the Main Study.
Item NumberItemReferences
Q1The company has used cyber physical systems (CPS) in its operations actively.[69]
Q2The company has used internet of things (IoT) in its operations actively.[70]
Q3The company has used artifical intelligence in its operations actively.[71]
Q4The company has used autonomous robots in its operations actively.[72]
Q5The company actively has used big data analitics in its operations.[73]
Q6The company has used blockchain technology in its operations actively.[74,75]
Q7The company has used cloud computing technology in its operations actively.[76]
Q8The company has used 3D printers (additive manufacturing) in its operations actively.[77,78]
Q9The company has used augmented reality (AR) and virtual reality (VR) in its operations actively.[79,80]
Q10The company has used autonomous (driverless) vehicles in its operations actively.[81,82]
Q11The company has used digital twin technology in its operations actively.[83]
Q12The company has used horizontal and vertical software integrations actively.[84]
Q13The company has used simulation technology in its operations actively.[85,86]
Q14The company has used cyber security (smart networks/network security) technology in its operations actively.[84,87]
Q15The company has used 5G technology in its operations actively.[88]
Table 6. Demographic characteristics of the participants.
Industry of CompanyNPercent (%)Position in CompanyNPercent (%)
Retail and FMCG7317.1Supply Chain Responsible429.9
E-Trade245.6Supply Chain Executive327.5
Transportation, Distribution, Warehousing9221.6Supply Chain Manager15035.2
Import-Export204.7Digital Transformation Responsible214.9
Manufacturing15135.4Digital Transformation Executive245.6
Service6615.5Digital Transformation Manager5112.0
Other10624.9
Total426100.0Total426100.0
Number of Employees in CompanyNPercent (%)Annual Turnover for CompanyNPercent (%)
Less than 25011827.7Less than USD 1,000,00011827.7
251–99910223.9USD 1,000,000–4,999,99910223.9
1000–19994610.8USD 5,000,000–19,999,9994610.8
2000–39994310.1USD 20,000,000–99,999,9994310.1
4000 and above11727.5USD 100,000,000 and above11727.5
Total426100.0Total426100.0
Activity Period of CompanyNPercent (%)Time to Use Disruptive TechnologiesNPercent (%)
Less than 1 year81.90–6 months6114.3
1–5 years419.66 months–1 year409.4
6–10 years4310.11 year–5 years112.6
11–15 years419.65 years and above18743.9
16–20 years296.8
20 years and above26461.9
Total426100.0Total426100.0
Field of Activity of the CompanyNPercent (%)Status of Starting Digital TransformationNPercent (%)
National7718.1Yes38991.3
International34981.9No378.7
Total426100.0Total426100.0
Working with a Digital Transformation LeaderNPercent (%)
Yes26762.7
No15937.3
Total426100.0
Table 7. Reliability analyses results.
SubscalesNumber of ItemsCronbach’s Alpha (α)Inter-Item MeansScale Statistics
CorrelationCovarianceMeanVarianceStd. Deviation
UDT120.8960.4209770.76625335.605566123.11581711.095757
UDT150.9140.4165230.75614644.465892186.09693313.641735
Table 8. Subscales and factor analyses results.
Number of ItemsNumber of FactorsKMOBartlett’s Test of SphericityExtraction Sums of Squared Loadings
Approx. Chi-SquaredfSig. (p)TotalCumulative %
12 items2 factors0.9222095.989806660.0001.12599956.458075
12 items1 factor *5.64897047.074746
14 items1 factor *0.9342877.9062031050.0006.88345.888865
* It is compressed into a single factor.
Table 9. Factor Loadings for EFA Model 1.
Subscales (Factors) and ItemsFactor Loadings of ItemsSubscales (Factors) and ItemsFactor Loadings of Items
Hardware TechnologiesSoftware Technologies
Autonomous driverless vehicles0.775Cloud computing0.755
Digital twin0.741Cyber security0.741
Augmented reality (AR), Virtual reality (VR)0.729Horizontal and vertical system software integrations0.694
Blockchain0.679Big data analytics0.677
Autonomous robots0.653Cyber physical systems (CPS)0.651
Simulation0.585
5G0.545
Note: 12 items, 2 factors.
Table 10. Factor Loadings for EFA Model 2.
ItemsFactor Loadings of ItemsItemsFactor Loadings of Items
Using Disruptive Technology (UDT)
Simulation0.750Augmented reality (AR), Virtual reality (VR)0.691
Digital twin0.7315G0.676
Big data analytics0.730Cyber security0.662
Autonomous robots0.710Autonomous driverless vehicles0.632
Blockchain0.696Cyber physical systems (CPS)0.628
Horizontal and vertical system software integrations0.693Cloud computing0.618
Note: 12 items, 1 factor.
Table 11. Factor Loadings for EFA Model 3.
ItemsFactor Loadings of ItemsItemsFactor Loadings of Items
Using Disruptive Technology (UDT)
Big data analytics0.754Augmented reality (AR), Virtual reality (VR)0.686
Artificial intelligence0.778Internet of things (IoT)0.684
Simulation0.7325G0.659
Digital twin0.720Cyber security0.641
Autonomous robots0.712Cyber physical systems (CPS)0.630
Blockchain0.699Autonomous driverless vehicles0.620
Horizontal and vertical system software integrations0.687Cloud computing0.611
Note: 14 items, 1 factor.
Table 13. Factor Loading, t-values and R2 for items.
Items/VariablesFactor Loadingst-ValuesR2
Cyber physical systems (CPS)0.6413.890.40
Internet of things (IoT)0.6714.700.44
Artifical intelligence0.7717.580.66
Autonomous robots0.7115.900.48
Big data analitics0.7216.150.60
Blockchain0.6915.220.45
Simulation0.6614.470.42
5G0.6213.230.35
Table 14. AVE, CR and Cronbach’s Alpha Values.
Items/VariablesStandardized Factor LoadingsSquare of Standardized Factor LoadingsErrorsAVECRCronbach’s Alpha (α)
Cyber physical systems (CPS)0.640.40960.59040.4710.8770.873
Internet of things (IoT)0.670.44890.5511
Artifical intelligence0.770.59290.4071
Autonomous robots0.710.50410.4959
Big data analitics0.720.51840.4816
Blockchain0.690.47610.5239
Simulation0.660.43560.5644
5G0.620.38440.6156
Table 15. Controlling of Bias Effect.
EffectValueFdf1df2pPartial Eta Squared
Wilks’ Lambda0.9180.85442,0001940.5940.7340.014
Note: Sig. value for Box’s Test of Equality of Covariance Matrices: 0.366.
Publisher’s Note: MDPI stays neutral with regard to jurisdictional claims in published maps and institutional affiliations.

